
diff options
| author | Daniel Baumann <daniel.baumann@progress-linux.org> | 2018-11-07 12:22:44 +0000 |
|---|---|---|
| committer | Daniel Baumann <daniel.baumann@progress-linux.org> | 2018-11-07 12:22:44 +0000 |
| commit | 1e6c93250172946eeb38e94a92a1fd12c9d3011e (patch) | |
| tree | 8ca5e16dfc7ad6b3bf2738ca0a48408a950f8f7e /README.md | |
| parent | Update watch file (diff) | |
| download | netdata-1e6c93250172946eeb38e94a92a1fd12c9d3011e.tar.xz netdata-1e6c93250172946eeb38e94a92a1fd12c9d3011e.zip | |
Merging upstream version 1.11.0+dfsg.
Signed-off-by: Daniel Baumann <daniel.baumann@progress-linux.org>
Diffstat (limited to 'README.md')
| -rw-r--r-- | README.md | 132 |
1 files changed, 106 insertions, 26 deletions
@@ -1,48 +1,128 @@ -# netdata [](https://travis-ci.org/firehol/netdata) [](https://www.codacy.com/app/netdata/netdata?utm_source=github.com&utm_medium=referral&utm_content=firehol/netdata&utm_campaign=Badge_Grade) [](https://codeclimate.com/github/firehol/netdata) [](https://www.gnu.org/licenses/gpl-3.0) +# netdata [](https://travis-ci.com/netdata/netdata) [](https://bestpractices.coreinfrastructure.org/projects/2231) [](https://www.gnu.org/licenses/gpl-3.0) + +[](https://codeclimate.com/github/netdata/netdata) +[](https://www.codacy.com/app/netdata/netdata?utm_source=github.com&utm_medium=referral&utm_content=netdata/netdata&utm_campaign=Badge_Grade) +[](https://lgtm.com/projects/g/netdata/netdata/context:cpp) +[](https://lgtm.com/projects/g/netdata/netdata/context:javascript) +[](https://lgtm.com/projects/g/netdata/netdata/context:python) + > *New to netdata? Here is a live demo: [http://my-netdata.io](http://my-netdata.io)* **netdata** is a system for **distributed real-time performance and health monitoring**. -It provides **unparalleled insights, in real-time**, of everything happening on the -system it runs (including applications such as web and database servers), using -**modern interactive web dashboards**. + +It provides **unparalleled insights**, **in real-time**, of everything happening on the systems it runs (including containers and applications such as web and database servers), using **modern interactive web dashboards**. + +### netdata core values + +we value |netdata... +:--------------------------:|:---- +high resolution metrics |collects all metrics **every single second** +unlimited metrics |collects **thousands of metrics** per monitored node +real-time visualization |dashboards run with **sub-second latency**, collection to visualization +powerful anomaly detection |has a **distributed watchdog** embedded in it, running on all monitored nodes +visual anomaly detection |dashboards are optimized for **spotting anomalies**, across all metrics +meaningful presentation |dashboards present **all metrics in a structured, easy to understand, way** +zero configuration |**auto-detects** all metrics and comes with dozens of alarms +resource utilization |core is **optimized C code**, using <1% utilization of single CPU core + +netdata also supports: + + - monitoring **ephemeral nodes** and **auto-scaled containers**, + - **integration** with existing monitoring infrastructure (time-series databases like `prometheus`, `graphite`, `opentsdb`) and third-party event notification methods +(like `slack`, `pagerduty`, `pushover`, and dozens more), + - building hierarchies of monitored nodes via **real-time metrics streaming** between them, + - embedding charts and dashboards on third party web sites and applications, such as [Atlassian's Confluence](https://github.com/netdata/netdata/wiki/Custom-Dashboard-with-Confluence). _netdata is **fast** and **efficient**, designed to permanently run on all systems (**physical** & **virtual** servers, **containers**, **IoT** devices), without disrupting their core function._ -netdata runs on **Linux**, **FreeBSD**, and **MacOS**. +netdata currently runs on **Linux**, **FreeBSD**, and **MacOS**. [](https://twitter.com/linuxnetdata) -[]() +[]() --- ## User base *Docker pulls*<br/> -[](https://hub.docker.com/r/titpetric/netdata/) [](https://hub.docker.com/r/firehol/netdata/) +[](https://hub.docker.com/r/netdata/netdata/) +[](https://hub.docker.com/r/firehol/netdata/) +[](https://hub.docker.com/r/titpetric/netdata/) -*Since May 16th 2016 (the date the [global public netdata registry](https://github.com/firehol/netdata/wiki/mynetdata-menu-item) was released):*<br/> -[](https://registry.my-netdata.io/#menu_netdata_submenu_registry) [](https://registry.my-netdata.io/#menu_netdata_submenu_registry) [](https://registry.my-netdata.io/#menu_netdata_submenu_registry) +*Since May 16th 2016 (the date the [global public netdata registry](https://github.com/netdata/netdata/wiki/mynetdata-menu-item) was released):*<br/> +[](https://registry.my-netdata.io/#menu_netdata_submenu_registry) +[](https://registry.my-netdata.io/#menu_netdata_submenu_registry) +[](https://registry.my-netdata.io/#menu_netdata_submenu_registry) *in the last 24 hours:*<br/> -[](https://registry.my-netdata.io/#menu_netdata_submenu_registry) [](https://registry.my-netdata.io/#menu_netdata_submenu_registry) [](https://registry.my-netdata.io/#menu_netdata_submenu_registry) +[](https://registry.my-netdata.io/#menu_netdata_submenu_registry) +[](https://registry.my-netdata.io/#menu_netdata_submenu_registry) +[](https://registry.my-netdata.io/#menu_netdata_submenu_registry) --- ## News -`Dec 17th, 2017` - **[netdata v1.9.0 released!](https://github.com/firehol/netdata/releases)** +`Sep 18, 2018` - **netdata has its own organization** + +Netdata used to be a [firehol.org](https://firehol.org) project, accessible as `firehol/netdata`. + +Netdata now has its own github organization `netdata`, so all github URLs are now `netdata/netdata`. The old github URLs, repo clones, forks, etc redirect automatically to the new repo. + +--- + + + +`Jun 16, 2018` - **netdata in CNCF** -A big release: +Netdata is now at the [Cloud Native Computing Foundation (CNCF) landscape](https://landscape.cncf.io/grouping=no&sort=stars). + +Read the [netdata presentation](https://docs.google.com/presentation/d/18C8bCTbtgKDWqPa57GXIjB2PbjjpjsUNkLtZEz6YK8s/edit?usp=sharing) we gave at CNCF TOC on Sep 18, 2018. + +--- - - dashboard snapshots, for loading / saving selected time-frames - - highlighted time-frames across all charts of the dashboard - - IP access lists for filtering access to netdata - - enhanced VMs and containers monitoring - - auto-scaling of chart units - - timezone conversion at the dashboard to allow comparing charts with server logs - - python.d.plugin rewritten - - dozens of more improvements, enhancements, features and compatibility fixes +`Mar 27th, 2018` - **[netdata v1.10.0 released!](https://github.com/netdata/netdata/releases)** + + - new web server, a lot faster and more secure + - updated all javascript libraries to their latest versions (fixed compatibility issues - now netdata chart can now be embedded on **Atlassian Confluence** pages and remain fully interactive!) + - new plugins: + - **BTRFS** (visualize BTRFS allocation with alarms) + - **bcache** (monitor hybrid setups HDD + SSD) + - **ceph** + - **nginx plus** + - **libreswan** (monitor the traffic of IPSEC tunnels) + - **traefik** + - **icecast** + - **ntpd** + - **httpcheck** (monitor any remote web server) + - **portcheck** (monitor any remote TCP port) + - **spring-boot** (monitor java spring-boot apps) + - **dnsdist** + - **Linux hugepages** + - improved plugins: + - **statsd** + - **web_log** + - **cgroups** for containers and VMs monitoring (netdata now supports **systemd-nspawn** and **kubernetes** - fixed security issue with `cgroup-network`) + - **Linux memory** + - **diskspace** + - **network interfaces** + - **postgres** + - **rabbitmq** + - **apps.plugin** (now it also tracks swap usage per process) + - **haproxy** + - **uptime** + - **ksm** (kernel memory debupper) + - **mdstat** (software raid) + - **elasticsearch** + - **apcupsd** + - **dhcpd** + - **fronius** + - **stiebeletron** + - new alarm notification methods + - **alerta** + - **IRC** (post on IRC channels) + - and dozens more improvements, enhancements, features and compatibility fixes --- @@ -285,7 +365,7 @@ This is a list of what it currently monitors: global and per tube monitoring - **statsd**<br/> - [netdata is a fully featured statsd server](https://github.com/firehol/netdata/wiki/statsd) + [netdata is a fully featured statsd server](https://github.com/netdata/netdata/wiki/statsd) - **ceph**<br/> OSD usage, Pool usage, number of objects, etc. @@ -299,13 +379,13 @@ And you can extend it, by writing plugins that collect data from any source, usi This is a high level overview of netdata feature set and architecture. Click it to to interact with it (it has direct links to documentation). -[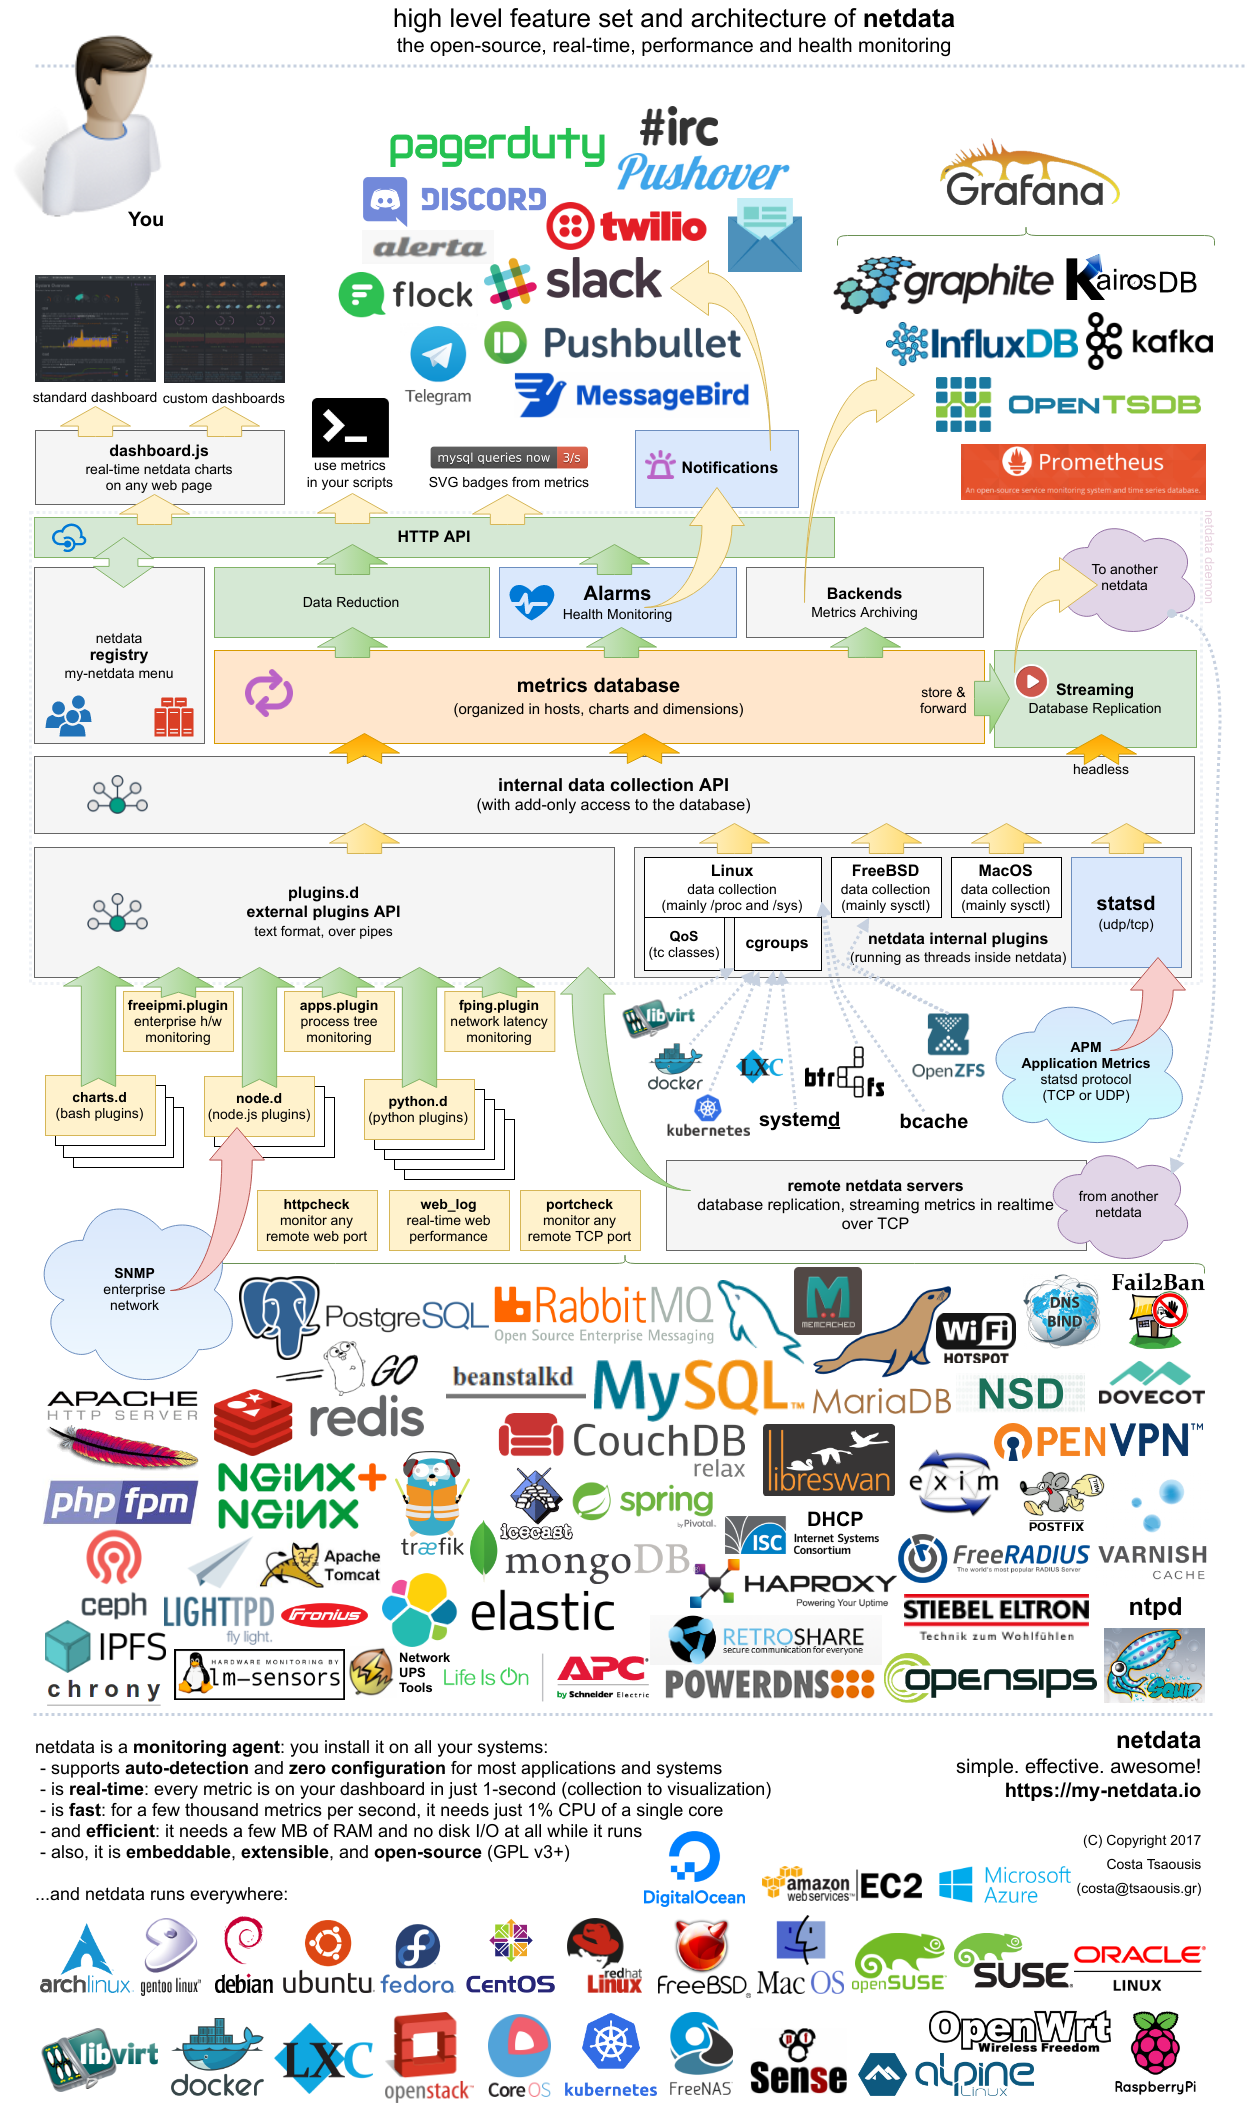](https://my-netdata.io/infographic.html) +[](https://my-netdata.io/infographic.html) --- ## Installation -Use our **[automatic installer](https://github.com/firehol/netdata/wiki/Installation)** to build and install it on your system. +Use our **[automatic installer](https://github.com/netdata/netdata/wiki/Installation)** to build and install it on your system. It should run on **any Linux** system (including IoT). It has been tested on: @@ -325,17 +405,17 @@ It should run on **any Linux** system (including IoT). It has been tested on: ## Interaction with netdata -After installation, you can interact with netdata using **[CLI](https://github.com/firehol/netdata/wiki/Command-Line-Options)** and web dashboards. +After installation, you can interact with netdata using **[CLI](https://github.com/netdata/netdata/wiki/Command-Line-Options)** and web dashboards. The default port of dashboard is 19999. To access the web dashboard on localhost, use: http://localhost:19999 --- ## Documentation -Check the **[netdata wiki](https://github.com/firehol/netdata/wiki)**. +Check the **[netdata wiki](https://github.com/netdata/netdata/wiki)**. ## License netdata is [GPLv3+](LICENSE). -It re-distributes other open-source tools and libraries. Please check the [third party licenses](https://github.com/firehol/netdata/blob/master/LICENSE-REDISTRIBUTED.md). +Netdata re-distributes other open-source tools and libraries. Please check the [third party licenses](https://github.com/netdata/netdata/blob/master/REDISTRIBUTED.md). |