
diff options
| author | Daniel Baumann <daniel.baumann@progress-linux.org> | 2021-02-07 11:49:00 +0000 |
|---|---|---|
| committer | Daniel Baumann <daniel.baumann@progress-linux.org> | 2021-02-07 12:42:05 +0000 |
| commit | 2e85f9325a797977eea9dfea0a925775ddd211d9 (patch) | |
| tree | 452c7f30d62fca5755f659b99e4e53c7b03afc21 /README.md | |
| parent | Releasing debian version 1.19.0-4. (diff) | |
| download | netdata-2e85f9325a797977eea9dfea0a925775ddd211d9.tar.xz netdata-2e85f9325a797977eea9dfea0a925775ddd211d9.zip | |
Merging upstream version 1.29.0.
Signed-off-by: Daniel Baumann <daniel.baumann@progress-linux.org>
Diffstat (limited to 'README.md')
| -rw-r--r-- | README.md | 832 |
1 files changed, 175 insertions, 657 deletions
@@ -1,717 +1,235 @@ -# Netdata [](https://travis-ci.com/netdata/netdata) [](https://bestpractices.coreinfrastructure.org/projects/2231) [](https://www.gnu.org/licenses/gpl-3.0) [](<>) +<p align="center"><a href="https://netdata.cloud"><img src="https://user-images.githubusercontent.com/1153921/95268672-a3665100-07ec-11eb-8078-db619486d6ad.png" alt="Netdata" width="300" /></a></p> + +<h3 align="center">Netdata is high-fidelity infrastructure monitoring and troubleshooting.<br />Open-source, free, preconfigured, opinionated, and always real-time.</h3> +<br /> +<p align="center"> + <a href="https://github.com/netdata/netdata/releases/latest"><img src="https://img.shields.io/github/release/netdata/netdata.svg" alt="Latest release"></a> + <a href="https://travis-ci.com/netdata/netdata"><img src="https://travis-ci.com/netdata/netdata.svg?branch=master" alt="Build status"></a> + <a href="https://bestpractices.coreinfrastructure.org/projects/2231"><img src="https://bestpractices.coreinfrastructure.org/projects/2231/badge" alt="CII Best Practices"></a> + <a href="https://www.gnu.org/licenses/gpl-3.0"><img src="https://img.shields.io/badge/License-GPL%20v3%2B-blue.svg" alt="License: GPL v3+"></a> + <a href="<>"><img src="https://www.google-analytics.com/collect?v=1&aip=1&t=pageview&_s=1&ds=github&dr=https%3A%2F%2Fgithub.com%2Fnetdata%2Fnetdata&dl=https%3A%2F%2Fmy-netdata.io%2Fgithub%2Freadme&_u=MAC~&cid=5792dfd7-8dc4-476b-af31-da2fdb9f93d2&tid=UA-64295674-3" alt="analytics"></a> + <br /> + <a href="https://codeclimate.com/github/netdata/netdata"><img src="https://codeclimate.com/github/netdata/netdata/badges/gpa.svg" alt="Code Climate"></a> + <a href="https://www.codacy.com/app/netdata/netdata?utm_source=github.com&utm_medium=referral&utm_content=netdata/netdata&utm_campaign=Badge_Grade"><img src="https://api.codacy.com/project/badge/Grade/a994873f30d045b9b4b83606c3eb3498" alt="Codacy"></a> + <a href="https://lgtm.com/projects/g/netdata/netdata/context:cpp"><img src="https://img.shields.io/lgtm/grade/cpp/g/netdata/netdata.svg?logo=lgtm" alt="LGTM C"></a> + <a href="https://lgtm.com/projects/g/netdata/netdata/context:javascript"><img src="https://img.shields.io/lgtm/grade/javascript/g/netdata/netdata.svg?logo=lgtm" alt=""LGTM JS></a> + <a href="https://lgtm.com/projects/g/netdata/netdata/context:python"><img src="https://img.shields.io/lgtm/grade/python/g/netdata/netdata.svg?logo=lgtm" alt="LGTM PYTHON"></a> +</p> + +<img src="https://user-images.githubusercontent.com/1153921/95269366-1b814680-07ee-11eb-8ff4-c1b0b8758499.png" alt="---" style="max-width: 100%;" /> + +Netdata's **distributed, real-time monitoring Agent** collects thousands of metrics from systems, hardware, containers, +and applications with zero configuration. It runs permanently on all your physical/virtual servers, containers, cloud +deployments, and edge/IoT devices, and is perfectly safe to install on your systems mid-incident without any +preparation. + +You can install Netdata on most Linux distributions (Ubuntu, Debian, CentOS, and more), container platforms (Kubernetes +clusters, Docker), and many other operating systems (FreeBSD, macOS). No `sudo` required. + +Netdata is designed by system administrators, DevOps engineers, and developers to collect everything, help you visualize +metrics, troubleshoot complex performance problems, and make data interoperable with the rest of your monitoring stack. + +People get addicted to Netdata. Once you use it on your systems, there's no going back! _You've been warned..._ + + + +> **[Latest release](https://github.com/netdata/netdata/releases/latest): v1.28.0, December 18, 2020** +> +> Release v1.28.0 is a hotfix release to address a deadlock in the Netdata Agent. We intended to release this hotfix as +> v1.27.1, but we can't backtrack on a release once we've begun to publish new Docker images and binary packages on +> other platforms. +> +> **v1.27.0, December 17, 2020** +> +> The v1.27.0 release of the Netdata Agent brings dramatic improvements to long-term metrics storage via the database +> engine, and new dashboard features like a time & date picker for visualizing precise timeframes. Two new collectors +> bring incredible new value to existing features, including a bit of machine learning magic. + +## Menu + +- [Features](#features) +- [Get Netdata](#get-netdata) +- [How it works](#how-it-works) +- [Documentation](#documentation) +- [Community](#community) +- [Contribute](#contribute) +- [License](#license) +- [Is it any good?](#is-it-any-good) -[](https://codeclimate.com/github/netdata/netdata) [](https://www.codacy.com/app/netdata/netdata?utm_source=github.com&utm_medium=referral&utm_content=netdata/netdata&utm_campaign=Badge_Grade) [](https://lgtm.com/projects/g/netdata/netdata/context:cpp) [](https://lgtm.com/projects/g/netdata/netdata/context:javascript) [](https://lgtm.com/projects/g/netdata/netdata/context:python) - ---- - -**Netdata** is **distributed, real-time, performance and health monitoring for systems and applications**. It is a highly optimized monitoring agent you install on all your systems and containers. - -Netdata provides **unparalleled insights**, **in real-time**, of everything happening on the systems it runs (including web servers, databases, applications), using **highly interactive web dashboards**. It can run autonomously, without any third party components, or it can be integrated to existing monitoring tool chains (Prometheus, Graphite, OpenTSDB, Kafka, Grafana, etc). - -*Netdata is **fast** and **efficient**, designed to permanently run on all systems (**physical** & **virtual** servers, **containers**, **IoT** devices), without disrupting their core function.* - -Netdata is **free, open-source software** and it currently runs on **Linux**, **FreeBSD**, and **MacOS**. - -Netdata is not hosted by the CNCF but is the 3rd most starred open-source project in the [Cloud Native Computing Foundation (CNCF) landscape](https://landscape.cncf.io/format=card-mode&grouping=no&sort=stars). - ---- - -People get **addicted to Netdata**.<br/> -Once you use it on your systems, **there is no going back**! *You have been warned...* - - - -[](https://twitter.com/intent/tweet?text=Netdata,%20real-time%20performance%20and%20health%20monitoring,%20done%20right!&url=https://my-netdata.io/&via=linuxnetdata&hashtags=netdata,monitoring) - -## Contents - -1. [How it looks](#how-it-looks) - have a quick look at it -2. [User base](#user-base) - who uses Netdata? -3. [Quick Start](#quick-start) - try it now on your systems -4. [Why Netdata](#why-netdata) - why people love Netdata, how it compares with other solutions -5. [News](#news) - latest news about Netdata -6. [How it works](#how-it-works) - high level diagram of how Netdata works -7. [infographic](#infographic) - everything about Netdata, in a page -8. [Features](#features) - what features does it have -9. [Visualization](#visualization) - unique visualization features -10. [What does it monitor](#what-does-it-monitor) - which metrics it collects -11. [Documentation](#documentation) - read the docs -12. [Community](#community) - discuss with others and get support -13. [License](#license) - check the license of Netdata -14. [Is it any good?](#is-it-any-good) - Yes -15. [Is it awesome?](#is-it-awesome) - Yes - -## How it looks - -The following animated image, shows the top part of a typical Netdata dashboard. - - - -*A typical Netdata dashboard, in 1:1 timing. Charts can be panned by dragging them, zoomed in/out with `SHIFT` + `mouse wheel`, an area can be selected for zoom-in with `SHIFT` + `mouse selection`. Netdata is highly interactive and **real-time**, optimized to get the work done!* - -> *We have a few online demos to experience it live: [https://www.netdata.cloud](https://www.netdata.cloud/#live-demo)* - -## User base - -Netdata is used by hundreds of thousands of users all over the world. -Check our [GitHub watchers list](https://github.com/netdata/netdata/watchers). -You will find people working for **Amazon**, **Atos**, **Baidu**, **Cisco Systems**, **Citrix**, **Deutsche Telekom**, **DigitalOcean**, -**Elastic**, **EPAM Systems**, **Ericsson**, **Google**, **Groupon**, **Hortonworks**, **HP**, **Huawei**, -**IBM**, **Microsoft**, **NewRelic**, **Nvidia**, **Red Hat**, **SAP**, **Selectel**, **TicketMaster**, -**Vimeo**, and many more! - -### Docker pulls - -We provide docker images for the most common architectures. These are statistics reported by docker hub: - -[](https://hub.docker.com/r/netdata/netdata/) [](https://hub.docker.com/r/firehol/netdata/) [](https://hub.docker.com/r/titpetric/netdata/) - -### Registry - -When you install multiple Netdata, they are integrated into **one distributed application**, via a [Netdata registry](registry/#registry). This is a web browser feature and it allows us to count the number of unique users and unique Netdata servers installed. The following information comes from the global public Netdata registry we run: - -[](https://registry.my-netdata.io/#menu_netdata_submenu_registry) [](https://registry.my-netdata.io/#menu_netdata_submenu_registry) [](https://registry.my-netdata.io/#menu_netdata_submenu_registry) - -*in the last 24 hours:*<br/> [](https://registry.my-netdata.io/#menu_netdata_submenu_registry) [](https://registry.my-netdata.io/#menu_netdata_submenu_registry) [](https://registry.my-netdata.io/#menu_netdata_submenu_registry) - -## Quick Start - -  +## Features -To install Netdata from source on any Linux system (physical, virtual, container, IoT, edge) and keep it up to date with our **nightly releases** automatically, run the following: + + +Here's what you can expect from Netdata: + +- **1s granularity**: The highest possible resolution for all metrics. +- **Unlimited metrics**: Netdata collects all the available metrics—the more, the better. +- **1% CPU utilization of a single core**: It's unbelievably optimized. +- **A few MB of RAM**: The highly-efficient database engine stores per-second metrics in RAM and then "spills" + historical metrics to disk long-term storage. +- **Minimal disk I/O**: While running, Netdata only writes historical metrics and reads `error` and `access` logs. +- **Zero configuration**: Netdata auto-detects everything, and can collect up to 10,000 metrics per server out of the + box. +- **Zero maintenance**: You just run it. Netdata does the rest. +- **Stunningly fast, interactive visualizations**: The dashboard responds to queries in less than 1ms per metric to + synchronize charts as you pan through time, zoom in on anomalies, and more. +- **Visual anomaly detection**: Our UI/UX emphasizes the relationships between charts to help you detect the root + cause of anomalies. +- **Scales to infinity**: You can install it on all your servers, containers, VMs, and IoT devices. Metrics are not + centralized by default, so there is no limit. +- **Several operating modes**: Autonomous host monitoring (the default), headless data collector, forwarding proxy, + store and forward proxy, central multi-host monitoring, in all possible configurations. Use different metrics + retention policies per node and run with or without health monitoring. + +Netdata works with tons of applications, notifications platforms, and other time-series databases: + +- **300+ system, container, and application endpoints**: Collectors autodetect metrics from default endpoints and + immediately visualize them into meaningful charts designed for troubleshooting. See [everything we + support](https://learn.netdata.cloud/docs/agent/collectors/collectors). +- **20+ notification platforms**: Netdata's health watchdog sends warning and critical alarms to your [favorite + platform](https://learn.netdata.cloud/docs/monitor/enable-notifications) to inform you of anomalies just seconds + after they affect your node. +- **30+ external time-series databases**: Export resampled metrics as they're collected to other [local- and + Cloud-based databases](https://learn.netdata.cloud/docs/export/external-databases) for best-in-class + interoperability. + +> 💡 **Want to leverage the monitoring power of Netdata across entire infrastructure**? View metrics from +> any number of distributed nodes in a single interface and unlock even more +> [features](https://learn.netdata.cloud/docs/overview/why-netdata) with [Netdata +> Cloud](https://learn.netdata.cloud/docs/overview/what-is-netdata#netdata-cloud). + +## Get Netdata + +<p align="center"> + <a href="https://registry.my-netdata.io/#menu_netdata_submenu_registry"><img src="https://registry.my-netdata.io/api/v1/badge.svg?chart=netdata.registry_entries&dimensions=persons&label=user%20base&units=M&value_color=blue&precision=2÷=1000000&v43" alt="User base"></a> + <a href="https://registry.my-netdata.io/#menu_netdata_submenu_registry"><img src="https://registry.my-netdata.io/api/v1/badge.svg?chart=netdata.registry_entries&dimensions=machines&label=servers%20monitored&units=k÷=1000&value_color=orange&precision=2&v43" alt="Servers monitored"></a> + <a href="https://registry.my-netdata.io/#menu_netdata_submenu_registry"><img src="https://registry.my-netdata.io/api/v1/badge.svg?chart=netdata.registry_sessions&label=sessions%20served&units=M&value_color=yellowgreen&precision=2÷=1000000&v43" alt="Sessions served"></a> + <a href="https://hub.docker.com/r/netdata/netdata"><img src="https://frankfurt.my-netdata.io/api/v1/badge.svg?chart=dockerhub.pulls_sum÷=1000000&precision=1&units=M&label=docker+hub+pulls" alt="Docker Hub pulls"></a> + <br /> + <a href="https://registry.my-netdata.io/#menu_netdata_submenu_registry"><img src="https://registry.my-netdata.io/api/v1/badge.svg?chart=netdata.registry_entries&dimensions=persons&after=-86400&options=unaligned&group=incremental-sum&label=new%20users%20today&units=null&value_color=blue&precision=0&v42" alt="New users today"></a> + <a href="https://registry.my-netdata.io/#menu_netdata_submenu_registry"><img src="https://registry.my-netdata.io/api/v1/badge.svg?chart=netdata.registry_entries&dimensions=machines&group=incremental-sum&after=-86400&options=unaligned&label=servers%20added%20today&units=null&value_color=orange&precision=0&v42" alt="New machines today"></a> + <a href="https://registry.my-netdata.io/#menu_netdata_submenu_registry"><img src="https://registry.my-netdata.io/api/v1/badge.svg?chart=netdata.registry_sessions&after=-86400&group=incremental-sum&options=unaligned&label=sessions%20served%20today&units=null&value_color=yellowgreen&precision=0&v42" alt="Sessions today"></a> + <a href="https://hub.docker.com/r/netdata/netdata"><img src="https://frankfurt.my-netdata.io/api/v1/badge.svg?chart=dockerhub.pulls_sum÷=1000&precision=1&units=k&label=docker+hub+pulls&after=-86400&group=incremental-sum&label=docker%20hub%20pulls%20today" alt="Docker Hub pulls today"></a> +</p> + +To install Netdata from source on most Linux systems (physical, virtual, container, IoT, edge), run our [one-line +installation script](https://learn.netdata.cloud/docs/agent/packaging/installer/methods/packages). This script downloads +and builds all dependencies, including those required to connect to [Netdata Cloud](https://netdata.cloud/cloud) if you +choose, and enables [automatic nightly +updates](https://learn.netdata.cloud/docs/agent/packaging/installer#nightly-vs-stable-releases) and [anonymous +statistics](https://learn.netdata.cloud/docs/agent/anonymous-statistics). ```bash -# make sure you run `bash` for your shell -bash - -# install Netdata directly from GitHub source bash <(curl -Ss https://my-netdata.io/kickstart.sh) ``` -To learn more about the pros and cons of using *nightly* vs. *stable* releases, see our [notice about the two options](packaging/installer/README.md#nightly-vs-stable-releases). +To view the Netdata dashboard, navigate to `http://localhost:19999`, or `http://NODE:19999`. -The above command will: +### Docker -- Install any required packages on your system (it will ask you to confirm before doing so) -- Compile it, install it, and start it. +You can also try out Netdata's capabilities in a [Docker +container](https://learn.netdata.cloud/docs/agent/packaging/docker/): -More installation methods and additional options can be found at the [installation page](packaging/installer/#installation). - -To try Netdata in a docker container, run this: - -```sh +```bash docker run -d --name=netdata \ -p 19999:19999 \ + -v netdataconfig:/etc/netdata \ + -v netdatalib:/var/lib/netdata \ + -v netdatacache:/var/cache/netdata \ -v /etc/passwd:/host/etc/passwd:ro \ -v /etc/group:/host/etc/group:ro \ -v /proc:/host/proc:ro \ -v /sys:/host/sys:ro \ - -v /var/run/docker.sock:/var/run/docker.sock:ro \ + -v /etc/os-release:/host/etc/os-release:ro \ + --restart unless-stopped \ --cap-add SYS_PTRACE \ --security-opt apparmor=unconfined \ netdata/netdata ``` -For more information about running Netdata in docker, check the [docker installation page](packaging/docker/). - - - -From Netdata v1.12 and above, anonymous usage information is collected by default and sent to Google Analytics. To read more about the information collected and how to opt-out, check the [anonymous statistics page](docs/anonymous-statistics.md). - -## Why Netdata - -Netdata has a quite different approach to monitoring. - -Netdata is a monitoring agent you install on all your systems. It is: - -- a **metrics collector** - for system and application metrics (including web servers, databases, containers, etc) -- a **time-series database** - all stored in memory (does not touch the disks while it runs) -- a **metrics visualizer** - super fast, interactive, modern, optimized for anomaly detection -- an **alarms notification engine** - an advanced watchdog for detecting performance and availability issues - -All the above, are packaged together in a very flexible, extremely modular, distributed application. - -This is how Netdata compares to other monitoring solutions: - -|Netdata|others (open-source and commercial)| -|:-----:|:---------------------------------:| -|**High resolution metrics** (1s granularity)|Low resolution metrics (10s granularity at best)| -|Monitors everything, **thousands of metrics per node**|Monitor just a few metrics| -|UI is super fast, optimized for **anomaly detection**|UI is good for just an abstract view| -|**Meaningful presentation**, to help you understand the metrics|You have to know the metrics before you start| -|Install and get results **immediately**|Long preparation is required to get any useful results| -|Use it for **troubleshooting** performance problems|Use them to get *statistics of past performance*| -|**Kills the console** for tracing performance issues|The console is always required for troubleshooting| -|Requires **zero dedicated resources**|Require large dedicated resources| - -Netdata is **open-source**, **free**, super **fast**, very **easy**, completely **open**, extremely **efficient**, -**flexible** and integrate-able. - -It has been designed by **SysAdmins**, **DevOps** and **Developers** for troubleshooting performance problems, -not just visualize metrics. - -## News - -`Oct 18th, 2019` - **[Netdata v1.18.1 released!](https://github.com/netdata/netdata/releases)** - -Release v1.18.1 contains 17 bug fixes, 5 improvements, and 5 documentation updates. - -The patch has several bug fixes, mainly related to FreeBSD and the binary package generation process. - -Netdata can now [send notifications to Google Hangouts Chat](https://docs.netdata.cloud/health/notifications/hangouts/)! - -On certain systems, the `slabinfo` plugin introduced in v1.18.0 added thousands of new metrics. We decided the collector's usefulness to most users didn't justify the increase in resource requirements. This release disables the collector by default. - -Finally, we added a chart under **Netdata Monitoring** to present a better view of the RAM used by the [database engine (dbengine)](https://docs.netdata.cloud/database/engine/). The chart doesn't currently take into consideration the RAM used for slave nodes, so we intend to add more related charts in the future. - ---- - -`Oct 10th, 2019` - **[Netdata v1.18.0 released!](https://github.com/netdata/netdata/releases)** - -Release v1.18.0 contains 5 new collectors, 16 bug fixes, 27 improvements, and 20 documentation updates. - -The **database engine** is now the default method of storing metrics in Netdata. You immediately get more efficient and configurable long-term metrics storage without any work on your part. By saving recent metrics in RAM and "spilling" historical metrics to disk for long-term storage, the database engine is laying the foundation for many more improvements to distributed metrics. - -We even have a [tutorial](https://docs.netdata.cloud/docs/tutorials/longer-metrics-storage/) on switching to the database engine and getting the most from it. Or, just read up on [how performant](https://docs.netdata.cloud/database/engine/#evaluation) the database engine really is. - -Both our `python.d` and `go.d` plugins now have more **intelligent auto-detection** by periodically dump a list of active modules to disk. When Netdata starts, such as after a reboot, the plugins use this list of known services to re-establish metrics collection much more reliably. No more worrying if the service or application you need to monitor starts up minutes after Netdata. - -Two of our new collectors will help those with Hadoop big data infrastructures. The **HDFS and Zookeeper collection modules** come with essential alarms requested by our community and Netdata's auto-detection capabilities to keep the required configuration to an absolute minimum. Read up on the process via our [HDFS and Zookeeper tutorial](https://docs.netdata.cloud/docs/tutorials/monitor-hadoop-cluster/). - -Speaking of new collectors—we also added the ability to collect metrics from SLAB cache, Gearman, and vCenter Server Appliances. - -Before v1.18, if you wanted to create alarms for each dimension in a single chart, you need to write separate entities for each dimension—not very efficient or user-friendly. New **dimension templates** fix that hassle. Now, a single entity can automatically generate alarms for any number of dimensions in a chart, even those you weren't aware of! Our [tutorial on dimension templates](https://docs.netdata.cloud/docs/tutorials/dimension-templates/) has all the details. - -v1.18 brings support for installing Netdata on offline or air-gapped systems. To help users comply with strict security policies, our installation scripts can now install Netdata using previously-downloaded tarball and checksums instead of downloading them at runtime. We have guides for installing offline via `kickstart.sh` or `kickstart-static64.sh` in our [installation documentation](https://docs.netdata.cloud/packaging/installer/#offline-installations). We're excited to bring real-time monitoring to once-inaccessible systems! - ---- - -`Sep 12th, 2019` - **[Netdata v1.17.1 released!](https://github.com/netdata/netdata/releases)** - -Release v1.17.1 contains 2 bug fixes, 6 improvements, and 2 documentation updates. - -The main reason for the patch release is an essential fix to the repeating alarm notifications we introduced in v1.17.0. If you enabled repeating notifications, Netdata would not then send CLEAR notifications for the selected alarms. - -The release also includes a significant improvement to Netdata's auto-detection capabilities, especially after a system restart. Netdata now remembers which `python.d` plugin jobs were successfully collecting data the last time it was running, and retries to run those jobs for 5 minutes before giving up. As a result, you no longer have to worry if your system starts Netdata before the monitored services have had a chance to start properly. We will complete the same improvement for `go.d` plugins in v1.18.0. - -We also made some improvements to our binary packages and added a [neat sample custom dashboard](https://docs.netdata.cloud/web/gui/custom/#dash-multi-host-dashboard) that can show charts from multiple Netdata agents. - ---- - -`Sep 3rd, 2019` - **[Netdata v1.17.0 released!](https://github.com/netdata/netdata/releases)** - -Release v1.17.0 contains 38 bug fixes, 33 improvements, and 20 documentation updates. - -You can now change the data collection frequency at will, without losing previously collected values. A major improvement to the new database engine allows you not only to store metrics at variable granularity, but also to autoscale the time axis of the charts, depending on the data collection frequencies used during the presented time. - -You can also now monitor VM performance from one or more vCenter servers with a new [VSphere collector](https://docs.netdata.cloud/collectors/go.d.plugin/modules/vsphere/). In addition, the `proc` plugin now also collects ZRAM device performance metrics and the `apps` plugin monitors process uptime for the defined process groups. - -Continuing our efforts to integrate with as many existing solutions as possible, you can now directly archive metrics from Netdata to MongoDB via a new backend. - -Netdata badges now support international (UTF8) characters! We also made our URL parser smarter, not only for international character support, but also for other strange API queries. - -We also added `.DEB` packages to our binary distribution repositories at [Packagecloud](https://packagecloud.io/netdata), a new collector for Linux zram device metrics, and support for plain text email notifications. - -This release includes several fixes and improvements to the TLS encryption feature we introduced in v1.16.0. First, encryption slave-to-master streaming connections wasn't working as intended. And second, our community helped us discover cases where HTTP requests were not correctly redirected to HTTPS with TLS enabled. This release mitigates those issues and improves TLS support overall. - -Finally, we improved the way Netdata displays charts with no metrics. By default, Netdata displays charts for disks, memory, and networks only when the associated metrics are not zero. Users could enable these charts permanently using the corresponding configuration options, but they would need to change more than 200 options. With this new improvement, users can enable all charts with zero values using a single, global configuration parameter. - ---- - -`Jul 9th, 2019` - **[Netdata v1.16.0 released!](https://github.com/netdata/netdata/releases)** - -Release v1.16.0 contains 40 bug fixes, 31 improvements and 20 documentation updates - -**Binary distributions.** To improve the security, speed and reliability of new Netdata installations, we are delivering our own, industry standard installation method, with binary package distributions. The RPM binaries for the most common OSs are already available on packagecloud and we’ll have the DEB ones available very soon. All distributions are considered in Beta and, as always, we depend on our amazing community for feedback on improvements. - -- Our stable distributions are at [netdata/netdata @ packagecloud.io](https://packagecloud.io/netdata/netdata) -- The nightly builds are at [netdata/netdata-edge @ packagecloud.io](https://packagecloud.io/netdata/netdata-edge) - -**Netdata now supports TLS encryption!** You can secure the communication to the [web server](https://docs.netdata.cloud/web/server/#enabling-tls-support), the [streaming connections from slaves to the master](https://docs.netdata.cloud/streaming/#securing-the-communication) and the connection to an [openTSDB backend](https://docs.netdata.cloud/backends/opentsdb/#https). - -**This version also brings two long-awaited features to Netdata’s health monitoring:** - -- The [health management API](https://docs.netdata.cloud/web/api/health/#health-management-api) introduced in v1.12 allowed you to easily disable alarms and/or notifications while Netdata was running. However, those changes were not persisted across Netdata restarts. Since part of routine maintenance activities may involve completely restarting a monitoring node, Netdata now saves these configurations to disk, every time you issue a command to change the silencer settings. The new [LIST command](https://docs.netdata.cloud/web/api/health/#list-silencers) of the API allows you to view at any time which alarms are currently disabled or silenced. -- A way for Netdata to [repeatedly send alarm notifications](https://docs.netdata.cloud/health/#alarm-line-repeat) for some, or all active alarms, at a frequency of your choosing. As a result, you will no longer have to worry about missing a notification, forgetting about a raised alarm. The default is still to only send a single notification, so that existing users are not surprised by a different behavior. - -As always, we’ve introduced new collectors, 5 of them this time: - -- Of special interest to people with Windows servers in their infrastructure is the [WMI collector](https://docs.netdata.cloud/collectors/go.d.plugin/modules/wmi/), though we are fully aware that we need to continue our efforts to do a proper port to Windows. -- The new `perf` plugin collects system-wide CPU performance statistics from Performance Monitoring Units (PMU) using the `perf_event_open()` system call. You can read a wonderful article on why this is useful [here](http://www.brendangregg.com/blog/2017-05-09/cpu-utilization-is-wrong.html). -- The other three are collectors to monitor [Dnsmasq DHCP leases](https://docs.netdata.cloud/collectors/go.d.plugin/modules/dnsmasq_dhcp/), [Riak KV servers](https://docs.netdata.cloud/collectors/python.d.plugin/riakkv/) and [Pihole instances](https://docs.netdata.cloud/collectors/go.d.plugin/modules/pihole/). - -Finally, the DB Engine introduced in v1.15.0 now uses much less memory and is more robust than before. - ---- - -`May 21st, 2019` - **[Netdata v1.15.0 released!](https://github.com/netdata/netdata/releases)** - -Release v1.15.0 contains 11 bug fixes and 30 improvements. - -We are very happy and proud to be able to include two major improvements in this release: The aggregated node view and the [new database engine](https://docs.netdata.cloud/database/engine/). - -_Aggregated node view_ - -The No. 1 request from our community has been a better way to view and manage their Netdata installations, via an aggregated view. The node menu with the simple list of hosts on the agent UI just didn't do it for people with hundreds, or thousands of instances. This release introduces the node view, which uses the power of [Netdata Cloud](https://blog.netdata.cloud/posts/netdata-cloud-announcement/) to deliver powerful views of a Netdata-based monitoring infrastructure. You can read more about Netdata Cloud and the future of Netdata [here](https://blog.netdata.cloud/posts/netdata-cloud-announcement/). - -_New database engine_ - -Historically, Netdata has required a lot of memory for long-term metrics storage. To mitigate this we've been building a new DB engine for several months and will continue improving until it can become the default `memory mode` for new Netdata installations. The version included in release v1.15.0 already permits longer-term storage of compressed data and we'll continue reducing the required memory in following releases. - -_Other major additions_ - -We have added support for the [AWS Kinesis backend](https://docs.netdata.cloud/backends/aws_kinesis/) and new collectors for [OpenVPN](https://docs.netdata.cloud/collectors/go.d.plugin/modules/openvpn/), the [Tengine web server](https://docs.netdata.cloud/collectors/go.d.plugin/modules/tengine/), [ScaleIO (VxFlex OS)](https://docs.netdata.cloud/collectors/go.d.plugin/modules/scaleio/), [ioping-like latency metrics](https://docs.netdata.cloud/collectors/ioping.plugin/) and [Energi Core node instances](https://docs.netdata.cloud/collectors/python.d.plugin/energid/). - -We now have a new, ["text-only" chart type](https://github.com/netdata/netdata/issues/5578), [cpu limits for v2 cgroups](https://github.com/netdata/netdata/issues/5850), [docker swarm metrics](https://docs.netdata.cloud/collectors/go.d.plugin/modules/docker_engine/) and improved [documentation](https://docs.netdata.cloud/). - -We continued improving the [Kubernetes helmchart](https://github.com/netdata/helmchart) with liveness probes for slaves, persistence options, a fix for a `Cannot allocate memory` issue and easy configuration for the kubelet, kube-proxy and coredns collectors. - -Finally, we built a process to quickly replace any problematic nightly builds and added more automated CI tests to prevent such builds from being published in the first place. - ---- - -`Apr 26th, 2019` - **[Netdata v1.14.0 released!](https://github.com/netdata/netdata/releases)** - -Release 1.14 contains 14 bug fixes and 24 improvements. - -The release introduces major additions to Kubernetes monitoring, with tens of new charts for [Kubelet](https://docs.netdata.cloud/collectors/go.d.plugin/modules/k8s_kubelet/), [kube-proxy](https://docs.netdata.cloud/collectors/go.d.plugin/modules/k8s_kubeproxy/) and [coredns](https://github.com/netdata/go.d.plugin/tree/master/modules/coredns) metrics, as well as significant improvements to the Netdata [helm chart](https://github.com/netdata/helmchart/). - -Two new collectors were added, to monitor [Docker hub](https://docs.netdata.cloud/collectors/go.d.plugin/modules/dockerhub/) and [Docker engine](https://docs.netdata.cloud/collectors/go.d.plugin/modules/docker_engine/) metrics. - -Finally, v1.14 adds support for [version 2 cgroups](https://github.com/netdata/netdata/pull/5407), [OpenLDAP over TLS](https://github.com/netdata/netdata/pull/5859), [NVIDIA SMI free and per process memory](https://github.com/netdata/netdata/pull/5796/files) and [configurable syslog facilities](https://github.com/netdata/netdata/pull/5792). - ---- - -`Mar 14th, 2019` - **[Netdata v1.13.0 released!](https://github.com/netdata/netdata/releases)** - -Release 1.13.0 contains 14 bug fixes and 8 improvements. - -Netdata has taken the first step into the world of Kubernetes, with a beta version of a [Helm chart](https://github.com/netdata/helmchart) for deployment to a k8s cluster and [proper naming](https://github.com/netdata/netdata/pull/5576) of the cgroup containers. We have [big plans](https://github.com/netdata/netdata/issues/5392) for Kubernetes, so stay tuned! - -A [major refactoring of the python.d plugin](https://github.com/netdata/netdata/pull/5552) has resulted in a dramatic decrease of the required memory, making Netdata even more resource efficient. - -We also added charts for IPC shared memory segments and total memory used. - ---- - -`Feb 28th, 2019` - **[Netdata v1.12.2 released!](https://github.com/netdata/netdata/releases)** - -Patch release 1.12.2 contains 7 bug fixes and 4 improvements. - -The main motivation behind a new patch release is the introduction of a **stable release channel**. -A "stable" installation and update channel was always on our roadmap, but it became a necessity when we realized that our users in China could not use the nightly releases published on Google Cloud. The "stable" channel is based on our official GitHub releases and uses assets hosted on GitHub. - -We are also introducing a new **Oracle DB collector** module, implemented in Python. +To view the Netdata dashboard, navigate to `http://localhost:19999`, or `http://NODE:19999`. ---- +### Other operating systems -`Feb 21st, 2019` - **[Netdata v1.12.1 released!](https://github.com/netdata/netdata/releases)** +See our documentation for [additional operating +systems](/packaging/installer/README.md#have-a-different-operating-system-or-want-to-try-another-method), including +[Kubernetes](/packaging/installer/methods/kubernetes.md), [`.deb`/`.rpm` +packages](/packaging/installer/methods/packages.md), and more. -Patch release 1.12.1 contains 22 bug fixes and 8 improvements. +### Post-installation ---- +When you're finished with installation, check out our [single-node](/docs/quickstart/single-node.md) or +[infrastructure](/docs/quickstart/infrastructure.md) monitoring quickstart guides based on your use case. -`Feb 14th, 2019` - **[Netdata v1.12.0 released!](https://github.com/netdata/netdata/releases)** +Or, skip straight to [configuring the Netdata Agent](/docs/configure/nodes.md). -Release 1.12 is made out of 211 pull requests and 22 bug fixes. -The key improvements are: - -- Introducing `netdata.cloud`, the free Netdata service for all Netdata users -- High performance plugins with go.d.plugin (data collection orchestrator written in Go) -- 7 new data collectors and 11 rewrites of existing data collectors for improved performance -- A new management API for all Netdata servers -- Bind different functions of the Netdata APIs to different ports -- Improved installation and updates - ---- - -`Nov 22nd, 2018` - **[Netdata v1.11.1 released!](https://github.com/netdata/netdata/releases)** - -- Improved internal database to support values above 64bit. -- New data collection plugins: [`openldap`](collectors/python.d.plugin/openldap/), [`tor`](collectors/python.d.plugin/tor/), [`nvidia_smi`](collectors/python.d.plugin/nvidia_smi/). -- Improved data collection plugins: Netdata now supports monitoring network interface aliases, [`smartd_log`](collectors/python.d.plugin/smartd_log/), [`cpufreq`](collectors/proc.plugin/README.md#cpu-frequency), [`sensors`](collectors/python.d.plugin/sensors/). -- Health monitoring improvements: network interface congestion alarm restored, [`alerta.io`](health/notifications/alerta/), `conntrack_max`. -- `my-netdata`menu has been refactored. -- Packaging: `openrc` service definition got a few improvements. - ---- - -`Sep 18, 2018` - **Netdata has its own organization** - -Netdata used to be a [firehol.org](https://firehol.org) project, accessible as `firehol/netdata`. - -Netdata now has its own github organization `netdata`, so all github URLs are now `netdata/netdata`. The old github URLs, repo clones, forks, etc redirect automatically to the new repo. +Read through Netdata's [documentation](https://learn.netdata.cloud/docs), which is structured based on actions and +solutions, to enable features like health monitoring, alarm notifications, long-term metrics storage, exporting to +external databases, and more. ## How it works -Netdata is a highly efficient, highly modular, metrics management engine. Its lockless design makes it ideal for concurrent operations on the metrics. +Netdata is a highly efficient, highly modular, metrics management engine. Its lockless design makes it ideal for +concurrent operations on the metrics. -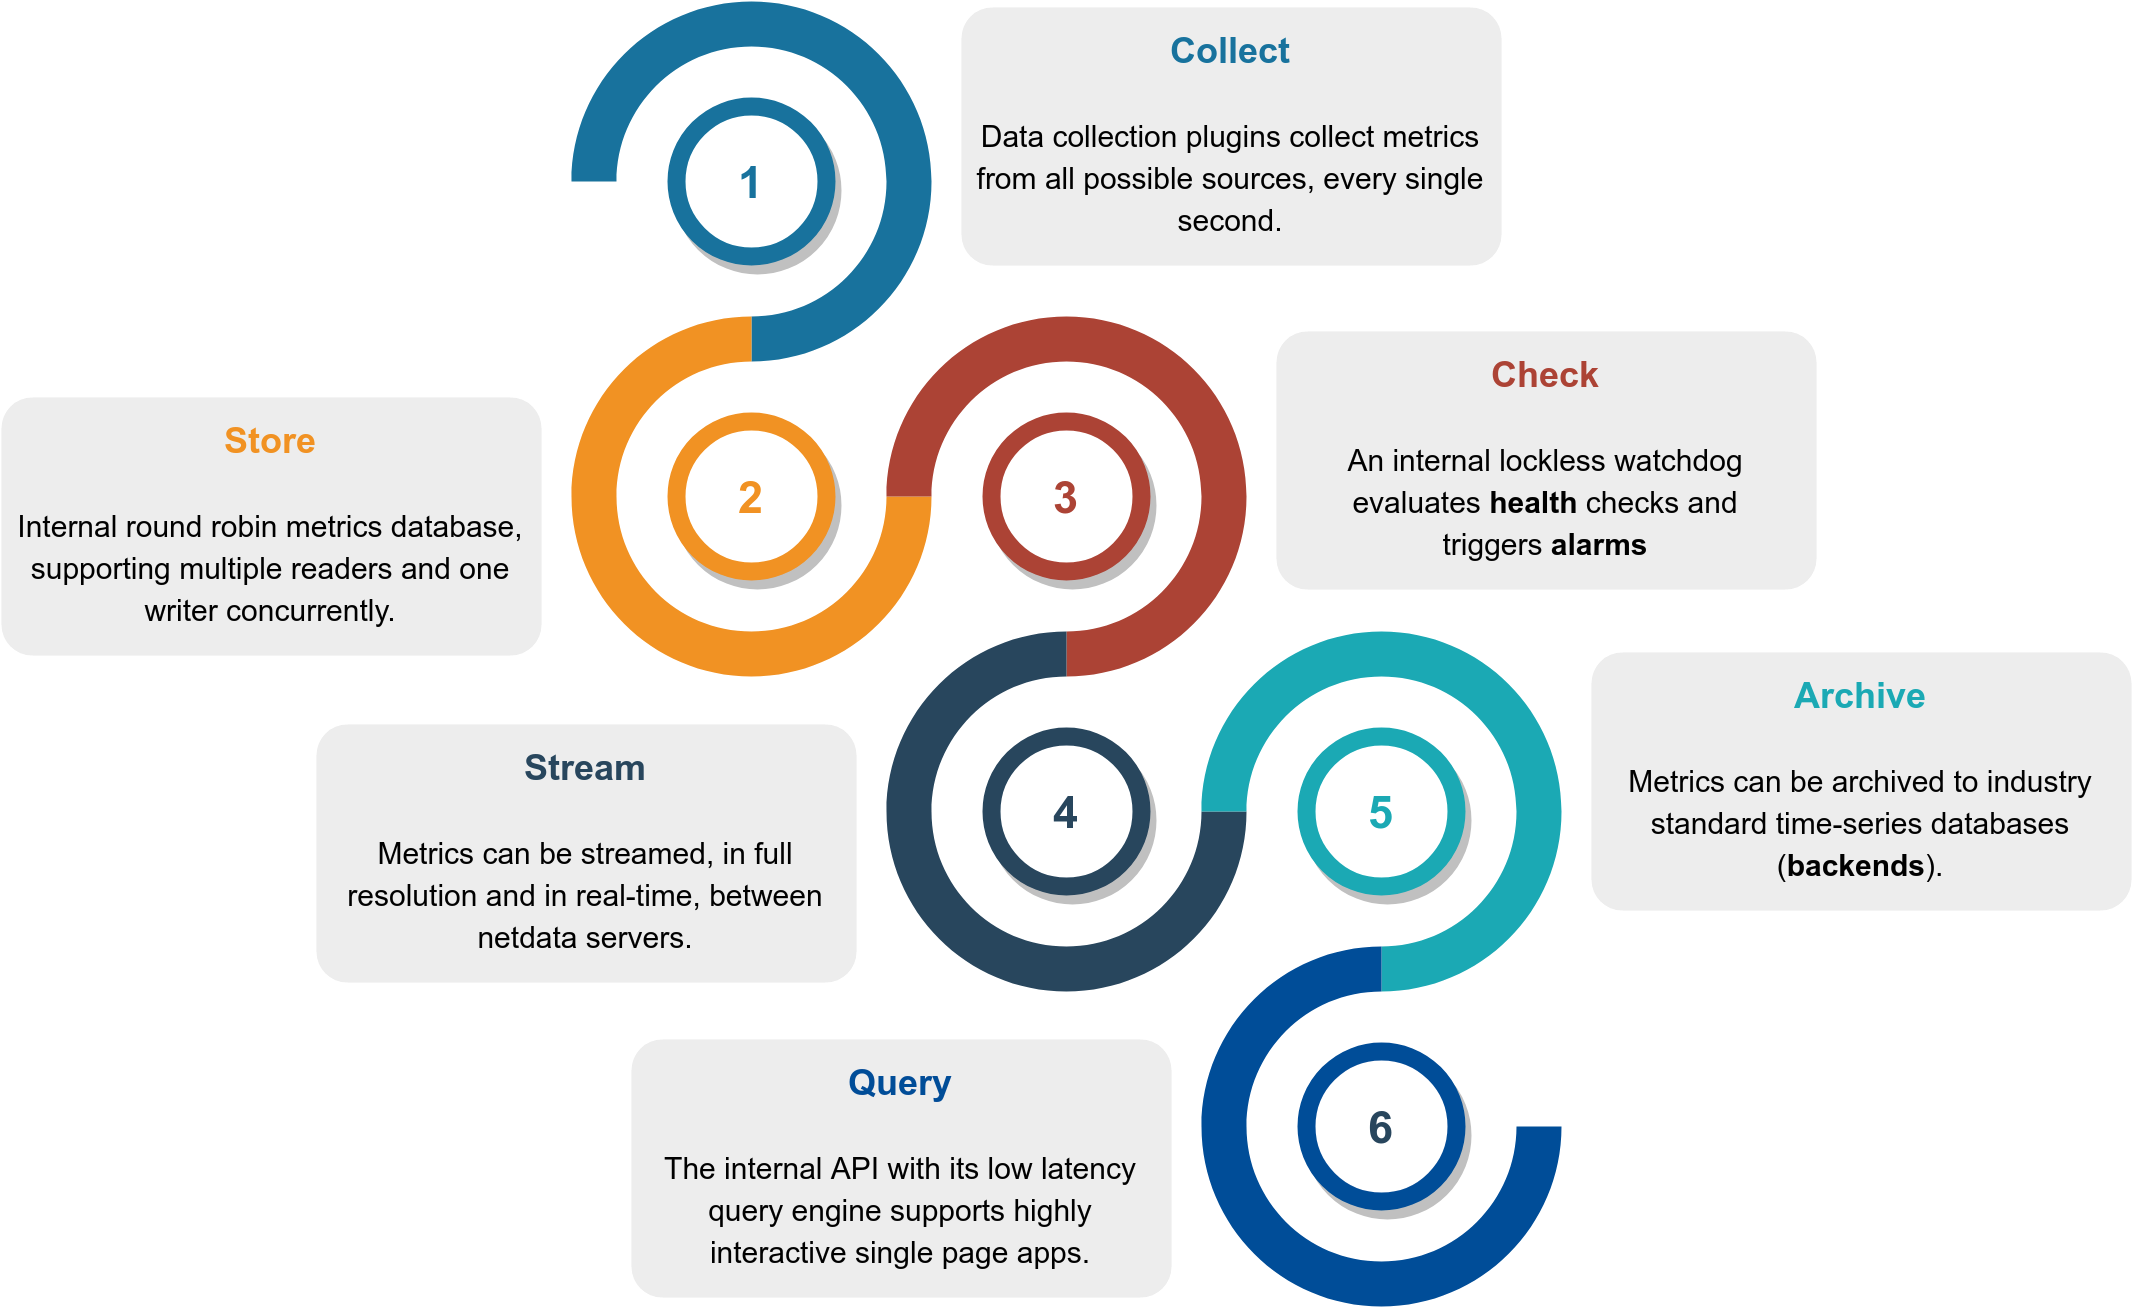 + -This is how it works: - -|Function|Description|Documentation| -|:------:|:----------|:-----------:| -|**Collect**|Multiple independent data collection workers are collecting metrics from their sources using the optimal protocol for each application and push the metrics to the database. Each data collection worker has lockless write access to the metrics it collects.|[`collectors`](collectors/#data-collection-plugins)| -|**Store**|Metrics are stored in RAM in a round robin database (ring buffer), using a custom made floating point number for minimal footprint.|[`database`](database/#database)| -|**Check**|A lockless independent watchdog is evaluating **health checks** on the collected metrics, triggers alarms, maintains a health transaction log and dispatches alarm notifications.|[`health`](health/#health-monitoring)| -|**Stream**|An lockless independent worker is streaming metrics, in full detail and in real-time, to remote Netdata servers, as soon as they are collected.|[`streaming`](streaming/#streaming-and-replication)| -|**Archive**|A lockless independent worker is down-sampling the metrics and pushes them to **backend** time-series databases.|[`backends`](backends/)| -|**Query**|Multiple independent workers are attached to the [internal web server](web/server/#web-server), servicing API requests, including [data queries](web/api/queries/#database-queries).|[`web/api`](web/api/#api)| - -The result is a highly efficient, low latency system, supporting multiple readers and one writer on each metric. +The result is a highly efficient, low-latency system, supporting multiple readers and one writer on each metric. ## Infographic -This is a high level overview of Netdata feature set and architecture. -Click it to to interact with it (it has direct links to documentation). - -[](https://my-netdata.io/infographic.html) - -## Features - - - -This is what you should expect from Netdata: - -### General - -- **1s granularity** - the highest possible resolution for all metrics. -- **Unlimited metrics** - collects all the available metrics, the more the better. -- **1% CPU utilization of a single core** - it is super fast, unbelievably optimized. -- **A few MB of RAM** - by default it uses 25MB RAM. [You size it](database). -- **Zero disk I/O** - while it runs, it does not load or save anything (except `error` and `access` logs). -- **Zero configuration** - auto-detects everything, it can collect up to 10000 metrics per server out of the box. -- **Zero maintenance** - You just run it, it does the rest. -- **Zero dependencies** - it is even its own web server, for its static web files and its web API (though its plugins may require additional libraries, depending on the applications monitored). -- **Scales to infinity** - you can install it on all your servers, containers, VMs and IoTs. Metrics are not centralized by default, so there is no limit. -- **Several operating modes** - Autonomous host monitoring (the default), headless data collector, forwarding proxy, store and forward proxy, central multi-host monitoring, in all possible configurations. Each node may have different metrics retention policy and run with or without health monitoring. - -### Health Monitoring & Alarms - -- **Sophisticated alerting** - comes with hundreds of alarms, **out of the box**! Supports dynamic thresholds, hysteresis, alarm templates, multiple role-based notification methods. -- **Notifications**: [alerta.io](health/notifications/alerta/), [amazon sns](health/notifications/awssns/), [discordapp.com](health/notifications/discord/), [email](health/notifications/email/), [flock.com](health/notifications/flock/), [hangouts](health/notifications/hangouts/), [irc](health/notifications/irc/), [kavenegar.com](health/notifications/kavenegar/), [messagebird.com](health/notifications/messagebird/), [pagerduty.com](health/notifications/pagerduty/), [prowl](health/notifications/prowl/), [pushbullet.com](health/notifications/pushbullet/), [pushover.net](health/notifications/pushover/), [rocket.chat](health/notifications/rocketchat/), [slack.com](health/notifications/slack/), [smstools3](health/notifications/smstools3/), [syslog](health/notifications/syslog/), [telegram.org](health/notifications/telegram/), [twilio.com](health/notifications/twilio/), [web](health/notifications/web/) and [custom notifications](health/notifications/custom/). - -### Integrations - -- **time-series dbs** - can archive its metrics to **Graphite**, **OpenTSDB**, **Prometheus**, **AWS Kinesis**, **MongoDB**, **JSON document DBs**, in the same or lower resolution (lower: to prevent it from congesting these servers due to the amount of data collected). Netdata also supports **Prometheus remote write API** which allows storing metrics to **Elasticsearch**, **Gnocchi**, **InfluxDB**, **Kafka**, **PostgreSQL/TimescaleDB**, **Splunk**, **VictoriaMetrics**, and a lot of other [storage providers](https://prometheus.io/docs/operating/integrations/#remote-endpoints-and-storage). - -## Visualization - -- **Stunning interactive dashboards** - mouse, touchpad and touch-screen friendly in 2 themes: `slate` (dark) and `white`. -- **Amazingly fast visualization** - responds to all queries in less than 1 ms per metric, even on low-end hardware. -- **Visual anomaly detection** - the dashboards are optimized for detecting anomalies visually. -- **Embeddable** - its charts can be embedded on your web pages, wikis and blogs. You can even use [Atlassian's Confluence as a monitoring dashboard](web/gui/confluence/). -- **Customizable** - custom dashboards can be built using simple HTML (no javascript necessary). - -### Positive and negative values - -To improve clarity on charts, Netdata dashboards present **positive** values for metrics representing `read`, `input`, `inbound`, `received` and **negative** values for metrics representing `write`, `output`, `outbound`, `sent`. - - - -_Netdata charts showing the bandwidth and packets of a network interface. `received` is positive and `sent` is negative._ - -### Autoscaled y-axis - -Netdata charts automatically zoom vertically, to visualize the variation of each metric within the visible time-frame. - - - -_A zero based `stacked` chart, automatically switches to an auto-scaled `area` chart when a single dimension is selected._ - -### Charts are synchronized - -Charts on Netdata dashboards are synchronized to each other. There is no master chart. Any chart can be panned or zoomed at any time, and all other charts will follow. - - - -_Charts are panned by dragging them with the mouse. Charts can be zoomed in/out with`SHIFT` + `mouse wheel` while the mouse pointer is over a chart._ - -> The visible time-frame (pan and zoom) is propagated from Netdata server to Netdata server, when navigating via the [node menu](registry#registry). - -### Highlighted time-frame - -To improve visual anomaly detection across charts, the user can highlight a time-frame (by pressing `ALT` + `mouse selection`) on all charts. - - - -_A highlighted time-frame can be given by pressing `ALT` + `mouse selection` on any chart. Netdata will highlight the same range on all charts._ - -> Highlighted ranges are propagated from Netdata server to Netdata server, when navigating via the [node menu](registry#registry). - -## What does it monitor - -Netdata data collection is **extensible** - you can monitor anything you can get a metric for. -Its [Plugin API](collectors/plugins.d/) supports all programing languages (anything can be a Netdata plugin, BASH, python, perl, node.js, java, Go, ruby, etc). - -- For better performance, most system related plugins (cpu, memory, disks, filesystems, networking, etc) have been written in `C`. -- For faster development and easier contributions, most application related plugins (databases, web servers, etc) have been written in `python`. - -#### APM (Application Performance Monitoring) - -- **[statsd](collectors/statsd.plugin/)** - Netdata is a fully featured statsd server. -- **[Go expvar](collectors/python.d.plugin/go_expvar/)** - collects metrics exposed by applications written in the Go programming language using the expvar package. -- **[Spring Boot](collectors/python.d.plugin/springboot/)** - monitors running Java Spring Boot applications that expose their metrics with the use of the Spring Boot Actuator included in Spring Boot library. -- **[uWSGI](collectors/python.d.plugin/uwsgi/)** - collects performance metrics from uWSGI applications. - -#### System Resources - -- **[CPU Utilization](collectors/proc.plugin/)** - total and per core CPU usage. -- **[Interrupts](collectors/proc.plugin/)** - total and per core CPU interrupts. -- **[SoftIRQs](collectors/proc.plugin/)** - total and per core SoftIRQs. -- **[SoftNet](collectors/proc.plugin/)** - total and per core SoftIRQs related to network activity. -- **[CPU Throttling](collectors/proc.plugin/)** - collects per core CPU throttling. -- **[CPU Frequency](collectors/proc.plugin/)** - collects the current CPU frequency. -- **[CPU Idle](collectors/proc.plugin/)** - collects the time spent per processor state. -- **[IdleJitter](collectors/idlejitter.plugin/)** - measures CPU latency. -- **[Entropy](collectors/proc.plugin/)** - random numbers pool, using in cryptography. -- **[Interprocess Communication - IPC](collectors/proc.plugin/)** - such as semaphores and semaphores arrays. - -#### Memory - -- **[ram](collectors/proc.plugin/)** - collects info about RAM usage. -- **[swap](collectors/proc.plugin/)** - collects info about swap memory usage. -- **[available memory](collectors/proc.plugin/)** - collects the amount of RAM available for userspace processes. -- **[committed memory](collectors/proc.plugin/)** - collects the amount of RAM committed to userspace processes. -- **[Page Faults](collectors/proc.plugin/)** - collects the system page faults (major and minor). -- **[writeback memory](collectors/proc.plugin/)** - collects the system dirty memory and writeback activity. -- **[huge pages](collectors/proc.plugin/)** - collects the amount of RAM used for huge pages. -- **[KSM](collectors/proc.plugin/)** - collects info about Kernel Same Merging (memory dedupper). -- **[Numa](collectors/proc.plugin/)** - collects Numa info on systems that support it. -- **[slab](collectors/proc.plugin/)** - collects info about the Linux kernel memory usage. - -#### Disks - -- **[block devices](collectors/proc.plugin/)** - per disk: I/O, operations, backlog, utilization, space, etc. -- **[BCACHE](collectors/proc.plugin/)** - detailed performance of SSD caching devices. -- **[DiskSpace](collectors/proc.plugin/)** - monitors disk space usage. -- **[mdstat](collectors/proc.plugin/)** - software RAID. -- **[hddtemp](collectors/python.d.plugin/hddtemp/)** - disk temperatures. -- **[smartd](collectors/python.d.plugin/smartd_log/)** - disk S.M.A.R.T. values. -- **[device mapper](collectors/proc.plugin/)** - naming disks. -- **[Veritas Volume Manager](collectors/proc.plugin/)** - naming disks. -- **[megacli](collectors/python.d.plugin/megacli/)** - adapter, physical drives and battery stats. -- **[adaptec_raid](collectors/python.d.plugin/adaptec_raid/)** - logical and physical devices health metrics. -- **[ioping](collectors/ioping.plugin/)** - to measure disk read/write latency. - -#### Filesystems - -- **[BTRFS](collectors/proc.plugin/)** - detailed disk space allocation and usage. -- **[Ceph](collectors/python.d.plugin/ceph/)** - OSD usage, Pool usage, number of objects, etc. -- **[NFS file servers and clients](collectors/proc.plugin/)** - NFS v2, v3, v4: I/O, cache, read ahead, RPC calls -- **[Samba](collectors/python.d.plugin/samba/)** - performance metrics of Samba SMB2 file sharing. -- **[ZFS](collectors/proc.plugin/)** - detailed performance and resource usage. - -#### Networking - -- **[Network Stack](collectors/proc.plugin/)** - everything about the networking stack (both IPv4 and IPv6 for all protocols: TCP, UDP, SCTP, UDPLite, ICMP, Multicast, Broadcast, etc), and all network interfaces (per interface: bandwidth, packets, errors, drops). -- **[Netfilter](collectors/proc.plugin/)** - everything about the netfilter connection tracker. -- **[SynProxy](collectors/proc.plugin/)** - collects performance data about the linux SYNPROXY (DDoS). -- **[NFacct](collectors/nfacct.plugin/)** - collects accounting data from iptables. -- **[Network QoS](collectors/tc.plugin/)** - the only tool that visualizes network `tc` classes in real-time. -- **[FPing](collectors/fping.plugin/)** - to measure latency and packet loss between any number of hosts. -- **[ISC dhcpd](collectors/python.d.plugin/isc_dhcpd/)** - pools utilization, leases, etc. -- **[AP](collectors/charts.d.plugin/ap/)** - collects Linux access point performance data (`hostapd`). -- **[SNMP](collectors/node.d.plugin/snmp/)** - SNMP devices can be monitored too (although you will need to configure these). -- **[port_check](collectors/python.d.plugin/portcheck/)** - checks TCP ports for availability and response time. - -#### Virtual Private Networks - -- **[OpenVPN](collectors/python.d.plugin/ovpn_status_log/)** - collects status per tunnel. -- **[LibreSwan](collectors/charts.d.plugin/libreswan/)** - collects metrics per IPSEC tunnel. -- **[Tor](collectors/python.d.plugin/tor/)** - collects Tor traffic statistics. - -#### Processes +This is a high-level overview of Netdata features and architecture. Click on it to view an interactive version, which +has links to our documentation. -- **[System Processes](collectors/proc.plugin/)** - running, blocked, forks, active. -- **[Applications](collectors/apps.plugin/)** - by grouping the process tree and reporting CPU, memory, disk reads, disk writes, swap, threads, pipes, sockets - per process group. -- **[systemd](collectors/cgroups.plugin/)** - monitors systemd services using CGROUPS. - -#### Users - -- **[Users and User Groups resource usage](collectors/apps.plugin/)** - by summarizing the process tree per user and group, reporting: CPU, memory, disk reads, disk writes, swap, threads, pipes, sockets. -- **[logind](collectors/python.d.plugin/logind/)** - collects sessions, users and seats connected. - -#### Containers and VMs - -- **[Containers](collectors/cgroups.plugin/)** - collects resource usage for all kinds of containers, using CGROUPS (systemd-nspawn, lxc, lxd, docker, kubernetes, etc). -- **[libvirt VMs](collectors/cgroups.plugin/)** - collects resource usage for all kinds of VMs, using CGROUPS. -- **[dockerd](collectors/python.d.plugin/dockerd/)** - collects docker health metrics. - -#### Web Servers - -- **[Apache and lighttpd](collectors/python.d.plugin/apache/)** - `mod-status` (v2.2, v2.4) and cache log statistics, for multiple servers. -- **[IPFS](collectors/python.d.plugin/ipfs/)** - bandwidth, peers. -- **[LiteSpeed](collectors/python.d.plugin/litespeed/)** - reads the litespeed rtreport files to collect metrics. -- **[Nginx](collectors/python.d.plugin/nginx/)** - `stub-status`, for multiple servers. -- **[Nginx+](collectors/python.d.plugin/nginx_plus/)** - connects to multiple nginx_plus servers (local or remote) to collect real-time performance metrics. -- **[PHP-FPM](collectors/python.d.plugin/phpfpm/)** - multiple instances, each reporting connections, requests, performance, etc. -- **[Tomcat](collectors/python.d.plugin/tomcat/)** - accesses, threads, free memory, volume, etc. -- **[web server `access.log` files](collectors/python.d.plugin/web_log/)** - extracting in real-time, web server and proxy performance metrics and applying several health checks, etc. -- **[HTTP check](collectors/python.d.plugin/httpcheck/)** - checks one or more web servers for HTTP status code and returned content. - -#### Proxies, Balancers, Accelerators - -- **[HAproxy](collectors/python.d.plugin/haproxy/)** - bandwidth, sessions, backends, etc. -- **[Squid](collectors/python.d.plugin/squid/)** - multiple servers, each showing: clients bandwidth and requests, servers bandwidth and requests. -- **[Traefik](collectors/python.d.plugin/traefik/)** - connects to multiple traefik instances (local or remote) to collect API metrics (response status code, response time, average response time and server uptime). -- **[Varnish](collectors/python.d.plugin/varnish/)** - threads, sessions, hits, objects, backends, etc. -- **[IPVS](collectors/proc.plugin/)** - collects metrics from the Linux IPVS load balancer. - -#### Database Servers - -- **[CouchDB](collectors/python.d.plugin/couchdb/)** - reads/writes, request methods, status codes, tasks, replication, per-db, etc. -- **[MemCached](collectors/python.d.plugin/memcached/)** - multiple servers, each showing: bandwidth, connections, items, etc. -- **[MongoDB](collectors/python.d.plugin/mongodb/)** - operations, clients, transactions, cursors, connections, asserts, locks, etc. -- **[MySQL and mariadb](collectors/python.d.plugin/mysql/)** - multiple servers, each showing: bandwidth, queries/s, handlers, locks, issues, tmp operations, connections, binlog metrics, threads, innodb metrics, and more. -- **[PostgreSQL](collectors/python.d.plugin/postgres/)** - multiple servers, each showing: per database statistics (connections, tuples read - written - returned, transactions, locks), backend processes, indexes, tables, write ahead, background writer and more. -- **[Proxy SQL](collectors/python.d.plugin/proxysql/)** - collects Proxy SQL backend and frontend performance metrics. -- **[Redis](collectors/python.d.plugin/redis/)** - multiple servers, each showing: operations, hit rate, memory, keys, clients, slaves. -- **[RethinkDB](collectors/python.d.plugin/rethinkdbs/)** - connects to multiple rethinkdb servers (local or remote) to collect real-time metrics. - -#### Message Brokers - -- **[beanstalkd](collectors/python.d.plugin/beanstalk/)** - global and per tube monitoring. -- **[RabbitMQ](collectors/python.d.plugin/rabbitmq/)** - performance and health metrics. - -#### Search and Indexing - -- **[ElasticSearch](collectors/python.d.plugin/elasticsearch/)** - search and index performance, latency, timings, cluster statistics, threads statistics, etc. - -#### DNS Servers - -- **[bind_rndc](collectors/python.d.plugin/bind_rndc/)** - parses `named.stats` dump file to collect real-time performance metrics. All versions of bind after 9.6 are supported. -- **[dnsdist](collectors/python.d.plugin/dnsdist/)** - performance and health metrics. -- **[ISC Bind (named)](collectors/node.d.plugin/named/)** - multiple servers, each showing: clients, requests, queries, updates, failures and several per view metrics. All versions of bind after 9.9.10 are supported. -- **[NSD](collectors/python.d.plugin/nsd/)** - queries, zones, protocols, query types, transfers, etc. -- **[PowerDNS](collectors/python.d.plugin/powerdns/)** - queries, answers, cache, latency, etc. -- **[unbound](collectors/python.d.plugin/unbound/)** - performance and resource usage metrics. -- **[dns_query_time](collectors/python.d.plugin/dns_query_time/)** - DNS query time statistics. - -#### Time Servers - -- **[chrony](collectors/python.d.plugin/chrony/)** - uses the `chronyc` command to collect chrony statistics (Frequency, Last offset, RMS offset, Residual freq, Root delay, Root dispersion, Skew, System time). -- **[ntpd](collectors/python.d.plugin/ntpd/)** - connects to multiple ntpd servers (local or remote) to provide statistics of system variables and optional also peer variables. - -#### Mail Servers - -- **[Dovecot](collectors/python.d.plugin/dovecot/)** - POP3/IMAP servers. -- **[Exim](collectors/python.d.plugin/exim/)** - message queue (emails queued). -- **[Postfix](collectors/python.d.plugin/postfix/)** - message queue (entries, size). - -#### Hardware Sensors - -- **[IPMI](collectors/freeipmi.plugin/)** - enterprise hardware sensors and events. -- **[lm-sensors](collectors/python.d.plugin/sensors/)** - temperature, voltage, fans, power, humidity, etc. -- **[Nvidia](collectors/python.d.plugin/nvidia_smi/)** - collects information for Nvidia GPUs. -- **[RPi](collectors/charts.d.plugin/sensors/)** - Raspberry Pi temperature sensors. -- **[w1sensor](collectors/python.d.plugin/w1sensor/)** - collects data from connected 1-Wire sensors. - -#### UPSes - -- **[apcupsd](collectors/charts.d.plugin/apcupsd/)** - load, charge, battery voltage, temperature, utility metrics, output metrics. -- **[NUT](collectors/charts.d.plugin/nut/)** - load, charge, battery voltage, temperature, utility metrics, output metrics. -- **[Linux Power Supply](collectors/proc.plugin/)** - collects metrics reported by power supply drivers on Linux. - -#### Social Sharing Servers - -- **[RetroShare](collectors/python.d.plugin/retroshare/)** - connects to multiple retroshare servers (local or remote) to collect real-time performance metrics. - -#### Security - -- **[Fail2Ban](collectors/python.d.plugin/fail2ban/)** - monitors the fail2ban log file to check all bans for all active jails. - -#### Authentication, Authorization, Accounting (AAA, RADIUS, LDAP) Servers - -- **[FreeRadius](collectors/python.d.plugin/freeradius/)** - uses the `radclient` command to provide freeradius statistics (authentication, accounting, proxy-authentication, proxy-accounting). - -#### Telephony Servers - -- **[opensips](collectors/charts.d.plugin/opensips/)** - connects to an opensips server (localhost only) to collect real-time performance metrics. - -#### Household Appliances - -- **[SMA webbox](collectors/node.d.plugin/sma_webbox/)** - connects to multiple remote SMA webboxes to collect real-time performance metrics of the photovoltaic (solar) power generation. -- **[Fronius](collectors/node.d.plugin/fronius/)** - connects to multiple remote Fronius Symo servers to collect real-time performance metrics of the photovoltaic (solar) power generation. -- **[StiebelEltron](collectors/node.d.plugin/stiebeleltron/)** - collects the temperatures and other metrics from your Stiebel Eltron heating system using their Internet Service Gateway (ISG web). - -#### Game Servers - -- **[SpigotMC](collectors/python.d.plugin/spigotmc/)** - monitors Spigot Minecraft server ticks per second and number of online players using the Minecraft remote console. - -#### Distributed Computing - -- **[BOINC](collectors/python.d.plugin/boinc/)** - monitors task states for local and remote BOINC client software using the remote GUI RPC interface. Also provides alarms for a handful of error conditions. - -#### Media Streaming Servers - -- **[IceCast](collectors/python.d.plugin/icecast/)** - collects the number of listeners for active sources. - -### Monitoring Systems - -- **[Monit](collectors/python.d.plugin/monit/)** - collects metrics about monit targets (filesystems, applications, networks). - -#### Provisioning Systems - -- **[Puppet](collectors/python.d.plugin/puppet/)** - connects to multiple Puppet Server and Puppet DB instances (local or remote) to collect real-time status metrics. - -You can easily extend Netdata, by writing plugins that collect data from any source, using any computer language. - ---- +[](https://my-netdata.io/infographic.html) ## Documentation -The Netdata documentation is at <https://docs.netdata.cloud>. But you can also find it inside the repo, so by just navigating the repo on github you can find all the documentation. - -Here is a quick list: - -|Directory|Description| -|:--------|:----------| -|[`installer`](packaging/installer/)|Instructions to install Netdata on your systems.| -|[`docker`](packaging/docker/)|Instructions to install Netdata using docker.| -|[`daemon`](daemon/)|Information about the Netdata daemon and its configuration.| -|[`collectors`](collectors/)|Information about data collection plugins.| -|[`health`](health/)|How Netdata's health monitoring works, how to create your own alarms and how to configure alarm notification methods.| -|[`streaming`](streaming/)|How to build hierarchies of Netdata servers, by streaming metrics between them.| -|[`backends`](backends/)|Long term archiving of metrics to industry standard time-series databases, like `prometheus`, `graphite`, `opentsdb`.| -|[`web/api`](web/api/)|Learn how to query the Netdata API and the queries it supports.| -|[`web/api/badges`](web/api/badges/)|Learn how to generate badges (SVG images) from live data.| -|[`web/gui/custom`](web/gui/custom/)|Learn how to create custom Netdata dashboards.| -|[`web/gui/confluence`](web/gui/confluence/)|Learn how to create Netdata dashboards on Atlassian's Confluence.| +Netdata's documentation is available at [**Netdata Learn**](https://learn.netdata.cloud). -You can also check all the other directories. Most of them have plenty of documentation. +This site also hosts a number of [guides](https://learn.netdata.cloud/guides) to help newer users better understand how +to collect metrics, troubleshoot via charts, export to external databases, and more. ## Community -We welcome [contributions](CONTRIBUTING.md). So, feel free to join the team. - -To report bugs, or get help, use [GitHub Issues](https://github.com/netdata/netdata/issues). +You can find most of the Netdata team in our [community forum](https://community.netdata.cloud). It's the best place to +ask questions, find resources, and get to know the Netdata team. You can also find Netdata on: - [Facebook](https://www.facebook.com/linuxnetdata/) - [Twitter](https://twitter.com/linuxnetdata) -- [OpenHub](https://www.openhub.net/p/netdata) -- [Repology](https://repology.org/metapackage/netdata/versions) - [StackShare](https://stackshare.io/netdata) +- [Product Hunt](https://www.producthunt.com/posts/netdata-monitoring-agent/) +- [Repology](https://repology.org/metapackage/netdata/versions) -## License +## Contribute + +We welcome [contributions](/CONTRIBUTING.md) to our code and to our +[documentation](/docs/contributing/contributing-documentation.md). Feel free to join the team! -Netdata is [GPLv3+](LICENSE). +To report bugs or get help, use [GitHub's issues](https://github.com/netdata/netdata/issues). -Netdata re-distributes other open-source tools and libraries. Please check the [third party licenses](REDISTRIBUTED.md). +Package maintainers should read the guide on [building Netdata from source](/packaging/installer/methods/source.md) for +instructions on building each Netdata component from source and preparing a package. + +## License + +The Netdata Agent is [GPLv3+](/LICENSE). Netdata re-distributes other open-source tools and libraries. Please check the +[third party licenses](/REDISTRIBUTED.md). ## Is it any good? Yes. -_When people first hear about a new product, they frequently ask if it is any good. A Hacker News user [remarked](https://news.ycombinator.com/item?id=3067434):_ +_When people first hear about a new product, they frequently ask if it is any good. A Hacker News user +[remarked](https://news.ycombinator.com/item?id=3067434):_ -> Note to self: Starting immediately, all raganwald projects will have a “Is it any good?” section in the readme, and the answer shall be “yes.". +> Note to self: Starting immediately, all raganwald projects will have a “Is it any good?” section in the readme, and +> the answer shall be “yes.". So, we follow the tradition... - -## Is it awesome? - -[These people](https://github.com/netdata/netdata/stargazers) seem to like it. |