
diff options
| author | Daniel Baumann <daniel.baumann@progress-linux.org> | 2023-10-17 09:30:23 +0000 |
|---|---|---|
| committer | Daniel Baumann <daniel.baumann@progress-linux.org> | 2023-10-17 09:30:23 +0000 |
| commit | 517a443636daa1e8085cb4e5325524a54e8a8fd7 (patch) | |
| tree | 5352109cc7cd5122274ab0cfc1f887b685f04edf /README.md | |
| parent | Releasing debian version 1.42.4-1. (diff) | |
| download | netdata-517a443636daa1e8085cb4e5325524a54e8a8fd7.tar.xz netdata-517a443636daa1e8085cb4e5325524a54e8a8fd7.zip | |
Merging upstream version 1.43.0.
Signed-off-by: Daniel Baumann <daniel.baumann@progress-linux.org>
Diffstat (limited to 'README.md')
| -rw-r--r-- | README.md | 90 |
1 files changed, 71 insertions, 19 deletions
@@ -53,12 +53,26 @@ It scales nicely from just a single server to thousands of servers, even in comp - :bell: **Out of box Alerts**<br/> Comes with hundreds of alerts out of the box to detect common issues and pitfalls, revealing issues that can easily go unnoticed. It supports several notification methods to let you know when your attention is needed. +- 📖 **systemd Journal Logs Explorer** (beta, in the nightly release channel)<br/> + Provides a `systemd` journal logs explorer, to view, filter and analyze system and applications logs by directly accessing `systemd` journal files on individual hosts and infrastructure-wide logs centralization servers. + - :sunglasses: **Low Maintenance**<br/> Fully automated in every aspect: automated dashboards, out-of-the-box alerts, auto-detection and auto-discovery of metrics, zero-touch machine-learning, easy scalability and high availability, and CI/CD friendly. - :star: **Open and Extensible**<br/> Netdata is a modular platform that can be extended in all possible ways and it also integrates nicely with other monitoring solutions. +--- + +NEW: **Netdata and LOGS !** 🥳</br> + +Check the [systemd-journal plugin of Netdata](https://github.com/netdata/netdata/tree/master/collectors/systemd-journal.plugin), that allows you to view, explore, analyze and query `systemd` journal logs! +The plugin is available from Oct 3, 2023 to nightly channel users. + +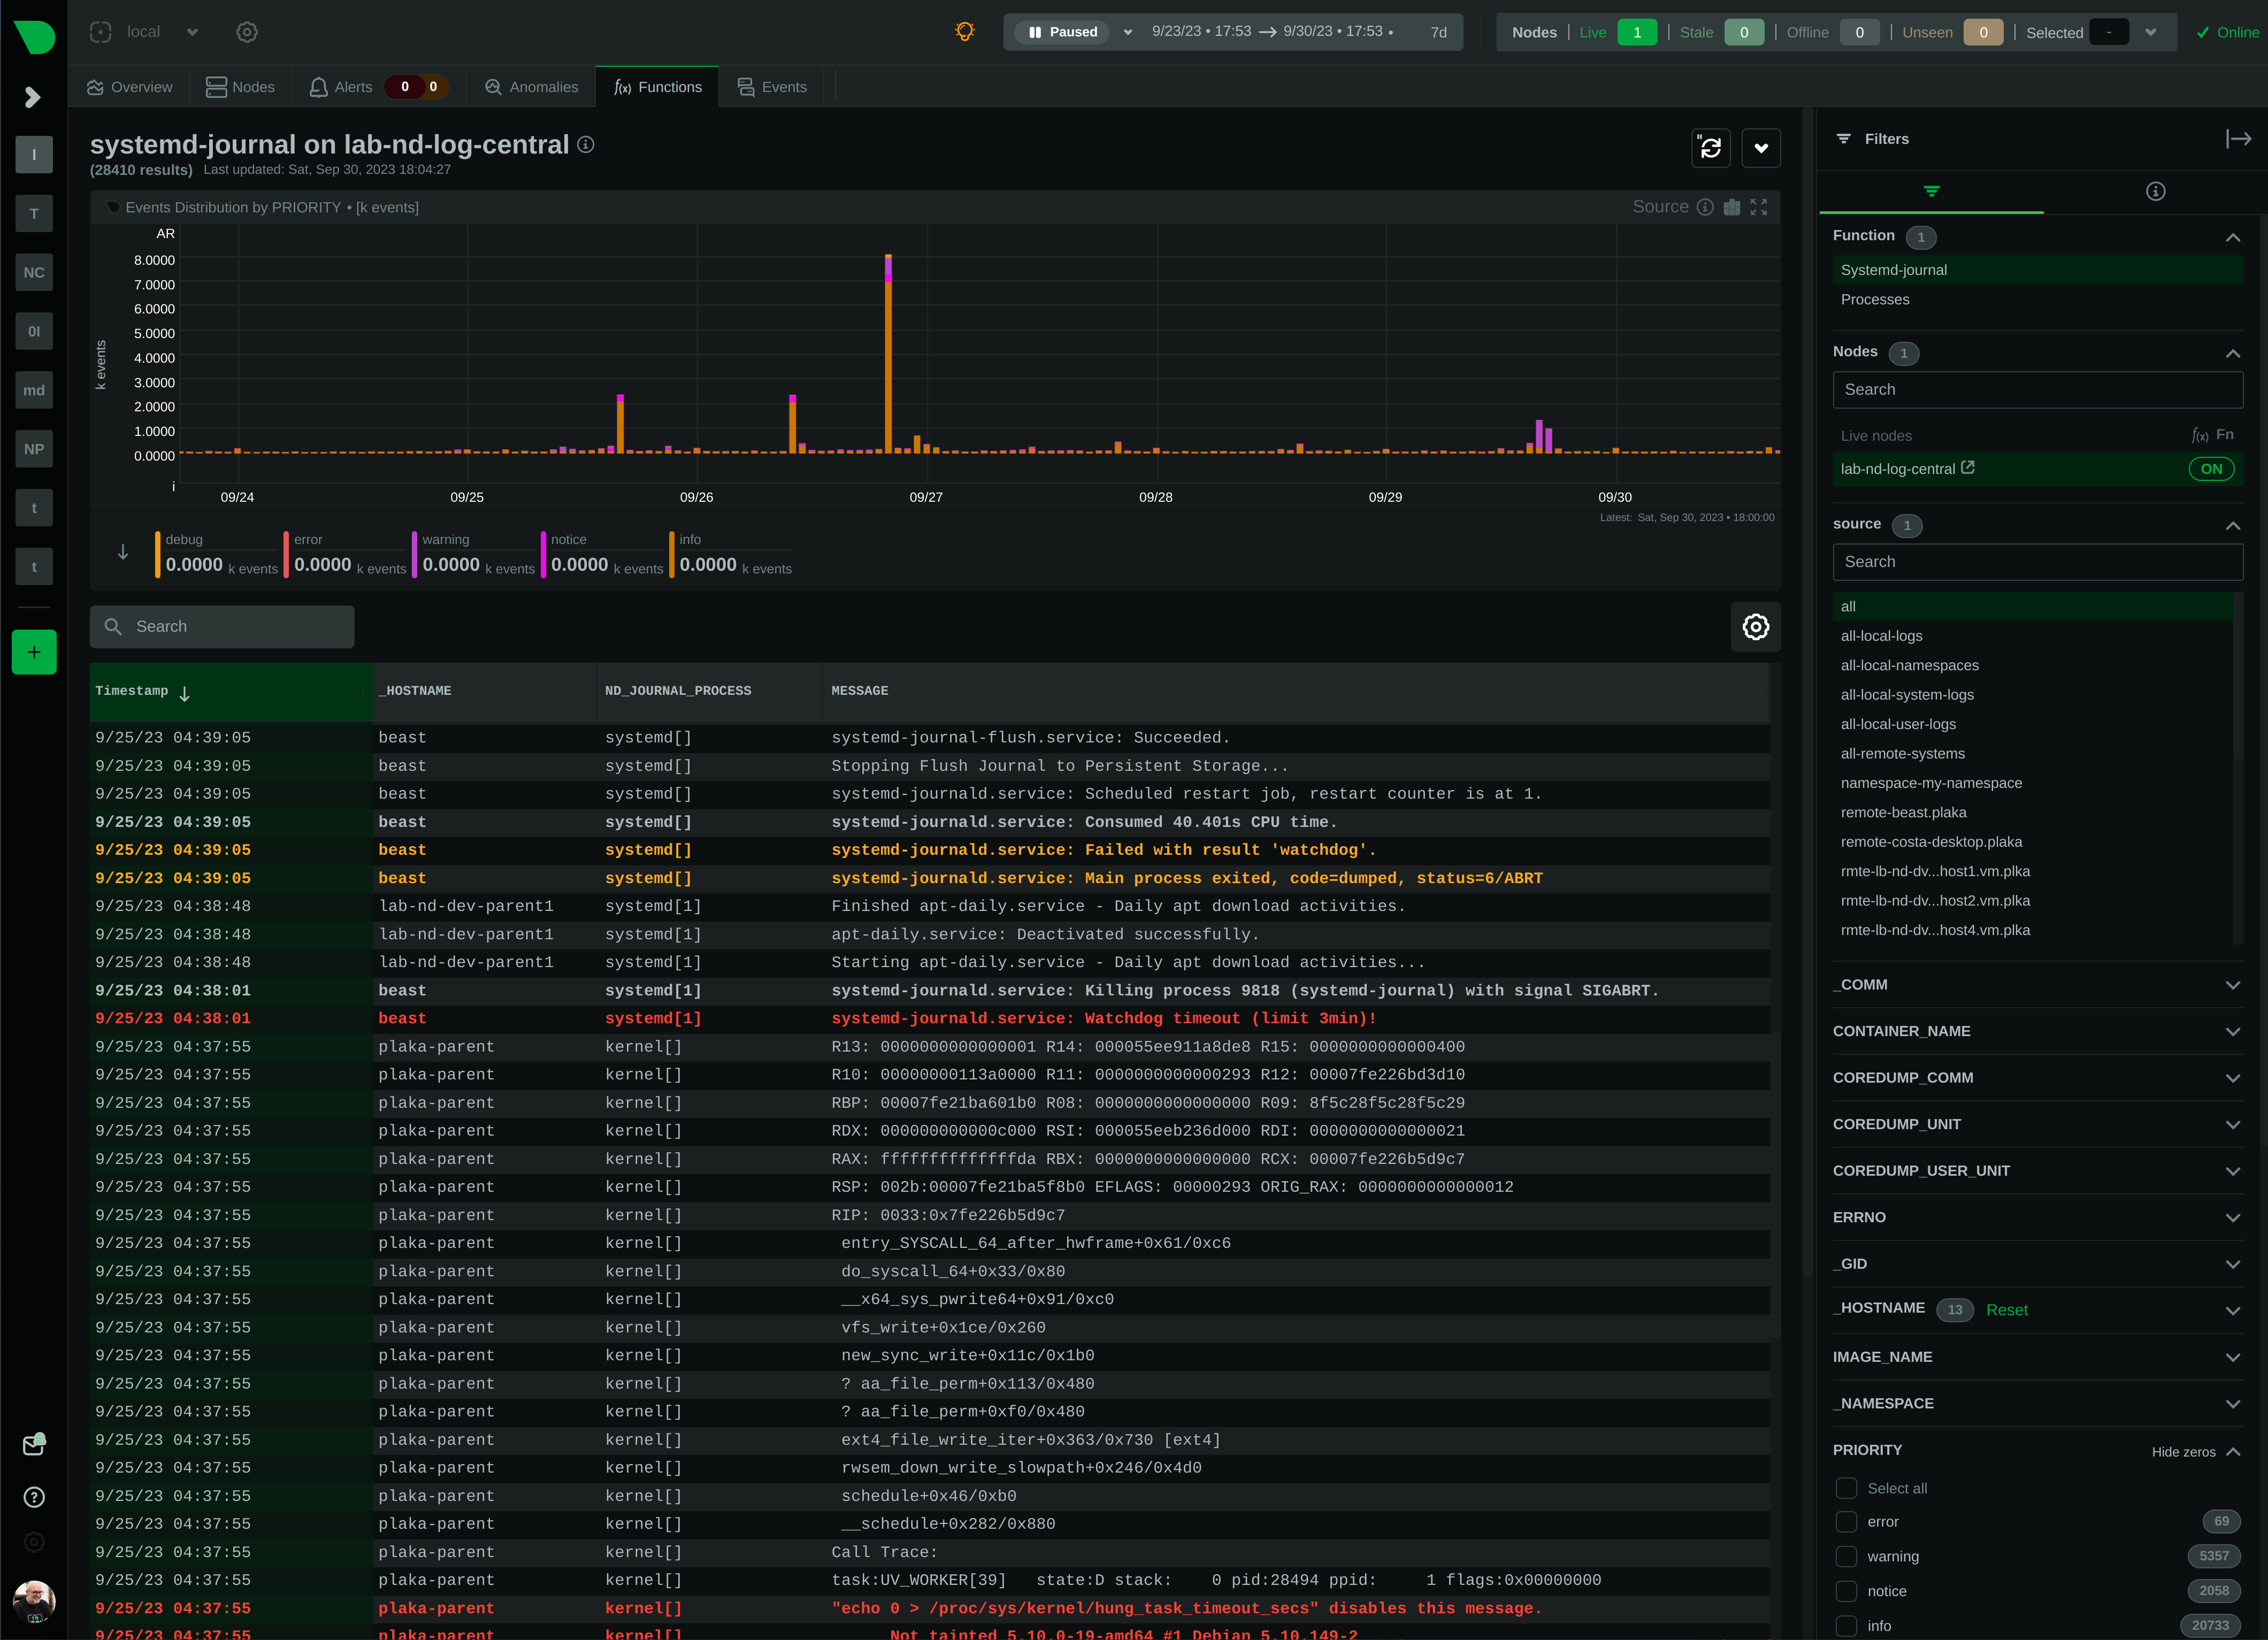 + +--- + <br/> <p align="center"> <img src="https://raw.githubusercontent.com/cncf/artwork/master/other/cncf/horizontal/white/cncf-white.svg#gh-dark-mode-only" alt="CNCF" width="300"> @@ -66,7 +80,7 @@ It scales nicely from just a single server to thousands of servers, even in comp <br /> Netdata actively supports and is a member of the Cloud Native Computing Foundation (CNCF)<br /> <br/> - ...and due to your love :heart:, it is the 3rd most :star:'d project in the <a href="https://landscape.cncf.io/card-mode?grouping=no&sort=stars">CNCF landscape</a>! + ...and due to your love :heart:, it is one of the most :star:'d projects in the <a href="https://landscape.cncf.io/card-mode?grouping=no&sort=stars">CNCF landscape</a>! </p> <br/> @@ -98,9 +112,6 @@ It scales nicely from just a single server to thousands of servers, even in comp ## What's New and Coming? -> **Spoiler!**<br/> -> Netdata Integrations Marketplace is coming... - <details><summary>Click to see our immediate development plans and a summary view of the last 12 months' releases...</summary> <br/> @@ -108,13 +119,13 @@ It scales nicely from just a single server to thousands of servers, even in comp |:-----------------------------:|:---------------------------------------------------------------------------------------------------:|:------------:|:-------------------------------------------------------------------------------------------------------:| | WebRTC | Browser to Agent communication via WebRTC. | later | POC | | Advanced Troubleshooting | Expanded view of dashboard charts integrating Metrics Correlations, Anomaly Advisor, and many more. | later | interrupted | -| Easy Custom<br/>Dashboards | Drag and drop charts to create custom dashboards on the fly, while troubleshooting! | next | planned | -| More Customizability | Set default settings for all charts and views! | next | planned | -| SystemD Journal | View the SystemD Journal of your systems on the dashboard. | soon | in progress | +| Easy Custom<br/>Dashboards | Drag and drop charts to create custom dashboards on the fly, while troubleshooting! | soon | planned | +| More Customizability | Set default settings for all charts and views! | soon | planned | +| `systemd` journal | View the `systemd` journal logs of your systems on the dashboard. | now | in nightly | | UCUM Units | Migrate all metrics to the Unified Code for Units of Measure. | soon | in progress | | **Netdata Cloud<br/>On-Prem** | **Netdata Cloud available for On-Prem installation!** | **soon** | **in progress** | | Click to Activate | Configure Alerts and Data Collectors from the UI! | soon | in progress | -| Integrations | Netdata Integrations Marketplace! | soon | finishing | +| Integrations | Netdata Integrations Marketplace! | Aug<br/>2023 | [v1.42](https://github.com/netdata/netdata/releases#v1420-integrations-marketplace) | | New Agent UI | Now Netdata Cloud and Netdata Agent share the same dashboard! | Jul<br/>2023 | [v1.41](https://github.com/netdata/netdata/releases/tag/v1.41.0#v1410-one-dashboard) | | Summary Dashboards | High level tiles everywhere! | Jun<br/>2023 | [v1.40](https://github.com/netdata/netdata/releases/tag/v1.40.0#v1400-visualization-summary-dashboards) | | Machine Learning | Multiple ML models per metric. | Jun<br/>2023 | [v1.40](https://github.com/netdata/netdata/releases/tag/v1.40.0#v1400-ml-extended-training) | @@ -168,6 +179,9 @@ It scales nicely from just a single server to thousands of servers, even in comp Check also the [Netdata Deployment Strategies](https://learn.netdata.cloud/docs/architecture/deployment-strategies) to decide how to deploy it in your infrastructure. + By default, you will have immediately available a local dashboard. Netdata starts a web server for its dashboard at port `19999`. Open up your web browser of choice and +navigate to `http://NODE:19999`, replacing `NODE` with the IP address or hostname of your Agent. If installed on localhost, you can access it through `http://localhost:19999`. + ### 2. **Configure Collectors** :boom: Netdata auto-detects and auto-discovers most operating system data sources and applications. However, many data sources require some manual configuration, usually to allow Netdata to get access to the metrics. @@ -180,7 +194,7 @@ It scales nicely from just a single server to thousands of servers, even in comp Netdata comes with hundreds of pre-configured alerts, that automatically check your metrics, immediately after they start getting collected. - Netdata can dispatch alert notifications to multiple third party systems, including: `email`, `Alerta`, `AWS SNS`, `Discord`, `Dynatrace`, `flock`, `gotify`, `IRC`, `Matrix`, `MessageBird`, `Microsoft Teams`, `ntfy`, `OPSgenie`, `PagerDuty`, `Prowl`, `PushBullet`, `PushOver`, `RocketChat`, `Slack`, `SMS tools`, `StackPulse`, `Syslog`, `Telegram`, `Twilio`. + Netdata can dispatch alert notifications to multiple third party systems, including: `email`, `Alerta`, `AWS SNS`, `Discord`, `Dynatrace`, `flock`, `gotify`, `IRC`, `Matrix`, `MessageBird`, `Microsoft Teams`, `ntfy`, `OPSgenie`, `PagerDuty`, `Prowl`, `PushBullet`, `PushOver`, `RocketChat`, `Slack`, `SMS tools`, `Syslog`, `Telegram`, `Twilio`. By default, Netdata will send e-mail notifications, if there is a configured MTA on the system. @@ -217,11 +231,12 @@ It scales nicely from just a single server to thousands of servers, even in comp When your Netdata nodes are connected to Netdata Cloud, you can (on top of the above): + - Access your Netdata agents from anywhere + - Access sensitive Netdata agent features (like "Netdata Functions": processes, systemd-journal) - Organize your infra in spaces and rooms - Create, manage, and share **custom dashboards** - Invite your team and assign roles to them (Role Based Access Control - RBAC) - - Access Netdata Functions (processes top from the UI and more) - - Get infinite horizontal scalability (multiple independent parents are viewed as one infra) + - Get infinite horizontal scalability (multiple independent Netdata Agents are viewed as one infra) - Configure alerts from the UI (coming soon) - Configure data collection from the UI (coming soon) - Netdata Mobile App notifications (coming soon) @@ -248,7 +263,7 @@ Each Netdata Agent can perform the following functions: 1. **`COLLECT` metrics from their sources**<br/> Uses [internal](https://github.com/netdata/netdata/tree/master/collectors) and [external](https://github.com/netdata/go.d.plugin/tree/master/modules) plugins to collect data from their sources. - Netdata auto-detects and collects almost everything from the operating system: including CPU, Interrupts, Memory, Disks, Mount Points, Filesystems, Network Stack, Network Interfaces, Containers, VMs, Processes, SystemD Units, Linux Performance Metrics, Linux eBPF, Hardware Sensors, IPMI, and more. + Netdata auto-detects and collects almost everything from the operating system: including CPU, Interrupts, Memory, Disks, Mount Points, Filesystems, Network Stack, Network Interfaces, Containers, VMs, Processes, `systemd` units, Linux Performance Metrics, Linux eBPF, Hardware Sensors, IPMI, and more. It collects application metrics from applications: PostgreSQL, MySQL/MariaDB, Redis, MongoDB, Nginx, Apache, and hundreds more. @@ -442,6 +457,8 @@ So, the biggest difference of Netdata to Prometheus, and Grafana, is that we dec Maintaining such an index is a challenge: first, because the raw metrics collected do not provide this information, so we have to add it, and second because we need to maintain this index for the lifetime of each metric, which with our current database retention, it is usually more than a year. + At the same time, Netdata provides better retention than Prometheus due to database tiering, scales easier than Prometheus due to streaming, supports anomaly detection and it has a mertrics scoring engine to find the needle in the haystack when needed. + - When compared to Grafana, Netdata is fully automated. Grafana has more customization capabilities than Netdata, but Netdata presents fully functional dashboards by itself and most importantly it gives you the means to understand, analyze, filter, slice and dice the data without the need for you to edit queries or be aware of any peculiarities the underlying metrics may have. Furthermore, to help you when you need to find the needle in the haystack, Netdata has advanced troubleshooting tools provided by the Netdata metrics scoring engine, that allows it to score metrics based on their anomaly rate, their differences or similarities for any given time frame. @@ -545,12 +562,14 @@ Subscribing to Netdata Cloud is optional but many users find it enhances their e The Netdata Agent dashboard and the Netdata Cloud dashboard are the same. Still, Netdata Cloud provides additional features, that the Netdata Agent is not capable of. These include: - 1. Customizability (custom dashboards and other settings are persisted when you are signed in to Netdata Cloud) - 2. Configuration of Alerts and Data Collection from the UI (coming soon) - 3. Security (role-based access control - RBAC). - 4. Horizontal Scalability ("blend" multiple independent parents in one uniform infrastructure) - 5. Central Dispatch of Alert Notifications (even when multiple independent parents are involved) - 6. Mobile App for Alert Notifications (coming soon) + 1. Access your infrastructure from anywhere. + 2. Have SSO to protect sensitive features. + 3. Customizability (custom dashboards and other settings are persisted when you are signed in to Netdata Cloud) + 4. Configuration of Alerts and Data Collection from the UI (coming soon) + 5. Security (role-based access control - RBAC). + 6. Horizontal Scalability ("blend" multiple independent parents in one uniform infrastructure) + 7. Central Dispatch of Alert Notifications (even when multiple independent parents are involved) + 8. Mobile App for Alert Notifications (coming soon) So, although it is not required, you can get the most out of your Netdata setup by using Netdata Cloud. @@ -646,6 +665,39 @@ The Netdata Cloud UI is not open-source. But we thought that it is to the benefi <br/> <br/> </details> +### :moneybag: What is your monetization strategy? + +Netdata generates revenue through subscriptions to advanced features of Netdata Cloud and sales of on-premise and private versions of Netdata Cloud. + +<details><summary>Click to see detailed answer ...</summary> + <br/> <br/> + +Netdata generates revenue from these activities: + +1. **Netdata Cloud Subscriptions**<br/> + Direct funding for our project's vision comes from users subscribing to Netdata Cloud's advanced features. + +2. **Netdata Cloud On-Prem or Private**<br/> + Purchasing the on-premises or private versions of Netdata Cloud supports our financial growth. + +Our Open-Source Community and the free access to Netdata Cloud, contribute to Netdata in the following ways: + +- **Netdata Cloud Community Use**<br/> + The free usage of Netdata Cloud demonstrates its market relevance. While this doesn't generate revenue, it reinforces trust among new users and aids in securing appropriate project funding. + +- **User Feedback**<br/> + Feedback, especially issues and bug reports, is invaluable. It steers us towards a more resilient and efficient product. This, too, isn't a revenue source but is pivotal for our project's evolution. + +- **Anonymous Telemetry Insights**<br/> + Users who keep anonymous telemetry enabled, help us make data informed decisions in refining and enhancing Netdata. This isn't a revenue stream, but knowing which features are used and how, contributes in building a better product for everyone. + +We don't monetize, directly or indirectly, users' or "device heuristics" data. Any data collected from community members are exclusively used for the purposes stated above. + +Netdata grows financially when tehnnology intensive organizations and operators, need - due to regulatory or business requirements - the entire Netdata suite (including Netdata Cloud) on-prem or private, bundled with top-tier support. It is a win-win case for all parties involved: these companies get a battle tested, robust and reliable solution, while the broader community that helps us build this product, enjoys it at no cost. + + <br/> <br/> +</details> + ## :book: Documentation Netdata's documentation is available at [**Netdata Learn**](https://learn.netdata.cloud). @@ -675,7 +727,7 @@ Join the Netdata community: > [Click here for the schedule](https://www.meetup.com/netdata/events/). You can also find Netdata on:<br/> -[Twitter](https://twitter.com/linuxnetdata) | [YouTube](https://www.youtube.com/c/Netdata) | [Reddit](https://www.reddit.com/r/netdata/) | [LinkedIn](https://www.linkedin.com/company/netdata-cloud/) | [StackShare](https://stackshare.io/netdata) | [Product Hunt](https://www.producthunt.com/posts/netdata-monitoring-agent/) | [Repology](https://repology.org/metapackage/netdata/versions) | [Facebook](https://www.facebook.com/linuxnetdata/) +[Twitter](https://twitter.com/netdatahq) | [YouTube](https://www.youtube.com/c/Netdata) | [Reddit](https://www.reddit.com/r/netdata/) | [LinkedIn](https://www.linkedin.com/company/netdata-cloud/) | [StackShare](https://stackshare.io/netdata) | [Product Hunt](https://www.producthunt.com/posts/netdata-monitoring-agent/) | [Repology](https://repology.org/metapackage/netdata/versions) | [Facebook](https://www.facebook.com/linuxnetdata/) ## :pray: Contribute |