
diff options
| author | Daniel Baumann <daniel.baumann@progress-linux.org> | 2023-08-10 09:18:52 +0000 |
|---|---|---|
| committer | Daniel Baumann <daniel.baumann@progress-linux.org> | 2023-08-10 09:19:08 +0000 |
| commit | a2d7dede737947d7c6afa20a88e1f0c64e0eb96c (patch) | |
| tree | fed4aff7dbe0be00cf91de6261d98bc0eb9a2449 /README.md | |
| parent | Releasing debian version 1.41.0-1. (diff) | |
| download | netdata-a2d7dede737947d7c6afa20a88e1f0c64e0eb96c.tar.xz netdata-a2d7dede737947d7c6afa20a88e1f0c64e0eb96c.zip | |
Merging upstream version 1.42.0.
Signed-off-by: Daniel Baumann <daniel.baumann@progress-linux.org>
Diffstat (limited to 'README.md')
| -rw-r--r-- | README.md | 371 |
1 files changed, 301 insertions, 70 deletions
@@ -25,9 +25,14 @@ <a href="https://community.netdata.cloud"><img alt="Discourse topics" src="https://img.shields.io/discourse/topics?server=https%3A%2F%2Fcommunity.netdata.cloud%2F&logo=discourse&label=discourse%20forum"></a> <a href="https://github.com/netdata/netdata/discussions"><img alt="GitHub Discussions" src="https://img.shields.io/github/discussions/netdata/netdata?logo=github&label=github%20discussions"></a> </p> + +<p align="center"><b>Visit the <a href="https://www.netdata.cloud">Project's Home Page</a></b></p> + <hr class="solid"> -Netdata collects metrics per second and presents them in beautiful low-latency dashboards. It is designed to run on all of your physical and virtual servers, cloud deployments, Kubernetes clusters, and edge/IoT devices, to monitor your systems, containers and applications. +MENU: **[WHAT IS NEW](#whats-new-and-coming)** | **[GETTING STARTED](#getting-started)** | **[HOW IT WORKS](#how-it-works)** | **[FAQ](#faq)** | **[DOCS](#book-documentation)** | **[COMMUNITY](#tada-community)** | **[CONTRIBUTE](#pray-contribute)** + +Netdata collects metrics per second and presents them in beautiful low-latency dashboards. It is designed to run on all of your physical and virtual servers, cloud deployments, Kubernetes clusters, and edge/IoT devices, to monitor your systems, containers, and applications. It scales nicely from just a single server to thousands of servers, even in complex multi/mixed/hybrid cloud environments, and given enough disk space it can keep your metrics for years. @@ -49,7 +54,7 @@ It scales nicely from just a single server to thousands of servers, even in comp Comes with hundreds of alerts out of the box to detect common issues and pitfalls, revealing issues that can easily go unnoticed. It supports several notification methods to let you know when your attention is needed. - :sunglasses: **Low Maintenance**<br/> - Fully automated in every aspect: automated dashboards, out-of-the-box alerts, auto-detection and auto-discovery of metrics, zero-touch machine-learning, easy scalability and high availability and CI/CD friendly. + Fully automated in every aspect: automated dashboards, out-of-the-box alerts, auto-detection and auto-discovery of metrics, zero-touch machine-learning, easy scalability and high availability, and CI/CD friendly. - :star: **Open and Extensible**<br/> Netdata is a modular platform that can be extended in all possible ways and it also integrates nicely with other monitoring solutions. @@ -67,6 +72,21 @@ It scales nicely from just a single server to thousands of servers, even in comp <hr class="solid"> +<p align="center"> + <b>Below is an animated image, but you can see Netdata live!</b><br/> + <a href="https://frankfurt.netdata.rocks"><b>FRANKFURT</b></a> | + <a href="https://newyork.netdata.rocks"><b>NEWYORK</b></a> | + <a href="https://atlanta.netdata.rocks"><b>ATLANTA</b></a> | + <a href="https://sanfrancisco.netdata.rocks"><b>SANFRANCISCO</b></a> | + <a href="https://toronto.netdata.rocks"><b>TORONTO</b></a> | + <a href="https://singapore.netdata.rocks"><b>SINGAPORE</b></a> | + <a href="https://bangalore.netdata.rocks"><b>BANGALORE</b></a> + <br/> + <i>They are clustered Netdata Parents. They all have the same data. <b>Select the one closer to you.</b></i> + <br/> + <i>All these run with the default configuration. We only clustered them to have multi-node dashboards.</i> +</p> +  <hr class="solid"> @@ -79,40 +99,42 @@ It scales nicely from just a single server to thousands of servers, even in comp ## What's New and Coming? > **Spoiler!**<br/> -> The nightly version of the Netdata Agent has a new UI that is planned to be released July 19th 2023. +> Netdata Integrations Marketplace is coming... <details><summary>Click to see our immediate development plans and a summary view of the last 12 months' releases...</summary> <br/> -| When | Status | What | Description| -|:----:|:------:|:----:|:-----------| -|later|POC|WebRTC|Browser to Agent communication via WebRTC.| -|later|interrupted|Advanced Troubleshooting|Expanded view of dashboard charts integrating Metrics Correlations, Anomaly Advisor and many more.| -|next|planned|Easy Custom<br/>Dashboards|Drag and drop charts to create custom dashboards on the fly, while troubleshooting!| -|next|planned|More Customizability|Set default settings for all charts and views!| -|soon|in progress|SystemD Journal|View the SystemD Journal of your systems on the dashboard.| -|soon|in progress|UCUM Units|Migrate all metrics to the Unified Code for Units of Measure.| -|**soon**|**in progress**|**Netdata Cloud<br/>On-Prem**|**Netdata Cloud available for On-Prem installation!**| -|soon|in progress|Click to Activate|Configure Alerts and Data Collectors from the UI!| -|soon|finishing|Integrations|Netdata Integrations Marketplace!| -|Jul<br/>2023|in the<br/>nightlies|New Agent UI|Now Netdata Cloud and Netdata Agent share the same dashboard!| -|Jun<br/>2023|[v1.40](https://github.com/netdata/netdata/releases/tag/v1.40.0)|Summary Dashboards|High level tiles everywhere!| -|||Machine Learning|Multiple ML models per metric.| -|||SSL|Netdata Agent gets a new SSL layer.| -|May<br/>2023|[v1.39](https://github.com/netdata/netdata/releases/tag/v1.39.0)|New Cloud UI|Filter, slice and dice any dataset from the UI! ML-first!| -|||Microsoft Windows|Monitor Windows hosts and apps!| -|||Virtual Nodes|Go collectors can now be assigned to virtual nodes!| -|Feb<br/>2023|[v1.38](https://github.com/netdata/netdata/releases/tag/v1.38.0)|DBENGINE v2|Faster, more reliable, far more scalable!| -|||Netdata Functions|Netdata beyond metrics! Monitoring anything!| -|||Events Feed|Live feed of events about topology changes and alerts.| -|||Role Based<br/>Access Control|More roles, offering finer control over access to infrastructure.| -|Nov<br/>2022|[v1.37](https://github.com/netdata/netdata/releases/tag/v1.37.0)|Infinite Scalability|Streaming compression. Replication. Active-active clustering.| -|||Grafana Plugin|Netdata Cloud as a data source for Grafana.| -|||PostgreSQL|Completely rewritten, to reveal all the info, even at the table level.| -|Aug<br/>2022|[v1.36](https://github.com/netdata/netdata/releases/tag/v1.36.0)|Metrics Correlations|Advanced algorithms to find the needle in the haystack.| -|||Database Tiering|Netdata gets unlimited retention!| -|||Kubernetes|Monitor your kubernetes workloads.| -|||Machine Learning|Anomaly Rate information on every chart.| +| What | Description | When | Status | +|:-----------------------------:|:---------------------------------------------------------------------------------------------------:|:------------:|:-------------------------------------------------------------------------------------------------------:| +| WebRTC | Browser to Agent communication via WebRTC. | later | POC | +| Advanced Troubleshooting | Expanded view of dashboard charts integrating Metrics Correlations, Anomaly Advisor, and many more. | later | interrupted | +| Easy Custom<br/>Dashboards | Drag and drop charts to create custom dashboards on the fly, while troubleshooting! | next | planned | +| More Customizability | Set default settings for all charts and views! | next | planned | +| SystemD Journal | View the SystemD Journal of your systems on the dashboard. | soon | in progress | +| UCUM Units | Migrate all metrics to the Unified Code for Units of Measure. | soon | in progress | +| **Netdata Cloud<br/>On-Prem** | **Netdata Cloud available for On-Prem installation!** | **soon** | **in progress** | +| Click to Activate | Configure Alerts and Data Collectors from the UI! | soon | in progress | +| Integrations | Netdata Integrations Marketplace! | soon | finishing | +| New Agent UI | Now Netdata Cloud and Netdata Agent share the same dashboard! | Jul<br/>2023 | [v1.41](https://github.com/netdata/netdata/releases/tag/v1.41.0#v1410-one-dashboard) | +| Summary Dashboards | High level tiles everywhere! | Jun<br/>2023 | [v1.40](https://github.com/netdata/netdata/releases/tag/v1.40.0#v1400-visualization-summary-dashboards) | +| Machine Learning | Multiple ML models per metric. | Jun<br/>2023 | [v1.40](https://github.com/netdata/netdata/releases/tag/v1.40.0#v1400-ml-extended-training) | +| SSL | Netdata Agent gets a new SSL layer. | Jun<br/>2023 | [v1.40](https://github.com/netdata/netdata/releases/tag/v1.40.0#v1400-streaming) | +| New Cloud UI | Filter, slice and dice any dataset from the UI! ML-first! | May<br/>2023 | [v1.39](https://github.com/netdata/netdata/releases/tag/v1.39.0) | +| Microsoft Windows | Monitor Windows hosts and apps! | May<br/>2023 | [v1.39](https://github.com/netdata/netdata/releases/tag/v1.39.0#v1390-windows-support) | +| Virtual Nodes | Go collectors can now be assigned to virtual nodes! | May<br/>2023 | [v1.39](https://github.com/netdata/netdata/releases/tag/v1.39.0#v1390-virtual-nodes-and-custom-labels) | +| DBENGINE v2 | Faster, more reliable, far more scalable! | Feb<br/>2023 | [v1.38](https://github.com/netdata/netdata/releases/tag/v1.38.0) | +| Netdata Functions | Netdata beyond metrics! Monitoring anything! | Feb<br/>2023 | [v1.38](https://github.com/netdata/netdata/releases/tag/v1.38.0#v1380-functions) | +| Events Feed | Live feed of events about topology changes and alerts. | Feb<br/>2023 | [v1.38](https://github.com/netdata/netdata/releases/tag/v1.38.0#v1380-feed) | +| Role Based<br/>Access Control | More roles, offering finer control over access to infrastructure. | Feb<br/>2023 | [v1.38](https://github.com/netdata/netdata/releases/tag/v1.38.0#v1380-rbac) | +| Infinite Scalability | Streaming compression. Replication. Active-active clustering. | Nov<br/>2022 | [v1.37](https://github.com/netdata/netdata/releases/tag/v1.37.0) | +| Grafana Plugin | Netdata Cloud as a data source for Grafana. | Nov<br/>2022 | [v1.37](https://github.com/netdata/netdata/releases/tag/v1.37.0#v1370-grafana-plugin) | +| PostgreSQL | Completely rewritten, to reveal all the info, even at the table level. | Nov<br/>2022 | [v1.37](https://github.com/netdata/netdata/releases/tag/v1.37.0#v1370-postgressql) | +| Metrics Correlations | Advanced algorithms to find the needle in the haystack. | Aug<br/>2022 | [v1.36](https://github.com/netdata/netdata/releases/tag/v1.36.0) | +| Database Tiering | Netdata gets unlimited retention! | Aug<br/>2022 | [v1.36](https://github.com/netdata/netdata/releases/tag/v1.36.0#v1360-tiering) | +| Kubernetes | Monitor your Kubernetes workloads. | Aug<br/>2022 | [v1.36](https://github.com/netdata/netdata/releases/tag/v1.36.0#v1360-kubernetes) | +| Machine Learning | Anomaly Rate information on every chart. | Aug<br/>2022 | [v1.36](https://github.com/netdata/netdata/releases/tag/v1.36.0#v1360-anomaly-rate-on-charts) | +| Machine Learning | Anomaly Advisor! Bottom-up unsupervised anomaly detection. | Jun<br/>2022 | [v1.35](https://github.com/netdata/netdata/releases/tag/v1.35.0#v1350-anomaly-advisor-ml) | +| Machine Learning | Metrics Correlation on the Agent. | Jun<br/>2022 | [v1.35](https://github.com/netdata/netdata/releases/tag/v1.35.0#v1350-metric-correlation-agent) | </details> @@ -121,20 +143,20 @@ It scales nicely from just a single server to thousands of servers, even in comp ## Getting Started <p align="center"> - <a href="https://registry.my-netdata.io/#menu_netdata_submenu_registry"><img src="https://registry.my-netdata.io/api/v1/badge.svg?chart=netdata.registry_entries&dimensions=persons&label=user%20base&units=M&value_color=blue&precision=2÷=1000000&options=unaligned&v44" alt="User base"></a> - <a href="https://registry.my-netdata.io/#menu_netdata_submenu_registry"><img src="https://registry.my-netdata.io/api/v1/badge.svg?chart=netdata.registry_entries&dimensions=machines&label=servers%20monitored&units=M÷=1000000&value_color=orange&precision=2&options=unaligned&v44" alt="Servers monitored"></a> - <a href="https://registry.my-netdata.io/#menu_netdata_submenu_registry"><img src="https://registry.my-netdata.io/api/v1/badge.svg?chart=netdata.registry_sessions&label=sessions%20served&units=M&value_color=yellowgreen&precision=2÷=1000000&options=unaligned&v44" alt="Sessions served"></a> - <a href="https://hub.docker.com/r/netdata/netdata"><img src="https://registry.my-netdata.io/api/v1/badge.svg?chart=dockerhub.pulls_sum÷=1000000&precision=1&units=M&label=docker+hub+pulls&options=unaligned&v44" alt="Docker Hub pulls"></a> + <a href="https://registry.my-netdata.io/#menu_netdata_submenu_registry"><img src="https://registry.my-netdata.io/api/v1/badge.svg?chart=netdata.registry_entries&dimensions=persons&label=user%20base&units=M&value_color=blue&precision=2÷=1000000&options=unaligned&tier=1&v44" alt="User base"></a> + <a href="https://registry.my-netdata.io/#menu_netdata_submenu_registry"><img src="https://registry.my-netdata.io/api/v1/badge.svg?chart=netdata.registry_entries&dimensions=machines&label=servers%20monitored&units=M÷=1000000&value_color=orange&precision=2&options=unaligned&tier=1&v44" alt="Servers monitored"></a> + <a href="https://registry.my-netdata.io/#menu_netdata_submenu_registry"><img src="https://registry.my-netdata.io/api/v1/badge.svg?chart=netdata.registry_sessions&label=sessions%20served&units=M&value_color=yellowgreen&precision=2÷=1000000&options=unaligned&tier=1&v44" alt="Sessions served"></a> + <a href="https://hub.docker.com/r/netdata/netdata"><img src="https://registry.my-netdata.io/api/v1/badge.svg?chart=dockerhub.pulls_sum÷=1000000&precision=1&units=M&label=docker+hub+pulls&options=unaligned&tier=1&v44" alt="Docker Hub pulls"></a> <br /> - <a href="https://registry.my-netdata.io/#menu_netdata_submenu_registry"><img src="https://registry.my-netdata.io/api/v1/badge.svg?chart=netdata.registry_entries&dimensions=persons&after=-86400&options=unaligned&group=incremental-sum&label=new%20users%20today&units=null&value_color=blue&precision=0&options=unaligned&v44" alt="New users today"></a> - <a href="https://registry.my-netdata.io/#menu_netdata_submenu_registry"><img src="https://registry.my-netdata.io/api/v1/badge.svg?chart=netdata.registry_entries&dimensions=machines&group=incremental-sum&after=-86400&options=unaligned&label=servers%20added%20today&units=null&value_color=orange&precision=0&v44" alt="New machines today"></a> - <a href="https://registry.my-netdata.io/#menu_netdata_submenu_registry"><img src="https://registry.my-netdata.io/api/v1/badge.svg?chart=netdata.registry_sessions&after=-86400&group=incremental-sum&options=unaligned&label=sessions%20served%20today&units=null&value_color=yellowgreen&precision=0&v44" alt="Sessions today"></a> - <a href="https://hub.docker.com/r/netdata/netdata"><img src="https://registry.my-netdata.io/api/v1/badge.svg?chart=dockerhub.pulls_sum÷=1000&precision=1&units=k&label=docker+hub+pulls&after=-86400&group=incremental-sum&label=docker%20hub%20pulls%20today&options=unaligned&v44" alt="Docker Hub pulls today"></a> + <a href="https://registry.my-netdata.io/#menu_netdata_submenu_registry"><img src="https://registry.my-netdata.io/api/v1/badge.svg?chart=netdata.registry_entries&dimensions=persons&after=-86400&options=unaligned&group=incremental-sum&label=new%20users%20today&units=null&value_color=blue&precision=0&options=unaligned&tier=1&v44" alt="New users today"></a> + <a href="https://registry.my-netdata.io/#menu_netdata_submenu_registry"><img src="https://registry.my-netdata.io/api/v1/badge.svg?chart=netdata.registry_entries&dimensions=machines&group=incremental-sum&after=-86400&options=unaligned&label=servers%20added%20today&units=null&value_color=orange&precision=0&tier=1&v44" alt="New machines today"></a> + <a href="https://registry.my-netdata.io/#menu_netdata_submenu_registry"><img src="https://registry.my-netdata.io/api/v1/badge.svg?chart=netdata.registry_sessions&after=-86400&group=incremental-sum&options=unaligned&label=sessions%20served%20today&units=null&value_color=yellowgreen&precision=0&tier=1&v44" alt="Sessions today"></a> + <a href="https://hub.docker.com/r/netdata/netdata"><img src="https://registry.my-netdata.io/api/v1/badge.svg?chart=dockerhub.pulls_sum÷=1000&precision=1&units=k&label=docker+hub+pulls&after=-86400&group=incremental-sum&label=docker%20hub%20pulls%20today&options=unaligned&tier=1&v44" alt="Docker Hub pulls today"></a> </p> ### 1. **Install Netdata everywhere** :v: - Netdata can be installed on all Linux, MacOS, and FreeBSD systems. We provide binary packages for the most popular operating systems and package managers. + Netdata can be installed on all Linux, macOS, and FreeBSD systems. We provide binary packages for the most popular operating systems and package managers. - Install on [Ubuntu, Debian CentOS, Fedora, Suse, Red Hat, Arch, Alpine, Gentoo, even BusyBox](https://learn.netdata.cloud/docs/installing/one-line-installer-for-all-linux-systems). - Install with [Docker](https://learn.netdata.cloud/docs/installing/docker).<br/> @@ -144,9 +166,11 @@ It scales nicely from just a single server to thousands of servers, even in comp - Install [from source](https://learn.netdata.cloud/docs/installing/build-the-netdata-agent-yourself/compile-from-source-code)  - For Kubernetes deployments [check here](https://learn.netdata.cloud/docs/installation/install-on-specific-environments/kubernetes/). + Check also the [Netdata Deployment Strategies](https://learn.netdata.cloud/docs/architecture/deployment-strategies) to decide how to deploy it in your infrastructure. + ### 2. **Configure Collectors** :boom: - Netdata auto-detects and auto-discovers most operating system data sources and applications. However, many data sources require some manual configuration, usually to allow Netdata get access to the metrics. + Netdata auto-detects and auto-discovers most operating system data sources and applications. However, many data sources require some manual configuration, usually to allow Netdata to get access to the metrics. - For a detailed list of the 800+ collectors available, check [this guide](https://learn.netdata.cloud/docs/data-collection/). - To monitor Windows servers and applications use [this guide](https://learn.netdata.cloud/docs/data-collection/monitor-anything/system-metrics/windows-machines). @@ -183,15 +207,15 @@ It scales nicely from just a single server to thousands of servers, even in comp You can also use Netdata Parents to: - - Offload your production systems (the parents runs ML, alerts, queries, etc for all its children) - - Secure your production systems (the parents accept user connections, for all its children) + - Offload your production systems (the parents run ML, alerts, queries, etc. for all their children) + - Secure your production systems (the parents accept user connections, for all their children) ### 5. **Connect to Netdata Cloud** :cloud: Optionally, [sign-in](https://app.netdata.cloud/sign-in) to [Netdata Cloud](https://www.netdata.cloud/) and claim your Netdata Agents and Parents. If you connect your Netdata Parents, there is no need to connect your Netdata Agents. They will be connected via the Parents. - When your Netdata are connected to Netdata Cloud, you can (on top of the above): + When your Netdata nodes are connected to Netdata Cloud, you can (on top of the above): - Organize your infra in spaces and rooms - Create, manage, and share **custom dashboards** @@ -256,10 +280,40 @@ Each Netdata Agent can perform the following functions: Provide an API to query the data and present interactive dashboards to users. 9. **`SCORE` metrics to reveal similarities and patterns**<br/> - Score the metrics according to given criteria, to find the needle in the haystack. + Score the metrics according to the given criteria, to find the needle in the haystack. When using Netdata Parents, all the functions of a Netdata Agent (except data collection) can be delegated to Parents to offload production systems. +The core of Netdata is developed in C. We have our own `libnetdata`, that provides: + +- **`DICTIONARY`**<br/> + A high-performance algorithm to maintain both indexed and ordered pools of structures Netdata needs. It uses JudyHS arrays for indexing, although it is modular: any hashtable or tree can be integrated into it. Despite being in C, dictionaries follow object-oriented programming principles, so there are constructors, destructors, automatic memory management, garbage collection, and more. For more see [here](https://github.com/netdata/netdata/tree/master/libnetdata/dictionary). + +- **`ARAL`**<br/> + ARray ALlocator (ARAL) is used to minimize the system allocations made by Netdata. ARAL is optimized for peak performance when multi-threaded. It also allows all structures that use it to be allocated in memory-mapped files (shared memory) instead of RAM. For more see [here](https://github.com/netdata/netdata/tree/master/libnetdata/aral). + +- **`PROCFILE`**<br/> + A high-performance `/proc` (but also any) file parser and text tokenizer. It achieves its performance by keeping files open and adjustings its buffers to read the entire file in one call (which is also required by the Linux kernel). For more see [here](https://github.com/netdata/netdata/tree/master/libnetdata/procfile). + +- **`STRING`**<br/> + A string internet mechanism, for string deduplication and indexing (using JudyHS arrays), optimized for multi-threaded usage. For more see [here](https://github.com/netdata/netdata/tree/master/libnetdata/string). + +- **`ARL`**<br/> + Adaptive Resortable List (ARL), is a very fast list iterator, that keeps the expected items on the list in the same order they are found in input list. So, the first iteration is somewhat slower, but all the following iterations are perfectly aligned for best performance. For more see [here](https://github.com/netdata/netdata/tree/master/libnetdata/adaptive_resortable_list). + +- **`BUFFER`**<br/> + A flexible text buffer management system that allows Netdata to automatically handle dynamically sized text buffer allocations. The same mechanism is used for generating consistent JSON output by the Netdata APIs. For more see [here](https://github.com/netdata/netdata/tree/master/libnetdata/buffer). + +- **`SPINLOCK`**<br/> + Like POSIX `MUTEX` and `RWLOCK` but a lot faster, based on atomic operations, with significantly smaller memory impact, while being portable. + +- **`PGC`**<br/> + A caching layer that can be used to cache any kind of time-related data, with automatic indexing (based on a tree of JudyL arrays), memory management, evictions, flushing, pressure management. This is extensively used in `dbengine`. For more see [here](https://github.com/netdata/netdata/blob/master/database/engine/README.md). + +The above, and many more, allow Netdata developers to work on the application fast and with confidence. Most of the business logic in Netdata is a work of mixing the above. + +Netdata data collection plugins can be developed in any language. Most of our application collectors though are developed in [Go](https://github.com/netdata/go.d.plugin). + </details> ## FAQ @@ -331,12 +385,16 @@ Netdata is designed to scale and can handle large volumes of data. <br/> <br/> Netdata is a distributed monitoring solution. You can scale it to infinity by spreading Netdata servers across your infrastructure. -With the streaming feature of Netdata Agents, we can support monitoring ephemeral servers, but also allow the creation of "monitoring islands" where metrics are aggregated to a few servers (Netdata Parents) for increased retention, or for offloading production systems. +With the streaming feature of the Agent, we can support monitoring ephemeral servers but also allow the creation of "monitoring islands" where metrics are aggregated to a few servers (Netdata Parents) for increased retention, or for offloading production systems. - - :airplane: Netdata Parents provide great vertical scalability, so you can have as big parents as the CPU, RAM and Disk resources you can dedicate to them. In our lab we constantly stress test Netdata Parents with about 2 million metrics collected per second. + - :airplane: Netdata Parents provide great vertical scalability, so you can have as big parents as the CPU, RAM and Disk resources you can dedicate to them. In our lab we constantly stress test Netdata Parents with several million metrics collected per second, to ensure it is reliable, stable, and robust at scale. - :rocket: In addition, Netdata Cloud provides virtually unlimited horizontal scalability. It "merges" all the Netdata parents you have into one unified infrastructure at query time. Netdata Cloud itself is probably the biggest single installation monitoring platform ever created, currently monitoring about 100k online servers with about 10k servers changing state (added/removed) per day! +Example: the following chart comes from a single Netdata Parent. As you can see on it, 244 nodes stream to it metrics of about 20k running containers. On this specific chart there are 3 dimensions per container, so a total of about 60k time-series queries are needed to present it. + +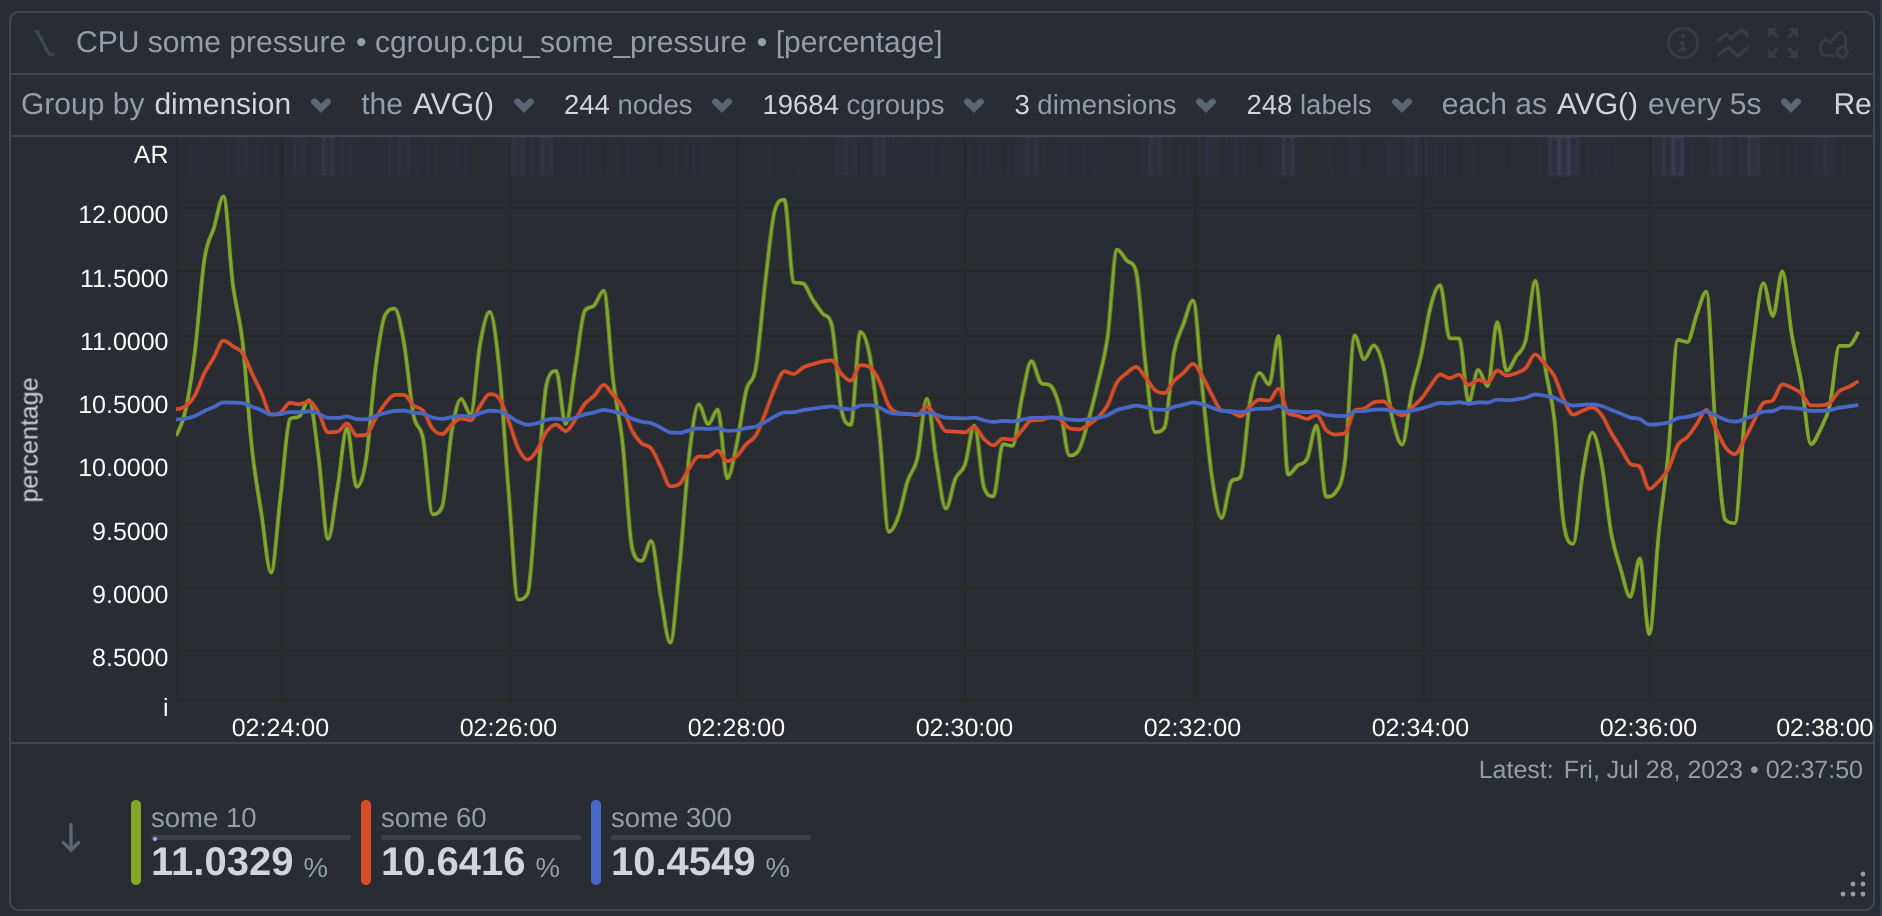 + <br/> <br/> </details> @@ -347,14 +405,20 @@ Yes, you can! <details><summary>Click to see detailed answer ...</summary> <br/> <br/> -We suggest the following: +Netdata has been designed to spread disk writes across time. Each metric is flushed to disk every 17 minutes, but metrics are flushed evenly across time, at an almost constant rate. Also, metrics are packed into bigger blocks we call `extents` and are compressed with LZ4 before saving them, to minimize the number of I/O operations made. + +Single node Agents (not Parents), should have a constant rate of about 50 KiB/s or less, with some spikes above that every minute (flushing of tier 1) and higher spikes every hour (flushing of tier 2). + +Health Alerts and Machine-Learning run queries to evaluate their expressions and learn from the metrics' patterns. These are also spread over time, so there should be an almost constant read rate too. + +To make Netdata not use the disks at all, we suggest the following: 1. Use database mode `alloc` or `ram` to disable writing metric data to disk. 2. Configure streaming to push in real-time all metrics to a Netdata Parent. The Netdata Parent will maintain metrics on disk for this node. 3. Disable ML and health on this node. The Netdata Parent will do them for this node. 4. Use the Netdata Parent to access the dashboard. -Using the above, the Netdata Agent on your production system will not need a disk. +Using the above, the Netdata Agent on your production system will not use a disk. <br/> <br/> </details> @@ -366,27 +430,112 @@ Netdata is a "ready to use" monitoring solution. Prometheus and Grafana are tool <details><summary>Click to see detailed answer ...</summary> <br/> <br/> -First we have to say that Prometheus as a time-series database and Grafana as a visualizer are excellent tools for what they do. +First, we have to say that Prometheus as a time-series database and Grafana as a visualizer are excellent tools for what they do. However, we believe that such a setup is missing a key element: A Prometheus and Grafana setup assumes that you know everything about the metrics you collect and you understand deeply how they are structured, they should be queried and visualized. -In reality this setup has a lot of problems. The vast number of technologies, operating systems, and applications we use in our modern stacks, makes it impossible for any single person to know and understand everything about anything. We get testimonials regularly from Netdata users across the biggest enterprises, that Netdata manages to reveal issues, anomalies and problems they were not aware of and they didn't even have the means to find or troubleshoot. +In reality, this setup has a lot of problems. The vast number of technologies, operating systems, and applications we use in our modern stacks, makes it impossible for any single person to know and understand everything about anything. We get testimonials regularly from Netdata users across the biggest enterprises, that Netdata manages to reveal issues, anomalies and problems they were not aware of and they didn't even have the means to find or troubleshoot. -So, the biggest difference of Netdata to Prometheus and Grafana, is that we decided that the tool needs to have a much better understanding of the components, the applications and the metrics it monitors. +So, the biggest difference of Netdata to Prometheus, and Grafana, is that we decided that the tool needs to have a much better understanding of the components, the applications, and the metrics it monitors. - - When compared to Prometheus, Netdata needs for each metric much more than just a name, some labels and a value over time. A metric in Netdata is a structured entity that correlates with other metrics in a certain way, has specific attributes that depict how it should be organized, treated, queried and visualized. We call this the NIDL (Nodes, Instances, Dimensions, Labels) framework. + - When compared to Prometheus, Netdata needs for each metric much more than just a name, some labels, and a value over time. A metric in Netdata is a structured entity that correlates with other metrics in a certain way and has specific attributes that depict how it should be organized, treated, queried, and visualized. We call this the NIDL (Nodes, Instances, Dimensions, Labels) framework. - To maintain such an index is a challenge: first because the raw metrics collected do not provide this information, so we have to add it, and second because we need to maintain this index for the lifetime of each metric, which with our current database retention, it is usually more than a year. + Maintaining such an index is a challenge: first, because the raw metrics collected do not provide this information, so we have to add it, and second because we need to maintain this index for the lifetime of each metric, which with our current database retention, it is usually more than a year. - When compared to Grafana, Netdata is fully automated. Grafana has more customization capabilities than Netdata, but Netdata presents fully functional dashboards by itself and most importantly it gives you the means to understand, analyze, filter, slice and dice the data without the need for you to edit queries or be aware of any peculiarities the underlying metrics may have. - Furthermore, to help you when you need to find the needle in the haystack, Netdata has advanced troubleshooting tools provided by the Netdata metrics scoring engine, that allows it to score metrics based on their anomaly rate, their differences or similarities for any given time-frame. + Furthermore, to help you when you need to find the needle in the haystack, Netdata has advanced troubleshooting tools provided by the Netdata metrics scoring engine, that allows it to score metrics based on their anomaly rate, their differences or similarities for any given time frame. Still, if you are already familiar with Prometheus and Grafana, Netdata integrates nicely with them, and we have reports from users who use Netdata with Prometheus and Grafana in production. <br/> <br/> </details> +### :raised_eyebrow: How is Netdata different from DataDog, New Relic, Dynatrace, X SaaS Provider? + +With Netdata your data are always on-prem and your metrics are always high-resolution. + +<details><summary>Click to see detailed answer ...</summary> + <br/> <br/> + +Most commercial monitoring providers face a significant challenge: they centralize all metrics to their infrastructure and this is, inevitably, expensive. It leads them to one or more of the following: + + 1. be unrealistically expensive + 2. limit the number of metrics they collect + 3. limit the resolution of the metrics they collect + +As a result, they try to find a balance: collect the least possible data, but collect enough to have something useful out of it. + +We, at Netdata, see monitoring in a completely different way: **monitoring systems should be built bottom-up and be rich in insights**, so we focus on each component individually to collect, store, check and visualize everything related to each of them, and we make sure that all components are monitored. Each metric is important. + +This is why Netdata trains multiple machine-learning models per metric, based exclusively on their own past (no sampling of data, no sharing of trained models) to detect anomalies based on the specific use case and workload each component is used. + +This is also why Netdata alerts are attached to components (instances) and are configured with dynamic thresholds and rolling windows, instead of static values. + +The distributed nature of Netdata helps scale this approach: your data is spread inside your infrastructure, as close to the edge as possible. Netdata is not one data lane. Each Netdata Agent is a data lane and all of them together build a massive distributed metrics processing pipeline that ensures all your infrastructure components and applications are monitored and operating as they should. + + <br/> <br/> +</details> + +### :raised_eyebrow: How is Netdata different from Nagios, Icinga, Zabbix, etc? + +Netdata offers real-time, comprehensive monitoring, with a user-friendly interface and the ability to monitor everything, without any custom configuration required. + +<details><summary>Click to see detailed answer ...</summary> + <br/> <br/> + +While Nagios, Icinga, Zabbix, and other similar tools are powerful and highly customizable, they can be complex to set up and manage. Their flexibility often comes at the cost of ease-of-use, especially for users who are not systems administrators or do not have extensive experience with these tools. Additionally, these tools generally require you to know what you want to monitor in advance and configure it explicitly. + +Netdata, on the other hand, takes a different approach. It provides a "ready to use" monitoring solution with a focus on simplicity and comprehensiveness. It automatically detects and starts monitoring many different system metrics and applications out-of-the-box, without any need for custom configuration. + +In comparison to these traditional monitoring tools, Netdata: + + - Provides real-time, high-resolution metrics, as opposed to the often minute-level granularity that tools like Nagios, Icinga, and Zabbix provide. + + - Automatically generates meaningful, organized, and interactive visualizations of the collected data. Unlike other tools, where you have to manually create and organize graphs and dashboards, Netdata takes care of this for you. + + - Applies machine learning to each individual metric to detect anomalies, providing more insightful and relevant alerts than static thresholds. + + - Is designed to be distributed, so your data is spread inside your infrastructure, as close to the edge as possible. This approach is more scalable and avoids the potential bottleneck of a single centralized server. + + - Has a more modern and user-friendly interface, making it easy for anyone, not just experienced administrators, to understand the health and performance of their systems. + +Even if you're already using Nagios, Icinga, Zabbix, or similar tools, you can use Netdata alongside them to augment your existing monitoring capabilities with real-time insights and user-friendly dashboards. + + <br/> <br/> +</details> + +### :flushed: I feel overwhelmed by the amount of information in Netdata. What should I do? + +Netdata is designed to provide comprehensive insights, but we understand that the richness of information might sometimes feel overwhelming. Here are some tips on how to navigate and utilize Netdata effectively... + +<details><summary>Click to see detailed answer ...</summary> + <br/> <br/> + +Netdata is indeed a very comprehensive monitoring tool. It's designed to provide you with as much information as possible about your system and applications, so that you can understand and address any issues that arise. However, we understand that the sheer amount of data can sometimes be overwhelming. + +Here are some suggestions on how to manage and navigate this wealth of information: + + 1. **Start with the Overview Dashboard**<br/> + Netdata's Overview Dashboard provides a high-level summary of your system's status. We have added summary tiles on almost every section, you reveal the information that is more important. This is a great place to start, as it can help you identify any major issues or trends at a glance. + + 2. **Use the Search Feature**<br/> + If you're looking for specific information, you can use the search feature to find the relevant metrics or charts. This can help you avoid scrolling through all the data. + + 3. **Customize your Dashboards**<br/> + Netdata allows you to create custom dashboards, which can help you focus on the metrics that are most important to you. Sign-in to Netdata and there you can have your custom dashboards. (coming soon to the agent dashboard too) + + 4. **Leverage Netdata's Anomaly Detection**<br/> + Netdata uses machine learning to detect anomalies in your metrics. This can help you identify potential issues before they become major problems. We have added an `AR` button above the dashboard table of contents to reveal the anomaly rate per section so that you can easily spot what could need your attention. + + 5. **Take Advantage of Netdata's Documentation and Blogs**<br/> + Netdata has extensive documentation that can help you understand the different metrics and how to interpret them. You can also find tutorials, guides, and best practices there. + +Remember, it's not necessary to understand every single metric or chart right away. Netdata is a powerful tool, and it can take some time to fully explore and understand all of its features. Start with the basics and gradually delve into more complex metrics as you become more comfortable with the tool. + + <br/> <br/> +</details> + ### :cloud: Do I have to subscribe to Netdata Cloud? Subscribing to Netdata Cloud is optional but many users find it enhances their experience with Netdata. @@ -403,21 +552,96 @@ The Netdata Agent dashboard and the Netdata Cloud dashboard are the same. Still, 5. Central Dispatch of Alert Notifications (even when multiple independent parents are involved) 6. Mobile App for Alert Notifications (coming soon) -So, although it is not required, you can get the most out of your Netdata installation by using Netdata Cloud. +So, although it is not required, you can get the most out of your Netdata setup by using Netdata Cloud. + +We encourage you to support Netdata by buying a Netdata Cloud subscription. A successful Netdata is a Netdata that evolves and gets improved to provide a simpler, faster and easier monitoring for all of us. + +For organizations that need a fully on-prem solution, we provide Netdata Cloud for on-prem installation. [Contact us for more information](mailto:info@netdata.cloud). + + <br/> <br/> +</details> + +### :mag_right: What does the anonymous telemetry collected by Netdata entail? + +Your privacy is our utmost priority. As part of our commitment to improving Netdata, we rely on anonymous telemetry data from our users who choose to leave it enabled. This data greatly informs our decision-making processes and contributes to the future evolution of Netdata. + +Should you wish to disable telemetry, instructions for doing so are provided in our installation guides. + +<details><summary>Click to see detailed answer ...</summary> + <br/> <br/> + +Netdata is in a constant state of growth and evolution. The decisions that guide this development are ideally rooted in data. By analyzing anonymous telemetry data, we can answer questions such as: "What features are being used frequently?", "How do we prioritize between potential new features?" and "What elements of Netdata are most important to our users?" + +By leaving anonymous telemetry enabled, users indirectly contribute to shaping Netdata's roadmap, providing invaluable information that helps us prioritize our efforts for the project and the community. + +We are aware that for privacy or regulatory reasons, not all environments can allow telemetry. To cater to this, we have simplified the process of disabling telemetry: + +- During installation, you can append `--disable-telemetry` to our `kickstart.sh` script, or +- Create the file `/etc/netdata/.opt-out-from-anonymous-statistics` and then restart Netdata. + +These steps will disable the anonymous telemetry for your Netdata installation. + +Please note, even with telemetry disabled, Netdata still requires a [Netdata Registry](https://learn.netdata.cloud/docs/configuring/securing-netdata-agents/registry) for alert notifications' Call To Action (CTA) functionality. When you click an alert notification, it redirects you to the Netdata Registry, which then directs your web browser to the specific Netdata Agent that issued the alert for further troubleshooting. The Netdata Registry learns the URLs of your agents when you visit their dashboards. + +Any Netdata Agent can act as a Netdata Registry. Simply designate one Netdata Agent as your registry, and our global Netdata Registry will no longer be in use. For further information on this, please refer to [this guide](https://learn.netdata.cloud/docs/configuring/securing-netdata-agents/registry). + + <br/> <br/> +</details> + +### :smirk: Who uses Netdata? + +Netdata is a widely adopted project... + +<details><summary>Click to see detailed answer ...</summary> + <br/> <br/> + +Browse the [Netdata stargazers on GitHub](https://github.com/netdata/netdata/stargazers) to discover users from renowned companies and enterprises, such as AMD, Amazon, Baidu, Cisco, Delta, Facebook, IBM, Intel, Netflix, Qualcomm, Riot Games, SAP, Samsung, Unity, Valve, and many others. + +Netdata also enjoys significant usage in academia, with notable institutions including New York University, Columbia University, New Jersey University, among several others. + +And, Netdata is also used by numerous governmental organizations worldwide. + +In a nutshell, Netdata proves invaluable for: + +- **Infrastructure intensive organizations**<br/> + Such as hosting/cloud providers and companies with hundreds or thousands of nodes, who require a high-resolution, real-time monitoring solution for a comprehensive view of all their components and applications. + +- **Technology operators**<br/> + Those in need of a standardized, comprehensive solution for round-the-clock operations. Netdata not only facilitates operational automation and provides controlled access for their operations engineers, but also enhances skill development over time. + +- **Technology startups**<br/> + Who seek a feature-rich monitoring solution from the get-go. + +- **Freelancers**<br/> + Who seek a simple, efficient and straightforward solution without sacrificing performance and outcomes. + +- **Professional SysAdmins and DevOps**<br/> + Who appreciate the fine details and understand the value of holistic monitoring from the ground up. + +- **Everyone else**<br/> + All of us, who are tired of the inefficiency in the monitoring industry and would love a refreshing change and a breath of fresh air. :slightly_smiling_face: <br/> <br/> </details> -### :office: Who uses Netdata? +### :globe_with_meridians: Is Netdata open-source? -Netdata is a popular project. Almost everyone uses it. +The Netdata Agent back-end is entirely open-source. We ship 3 different versions of the UI: 2 open-source versions and 1 closed-source version. <details><summary>Click to see detailed answer ...</summary> <br/> <br/> -Check its [stargazers on github](https://github.com/netdata/netdata/stargazers). You will find people from quite popular companies and enterprises, including: SAP, Qualcomm, IBM, Amazon, Intel, AMD, Unity, Baidu, Cisco, Samsung, Netflix, Facebook and hundreds more. +The entire back-end of the Netdata Agent is open-source, licensed under GPLv3+. We don't develop a separate enterprise version. All users, including commercial ones, use the same Netdata Agent. + +The Netdata Agent is shipped with multiple UI versions: + +- `http://agent.ip:19999/v0/`, the original open-source single-node UI, GPLv3+. +- `http://agent.ip:19999/v1/`, the latest open-source single-node UI, GPLv3+. +- `http://agent.ip:19999/v2/`, a snapshot of the latest Netdata Cloud UI as it was at the time the agent was released, licensed to be distributed with Netdata Agents under [NCUL1](https://github.com/netdata/netdata/blob/master/web/gui/v2/LICENSE.md). -Netdata is also popular in universities, including New York University, Columbia University, New Jersey University, and dozens more. +When you access a Netdata Agent via `http://agent.ip:19999/` a splash screen attempts to use the latest live version of Netdata Cloud UI (downloaded from Cloudflare). This only happens when the web browser has internet connectivity and Netdata Cloud is not disabled at the agent configuration. Otherwise, it falls back to `http://agent.ip:19999/v2/`. + +The Netdata Cloud UI is not open-source. But we thought that it is to the benefit of the community to allow everyone to use it directly with Netdata Agents, for free, even if Netdata Cloud is not used. <br/> <br/> </details> @@ -442,11 +666,16 @@ Netdata is an inclusive open-source project and community. Please read our [Code Join the Netdata community: - Chat with us and other community members on [Discord](https://discord.com/invite/mPZ6WZKKG2). -- Start a discussion on [Github discussions](https://github.com/netdata/netdata/discussions). +- Start a discussion on [GitHub discussions](https://github.com/netdata/netdata/discussions). - Open a topic to our [community forums](https://community.netdata.cloud). -> You can also find Netdata on:<br/> -> [Twitter](https://twitter.com/linuxnetdata) | [YouTube](https://www.youtube.com/c/Netdata) | [Reddit](https://www.reddit.com/r/netdata/) | [LinkedIn](https://www.linkedin.com/company/netdata-cloud/) | [StackShare](https://stackshare.io/netdata) | [Product Hunt](https://www.producthunt.com/posts/netdata-monitoring-agent/) | [Repology](https://repology.org/metapackage/netdata/versions) | [Facebook](https://www.facebook.com/linuxnetdata/) +> **Meet Up** :people_holding_hands::people_holding_hands::people_holding_hands:<br/> +> The Netdata team and community members have regular online meetups, usually every 2 weeks.<br/> +> **You are welcome to join us!** +> [Click here for the schedule](https://www.meetup.com/netdata/events/). + +You can also find Netdata on:<br/> +[Twitter](https://twitter.com/linuxnetdata) | [YouTube](https://www.youtube.com/c/Netdata) | [Reddit](https://www.reddit.com/r/netdata/) | [LinkedIn](https://www.linkedin.com/company/netdata-cloud/) | [StackShare](https://stackshare.io/netdata) | [Product Hunt](https://www.producthunt.com/posts/netdata-monitoring-agent/) | [Repology](https://repology.org/metapackage/netdata/versions) | [Facebook](https://www.facebook.com/linuxnetdata/) ## :pray: Contribute @@ -458,15 +687,15 @@ What is a contribution? All the following are highly valuable to Netdata: Netdata should out-of-the-box detect as many infrastructure issues as possible. By sharing your knowledge and experiences, you help us build a monitoring solution that has baked into it all the best-practices about infrastructure monitoring. 2. **Let us know if Netdata is not perfect for your use case**<br/> - We aim to support as many use cases as possible and your feedback can be invaluable. Open a github issue, or start a github discussion about it, to discuss how you want to use Netdata and what you need. + We aim to support as many use cases as possible and your feedback can be invaluable. Open a GitHub issue, or start a GitHub discussion about it, to discuss how you want to use Netdata and what you need. Although we can't implement everything imaginable, we try to prioritize development on use-cases that are common to our community, are in the same direction we want Netdata to evolve and are aligned with our roadmap. -4. **Support other community members**<br/> - Join our community on Github, Discord and Reddit. Generally, Netdata is relatively easy to setup and configure, but still people may need a little push in the right direction to use it effectively. Supporting other members is a great contribution by itself! +3. **Support other community members**<br/> + Join our community on GitHub, Discord and Reddit. Generally, Netdata is relatively easy to set up and configure, but still people may need a little push in the right direction to use it effectively. Supporting other members is a great contribution by itself! -5. **Add or improve integrations you need**<br/> - Integrations are generally easier and simpler to develop. If you want to contribute code to Netdata, we suggest to start with integrations you need and Netdata may not currently support. +4. **Add or improve integrations you need**<br/> + Integrations tend to be easier and simpler to develop. If you would like to contribute your code to Netdata, we suggest that you start with the integrations you need, which Netdata does not currently support. General information about contributions: @@ -480,5 +709,7 @@ instructions on building each Netdata component from the source and preparing a ## License -The Netdata Agent is [GPLv3+](https://github.com/netdata/netdata/blob/master/LICENSE). Netdata re-distributes other open-source tools and libraries. Please check the +Netdata is released under [GPLv3+](https://github.com/netdata/netdata/blob/master/LICENSE). Netdata re-distributes other open-source tools and libraries. Please check the [third party licenses](https://github.com/netdata/netdata/blob/master/REDISTRIBUTED.md). + +The Latest Netdata UI, is distributed under [NCUL1](https://github.com/netdata/netdata/blob/master/web/gui/v2/LICENSE.md). It also uses third party open source components. Check the [UI third party licenses](https://github.com/netdata/netdata/blob/master/web/gui/v2/3D_PARTY_LICENSES.txt) |