
diff options
| author | Daniel Baumann <daniel.baumann@progress-linux.org> | 2022-06-09 04:52:47 +0000 |
|---|---|---|
| committer | Daniel Baumann <daniel.baumann@progress-linux.org> | 2022-06-09 04:52:57 +0000 |
| commit | 00151562145df50cc65e9902d52d5fa77f89fe50 (patch) | |
| tree | 2737716802f6725a5074d606ec8fe5422c58a83c /collectors | |
| parent | Releasing debian version 1.34.1-1. (diff) | |
| download | netdata-00151562145df50cc65e9902d52d5fa77f89fe50.tar.xz netdata-00151562145df50cc65e9902d52d5fa77f89fe50.zip | |
Merging upstream version 1.35.0.
Signed-off-by: Daniel Baumann <daniel.baumann@progress-linux.org>
Diffstat (limited to 'collectors')
153 files changed, 3705 insertions, 18132 deletions
diff --git a/collectors/COLLECTORS.md b/collectors/COLLECTORS.md index 6b95228f9..02dfd50a1 100644 --- a/collectors/COLLECTORS.md +++ b/collectors/COLLECTORS.md @@ -66,278 +66,253 @@ configure any of these collectors according to your setup and infrastructure. ### Generic -- [Prometheus endpoints](https://learn.netdata.cloud/docs/agent/collectors/go.d.plugin/modules/prometheus): Gathers - metrics from any number of Prometheus endpoints, with support to autodetect more than 600 services and applications. +- [Prometheus endpoints](https://learn.netdata.cloud/docs/agent/collectors/go.d.plugin/modules/prometheus): Gathers + metrics from any number of Prometheus endpoints, with support to autodetect more than 600 services and applications. ### APM (application performance monitoring) -- [Go applications](/collectors/python.d.plugin/go_expvar/README.md): Monitor any Go application that exposes its - metrics with the `expvar` package from the Go standard library. -- [Java Spring Boot 2 - applications](https://learn.netdata.cloud/docs/agent/collectors/go.d.plugin/modules/springboot2/) (Go version): - Monitor running Java Spring Boot 2 applications that expose their metrics with the use of the Spring Boot Actuator. -- [Java Spring Boot 2 applications](/collectors/python.d.plugin/springboot/README.md) (Python version): Monitor - running Java Spring Boot applications that expose their metrics with the use of the Spring Boot Actuator. -- [statsd](/collectors/statsd.plugin/README.md): Implement a high performance `statsd` server for Netdata. -- [phpDaemon](https://learn.netdata.cloud/docs/agent/collectors/go.d.plugin/modules/phpdaemon/): Collect worker - statistics (total, active, idle), and uptime for web and network applications. -- [uWSGI](/collectors/python.d.plugin/uwsgi/README.md): Monitor performance metrics exposed by the uWSGI Stats - Server. +- [Go applications](/collectors/python.d.plugin/go_expvar/README.md): Monitor any Go application that exposes its + metrics with the `expvar` package from the Go standard library. +- [Java Spring Boot 2 + applications](https://learn.netdata.cloud/docs/agent/collectors/go.d.plugin/modules/springboot2/) (Go version): + Monitor running Java Spring Boot 2 applications that expose their metrics with the use of the Spring Boot Actuator. +- [Java Spring Boot 2 applications](/collectors/python.d.plugin/springboot/README.md) (Python version): Monitor + running Java Spring Boot applications that expose their metrics with the use of the Spring Boot Actuator. +- [statsd](/collectors/statsd.plugin/README.md): Implement a high performance `statsd` server for Netdata. +- [phpDaemon](https://learn.netdata.cloud/docs/agent/collectors/go.d.plugin/modules/phpdaemon/): Collect worker + statistics (total, active, idle), and uptime for web and network applications. +- [uWSGI](/collectors/python.d.plugin/uwsgi/README.md): Monitor performance metrics exposed by the uWSGI Stats + Server. ### Containers and VMs -- [Docker containers](/collectors/cgroups.plugin/README.md): Monitor the health and performance of individual Docker - containers using the cgroups collector plugin. -- [DockerD](/collectors/python.d.plugin/dockerd/README.md): Collect container health statistics. -- [Docker Engine](https://learn.netdata.cloud/docs/agent/collectors/go.d.plugin/modules/docker_engine/): Collect - runtime statistics from the `docker` daemon using the `metrics-address` feature. -- [Docker Hub](https://learn.netdata.cloud/docs/agent/collectors/go.d.plugin/modules/dockerhub/): Collect statistics - about Docker repositories, such as pulls, starts, status, time since last update, and more. -- [Libvirt](/collectors/cgroups.plugin/README.md): Monitor the health and performance of individual Libvirt containers - using the cgroups collector plugin. -- [LXC](/collectors/cgroups.plugin/README.md): Monitor the health and performance of individual LXC containers using - the cgroups collector plugin. -- [LXD](/collectors/cgroups.plugin/README.md): Monitor the health and performance of individual LXD containers using - the cgroups collector plugin. -- [systemd-nspawn](/collectors/cgroups.plugin/README.md): Monitor the health and performance of individual - systemd-nspawn containers using the cgroups collector plugin. -- [vCenter Server Appliance](https://learn.netdata.cloud/docs/agent/collectors/go.d.plugin/modules/vcsa/): Monitor - appliance system, components, and software update health statuses via the Health API. -- [vSphere](https://learn.netdata.cloud/docs/agent/collectors/go.d.plugin/modules/vsphere/): Collect host and virtual - machine performance metrics. -- [Xen/XCP-ng](/collectors/xenstat.plugin/README.md): Collect XenServer and XCP-ng metrics using `libxenstat`. +- [Docker containers](/collectors/cgroups.plugin/README.md): Monitor the health and performance of individual Docker + containers using the cgroups collector plugin. +- [DockerD](/collectors/python.d.plugin/dockerd/README.md): Collect container health statistics. +- [Docker Engine](https://learn.netdata.cloud/docs/agent/collectors/go.d.plugin/modules/docker_engine/): Collect + runtime statistics from the `docker` daemon using the `metrics-address` feature. +- [Docker Hub](https://learn.netdata.cloud/docs/agent/collectors/go.d.plugin/modules/dockerhub/): Collect statistics + about Docker repositories, such as pulls, starts, status, time since last update, and more. +- [Libvirt](/collectors/cgroups.plugin/README.md): Monitor the health and performance of individual Libvirt containers + using the cgroups collector plugin. +- [LXC](/collectors/cgroups.plugin/README.md): Monitor the health and performance of individual LXC containers using + the cgroups collector plugin. +- [LXD](/collectors/cgroups.plugin/README.md): Monitor the health and performance of individual LXD containers using + the cgroups collector plugin. +- [systemd-nspawn](/collectors/cgroups.plugin/README.md): Monitor the health and performance of individual + systemd-nspawn containers using the cgroups collector plugin. +- [vCenter Server Appliance](https://learn.netdata.cloud/docs/agent/collectors/go.d.plugin/modules/vcsa/): Monitor + appliance system, components, and software update health statuses via the Health API. +- [vSphere](https://learn.netdata.cloud/docs/agent/collectors/go.d.plugin/modules/vsphere/): Collect host and virtual + machine performance metrics. +- [Xen/XCP-ng](/collectors/xenstat.plugin/README.md): Collect XenServer and XCP-ng metrics using `libxenstat`. ### Data stores -- [CockroachDB](https://learn.netdata.cloud/docs/agent/collectors/go.d.plugin/modules/cockroachdb/): Monitor various - database components using `_status/vars` endpoint. -- [Consul](https://learn.netdata.cloud/docs/agent/collectors/go.d.plugin/modules/consul/): Capture service and unbound - checks status (passing, warning, critical, maintenance). -- [Couchbase](https://learn.netdata.cloud/docs/agent/collectors/go.d.plugin/modules/couchbase/): Gather per-bucket - metrics from any number of instances of the distributed JSON document database. -- [CouchDB](/collectors/python.d.plugin/couchdb/README.md): Monitor database health and performance metrics - (reads/writes, HTTP traffic, replication status, etc). -- [MongoDB](/collectors/python.d.plugin/mongodb/README.md): Collect memory-caching system performance metrics and - reads the server's response to `stats` command (stats interface). -- [MySQL](https://learn.netdata.cloud/docs/agent/collectors/go.d.plugin/modules/mysql/): Collect database global, - replication and per user statistics. -- [OracleDB](/collectors/python.d.plugin/oracledb/README.md): Monitor database performance and health metrics. -- [Pika](https://learn.netdata.cloud/docs/agent/collectors/go.d.plugin/modules/pika/): Gather metric, such as clients, - memory usage, queries, and more from the Redis interface-compatible database. -- [Postgres](/collectors/python.d.plugin/postgres/README.md): Collect database health and performance metrics. -- [ProxySQL](/collectors/python.d.plugin/proxysql/README.md): Monitor database backend and frontend performance - metrics. -- [Redis (Go)](https://learn.netdata.cloud/docs/agent/collectors/go.d.plugin/modules/redis/): Monitor status from any - number of database instances by reading the server's response to the `INFO ALL` command. -- [Redis (Python)](/collectors/python.d.plugin/redis/README.md): Monitor database status by reading the server's response to - the `INFO` command. -- [RethinkDB](/collectors/python.d.plugin/rethinkdbs/README.md): Collect database server and cluster statistics. -- [Riak KV](/collectors/python.d.plugin/riakkv/README.md): Collect database stats from the `/stats` endpoint. -- [Zookeeper](https://learn.netdata.cloud/docs/agent/collectors/go.d.plugin/modules/zookeeper/): Monitor application - health metrics reading the server's response to the `mntr` command. -- [Memcached](/collectors/python.d.plugin/memcached/README.md): Collect memory-caching system performance metrics. +- [CockroachDB](https://learn.netdata.cloud/docs/agent/collectors/go.d.plugin/modules/cockroachdb/): Monitor various + database components using `_status/vars` endpoint. +- [Consul](https://learn.netdata.cloud/docs/agent/collectors/go.d.plugin/modules/consul/): Capture service and unbound + checks status (passing, warning, critical, maintenance). +- [Couchbase](https://learn.netdata.cloud/docs/agent/collectors/go.d.plugin/modules/couchbase/): Gather per-bucket + metrics from any number of instances of the distributed JSON document database. +- [CouchDB](https://learn.netdata.cloud/docs/agent/collectors/go.d.plugin/modules/couchdb): Monitor database health and + performance metrics + (reads/writes, HTTP traffic, replication status, etc). +- [MongoDB](/collectors/python.d.plugin/mongodb/README.md): Collect memory-caching system performance metrics and + reads the server's response to `stats` command (stats interface). +- [MySQL](https://learn.netdata.cloud/docs/agent/collectors/go.d.plugin/modules/mysql/): Collect database global, + replication and per user statistics. +- [OracleDB](/collectors/python.d.plugin/oracledb/README.md): Monitor database performance and health metrics. +- [Pika](https://learn.netdata.cloud/docs/agent/collectors/go.d.plugin/modules/pika/): Gather metric, such as clients, + memory usage, queries, and more from the Redis interface-compatible database. +- [Postgres](/collectors/python.d.plugin/postgres/README.md): Collect database health and performance metrics. +- [ProxySQL](/collectors/python.d.plugin/proxysql/README.md): Monitor database backend and frontend performance + metrics. +- [Redis](https://learn.netdata.cloud/docs/agent/collectors/go.d.plugin/modules/redis/): Monitor status from any + number of database instances by reading the server's response to the `INFO ALL` command. +- [RethinkDB](/collectors/python.d.plugin/rethinkdbs/README.md): Collect database server and cluster statistics. +- [Riak KV](/collectors/python.d.plugin/riakkv/README.md): Collect database stats from the `/stats` endpoint. +- [Zookeeper](https://learn.netdata.cloud/docs/agent/collectors/go.d.plugin/modules/zookeeper/): Monitor application + health metrics reading the server's response to the `mntr` command. +- [Memcached](/collectors/python.d.plugin/memcached/README.md): Collect memory-caching system performance metrics. ### Distributed computing -- [BOINC](/collectors/python.d.plugin/boinc/README.md): Monitor the total number of tasks, open tasks, and task - states for the distributed computing client. -- [Gearman](/collectors/python.d.plugin/gearman/README.md): Collect application summary (queued, running) and per-job - worker statistics (queued, idle, running). +- [BOINC](/collectors/python.d.plugin/boinc/README.md): Monitor the total number of tasks, open tasks, and task + states for the distributed computing client. +- [Gearman](/collectors/python.d.plugin/gearman/README.md): Collect application summary (queued, running) and per-job + worker statistics (queued, idle, running). ### Email -- [Dovecot](/collectors/python.d.plugin/dovecot/README.md): Collect email server performance metrics by reading the - server's response to the `EXPORT global` command. -- [EXIM](/collectors/python.d.plugin/exim/README.md): Uses the `exim` tool to monitor the queue length of a - mail/message transfer agent (MTA). -- [Postfix](/collectors/python.d.plugin/postfix/README.md): Uses the `postqueue` tool to monitor the queue length of a - mail/message transfer agent (MTA). +- [Dovecot](/collectors/python.d.plugin/dovecot/README.md): Collect email server performance metrics by reading the + server's response to the `EXPORT global` command. +- [EXIM](/collectors/python.d.plugin/exim/README.md): Uses the `exim` tool to monitor the queue length of a + mail/message transfer agent (MTA). +- [Postfix](/collectors/python.d.plugin/postfix/README.md): Uses the `postqueue` tool to monitor the queue length of a + mail/message transfer agent (MTA). ### Kubernetes -- [Kubelet](https://learn.netdata.cloud/docs/agent/collectors/go.d.plugin/modules/k8s_kubelet/): Monitor one or more - instances of the Kubelet agent and collects metrics on number of pods/containers running, volume of Docker - operations, and more. -- [kube-proxy](https://learn.netdata.cloud/docs/agent/collectors/go.d.plugin/modules/k8s_kubeproxy/): Collect - metrics, such as syncing proxy rules and REST client requests, from one or more instances of `kube-proxy`. -- [Service discovery](https://github.com/netdata/agent-service-discovery/): Find what services are running on a - cluster's pods, converts that into configuration files, and exports them so they can be monitored by Netdata. +- [Kubelet](https://learn.netdata.cloud/docs/agent/collectors/go.d.plugin/modules/k8s_kubelet/): Monitor one or more + instances of the Kubelet agent and collects metrics on number of pods/containers running, volume of Docker + operations, and more. +- [kube-proxy](https://learn.netdata.cloud/docs/agent/collectors/go.d.plugin/modules/k8s_kubeproxy/): Collect + metrics, such as syncing proxy rules and REST client requests, from one or more instances of `kube-proxy`. +- [Service discovery](https://github.com/netdata/agent-service-discovery/): Find what services are running on a + cluster's pods, converts that into configuration files, and exports them so they can be monitored by Netdata. ### Logs -- [Fluentd](https://learn.netdata.cloud/docs/agent/collectors/go.d.plugin/modules/fluentd/): Gather application - plugins metrics from an endpoint provided by `in_monitor plugin`. -- [Logstash](https://learn.netdata.cloud/docs/agent/collectors/go.d.plugin/modules/logstash/): Monitor JVM threads, - memory usage, garbage collection statistics, and more. -- [OpenVPN status logs](/collectors/python.d.plugin/ovpn_status_log/README.md): Parse server log files and provide summary - (client, traffic) metrics. -- [Squid web server logs](https://learn.netdata.cloud/docs/agent/collectors/go.d.plugin/modules/squidlog/): Tail Squid - access logs to return the volume of requests, types of requests, bandwidth, and much more. -- [Web server logs (Go version for Apache, - NGINX)](https://learn.netdata.cloud/docs/agent/collectors/go.d.plugin/modules/weblog/): Tail access logs and provide - very detailed web server performance statistics. This module is able to parse 200k+ rows in less than half a second. -- [Web server logs (Python version for Apache, NGINX, Squid)](/collectors/python.d.plugin/web_log/README.md): Tail access log - file and collect web server/caching proxy metrics. +- [Fluentd](https://learn.netdata.cloud/docs/agent/collectors/go.d.plugin/modules/fluentd/): Gather application + plugins metrics from an endpoint provided by `in_monitor plugin`. +- [Logstash](https://learn.netdata.cloud/docs/agent/collectors/go.d.plugin/modules/logstash/): Monitor JVM threads, + memory usage, garbage collection statistics, and more. +- [OpenVPN status logs](/collectors/python.d.plugin/ovpn_status_log/README.md): Parse server log files and provide + summary + (client, traffic) metrics. +- [Squid web server logs](https://learn.netdata.cloud/docs/agent/collectors/go.d.plugin/modules/squidlog/): Tail Squid + access logs to return the volume of requests, types of requests, bandwidth, and much more. +- [Web server logs (Go version for Apache, + NGINX)](https://learn.netdata.cloud/docs/agent/collectors/go.d.plugin/modules/weblog/): Tail access logs and provide + very detailed web server performance statistics. This module is able to parse 200k+ rows in less than half a second. +- [Web server logs (Apache, NGINX)](https://learn.netdata.cloud/docs/agent/collectors/go.d.plugin/modules/weblog): Tail + access log + file and collect web server/caching proxy metrics. ### Messaging -- [ActiveMQ](https://learn.netdata.cloud/docs/agent/collectors/go.d.plugin/modules/activemq/): Collect message broker - queues and topics statistics using the ActiveMQ Console API. -- [Beanstalk](/collectors/python.d.plugin/beanstalk/README.md): Collect server and tube-level statistics, such as CPU - usage, jobs rates, commands, and more. -- [Pulsar](https://learn.netdata.cloud/docs/agent/collectors/go.d.plugin/modules/pulsar/): Collect summary, - namespaces, and topics performance statistics. -- [RabbitMQ (Go)](https://learn.netdata.cloud/docs/agent/collectors/go.d.plugin/modules/rabbitmq/): Collect message - broker overview, system and per virtual host metrics. -- [RabbitMQ (Python)](/collectors/python.d.plugin/rabbitmq/README.md): Collect message broker global and per virtual - host metrics. -- [VerneMQ](https://learn.netdata.cloud/docs/agent/collectors/go.d.plugin/modules/vernemq/): Monitor MQTT broker - health and performance metrics. It collects all available info for both MQTTv3 and v5 communication +- [ActiveMQ](https://learn.netdata.cloud/docs/agent/collectors/go.d.plugin/modules/activemq/): Collect message broker + queues and topics statistics using the ActiveMQ Console API. +- [Beanstalk](/collectors/python.d.plugin/beanstalk/README.md): Collect server and tube-level statistics, such as CPU + usage, jobs rates, commands, and more. +- [Pulsar](https://learn.netdata.cloud/docs/agent/collectors/go.d.plugin/modules/pulsar/): Collect summary, + namespaces, and topics performance statistics. +- [RabbitMQ (Go)](https://learn.netdata.cloud/docs/agent/collectors/go.d.plugin/modules/rabbitmq/): Collect message + broker overview, system and per virtual host metrics. +- [RabbitMQ (Python)](/collectors/python.d.plugin/rabbitmq/README.md): Collect message broker global and per virtual + host metrics. +- [VerneMQ](https://learn.netdata.cloud/docs/agent/collectors/go.d.plugin/modules/vernemq/): Monitor MQTT broker + health and performance metrics. It collects all available info for both MQTTv3 and v5 communication ### Network -- [Bind 9](https://learn.netdata.cloud/docs/agent/collectors/go.d.plugin/modules/bind/): Collect nameserver summary - performance statistics via a web interface (`statistics-channels` feature). -- [Chrony](/collectors/python.d.plugin/chrony/README.md): Monitor the precision and statistics of a local `chronyd` - server. -- [CoreDNS](https://learn.netdata.cloud/docs/agent/collectors/go.d.plugin/modules/coredns/): Measure DNS query round - trip time. -- [Dnsmasq](https://learn.netdata.cloud/docs/agent/collectors/go.d.plugin/modules/dnsmasq_dhcp/): Automatically - detects all configured `Dnsmasq` DHCP ranges and Monitor their utilization. -- [DNSdist (Go)](https://learn.netdata.cloud/docs/agent/collectors/go.d.plugin/modules/dnsdist/): Collect - load-balancer performance and health metrics. -- [DNSdist (Python)](/collectors/python.d.plugin/dnsdist/README.md): Collect load-balancer performance and health - metrics. -- [Dnsmasq DNS Forwarder](https://learn.netdata.cloud/docs/agent/collectors/go.d.plugin/modules/dnsmasq/): Gather - queries, entries, operations, and events for the lightweight DNS forwarder. -- [dns_query](https://learn.netdata.cloud/docs/agent/collectors/go.d.plugin/modules/dnsquery/): Monitor the round - trip time for DNS queries in milliseconds. -- [DNS Query Time](/collectors/python.d.plugin/dns_query_time/README.md): Measure DNS query round trip time. -- [Freeradius (Go)](https://learn.netdata.cloud/docs/agent/collectors/go.d.plugin/modules/freeradius/): Collect - server authentication and accounting statistics from the `status server`. -- [Freeradius (Python)](/collectors/python.d.plugin/freeradius/README.md): Collect server authentication and - accounting statistics from the `status server` using the `radclient` tool. -- [Libreswan](/collectors/charts.d.plugin/libreswan/README.md): Collect bytes-in, bytes-out, and uptime metrics. -- [Icecast](/collectors/python.d.plugin/icecast/README.md): Monitor the number of listeners for active sources. -- [ISC Bind (RDNC)](/collectors/python.d.plugin/bind_rndc/README.md): Collect nameserver summary performance - statistics using the `rndc` tool. -- [ISC DHCP (Go)](https://learn.netdata.cloud/docs/agent/collectors/go.d.plugin/modules/isc_dhcpd): Reads a - `dhcpd.leases` file and collects metrics on total active leases, pool active leases, and pool utilization. -- [ISC DHCP (Python)](/collectors/python.d.plugin/isc_dhcpd/README.md): Reads `dhcpd.leases` file and reports DHCP - pools utilization and leases statistics (total number, leases per pool). -- [OpenLDAP](/collectors/python.d.plugin/openldap/README.md): Provides statistics information from the OpenLDAP - (`slapd`) server. -- [NSD](/collectors/python.d.plugin/nsd/README.md): Monitor nameserver performance metrics using the `nsd-control` - tool. -- [NTP daemon](/collectors/python.d.plugin/ntpd/README.md): Monitor the system variables of the local `ntpd` daemon - (optionally including variables of the polled peers) using the NTP Control Message Protocol via a UDP socket. -- [OpenSIPS](/collectors/charts.d.plugin/opensips/README.md): Collect server health and performance metrics using the - `opensipsctl` tool. -- [OpenVPN](https://learn.netdata.cloud/docs/agent/collectors/go.d.plugin/modules/openvpn/): Gather server summary - (client, traffic) and per user metrics (traffic, connection time) stats using `management-interface`. -- [Pi-hole](https://learn.netdata.cloud/docs/agent/collectors/go.d.plugin/modules/pihole/): Monitor basic (DNS - queries, clients, blocklist) and extended (top clients, top permitted, and blocked domains) statistics using the PHP - API. -- [PowerDNS Authoritative Server - (Go)](https://learn.netdata.cloud/docs/agent/collectors/go.d.plugin/modules/powerdns): Monitor one or more instances - of the nameserver software to collect questions, events, and latency metrics. -- [PowerDNS Recursor (Go)](https://learn.netdata.cloud/docs/agent/collectors/go.d.plugin/modules/powerdns_recursor): - Gather incoming/outgoing questions, drops, timeouts, and cache usage from any number of DNS recursor instances. -- [PowerDNS (Python)](/collectors/python.d.plugin/powerdns/README.md): Monitor authoritative server and recursor - statistics. -- [RetroShare](/collectors/python.d.plugin/retroshare/README.md): Monitor application bandwidth, peers, and DHT - metrics. -- [Tor](/collectors/python.d.plugin/tor/README.md): Capture traffic usage statistics using the Tor control port. -- [Unbound](https://learn.netdata.cloud/docs/agent/collectors/go.d.plugin/modules/unbound/): Collect DNS resolver - summary and extended system and per thread metrics via the `remote-control` interface. +- [Bind 9](https://learn.netdata.cloud/docs/agent/collectors/go.d.plugin/modules/bind/): Collect nameserver summary + performance statistics via a web interface (`statistics-channels` feature). +- [Chrony](/collectors/python.d.plugin/chrony/README.md): Monitor the precision and statistics of a local `chronyd` + server. +- [CoreDNS](https://learn.netdata.cloud/docs/agent/collectors/go.d.plugin/modules/coredns/): Measure DNS query round + trip time. +- [Dnsmasq](https://learn.netdata.cloud/docs/agent/collectors/go.d.plugin/modules/dnsmasq_dhcp/): Automatically + detects all configured `Dnsmasq` DHCP ranges and Monitor their utilization. +- [DNSdist](https://learn.netdata.cloud/docs/agent/collectors/go.d.plugin/modules/dnsdist/): Collect + load-balancer performance and health metrics. +- [Dnsmasq DNS Forwarder](https://learn.netdata.cloud/docs/agent/collectors/go.d.plugin/modules/dnsmasq/): Gather + queries, entries, operations, and events for the lightweight DNS forwarder. +- [DNS Query Time](https://learn.netdata.cloud/docs/agent/collectors/go.d.plugin/modules/dnsquery/): Monitor the round + trip time for DNS queries in milliseconds. +- [Freeradius](https://learn.netdata.cloud/docs/agent/collectors/go.d.plugin/modules/freeradius/): Collect + server authentication and accounting statistics from the `status server`. +- [Libreswan](/collectors/charts.d.plugin/libreswan/README.md): Collect bytes-in, bytes-out, and uptime metrics. +- [Icecast](/collectors/python.d.plugin/icecast/README.md): Monitor the number of listeners for active sources. +- [ISC Bind (RDNC)](/collectors/python.d.plugin/bind_rndc/README.md): Collect nameserver summary performance + statistics using the `rndc` tool. +- [ISC DHCP](https://learn.netdata.cloud/docs/agent/collectors/go.d.plugin/modules/isc_dhcpd): Reads a + `dhcpd.leases` file and collects metrics on total active leases, pool active leases, and pool utilization. +- [OpenLDAP](/collectors/python.d.plugin/openldap/README.md): Provides statistics information from the OpenLDAP + (`slapd`) server. +- [NSD](/collectors/python.d.plugin/nsd/README.md): Monitor nameserver performance metrics using the `nsd-control` + tool. +- [NTP daemon](/collectors/python.d.plugin/ntpd/README.md): Monitor the system variables of the local `ntpd` daemon + (optionally including variables of the polled peers) using the NTP Control Message Protocol via a UDP socket. +- [OpenSIPS](/collectors/charts.d.plugin/opensips/README.md): Collect server health and performance metrics using the + `opensipsctl` tool. +- [OpenVPN](https://learn.netdata.cloud/docs/agent/collectors/go.d.plugin/modules/openvpn/): Gather server summary + (client, traffic) and per user metrics (traffic, connection time) stats using `management-interface`. +- [Pi-hole](https://learn.netdata.cloud/docs/agent/collectors/go.d.plugin/modules/pihole/): Monitor basic (DNS + queries, clients, blocklist) and extended (top clients, top permitted, and blocked domains) statistics using the PHP + API. +- [PowerDNS Authoritative Server](https://learn.netdata.cloud/docs/agent/collectors/go.d.plugin/modules/powerdns): + Monitor one or more instances of the nameserver software to collect questions, events, and latency metrics. +- [PowerDNS Recursor](https://learn.netdata.cloud/docs/agent/collectors/go.d.plugin/modules/powerdns_recursor): + Gather incoming/outgoing questions, drops, timeouts, and cache usage from any number of DNS recursor instances. +- [RetroShare](/collectors/python.d.plugin/retroshare/README.md): Monitor application bandwidth, peers, and DHT + metrics. +- [Tor](/collectors/python.d.plugin/tor/README.md): Capture traffic usage statistics using the Tor control port. +- [Unbound](https://learn.netdata.cloud/docs/agent/collectors/go.d.plugin/modules/unbound/): Collect DNS resolver + summary and extended system and per thread metrics via the `remote-control` interface. ### Provisioning -- [Puppet](/collectors/python.d.plugin/puppet/README.md): Monitor the status of Puppet Server and Puppet DB. +- [Puppet](/collectors/python.d.plugin/puppet/README.md): Monitor the status of Puppet Server and Puppet DB. ### Remote devices -- [AM2320](/collectors/python.d.plugin/am2320/README.md): Monitor sensor temperature and humidity. -- [Access point](/collectors/charts.d.plugin/ap/README.md): Monitor client, traffic and signal metrics using the `aw` +- [AM2320](/collectors/python.d.plugin/am2320/README.md): Monitor sensor temperature and humidity. +- [Access point](/collectors/charts.d.plugin/ap/README.md): Monitor client, traffic and signal metrics using the `aw` tool. -- [APC UPS](/collectors/charts.d.plugin/apcupsd/README.md): Capture status information using the `apcaccess` tool. -- [Energi Core (Go)](https://learn.netdata.cloud/docs/agent/collectors/go.d.plugin/modules/energid): Monitor +- [APC UPS](/collectors/charts.d.plugin/apcupsd/README.md): Capture status information using the `apcaccess` tool. +- [Energi Core](https://learn.netdata.cloud/docs/agent/collectors/go.d.plugin/modules/energid): Monitor blockchain indexes, memory usage, network usage, and transactions of wallet instances. -- [Energi Core (Python)](/collectors/python.d.plugin/energid/README.md): Monitor blockchain, memory, network, and - unspent transactions statistics. -- [UPS/PDU](/collectors/charts.d.plugin/nut/README.md): Read the status of UPS/PDU devices using the `upsc` tool. -- [SNMP devices](/collectors/node.d.plugin/snmp/README.md): Gather data using the SNMP protocol. +- [UPS/PDU](/collectors/charts.d.plugin/nut/README.md): Read the status of UPS/PDU devices using the `upsc` tool. +- [SNMP devices](https://learn.netdata.cloud/docs/agent/collectors/go.d.plugin/modules/snmp): Gather data using the SNMP protocol. - [1-Wire sensors](/collectors/python.d.plugin/w1sensor/README.md): Monitor sensor temperature. ### Search -- [Elasticsearch (Go)](https://learn.netdata.cloud/docs/agent/collectors/go.d.plugin/modules/elasticsearch): Collect - dozens of metrics on search engine performance from local nodes and local indices. Includes cluster health and - statistics. -- [Elasticsearch (Python)](/collectors/python.d.plugin/elasticsearch/README.md): Collect search engine performance and - health statistics. Optionally collects per-index metrics. -- [Solr](https://learn.netdata.cloud/docs/agent/collectors/go.d.plugin/modules/solr/): Collect application search - requests, search errors, update requests, and update errors statistics. +- [Elasticsearch](https://learn.netdata.cloud/docs/agent/collectors/go.d.plugin/modules/elasticsearch): Collect + dozens of metrics on search engine performance from local nodes and local indices. Includes cluster health and + statistics. +- [Solr](https://learn.netdata.cloud/docs/agent/collectors/go.d.plugin/modules/solr/): Collect application search + requests, search errors, update requests, and update errors statistics. ### Storage -- [Ceph](/collectors/python.d.plugin/ceph/README.md): Monitor the Ceph cluster usage and server data consumption. -- [HDFS](https://learn.netdata.cloud/docs/agent/collectors/go.d.plugin/modules/hdfs/): Monitor health and performance - metrics for filesystem datanodes and namenodes. -- [IPFS](/collectors/python.d.plugin/ipfs/README.md): Collect file system bandwidth, peers, and repo metrics. -- [Scaleio](https://learn.netdata.cloud/docs/agent/collectors/go.d.plugin/modules/scaleio/): Monitor storage system, - storage pools, and SDCS health and performance metrics via VxFlex OS Gateway API. -- [Samba](/collectors/python.d.plugin/samba/README.md): Collect file sharing metrics using the `smbstatus` tool. +- [Ceph](/collectors/python.d.plugin/ceph/README.md): Monitor the Ceph cluster usage and server data consumption. +- [HDFS](https://learn.netdata.cloud/docs/agent/collectors/go.d.plugin/modules/hdfs/): Monitor health and performance + metrics for filesystem datanodes and namenodes. +- [IPFS](/collectors/python.d.plugin/ipfs/README.md): Collect file system bandwidth, peers, and repo metrics. +- [Scaleio](https://learn.netdata.cloud/docs/agent/collectors/go.d.plugin/modules/scaleio/): Monitor storage system, + storage pools, and SDCS health and performance metrics via VxFlex OS Gateway API. +- [Samba](/collectors/python.d.plugin/samba/README.md): Collect file sharing metrics using the `smbstatus` tool. ### Web -- [Apache (Go)](https://learn.netdata.cloud/docs/agent/collectors/go.d.plugin/modules/apache/): Collect Apache web - server performance metrics via the `server-status?auto` endpoint. -- [Apache (Python)](/collectors/python.d.plugin/apache/README.md): Collect Apache web server performance metrics via - the `server-status?auto` endpoint. -- [HAProxy](/collectors/python.d.plugin/haproxy/README.md): Collect frontend, backend, and health metrics. -- [HTTP endpoints (Go)](https://learn.netdata.cloud/docs/agent/collectors/go.d.plugin/modules/httpcheck/): Monitor - any HTTP endpoint's availability and response time. -- [HTTP endpoints (Python)](/collectors/python.d.plugin/httpcheck/README.md): Monitor any HTTP endpoint's - availability and response time. -- [Lighttpd](https://learn.netdata.cloud/docs/agent/collectors/go.d.plugin/modules/lighttpd/): Collect web server - performance metrics using the `server-status?auto` endpoint. -- [Lighttpd2](https://learn.netdata.cloud/docs/agent/collectors/go.d.plugin/modules/lighttpd2/): Collect web server - performance metrics using the `server-status?format=plain` endpoint. -- [Litespeed](/collectors/python.d.plugin/litespeed/README.md): Collect web server data (network, connection, - requests, cache) by reading `.rtreport*` files. -- [Nginx (Go)](https://learn.netdata.cloud/docs/agent/collectors/go.d.plugin/modules/nginx/): Monitor web server - status information by gathering metrics via `ngx_http_stub_status_module`. -- [Nginx (Python)](/collectors/python.d.plugin/nginx/README.md): Monitor web server status information by gathering - metrics via `ngx_http_stub_status_module`. -- [Nginx Plus](/collectors/python.d.plugin/nginx_plus/README.md): Collect global and per-server zone, upstream, and - cache metrics. -- [Nginx VTS](https://learn.netdata.cloud/docs/agent/collectors/go.d.plugin/modules/nginxvts/): Gathers metrics from - any Nginx deployment with the _virtual host traffic status module_ enabled, including metrics on uptime, memory - usage, and cache, and more. -- [PHP-FPM (Go)](https://learn.netdata.cloud/docs/agent/collectors/go.d.plugin/modules/phpfpm/): Collect application - summary and processes health metrics by scraping the status page (`/status?full`). -- [PHP-FPM (Python)](/collectors/python.d.plugin/phpfpm/README.md): Collect application summary and processes health - metrics by scraping the status page (`/status?full`). -- [TCP endpoints (Go)](https://learn.netdata.cloud/docs/agent/collectors/go.d.plugin/modules/portcheck/): Monitor any - TCP endpoint's availability and response time. -- [TCP endpoints (Python)](/collectors/python.d.plugin/portcheck/README.md): Monitor any TCP endpoint's availability - and response time. -- [Spigot Minecraft servers](/collectors/python.d.plugin/spigotmc/README.md): Monitor average ticket rate and number - of users. -- [Squid](/collectors/python.d.plugin/squid/README.md): Monitor client and server bandwidth/requests by gathering - data from the Cache Manager component. -- [Tengine](https://learn.netdata.cloud/docs/agent/collectors/go.d.plugin/modules/tengine/): Monitor web server - statistics using information provided by `ngx_http_reqstat_module`. -- [Tomcat](/collectors/python.d.plugin/tomcat/README.md): Collect web server performance metrics from the Manager App - (`/manager/status?XML=true`). -- [Traefik](/collectors/python.d.plugin/traefik/README.md): Uses Traefik's Health API to provide statistics. -- [Varnish](/collectors/python.d.plugin/varnish/README.md): Provides HTTP accelerator global, backends (VBE), and - disks (SMF) statistics using the `varnishstat` tool. -- [x509 check](https://learn.netdata.cloud/docs/agent/collectors/go.d.plugin/modules/x509check/): Monitor certificate - expiration time. -- [Whois domain expiry](https://learn.netdata.cloud/docs/agent/collectors/go.d.plugin/modules/whoisquery/): Checks the - remaining time until a given domain is expired. +- [Apache](https://learn.netdata.cloud/docs/agent/collectors/go.d.plugin/modules/apache/): Collect Apache web + server performance metrics via the `server-status?auto` endpoint. +- [HAProxy](/collectors/python.d.plugin/haproxy/README.md): Collect frontend, backend, and health metrics. +- [HTTP endpoints](https://learn.netdata.cloud/docs/agent/collectors/go.d.plugin/modules/httpcheck/): Monitor + any HTTP endpoint's availability and response time. +- [Lighttpd](https://learn.netdata.cloud/docs/agent/collectors/go.d.plugin/modules/lighttpd/): Collect web server + performance metrics using the `server-status?auto` endpoint. +- [Lighttpd2](https://learn.netdata.cloud/docs/agent/collectors/go.d.plugin/modules/lighttpd2/): Collect web server + performance metrics using the `server-status?format=plain` endpoint. +- [Litespeed](/collectors/python.d.plugin/litespeed/README.md): Collect web server data (network, connection, + requests, cache) by reading `.rtreport*` files. +- [Nginx](https://learn.netdata.cloud/docs/agent/collectors/go.d.plugin/modules/nginx/): Monitor web server + status information by gathering metrics via `ngx_http_stub_status_module`. +- [Nginx VTS](https://learn.netdata.cloud/docs/agent/collectors/go.d.plugin/modules/nginxvts/): Gathers metrics from + any Nginx deployment with the _virtual host traffic status module_ enabled, including metrics on uptime, memory + usage, and cache, and more. +- [PHP-FPM](https://learn.netdata.cloud/docs/agent/collectors/go.d.plugin/modules/phpfpm/): Collect application + summary and processes health metrics by scraping the status page (`/status?full`). +- [TCP endpoints](https://learn.netdata.cloud/docs/agent/collectors/go.d.plugin/modules/portcheck/): Monitor any + TCP endpoint's availability and response time. +- [Spigot Minecraft servers](/collectors/python.d.plugin/spigotmc/README.md): Monitor average ticket rate and number + of users. +- [Squid](/collectors/python.d.plugin/squid/README.md): Monitor client and server bandwidth/requests by gathering + data from the Cache Manager component. +- [Tengine](https://learn.netdata.cloud/docs/agent/collectors/go.d.plugin/modules/tengine/): Monitor web server + statistics using information provided by `ngx_http_reqstat_module`. +- [Tomcat](/collectors/python.d.plugin/tomcat/README.md): Collect web server performance metrics from the Manager App + (`/manager/status?XML=true`). +- [Traefik](/collectors/python.d.plugin/traefik/README.md): Uses Traefik's Health API to provide statistics. +- [Varnish](/collectors/python.d.plugin/varnish/README.md): Provides HTTP accelerator global, backends (VBE), and + disks (SMF) statistics using the `varnishstat` tool. +- [x509 check](https://learn.netdata.cloud/docs/agent/collectors/go.d.plugin/modules/x509check/): Monitor certificate + expiration time. +- [Whois domain expiry](https://learn.netdata.cloud/docs/agent/collectors/go.d.plugin/modules/whoisquery/): Checks the + remaining time until a given domain is expired. ## System collectors @@ -346,158 +321,158 @@ The Netdata Agent can collect these system- and hardware-level metrics using a v ### Applications -- [Fail2ban](/collectors/python.d.plugin/fail2ban/README.md): Parses configuration files to detect all jails, then - uses log files to report ban rates and volume of banned IPs. -- [Monit](/collectors/python.d.plugin/monit/README.md): Monitor statuses of targets (service-checks) using the XML - stats interface. -- [WMI (Windows Management Instrumentation) - exporter](https://learn.netdata.cloud/docs/agent/collectors/go.d.plugin/modules/wmi/): Collect CPU, memory, - network, disk, OS, system, and log-in metrics scraping `wmi_exporter`. +- [Fail2ban](/collectors/python.d.plugin/fail2ban/README.md): Parses configuration files to detect all jails, then + uses log files to report ban rates and volume of banned IPs. +- [Monit](/collectors/python.d.plugin/monit/README.md): Monitor statuses of targets (service-checks) using the XML + stats interface. +- [WMI (Windows Management Instrumentation) + exporter](https://learn.netdata.cloud/docs/agent/collectors/go.d.plugin/modules/wmi/): Collect CPU, memory, + network, disk, OS, system, and log-in metrics scraping `wmi_exporter`. ### Disks and filesystems -- [BCACHE](/collectors/proc.plugin/README.md): Monitor BCACHE statistics with the the `proc.plugin` collector. -- [Block devices](/collectors/proc.plugin/README.md): Gather metrics about the health and performance of block - devices using the the `proc.plugin` collector. -- [Btrfs](/collectors/proc.plugin/README.md): Monitors Btrfs filesystems with the the `proc.plugin` collector. -- [Device mapper](/collectors/proc.plugin/README.md): Gather metrics about the Linux device mapper with the proc - collector. -- [Disk space](/collectors/diskspace.plugin/README.md): Collect disk space usage metrics on Linux mount points. -- [Clock synchronization](/collectors/timex.plugin/README.md): Collect the system clock synchronization status on Linux. -- [Files and directories](https://learn.netdata.cloud/docs/agent/collectors/go.d.plugin/modules/filecheck): Gather - metrics about the existence, modification time, and size of files or directories. -- [ioping.plugin](/collectors/ioping.plugin/README.md): Measure disk read/write latency. -- [NFS file servers and clients](/collectors/proc.plugin/README.md): Gather operations, utilization, and space usage - using the the `proc.plugin` collector. -- [RAID arrays](/collectors/proc.plugin/README.md): Collect health, disk status, operation status, and more with the - the `proc.plugin` collector. -- [Veritas Volume Manager](/collectors/proc.plugin/README.md): Gather metrics about the Veritas Volume Manager (VVM). -- [ZFS](/collectors/proc.plugin/README.md): Monitor bandwidth and utilization of ZFS disks/partitions using the proc - collector. +- [BCACHE](/collectors/proc.plugin/README.md): Monitor BCACHE statistics with the the `proc.plugin` collector. +- [Block devices](/collectors/proc.plugin/README.md): Gather metrics about the health and performance of block + devices using the the `proc.plugin` collector. +- [Btrfs](/collectors/proc.plugin/README.md): Monitors Btrfs filesystems with the the `proc.plugin` collector. +- [Device mapper](/collectors/proc.plugin/README.md): Gather metrics about the Linux device mapper with the proc + collector. +- [Disk space](/collectors/diskspace.plugin/README.md): Collect disk space usage metrics on Linux mount points. +- [Clock synchronization](/collectors/timex.plugin/README.md): Collect the system clock synchronization status on Linux. +- [Files and directories](https://learn.netdata.cloud/docs/agent/collectors/go.d.plugin/modules/filecheck): Gather + metrics about the existence, modification time, and size of files or directories. +- [ioping.plugin](/collectors/ioping.plugin/README.md): Measure disk read/write latency. +- [NFS file servers and clients](/collectors/proc.plugin/README.md): Gather operations, utilization, and space usage + using the the `proc.plugin` collector. +- [RAID arrays](/collectors/proc.plugin/README.md): Collect health, disk status, operation status, and more with the + the `proc.plugin` collector. +- [Veritas Volume Manager](/collectors/proc.plugin/README.md): Gather metrics about the Veritas Volume Manager (VVM). +- [ZFS](/collectors/proc.plugin/README.md): Monitor bandwidth and utilization of ZFS disks/partitions using the proc + collector. ### eBPF -- [Files](/collectors/ebpf.plugin/README.md): Provides information about how often a system calls kernel - functions related to file descriptors using the eBPF collector. -- [Virtual file system (VFS)](/collectors/ebpf.plugin/README.md): Monitor IO, errors, deleted objects, and - more for kernel virtual file systems (VFS) using the eBPF collector. -- [Processes](/collectors/ebpf.plugin/README.md): Monitor threads, task exits, and errors using the eBPF collector. +- [Files](/collectors/ebpf.plugin/README.md): Provides information about how often a system calls kernel + functions related to file descriptors using the eBPF collector. +- [Virtual file system (VFS)](/collectors/ebpf.plugin/README.md): Monitor IO, errors, deleted objects, and + more for kernel virtual file systems (VFS) using the eBPF collector. +- [Processes](/collectors/ebpf.plugin/README.md): Monitor threads, task exits, and errors using the eBPF collector. ### Hardware -- [Adaptec RAID](/collectors/python.d.plugin/adaptec_raid/README.md): Monitor logical and physical devices health - metrics using the `arcconf` tool. -- [CUPS](/collectors/cups.plugin/README.md): Monitor CUPS. -- [FreeIPMI](/collectors/freeipmi.plugin/README.md): Uses `libipmimonitoring-dev` or `libipmimonitoring-devel` to - monitor the number of sensors, temperatures, voltages, currents, and more. -- [Hard drive temperature](/collectors/python.d.plugin/hddtemp/README.md): Monitor the temperature of storage - devices. -- [HP Smart Storage Arrays](/collectors/python.d.plugin/hpssa/README.md): Monitor controller, cache module, logical - and physical drive state, and temperature using the `ssacli` tool. -- [MegaRAID controllers](/collectors/python.d.plugin/megacli/README.md): Collect adapter, physical drives, and - battery stats using the `megacli` tool. -- [NVIDIA GPU](/collectors/python.d.plugin/nvidia_smi/README.md): Monitor performance metrics (memory usage, fan - speed, pcie bandwidth utilization, temperature, and more) using the `nvidia-smi` tool. -- [Sensors](/collectors/python.d.plugin/sensors/README.md): Reads system sensors information (temperature, voltage, - electric current, power, and more) from `/sys/devices/`. -- [S.M.A.R.T](/collectors/python.d.plugin/smartd_log/README.md): Reads SMART Disk Monitoring daemon logs. +- [Adaptec RAID](/collectors/python.d.plugin/adaptec_raid/README.md): Monitor logical and physical devices health + metrics using the `arcconf` tool. +- [CUPS](/collectors/cups.plugin/README.md): Monitor CUPS. +- [FreeIPMI](/collectors/freeipmi.plugin/README.md): Uses `libipmimonitoring-dev` or `libipmimonitoring-devel` to + monitor the number of sensors, temperatures, voltages, currents, and more. +- [Hard drive temperature](/collectors/python.d.plugin/hddtemp/README.md): Monitor the temperature of storage + devices. +- [HP Smart Storage Arrays](/collectors/python.d.plugin/hpssa/README.md): Monitor controller, cache module, logical + and physical drive state, and temperature using the `ssacli` tool. +- [MegaRAID controllers](/collectors/python.d.plugin/megacli/README.md): Collect adapter, physical drives, and + battery stats using the `megacli` tool. +- [NVIDIA GPU](/collectors/python.d.plugin/nvidia_smi/README.md): Monitor performance metrics (memory usage, fan + speed, pcie bandwidth utilization, temperature, and more) using the `nvidia-smi` tool. +- [Sensors](/collectors/python.d.plugin/sensors/README.md): Reads system sensors information (temperature, voltage, + electric current, power, and more) from `/sys/devices/`. +- [S.M.A.R.T](/collectors/python.d.plugin/smartd_log/README.md): Reads SMART Disk Monitoring daemon logs. ### Memory -- [Available memory](/collectors/proc.plugin/README.md): Tracks changes in available RAM using the the `proc.plugin` - collector. -- [Committed memory](/collectors/proc.plugin/README.md): Monitor committed memory using the `proc.plugin` collector. -- [Huge pages](/collectors/proc.plugin/README.md): Gather metrics about huge pages in Linux and FreeBSD with the - `proc.plugin` collector. -- [KSM](/collectors/proc.plugin/README.md): Measure the amount of merging, savings, and effectiveness using the - `proc.plugin` collector. -- [Numa](/collectors/proc.plugin/README.md): Gather metrics on the number of non-uniform memory access (NUMA) events - every second using the `proc.plugin` collector. -- [Page faults](/collectors/proc.plugin/README.md): Collect the number of memory page faults per second using the - `proc.plugin` collector. -- [RAM](/collectors/proc.plugin/README.md): Collect metrics on system RAM, available RAM, and more using the - `proc.plugin` collector. -- [SLAB](/collectors/slabinfo.plugin/README.md): Collect kernel SLAB details on Linux systems. -- [swap](/collectors/proc.plugin/README.md): Monitor the amount of free and used swap at every second using the - `proc.plugin` collector. -- [Writeback memory](/collectors/proc.plugin/README.md): Collect how much memory is actively being written to disk at - every second using the `proc.plugin` collector. +- [Available memory](/collectors/proc.plugin/README.md): Tracks changes in available RAM using the the `proc.plugin` + collector. +- [Committed memory](/collectors/proc.plugin/README.md): Monitor committed memory using the `proc.plugin` collector. +- [Huge pages](/collectors/proc.plugin/README.md): Gather metrics about huge pages in Linux and FreeBSD with the + `proc.plugin` collector. +- [KSM](/collectors/proc.plugin/README.md): Measure the amount of merging, savings, and effectiveness using the + `proc.plugin` collector. +- [Numa](/collectors/proc.plugin/README.md): Gather metrics on the number of non-uniform memory access (NUMA) events + every second using the `proc.plugin` collector. +- [Page faults](/collectors/proc.plugin/README.md): Collect the number of memory page faults per second using the + `proc.plugin` collector. +- [RAM](/collectors/proc.plugin/README.md): Collect metrics on system RAM, available RAM, and more using the + `proc.plugin` collector. +- [SLAB](/collectors/slabinfo.plugin/README.md): Collect kernel SLAB details on Linux systems. +- [swap](/collectors/proc.plugin/README.md): Monitor the amount of free and used swap at every second using the + `proc.plugin` collector. +- [Writeback memory](/collectors/proc.plugin/README.md): Collect how much memory is actively being written to disk at + every second using the `proc.plugin` collector. ### Networks -- [Access points](/collectors/charts.d.plugin/ap/README.md): Visualizes data related to access points. -- [fping.plugin](fping.plugin/README.md): Measure network latency, jitter and packet loss between the monitored node - and any number of remote network end points. -- [Netfilter](/collectors/nfacct.plugin/README.md): Collect netfilter firewall, connection tracker, and accounting - metrics using `libmnl` and `libnetfilter_acct`. -- [Network stack](/collectors/proc.plugin/README.md): Monitor the networking stack for errors, TCP connection aborts, - bandwidth, and more. -- [Network QoS](/collectors/tc.plugin/README.md): Collect traffic QoS metrics (`tc`) of Linux network interfaces. -- [SYNPROXY](/collectors/proc.plugin/README.md): Monitor entries uses, SYN packets received, TCP cookies, and more. +- [Access points](/collectors/charts.d.plugin/ap/README.md): Visualizes data related to access points. +- [fping.plugin](fping.plugin/README.md): Measure network latency, jitter and packet loss between the monitored node + and any number of remote network end points. +- [Netfilter](/collectors/nfacct.plugin/README.md): Collect netfilter firewall, connection tracker, and accounting + metrics using `libmnl` and `libnetfilter_acct`. +- [Network stack](/collectors/proc.plugin/README.md): Monitor the networking stack for errors, TCP connection aborts, + bandwidth, and more. +- [Network QoS](/collectors/tc.plugin/README.md): Collect traffic QoS metrics (`tc`) of Linux network interfaces. +- [SYNPROXY](/collectors/proc.plugin/README.md): Monitor entries uses, SYN packets received, TCP cookies, and more. ### Operating systems -- [freebsd.plugin](freebsd.plugin/README.md): Collect resource usage and performance data on FreeBSD systems. -- [macOS](/collectors/macos.plugin/README.md): Collect resource usage and performance data on macOS systems. +- [freebsd.plugin](freebsd.plugin/README.md): Collect resource usage and performance data on FreeBSD systems. +- [macOS](/collectors/macos.plugin/README.md): Collect resource usage and performance data on macOS systems. ### Processes -- [Applications](/collectors/apps.plugin/README.md): Gather CPU, disk, memory, network, eBPF, and other metrics per - application using the `apps.plugin` collector. -- [systemd](/collectors/cgroups.plugin/README.md): Monitor the CPU and memory usage of systemd services using the - `cgroups.plugin` collector. -- [systemd unit states](https://learn.netdata.cloud/docs/agent/collectors/go.d.plugin/modules/systemdunits): See the - state (active, inactive, activating, deactivating, failed) of various systemd unit types. -- [System processes](/collectors/proc.plugin/README.md): Collect metrics on system load and total processes running - using `/proc/loadavg` and the `proc.plugin` collector. -- [Uptime](/collectors/proc.plugin/README.md): Monitor the uptime of a system using the `proc.plugin` collector. +- [Applications](/collectors/apps.plugin/README.md): Gather CPU, disk, memory, network, eBPF, and other metrics per + application using the `apps.plugin` collector. +- [systemd](/collectors/cgroups.plugin/README.md): Monitor the CPU and memory usage of systemd services using the + `cgroups.plugin` collector. +- [systemd unit states](https://learn.netdata.cloud/docs/agent/collectors/go.d.plugin/modules/systemdunits): See the + state (active, inactive, activating, deactivating, failed) of various systemd unit types. +- [System processes](/collectors/proc.plugin/README.md): Collect metrics on system load and total processes running + using `/proc/loadavg` and the `proc.plugin` collector. +- [Uptime](/collectors/proc.plugin/README.md): Monitor the uptime of a system using the `proc.plugin` collector. ### Resources -- [CPU frequency](/collectors/proc.plugin/README.md): Monitor CPU frequency, as set by the `cpufreq` kernel module, - using the `proc.plugin` collector. -- [CPU idle](/collectors/proc.plugin/README.md): Measure CPU idle every second using the `proc.plugin` collector. -- [CPU performance](/collectors/perf.plugin/README.md): Collect CPU performance metrics using performance monitoring - units (PMU). -- [CPU throttling](/collectors/proc.plugin/README.md): Gather metrics about thermal throttling using the `/proc/stat` - module and the `proc.plugin` collector. -- [CPU utilization](/collectors/proc.plugin/README.md): Capture CPU utilization, both system-wide and per-core, using - the `/proc/stat` module and the `proc.plugin` collector. -- [Entropy](/collectors/proc.plugin/README.md): Monitor the available entropy on a system using the `proc.plugin` - collector. -- [Interprocess Communication (IPC)](/collectors/proc.plugin/README.md): Monitor IPC semaphores and shared memory - using the `proc.plugin` collector. -- [Interrupts](/collectors/proc.plugin/README.md): Monitor interrupts per second using the `proc.plugin` collector. -- [IdleJitter](/collectors/idlejitter.plugin/README.md): Measure CPU latency and jitter on all operating systems. -- [SoftIRQs](/collectors/proc.plugin/README.md): Collect metrics on SoftIRQs, both system-wide and per-core, using the - `proc.plugin` collector. -- [SoftNet](/collectors/proc.plugin/README.md): Capture SoftNet events per second, both system-wide and per-core, - using the `proc.plugin` collector. +- [CPU frequency](/collectors/proc.plugin/README.md): Monitor CPU frequency, as set by the `cpufreq` kernel module, + using the `proc.plugin` collector. +- [CPU idle](/collectors/proc.plugin/README.md): Measure CPU idle every second using the `proc.plugin` collector. +- [CPU performance](/collectors/perf.plugin/README.md): Collect CPU performance metrics using performance monitoring + units (PMU). +- [CPU throttling](/collectors/proc.plugin/README.md): Gather metrics about thermal throttling using the `/proc/stat` + module and the `proc.plugin` collector. +- [CPU utilization](/collectors/proc.plugin/README.md): Capture CPU utilization, both system-wide and per-core, using + the `/proc/stat` module and the `proc.plugin` collector. +- [Entropy](/collectors/proc.plugin/README.md): Monitor the available entropy on a system using the `proc.plugin` + collector. +- [Interprocess Communication (IPC)](/collectors/proc.plugin/README.md): Monitor IPC semaphores and shared memory + using the `proc.plugin` collector. +- [Interrupts](/collectors/proc.plugin/README.md): Monitor interrupts per second using the `proc.plugin` collector. +- [IdleJitter](/collectors/idlejitter.plugin/README.md): Measure CPU latency and jitter on all operating systems. +- [SoftIRQs](/collectors/proc.plugin/README.md): Collect metrics on SoftIRQs, both system-wide and per-core, using the + `proc.plugin` collector. +- [SoftNet](/collectors/proc.plugin/README.md): Capture SoftNet events per second, both system-wide and per-core, + using the `proc.plugin` collector. ### Users -- [systemd-logind](/collectors/python.d.plugin/logind/README.md): Monitor active sessions, users, and seats tracked - by `systemd-logind` or `elogind`. -- [User/group usage](/collectors/apps.plugin/README.md): Gather CPU, disk, memory, network, and other metrics per user - and user group using the `apps.plugin` collector. +- [systemd-logind](/collectors/python.d.plugin/logind/README.md): Monitor active sessions, users, and seats tracked + by `systemd-logind` or `elogind`. +- [User/group usage](/collectors/apps.plugin/README.md): Gather CPU, disk, memory, network, and other metrics per user + and user group using the `apps.plugin` collector. ## Netdata collectors These collectors are recursive in nature, in that they monitor some function of the Netdata Agent itself. Some collectors are described only in code and associated charts in Netdata dashboards. -- [ACLK (code only)](https://github.com/netdata/netdata/blob/master/aclk/legacy/aclk_stats.c): View whether a Netdata - Agent is connected to Netdata Cloud via the [ACLK](/aclk/README.md), the volume of queries, process times, and more. -- [Alarms](https://learn.netdata.cloud/docs/agent/collectors/python.d.plugin/alarms): This collector creates an - **Alarms** menu with one line plot showing the alarm states of a Netdata Agent over time. -- [Anomalies](https://learn.netdata.cloud/docs/agent/collectors/python.d.plugin/anomalies): This collector uses the - Python PyOD library to perform unsupervised anomaly detection on your Netdata charts and/or dimensions. -- [Exporting (code only)](https://github.com/netdata/netdata/blob/master/exporting/send_internal_metrics.c): Gather - metrics on CPU utilization for the [exporting engine](/exporting/README.md), and specific metrics for each enabled - exporting connector. -- [Global statistics (code only)](https://github.com/netdata/netdata/blob/master/daemon/global_statistics.c): See - metrics on the CPU utilization, network traffic, volume of web clients, API responses, database engine usage, and - more. +- [ACLK (code only)](https://github.com/netdata/netdata/blob/master/aclk/legacy/aclk_stats.c): View whether a Netdata + Agent is connected to Netdata Cloud via the [ACLK](/aclk/README.md), the volume of queries, process times, and more. +- [Alarms](https://learn.netdata.cloud/docs/agent/collectors/python.d.plugin/alarms): This collector creates an + **Alarms** menu with one line plot showing the alarm states of a Netdata Agent over time. +- [Anomalies](https://learn.netdata.cloud/docs/agent/collectors/python.d.plugin/anomalies): This collector uses the + Python PyOD library to perform unsupervised anomaly detection on your Netdata charts and/or dimensions. +- [Exporting (code only)](https://github.com/netdata/netdata/blob/master/exporting/send_internal_metrics.c): Gather + metrics on CPU utilization for the [exporting engine](/exporting/README.md), and specific metrics for each enabled + exporting connector. +- [Global statistics (code only)](https://github.com/netdata/netdata/blob/master/daemon/global_statistics.c): See + metrics on the CPU utilization, network traffic, volume of web clients, API responses, database engine usage, and + more. ## Orchestrators @@ -509,28 +484,25 @@ the `go.d.plugin`. - [go.d.plugin](https://github.com/netdata/go.d.plugin): An orchestrator for data collection modules written in `go`. - [python.d.plugin](python.d.plugin/README.md): An orchestrator for data collection modules written in `python` v2/v3. - [charts.d.plugin](charts.d.plugin/README.md): An orchestrator for data collection modules written in `bash` v4+. -- [node.d.plugin](node.d.plugin/README.md): An orchestrator for data collection modules written in `node.js`. ## Third-party collectors These collectors are developed and maintained by third parties and, unlike the other collectors, are not installed by default. To use a third-party collector, visit their GitHub/documentation page and follow their installation procedures. -- [CyberPower UPS](https://github.com/HawtDogFlvrWtr/netdata_cyberpwrups_plugin): Polls CyberPower UPS data using - PowerPanel® Personal Linux. -- [Logged-in users](https://github.com/veksh/netdata-numsessions): Collect the number of currently logged-on users. -- [nextcloud](https://github.com/arnowelzel/netdata-nextcloud): Monitor Nextcloud servers. -- [nim-netdata-plugin](https://github.com/FedericoCeratto/nim-netdata-plugin): A helper to create native Netdata - plugins using Nim. -- [Nvidia GPUs](https://github.com/coraxx/netdata_nv_plugin): Monitor Nvidia GPUs. -- [Teamspeak 3](https://github.com/coraxx/netdata_ts3_plugin): Pulls active users and bandwidth from TeamSpeak 3 - servers. -- [SSH](https://github.com/Yaser-Amiri/netdata-ssh-module): Monitor failed authentication requests of an SSH server. +- [CyberPower UPS](https://github.com/HawtDogFlvrWtr/netdata_cyberpwrups_plugin): Polls CyberPower UPS data using + PowerPanel® Personal Linux. +- [Logged-in users](https://github.com/veksh/netdata-numsessions): Collect the number of currently logged-on users. +- [nextcloud](https://github.com/arnowelzel/netdata-nextcloud): Monitor Nextcloud servers. +- [nim-netdata-plugin](https://github.com/FedericoCeratto/nim-netdata-plugin): A helper to create native Netdata + plugins using Nim. +- [Nvidia GPUs](https://github.com/coraxx/netdata_nv_plugin): Monitor Nvidia GPUs. +- [Teamspeak 3](https://github.com/coraxx/netdata_ts3_plugin): Pulls active users and bandwidth from TeamSpeak 3 + servers. +- [SSH](https://github.com/Yaser-Amiri/netdata-ssh-module): Monitor failed authentication requests of an SSH server. ## Etc -- [checks.plugin](checks.plugin/README.md): A debugging collector, disabled by default. -- [charts.d example](charts.d.plugin/example/README.md): An example `charts.d` collector. -- [python.d example](python.d.plugin/example/README.md): An example `python.d` collector. - - +- [checks.plugin](checks.plugin/README.md): A debugging collector, disabled by default. +- [charts.d example](charts.d.plugin/example/README.md): An example `charts.d` collector. +- [python.d example](python.d.plugin/example/README.md): An example `python.d` collector. diff --git a/collectors/Makefile.am b/collectors/Makefile.am index 021e2ff23..a0a972e8f 100644 --- a/collectors/Makefile.am +++ b/collectors/Makefile.am @@ -20,7 +20,6 @@ SUBDIRS = \ nfacct.plugin \ xenstat.plugin \ perf.plugin \ - node.d.plugin \ proc.plugin \ python.d.plugin \ slabinfo.plugin \ diff --git a/collectors/README.md b/collectors/README.md index 3b76e1624..de46a72a4 100644 --- a/collectors/README.md +++ b/collectors/README.md @@ -1,6 +1,7 @@ <!-- title: "Collecting metrics" custom_edit_url: https://github.com/netdata/netdata/edit/master/collectors/README.md +id: "collectors-ref" --> # Collecting metrics diff --git a/collectors/REFERENCE.md b/collectors/REFERENCE.md index bd267c5c6..949858f60 100644 --- a/collectors/REFERENCE.md +++ b/collectors/REFERENCE.md @@ -67,9 +67,6 @@ field contains `go.d`, that collector uses the Go orchestrator. # Python orchestrator (python.d.plugin) ./python.d.plugin <MODULE_NAME> debug trace -# Node orchestrator (node.d.plugin) -./node.d.plugin debug 1 <MODULE_NAME> - # Bash orchestrator (bash.d.plugin) ./charts.d.plugin debug 1 <MODULE_NAME> ``` @@ -87,8 +84,6 @@ This section features a list of Netdata's plugins, with a boolean setting to ena ```conf [plugins] - # PATH environment variable = /usr/local/sbin:/usr/local/bin:/usr/sbin:/usr/bin:/var/lib/snapd/snap/bin:/sbin:/usr/sbin:/usr/local/bin:/usr/local/sbin - # PYTHONPATH environment variable = # proc = yes # diskspace = yes # timex = yes @@ -100,7 +95,6 @@ This section features a list of Netdata's plugins, with a boolean setting to ena # slabinfo = no # fping = yes # ioping = yes - # node.d = yes # python.d = yes # go.d = yes # apps = yes diff --git a/collectors/all.h b/collectors/all.h index 61f3c01bf..3d7304dd5 100644 --- a/collectors/all.h +++ b/collectors/all.h @@ -360,10 +360,8 @@ #define NETDATA_CHART_PRIO_CHECKS 99999 -#define NETDATA_CHART_PRIO_NETDATA_DISKSPACE 132020 #define NETDATA_CHART_PRIO_NETDATA_TIMEX 132030 -#define NETDATA_CHART_PRIO_NETDATA_TC_CPU 135000 -#define NETDATA_CHART_PRIO_NETDATA_TC_TIME 135001 +#define NETDATA_CHART_PRIO_NETDATA_TC_TIME 1000100 #endif //NETDATA_ALL_H diff --git a/collectors/apps.plugin/README.md b/collectors/apps.plugin/README.md index 76821695a..150889d45 100644 --- a/collectors/apps.plugin/README.md +++ b/collectors/apps.plugin/README.md @@ -160,7 +160,7 @@ There are a few command line options you can pass to `apps.plugin`. The list of ### Integration with eBPF If you don't see charts under the **eBPF syscall** or **eBPF net** sections, you should edit your -[`ebpf.d.conf`](/collectors/ebpf.plugin/README.md#ebpf-programs) file to ensure the eBPF program is enabled. +[`ebpf.d.conf`](/collectors/ebpf.plugin/README.md#configure-the-ebpf-collector) file to ensure the eBPF program is enabled. Also see our [guide on troubleshooting apps with eBPF metrics](/docs/guides/troubleshoot/monitor-debug-applications-ebpf.md) for ideas on how to interpret these charts in a diff --git a/collectors/apps.plugin/apps_groups.conf b/collectors/apps.plugin/apps_groups.conf index f4824cd9d..1d1af4b70 100644 --- a/collectors/apps.plugin/apps_groups.conf +++ b/collectors/apps.plugin/apps_groups.conf @@ -82,7 +82,6 @@ cups.plugin: cups.plugin xenstat.plugin: xenstat.plugin perf.plugin: perf.plugin charts.d.plugin: *charts.d.plugin* -node.d.plugin: *node.d.plugin* python.d.plugin: *python.d.plugin* tc-qos-helper: *tc-qos-helper.sh* fping: fping @@ -103,7 +102,7 @@ fail2ban: fail2ban* # ----------------------------------------------------------------------------- # web/ftp servers -httpd: apache* httpd nginx* lighttpd hiawatha +httpd: apache* httpd nginx* lighttpd hiawatha caddy proxy: squid* c-icap squidGuard varnish* php: php* lsphp* ftpd: proftpd in.tftpd vsftpd @@ -128,10 +127,11 @@ email: dovecot imapd pop3d amavis* zmstat* zmmailboxdmgr saslauthd opendkim post # network, routing, VPN ppp: ppp* -vpn: openvpn pptp* cjdroute gvpe tincd wireguard -wifi: hostapd wpa_supplicant NetworkManager +vpn: openvpn pptp* cjdroute gvpe tincd wireguard tailscaled +wifi: hostapd wpa_supplicant routing: ospfd* ospf6d* bgpd bfdd fabricd isisd eigrpd sharpd staticd ripd ripngd pimd pbrd nhrpd ldpd zebra vrrpd vtysh bird* modem: ModemManager +netmanager: NetworkManager nm* systemd-networkd networkctl netplan tor: tor # ----------------------------------------------------------------------------- @@ -139,7 +139,7 @@ tor: tor camo: *camo* balancer: ipvs_* haproxy -ha: corosync hs_logd ha_logd stonithd pacemakerd lrmd crmd +ha: corosync hs_logd ha_logd stonithd pacemakerd lrmd crmd keepalived # ----------------------------------------------------------------------------- # telephony @@ -183,14 +183,19 @@ heapster: heapster # ----------------------------------------------------------------------------- # AWS -aws-s3: '*aws s3*' +aws-s3: '*aws s3*' s3cmd s5cmd aws: aws # ----------------------------------------------------------------------------- +# virtualization platform + +proxmox-ve: pve* + +# ----------------------------------------------------------------------------- # containers & virtual machines containers: lxc* docker* balena* -VMs: vbox* VBox* qemu* +VMs: vbox* VBox* qemu* kvm # ----------------------------------------------------------------------------- # ssh servers and clients @@ -350,4 +355,3 @@ gremlin: gremlin* # load testing tools locust: locust - diff --git a/collectors/apps.plugin/apps_plugin.c b/collectors/apps.plugin/apps_plugin.c index 6924b2bf4..8a115d061 100644 --- a/collectors/apps.plugin/apps_plugin.c +++ b/collectors/apps.plugin/apps_plugin.c @@ -118,6 +118,7 @@ typedef enum { PROC_STATUS_END, //place holder for ending enum fields } proc_state; +#ifndef __FreeBSD__ static proc_state proc_state_count[PROC_STATUS_END]; static const char *proc_states[] = { [PROC_STATUS_RUNNING] = "running", @@ -126,6 +127,7 @@ static const char *proc_states[] = { [PROC_STATUS_ZOMBIE] = "zombie", [PROC_STATUS_STOPPED] = "stopped", }; +#endif // ---------------------------------------------------------------------------- // internal flags @@ -1252,7 +1254,6 @@ void arl_callback_status_rssshmem(const char *name, uint32_t hash, const char *v aptr->p->status_rssshmem = str2kernel_uint_t(procfile_lineword(aptr->ff, aptr->line, 1)); } -#endif // !__FreeBSD__ static void update_proc_state_count(char proc_state) { switch (proc_state) { @@ -1275,6 +1276,7 @@ static void update_proc_state_count(char proc_state) { break; } } +#endif // !__FreeBSD__ static inline int read_proc_pid_status(struct pid_stat *p, void *ptr) { p->status_vmsize = 0; @@ -1495,7 +1497,9 @@ static inline int read_proc_pid_stat(struct pid_stat *p, void *ptr) { p->cstime = 0; p->cgtime = 0; } +#ifndef __FreeBSD__ update_proc_state_count(p->state); +#endif return 1; cleanup: @@ -1640,7 +1644,7 @@ cleanup: } #else static inline int read_global_time() { - static kernel_uint_t utime_raw = 0, stime_raw = 0, gtime_raw = 0, ntime_raw = 0; + static kernel_uint_t utime_raw = 0, stime_raw = 0, ntime_raw = 0; static usec_t collected_usec = 0, last_collected_usec = 0; long cp_time[CPUSTATES]; @@ -1958,6 +1962,8 @@ static inline int read_pid_file_descriptors(struct pid_stat *p, void *ptr) { static char *fdsbuf; char *bfdsbuf, *efdsbuf; char fdsname[FILENAME_MAX + 1]; +#define SHM_FORMAT_LEN 31 // format: 21 + size: 10 + char shm_name[FILENAME_MAX - SHM_FORMAT_LEN + 1]; // we make all pid fds negative, so that // we can detect unused file descriptors @@ -1995,7 +2001,7 @@ static inline int read_pid_file_descriptors(struct pid_stat *p, void *ptr) { } // get file descriptors array index - int fdid = fds->kf_fd; + size_t fdid = fds->kf_fd; // check if the fds array is small if (unlikely(fdid >= p->fds_size)) { @@ -2055,7 +2061,8 @@ static inline int read_pid_file_descriptors(struct pid_stat *p, void *ptr) { #endif break; case KF_TYPE_SHM: - sprintf(fdsname, "other: shm: %s size: %lu", fds->kf_path, fds->kf_un.kf_file.kf_file_size); + strncpyz(shm_name, fds->kf_path, FILENAME_MAX - SHM_FORMAT_LEN); + sprintf(fdsname, "other: shm: %s size: %lu", shm_name, fds->kf_un.kf_file.kf_file_size); break; case KF_TYPE_SEM: sprintf(fdsname, "other: sem: %u", fds->kf_un.kf_sem.kf_sem_value); @@ -2575,9 +2582,10 @@ static inline int collect_data_for_pid(pid_t pid, void *ptr) { static int collect_data_for_all_processes(void) { struct pid_stat *p = NULL; +#ifndef __FreeBSD__ // clear process state counter memset(proc_state_count, 0, sizeof proc_state_count); -#ifdef __FreeBSD__ +#else int i, procnum; static size_t procbase_size = 0; @@ -3760,7 +3768,7 @@ static void send_charts_updates_to_netdata(struct target *root, const char *type } if(show_guest_time) { - fprintf(stdout, "CHART %s.cpu_guest '' '%s CPU Guest Time (100%% = 1 core)' 'percentage' cpu %s.cpu_system stacked 20022 %d\n", type, title, type, update_every); + fprintf(stdout, "CHART %s.cpu_guest '' '%s CPU Guest Time (100%% = 1 core)' 'percentage' cpu %s.cpu_guest stacked 20022 %d\n", type, title, type, update_every); for (w = root; w; w = w->next) { if(unlikely(w->exposed)) fprintf(stdout, "DIMENSION %s '' absolute 1 %llu\n", w->name, time_factor * RATES_DETAIL / 100LLU); @@ -3849,6 +3857,8 @@ static void send_charts_updates_to_netdata(struct target *root, const char *type } } + +#ifndef __FreeBSD__ static void send_proc_states_count(usec_t dt) { static bool chart_added = false; @@ -3872,6 +3882,7 @@ static void send_proc_states_count(usec_t dt) } send_END(); } +#endif // ---------------------------------------------------------------------------- // parse command line arguments @@ -4124,6 +4135,8 @@ static int check_capabilities() { int main(int argc, char **argv) { // debug_flags = D_PROCFILE; + clocks_init(); + pagesize = (size_t)sysconf(_SC_PAGESIZE); // set the name for logging diff --git a/collectors/cgroups.plugin/Makefile.am b/collectors/cgroups.plugin/Makefile.am index 9e924aba1..354b9fbdc 100644 --- a/collectors/cgroups.plugin/Makefile.am +++ b/collectors/cgroups.plugin/Makefile.am @@ -3,19 +3,11 @@ AUTOMAKE_OPTIONS = subdir-objects MAINTAINERCLEANFILES = $(srcdir)/Makefile.in -CLEANFILES = \ - cgroup-name.sh \ - $(NULL) - -include $(top_srcdir)/build/subst.inc -SUFFIXES = .in - dist_plugins_SCRIPTS = \ cgroup-name.sh \ cgroup-network-helper.sh \ $(NULL) dist_noinst_DATA = \ - cgroup-name.sh.in \ README.md \ $(NULL) diff --git a/collectors/cgroups.plugin/README.md b/collectors/cgroups.plugin/README.md index d74ef000e..d0f822e66 100644 --- a/collectors/cgroups.plugin/README.md +++ b/collectors/cgroups.plugin/README.md @@ -7,30 +7,28 @@ custom_edit_url: https://github.com/netdata/netdata/edit/master/collectors/cgrou You can monitor containers and virtual machines using **cgroups**. -cgroups (or control groups), are a Linux kernel feature that provides accounting and resource usage limiting for processes. When cgroups are bundled with namespaces (i.e. isolation), they form what we usually call **containers**. +cgroups (or control groups), are a Linux kernel feature that provides accounting and resource usage limiting for +processes. When cgroups are bundled with namespaces (i.e. isolation), they form what we usually call **containers**. -cgroups are hierarchical, meaning that cgroups can contain child cgroups, which can contain more cgroups, etc. All accounting is reported (and resource usage limits are applied) also in a hierarchical way. +cgroups are hierarchical, meaning that cgroups can contain child cgroups, which can contain more cgroups, etc. All +accounting is reported (and resource usage limits are applied) also in a hierarchical way. -To visualize cgroup metrics Netdata provides configuration for cherry picking the cgroups of interest. By default (without any configuration) Netdata should pick **systemd services**, all kinds of **containers** (lxc, docker, etc) and **virtual machines** spawn by managers that register them with cgroups (qemu, libvirt, etc). +To visualize cgroup metrics Netdata provides configuration for cherry picking the cgroups of interest. By default ( +without any configuration) Netdata should pick **systemd services**, all kinds of **containers** (lxc, docker, etc) +and **virtual machines** spawn by managers that register them with cgroups (qemu, libvirt, etc). -## configuring Netdata for cgroups +## Configuring Netdata for cgroups -For each cgroup available in the system, Netdata provides this configuration: - -``` -[plugin:cgroups] - enable cgroup XXX = yes | no -``` - -But it also provides a few patterns to provide a sane default (`yes` or `no`). - -Below we see, how this works. +In general, no additional settings are required. Netdata discovers all available cgroups on the host system and +collects their metrics. ### how Netdata finds the available cgroups -Linux exposes resource usage reporting and provides dynamic configuration for cgroups, using virtual files (usually) under `/sys/fs/cgroup`. Netdata reads `/proc/self/mountinfo` to detect the exact mount point of cgroups. Netdata also allows manual configuration of this mount point, using these settings: +Linux exposes resource usage reporting and provides dynamic configuration for cgroups, using virtual files (usually) +under `/sys/fs/cgroup`. Netdata reads `/proc/self/mountinfo` to detect the exact mount point of cgroups. Netdata also +allows manual configuration of this mount point, using these settings: -``` +```text [plugin:cgroups] check for new cgroups every = 10 path to /sys/fs/cgroup/cpuacct = /sys/fs/cgroup/cpuacct @@ -43,90 +41,104 @@ Netdata rescans these directories for added or removed cgroups every `check for ### hierarchical search for cgroups -Since cgroups are hierarchical, for each of the directories shown above, Netdata walks through the subdirectories recursively searching for cgroups (each subdirectory is another cgroup). +Since cgroups are hierarchical, for each of the directories shown above, Netdata walks through the subdirectories +recursively searching for cgroups (each subdirectory is another cgroup). -For each of the directories found, Netdata provides a configuration variable: +To provide a sane default for this setting, Netdata uses the following pattern list (patterns starting with `!` give a +negative match and their order is important: the first matching a path will be used): -``` -[plugin:cgroups] - search for cgroups under PATH = yes | no -``` - -To provide a sane default for this setting, Netdata uses the following pattern list (patterns starting with `!` give a negative match and their order is important: the first matching a path will be used): - -``` +```text [plugin:cgroups] search for cgroups in subpaths matching = !*/init.scope !*-qemu !/init.scope !/system !/systemd !/user !/user.slice * ``` -So, we disable checking for **child cgroups** in systemd internal cgroups ([systemd services are monitored by Netdata](#monitoring-systemd-services)), user cgroups (normally used for desktop and remote user sessions), qemu virtual machines (child cgroups of virtual machines) and `init.scope`. All others are enabled. +So, we disable checking for **child cgroups** in systemd internal +cgroups ([systemd services are monitored by Netdata](#monitoring-systemd-services)), user cgroups (normally used for +desktop and remote user sessions), qemu virtual machines (child cgroups of virtual machines) and `init.scope`. All +others are enabled. ### unified cgroups (cgroups v2) support -Basic unified cgroups metrics are supported. To use them instead of v1 cgroups add: +Netdata automatically detects cgroups version. If detection fails Netdata assumes v1. +To switch to v2 manually add: -``` +```text [plugin:cgroups] use unified cgroups = yes path to unified cgroups = /sys/fs/cgroup ``` -Unified cgroups use same name pattern matching as v1 cgroups. `cgroup_enable_systemd_services_detailed_memory` is currently unsupported when using unified cgroups. +Unified cgroups use same name pattern matching as v1 cgroups. `cgroup_enable_systemd_services_detailed_memory` is +currently unsupported when using unified cgroups. ### enabled cgroups -To check if the cgroup is enabled, Netdata uses this setting: - -``` -[plugin:cgroups] - enable cgroup NAME = yes | no -``` +To provide a sane default, Netdata uses the +following [pattern list](https://learn.netdata.cloud/docs/agent/libnetdata/simple_pattern): -To provide a sane default, Netdata uses the following pattern list (it checks the pattern against the path of the cgroup): +- checks the pattern against the path of the cgroup -``` -[plugin:cgroups] - enable by default cgroups matching = !*/init.scope *.scope !*/vcpu* !*/emulator !*.mount !*.partition !*.service !*.slice !*.swap !*.user !/ !/docker !/libvirt !/lxc !/lxc/*/ns !/lxc/*/ns/* !/machine !/qemu !/system !/systemd !/user * -``` + ```text + [plugin:cgroups] + enable by default cgroups matching = !*/init.scope *.scope !*/vcpu* !*/emulator !*.mount !*.partition !*.service !*.slice !*.swap !*.user !/ !/docker !/libvirt !/lxc !/lxc/*/ns !/lxc/*/ns/* !/machine !/qemu !/system !/systemd !/user * + ``` -The above provides the default `yes` or `no` setting for the cgroup. However, there is an additional step. In many cases the cgroups found in the `/sys/fs/cgroup` hierarchy are just random numbers and in many cases these numbers are ephemeral: they change across reboots or sessions. +- checks the pattern against the name of the cgroup (as you see it on the dashboard) -So, we need to somehow map the paths of the cgroups to names, to provide consistent Netdata configuration (i.e. there is no point to say `enable cgroup 1234 = yes | no`, if `1234` is a random number that changes over time - we need a name for the cgroup first, so that `enable cgroup NAME = yes | no` will be consistent). + ```text + [plugin:cgroups] + enable by default cgroups names matching = * + ``` -For this mapping Netdata provides 2 configuration options: +Renaming is configured with the following options: -``` +```text [plugin:cgroups] run script to rename cgroups matching = *.scope *docker* *lxc* *qemu* !/ !*.mount !*.partition !*.service !*.slice !*.swap !*.user * script to get cgroup names = /usr/libexec/netdata/plugins.d/cgroup-name.sh ``` -The whole point for the additional pattern list, is to limit the number of times the script will be called. Without this pattern list, the script might be called thousands of times, depending on the number of cgroups available in the system. +The whole point for the additional pattern list, is to limit the number of times the script will be called. Without this +pattern list, the script might be called thousands of times, depending on the number of cgroups available in the system. -The above pattern list is matched against the path of the cgroup. For matched cgroups, Netdata calls the script [cgroup-name.sh](https://raw.githubusercontent.com/netdata/netdata/master/collectors/cgroups.plugin/cgroup-name.sh.in) to get its name. This script queries `docker`, `kubectl`, `podman`, or applies heuristics to find give a name for the cgroup. +The above pattern list is matched against the path of the cgroup. For matched cgroups, Netdata calls the +script [cgroup-name.sh](https://raw.githubusercontent.com/netdata/netdata/master/collectors/cgroups.plugin/cgroup-name.sh) +to get its name. This script queries `docker`, `kubectl`, `podman`, or applies heuristics to find give a name for the +cgroup. #### Note on Podman container names -Podman's security model is a lot more restrictive than Docker's, so Netdata will not be able to detect container names out of the box unless they were started by the same user as Netdata itself. +Podman's security model is a lot more restrictive than Docker's, so Netdata will not be able to detect container names +out of the box unless they were started by the same user as Netdata itself. -If Podman is used in "rootful" mode, it's also possible to use `podman system service` to grant Netdata access to container names. To do this, ensure `podman system service` is running and Netdata has access to `/run/podman/podman.sock` (the default permissions as specified by upstream are `0600`, with owner `root`, so you will have to adjust the configuration). +If Podman is used in "rootful" mode, it's also possible to use `podman system service` to grant Netdata access to +container names. To do this, ensure `podman system service` is running and Netdata has access +to `/run/podman/podman.sock` (the default permissions as specified by upstream are `0600`, with owner `root`, so you +will have to adjust the configuration). -[docker-socket-proxy](https://github.com/Tecnativa/docker-socket-proxy) can also be used to give Netdata restricted access to the socket. Note that `PODMAN_HOST` in Netdata's environment should be set to the proxy's URL in this case. +[docker-socket-proxy](https://github.com/Tecnativa/docker-socket-proxy) can also be used to give Netdata restricted +access to the socket. Note that `PODMAN_HOST` in Netdata's environment should be set to the proxy's URL in this case. ### charts with zero metrics -By default, Netdata will enable monitoring metrics only when they are not zero. If they are constantly zero they are ignored. Metrics that will start having values, after Netdata is started, will be detected and charts will be automatically added to the dashboard (a refresh of the dashboard is needed for them to appear though). Set `yes` for a chart instead of `auto` to enable it permanently. For example: +By default, Netdata will enable monitoring metrics only when they are not zero. If they are constantly zero they are +ignored. Metrics that will start having values, after Netdata is started, will be detected and charts will be +automatically added to the dashboard (a refresh of the dashboard is needed for them to appear though). Set `yes` for a +chart instead of `auto` to enable it permanently. For example: -``` +```text [plugin:cgroups] enable memory (used mem including cache) = yes ``` -You can also set the `enable zero metrics` option to `yes` in the `[global]` section which enables charts with zero metrics for all internal Netdata plugins. +You can also set the `enable zero metrics` option to `yes` in the `[global]` section which enables charts with zero +metrics for all internal Netdata plugins. ### alarms -CPU and memory limits are watched and used to rise alarms. Memory usage for every cgroup is checked against `ram` and `ram+swap` limits. CPU usage for every cgroup is checked against `cpuset.cpus` and `cpu.cfs_period_us` + `cpu.cfs_quota_us` pair assigned for the cgroup. Configuration for the alarms is available in `health.d/cgroups.conf` file. +CPU and memory limits are watched and used to rise alarms. Memory usage for every cgroup is checked against `ram` +and `ram+swap` limits. CPU usage for every cgroup is checked against `cpuset.cpus` and `cpu.cfs_period_us` + `cpu.cfs_quota_us` pair assigned for the cgroup. Configuration for the alarms is available in `health.d/cgroups.conf` +file. ## Monitoring systemd services @@ -136,47 +148,48 @@ Netdata monitors **systemd services**. Example: Support per distribution: -|system|systemd services<br/>charts shown|`tree`<br/>`/sys/fs/cgroup`|comments| -|:----:|:-------------------------------:|:-------------------------:|:-------| -|Arch Linux|YES||| -|Gentoo|NO||can be enabled, see below| -|Ubuntu 16.04 LTS|YES||| -|Ubuntu 16.10|YES|[here](http://pastebin.com/PiWbQEXy)|| -|Fedora 25|YES|[here](http://pastebin.com/ax0373wF)|| -|Debian 8|NO||can be enabled, see below| -|AMI|NO|[here](http://pastebin.com/FrxmptjL)|not a systemd system| -|CentOS 7.3.1611|NO|[here](http://pastebin.com/SpzgezAg)|can be enabled, see below| +| system | charts shown | `/sys/fs/cgroup` tree | comments | +|:----------------:|:------------:|:------------------------------------:|:--------------------------| +| Arch Linux | YES | | | +| Gentoo | NO | | can be enabled, see below | +| Ubuntu 16.04 LTS | YES | | | +| Ubuntu 16.10 | YES | [here](http://pastebin.com/PiWbQEXy) | | +| Fedora 25 | YES | [here](http://pastebin.com/ax0373wF) | | +| Debian 8 | NO | | can be enabled, see below | +| AMI | NO | [here](http://pastebin.com/FrxmptjL) | not a systemd system | +| CentOS 7.3.1611 | NO | [here](http://pastebin.com/SpzgezAg) | can be enabled, see below | ### Monitored systemd service metrics -- CPU utilization -- Used memory -- RSS memory -- Mapped memory -- Cache memory -- Writeback memory -- Memory minor page faults -- Memory major page faults -- Memory charging activity -- Memory uncharging activity -- Memory limit failures -- Swap memory used -- Disk read bandwidth -- Disk write bandwidth -- Disk read operations -- Disk write operations -- Throttle disk read bandwidth -- Throttle disk write bandwidth -- Throttle disk read operations -- Throttle disk write operations -- Queued disk read operations -- Queued disk write operations -- Merged disk read operations -- Merged disk write operations +- CPU utilization +- Used memory +- RSS memory +- Mapped memory +- Cache memory +- Writeback memory +- Memory minor page faults +- Memory major page faults +- Memory charging activity +- Memory uncharging activity +- Memory limit failures +- Swap memory used +- Disk read bandwidth +- Disk write bandwidth +- Disk read operations +- Disk write operations +- Throttle disk read bandwidth +- Throttle disk write bandwidth +- Throttle disk read operations +- Throttle disk write operations +- Queued disk read operations +- Queued disk write operations +- Merged disk read operations +- Merged disk write operations ### how to enable cgroup accounting on systemd systems that is by default disabled -You can verify there is no accounting enabled, by running `systemd-cgtop`. The program will show only resources for cgroup `/`, but all services will show nothing. +You can verify there is no accounting enabled, by running `systemd-cgtop`. The program will show only resources for +cgroup `/`, but all services will show nothing. To enable cgroup accounting, execute this: @@ -186,7 +199,7 @@ sed -e 's|^#Default\(.*\)Accounting=.*$|Default\1Accounting=yes|g' /etc/systemd/ To see the changes it made, run this: -``` +```sh # diff /etc/systemd/system.conf /tmp/system.conf 40,44c40,44 < #DefaultCPUAccounting=no @@ -212,21 +225,25 @@ sudo cp /tmp/system.conf /etc/systemd/system.conf sudo systemctl daemon-reexec ``` -(`systemctl daemon-reload` does not reload the configuration of the server - so you have to execute `systemctl daemon-reexec`). +(`systemctl daemon-reload` does not reload the configuration of the server - so you have to +execute `systemctl daemon-reexec`). -Now, when you run `systemd-cgtop`, services will start reporting usage (if it does not, restart a service - any service - to wake it up). Refresh your Netdata dashboard, and you will have the charts too. +Now, when you run `systemd-cgtop`, services will start reporting usage (if it does not, restart any service to wake it up). Refresh your Netdata dashboard, and you will have the charts too. -In case memory accounting is missing, you will need to enable it at your kernel, by appending the following kernel boot options and rebooting: +In case memory accounting is missing, you will need to enable it at your kernel, by appending the following kernel boot +options and rebooting: -``` +```sh cgroup_enable=memory swapaccount=1 ``` -You can add the above, directly at the `linux` line in your `/boot/grub/grub.cfg` or appending them to the `GRUB_CMDLINE_LINUX` in `/etc/default/grub` (in which case you will have to run `update-grub` before rebooting). On DigitalOcean debian images you may have to set it at `/etc/default/grub.d/50-cloudimg-settings.cfg`. +You can add the above, directly at the `linux` line in your `/boot/grub/grub.cfg` or appending them to +the `GRUB_CMDLINE_LINUX` in `/etc/default/grub` (in which case you will have to run `update-grub` before rebooting). On +DigitalOcean debian images you may have to set it at `/etc/default/grub.d/50-cloudimg-settings.cfg`. Which systemd services are monitored by Netdata is determined by the following pattern list: -``` +```text [plugin:cgroups] cgroups to match as systemd services = !/system.slice/*/*.service /system.slice/*.service ``` @@ -235,53 +252,57 @@ Which systemd services are monitored by Netdata is determined by the following p ## Monitoring ephemeral containers -Netdata monitors containers automatically when it is installed at the host, or when it is installed in a container that has access to the `/proc` and `/sys` filesystems of the host. +Netdata monitors containers automatically when it is installed at the host, or when it is installed in a container that +has access to the `/proc` and `/sys` filesystems of the host. Netdata prior to v1.6 had 2 issues when such containers were monitored: -1. network interface alarms where triggering when containers were stopped +1. network interface alarms where triggering when containers were stopped -2. charts were never cleaned up, so after some time dozens of containers were showing up on the dashboard, and they were occupying memory. +2. charts were never cleaned up, so after some time dozens of containers were showing up on the dashboard, and they were + occupying memory. ### the current Netdata network interfaces and cgroups (containers) are now self-cleaned. -So, when a network interface or container stops, Netdata might log a few errors in error.log complaining about files it cannot find, but immediately: +So, when a network interface or container stops, Netdata might log a few errors in error.log complaining about files it +cannot find, but immediately: -1. it will detect this is a removed container or network interface -2. it will freeze/pause all alarms for them -3. it will mark their charts as obsolete -4. obsolete charts are not be offered on new dashboard sessions (so hit F5 and the charts are gone) -5. existing dashboard sessions will continue to see them, but of course they will not refresh -6. obsolete charts will be removed from memory, 1 hour after the last user viewed them (configurable with `[global].cleanup obsolete charts after seconds = 3600` (at `netdata.conf`). -7. when obsolete charts are removed from memory they are also deleted from disk (configurable with `[global].delete obsolete charts files = yes`) +1. it will detect this is a removed container or network interface +2. it will freeze/pause all alarms for them +3. it will mark their charts as obsolete +4. obsolete charts are not be offered on new dashboard sessions (so hit F5 and the charts are gone) +5. existing dashboard sessions will continue to see them, but of course they will not refresh +6. obsolete charts will be removed from memory, 1 hour after the last user viewed them (configurable + with `[global].cleanup obsolete charts after seconds = 3600` (at `netdata.conf`). +7. when obsolete charts are removed from memory they are also deleted from disk (configurable + with `[global].delete obsolete charts files = yes`) ### Monitored container metrics -- CPU usage -- CPU usage within the limits -- CPU usage per core -- Memory usage -- Writeback memory -- Memory activity -- Memory page faults -- Used memory -- Used RAM within the limits -- Memory utilization -- Memory limit failures -- I/O bandwidth (all disks) -- Serviced I/O operations (all disks) -- Throttle I/O bandwidth (all disks) -- Throttle serviced I/O operations (all disks) -- Queued I/O operations (all disks) -- Merged I/O operations (all disks) -- CPU pressure -- Memory pressure -- Memory full pressure -- I/O pressure -- I/O full pressure - -Network interfaces are monitored by means of the [proc plugin](/collectors/proc.plugin/README.md#monitored-network-interface-metrics). - - +- CPU usage +- CPU usage within the limits +- CPU usage per core +- Memory usage +- Writeback memory +- Memory activity +- Memory page faults +- Used memory +- Used RAM within the limits +- Memory utilization +- Memory limit failures +- I/O bandwidth (all disks) +- Serviced I/O operations (all disks) +- Throttle I/O bandwidth (all disks) +- Throttle serviced I/O operations (all disks) +- Queued I/O operations (all disks) +- Merged I/O operations (all disks) +- CPU pressure +- Memory pressure +- Memory full pressure +- I/O pressure +- I/O full pressure + +Network interfaces are monitored by means of +the [proc plugin](/collectors/proc.plugin/README.md#monitored-network-interface-metrics). diff --git a/collectors/cgroups.plugin/cgroup-name.sh.in b/collectors/cgroups.plugin/cgroup-name.sh index 1f31c49a7..00d7e614c 100755 --- a/collectors/cgroups.plugin/cgroup-name.sh.in +++ b/collectors/cgroups.plugin/cgroup-name.sh @@ -114,6 +114,45 @@ function add_lbl_prefix() { echo "${new_labels:0:-1}" # trim last ',' } +function k8s_is_pause_container() { + local cgroup_path="${1}" + + local file + if [ -d "${NETDATA_HOST_PREFIX}/sys/fs/cgroup/cpuacct" ]; then + file="${NETDATA_HOST_PREFIX}/sys/fs/cgroup/cpuacct/$cgroup_path/cgroup.procs" + else + file="${NETDATA_HOST_PREFIX}/sys/fs/cgroup/$cgroup_path/cgroup.procs" + fi + + [ ! -f "$file" ] && return 1 + + local procs + IFS= read -rd' ' procs 2>/dev/null <"$file" + #shellcheck disable=SC2206 + procs=($procs) + + [ "${#procs[@]}" -ne 1 ] && return 1 + + IFS= read -r comm 2>/dev/null <"/proc/${procs[0]}/comm" + + [ "$comm" == "pause" ] + return +} + +function k8s_gcp_get_cluster_name() { + local header url id loc name + header="Metadata-Flavor: Google" + url="http://metadata/computeMetadata/v1" + if id=$(curl --fail -s -m 3 --noproxy "*" -H "$header" "$url/project/project-id") && + loc=$(curl --fail -s -m 3 --noproxy "*" -H "$header" "$url/instance/attributes/cluster-location") && + name=$(curl --fail -s -m 3 --noproxy "*" -H "$header" "$url/instance/attributes/cluster-name") && + [ -n "$id" ] && [ -n "$loc" ] && [ -n "$name" ]; then + echo "gke_${id}_${loc}_${name}" + return 0 + fi + return 1 +} + # k8s_get_kubepod_name resolves */kubepods/* cgroup name. # pod level cgroup name format: 'pod_<namespace>_<pod_name>' # container level cgroup name format: 'cntr_<namespace>_<pod_name>_<container_name>' @@ -151,7 +190,8 @@ function k8s_get_kubepod_name() { # - replaces '.' with '-' local fn="${FUNCNAME[0]}" - local id="${1}" + local cgroup_path="${1}" + local id="${2}" if [[ ! $id =~ ^kubepods ]]; then warning "${fn}: '${id}' is not kubepod cgroup." @@ -189,121 +229,157 @@ function k8s_get_kubepod_name() { if [ -z "$pod_uid" ] && [ -z "$cntr_id" ]; then warning "${fn}: can't extract pod_uid or container_id from the cgroup '$id'." - return 1 + return 3 fi [ -n "$pod_uid" ] && info "${fn}: cgroup '$id' is a pod(uid:$pod_uid)" [ -n "$cntr_id" ] && info "${fn}: cgroup '$id' is a container(id:$cntr_id)" + if [ -n "$cntr_id" ] && k8s_is_pause_container "$cgroup_path"; then + return 3 + fi + if ! command -v jq > /dev/null 2>&1; then warning "${fn}: 'jq' command not available." return 1 fi - local kube_system_ns - local tmp_kube_system_ns_file="${TMPDIR:-"/tmp/"}netdata-cgroups-kube-system-ns" - [ -f "$tmp_kube_system_ns_file" ] && kube_system_ns=$(cat "$tmp_kube_system_ns_file" 2> /dev/null) + local tmp_kube_cluster_name="${TMPDIR:-"/tmp"}/netdata-cgroups-k8s-cluster-name" + local tmp_kube_system_ns_uid_file="${TMPDIR:-"/tmp"}/netdata-cgroups-kubesystem-uid" + local tmp_kube_containers_file="${TMPDIR:-"/tmp"}/netdata-cgroups-containers" + + local kube_cluster_name + local kube_system_uid + local labels - local pods - if [ -n "${KUBERNETES_SERVICE_HOST}" ] && [ -n "${KUBERNETES_PORT_443_TCP_PORT}" ]; then - local token header host url - token="$(< /var/run/secrets/kubernetes.io/serviceaccount/token)" - header="Authorization: Bearer $token" - host="$KUBERNETES_SERVICE_HOST:$KUBERNETES_PORT_443_TCP_PORT" + if [ -n "$cntr_id" ] && + [ -f "$tmp_kube_cluster_name" ] && + [ -f "$tmp_kube_system_ns_uid_file" ] && + [ -f "$tmp_kube_containers_file" ] && + labels=$(grep "$cntr_id" "$tmp_kube_containers_file" 2>/dev/null); then + IFS= read -r kube_system_uid 2>/dev/null <"$tmp_kube_system_ns_uid_file" + IFS= read -r kube_cluster_name 2>/dev/null <"$tmp_kube_cluster_name" + else + IFS= read -r kube_system_uid 2>/dev/null <"$tmp_kube_system_ns_uid_file" + IFS= read -r kube_cluster_name 2>/dev/null <"$tmp_kube_cluster_name" + [ -z "$kube_cluster_name" ] && ! kube_cluster_name=$(k8s_gcp_get_cluster_name) && kube_cluster_name="unknown" + + local kube_system_ns + local pods + + if [ -n "${KUBERNETES_SERVICE_HOST}" ] && [ -n "${KUBERNETES_PORT_443_TCP_PORT}" ]; then + local token header host url + token="$(</var/run/secrets/kubernetes.io/serviceaccount/token)" + header="Authorization: Bearer $token" + host="$KUBERNETES_SERVICE_HOST:$KUBERNETES_PORT_443_TCP_PORT" + + if [ -z "$kube_system_uid" ]; then + url="https://$host/api/v1/namespaces/kube-system" + # FIX: check HTTP response code + if ! kube_system_ns=$(curl --fail -sSk -H "$header" "$url" 2>&1); then + warning "${fn}: error on curl '${url}': ${kube_system_ns}." + fi + fi - if [ -z "$kube_system_ns" ]; then - url="https://$host/api/v1/namespaces/kube-system" + url="https://$host/api/v1/pods" + [ -n "$MY_NODE_NAME" ] && url+="?fieldSelector=spec.nodeName==$MY_NODE_NAME" # FIX: check HTTP response code - if ! kube_system_ns=$(curl -sSk -H "$header" "$url" 2>&1); then - warning "${fn}: error on curl '${url}': ${kube_system_ns}." - else - echo "$kube_system_ns" > "$tmp_kube_system_ns_file" 2> /dev/null + if ! pods=$(curl --fail -sSk -H "$header" "$url" 2>&1); then + warning "${fn}: error on curl '${url}': ${pods}." + return 1 + fi + elif ps -C kubelet >/dev/null 2>&1 && command -v kubectl >/dev/null 2>&1; then + if [ -z "$kube_system_uid" ]; then + if ! kube_system_ns=$(kubectl --kubeconfig="$KUBE_CONFIG" get namespaces kube-system -o json 2>&1); then + warning "${fn}: error on 'kubectl': ${kube_system_ns}." + fi fi - fi - url="https://$host/api/v1/pods" - [ -n "$MY_NODE_NAME" ] && url+="?fieldSelector=spec.nodeName==$MY_NODE_NAME" - # FIX: check HTTP response code - if ! pods=$(curl -sSk -H "$header" "$url" 2>&1); then - warning "${fn}: error on curl '${url}': ${pods}." + [[ -z ${KUBE_CONFIG+x} ]] && KUBE_CONFIG="/etc/kubernetes/admin.conf" + if ! pods=$(kubectl --kubeconfig="$KUBE_CONFIG" get pods --all-namespaces -o json 2>&1); then + warning "${fn}: error on 'kubectl': ${pods}." + return 1 + fi + else + warning "${fn}: not inside the k8s cluster and 'kubectl' command not available." return 1 fi - elif ps -C kubelet > /dev/null 2>&1 && command -v kubectl > /dev/null 2>&1; then - if [ -z "$kube_system_ns" ]; then - if ! kube_system_ns=$(kubectl get namespaces kube-system -o json 2>&1); then - warning "${fn}: error on 'kubectl': ${kube_system_ns}." - else - echo "$kube_system_ns" > "$tmp_kube_system_ns_file" 2> /dev/null - fi + + if [ -n "$kube_system_ns" ] && ! kube_system_uid=$(jq -r '.metadata.uid' <<<"$kube_system_ns" 2>&1); then + warning "${fn}: error on 'jq' parse kube_system_ns: ${kube_system_uid}." fi - [[ -z ${KUBE_CONFIG+x} ]] && KUBE_CONFIG="/etc/kubernetes/admin.conf" - if ! pods=$(kubectl --kubeconfig="$KUBE_CONFIG" get pods --all-namespaces -o json 2>&1); then - warning "${fn}: error on 'kubectl': ${pods}." + local jq_filter + jq_filter+='.items[] | "' + jq_filter+='namespace=\"\(.metadata.namespace)\",' + jq_filter+='pod_name=\"\(.metadata.name)\",' + jq_filter+='pod_uid=\"\(.metadata.uid)\",' + #jq_filter+='\(.metadata.labels | to_entries | map("pod_label_"+.key+"=\""+.value+"\"") | join(",") | if length > 0 then .+"," else . end)' + jq_filter+='\((.metadata.ownerReferences[]? | select(.controller==true) | "controller_kind=\""+.kind+"\",controller_name=\""+.name+"\",") // "")' + jq_filter+='node_name=\"\(.spec.nodeName)\",' + jq_filter+='" + ' + jq_filter+='(.status.containerStatuses[]? | "' + jq_filter+='container_name=\"\(.name)\",' + jq_filter+='container_id=\"\(.containerID)\"' + jq_filter+='") | ' + jq_filter+='sub("(docker|cri-o|containerd)://";"")' # containerID: docker://a346da9bc0e3eaba6b295f64ac16e02f2190db2cef570835706a9e7a36e2c722 + + local containers + if ! containers=$(jq -r "${jq_filter}" <<<"$pods" 2>&1); then + warning "${fn}: error on 'jq' parse pods: ${containers}." return 1 fi - else - warning "${fn}: not inside the k8s cluster and 'kubectl' command not available." - return 1 - fi - local kube_system_uid - if [ -n "$kube_system_ns" ] && ! kube_system_uid=$(jq -r '.metadata.uid' <<< "$kube_system_ns" 2>&1); then - warning "${fn}: error on 'jq' parse kube_system_ns: ${kube_system_uid}." + [ -n "$kube_cluster_name" ] && echo "$kube_cluster_name" >"$tmp_kube_cluster_name" 2>/dev/null + [ -n "$kube_system_ns" ] && [ -n "$kube_system_uid" ] && echo "$kube_system_uid" >"$tmp_kube_system_ns_uid_file" 2>/dev/null + echo "$containers" >"$tmp_kube_containers_file" 2>/dev/null fi - local jq_filter - jq_filter+='.items[] | "' - jq_filter+='namespace=\"\(.metadata.namespace)\",' - jq_filter+='pod_name=\"\(.metadata.name)\",' - jq_filter+='pod_uid=\"\(.metadata.uid)\",' - #jq_filter+='\(.metadata.labels | to_entries | map("pod_label_"+.key+"=\""+.value+"\"") | join(",") | if length > 0 then .+"," else . end)' - jq_filter+='\((.metadata.ownerReferences[]? | select(.controller==true) | "controller_kind=\""+.kind+"\",controller_name=\""+.name+"\",") // "")' - jq_filter+='node_name=\"\(.spec.nodeName)\",' - jq_filter+='" + ' - jq_filter+='(.status.containerStatuses[]? | "' - jq_filter+='container_name=\"\(.name)\",' - jq_filter+='container_id=\"\(.containerID)\"' - jq_filter+='") | ' - jq_filter+='sub("(docker|cri-o|containerd)://";"")' # containerID: docker://a346da9bc0e3eaba6b295f64ac16e02f2190db2cef570835706a9e7a36e2c722 - - local containers - if ! containers=$(jq -r "${jq_filter}" <<< "$pods" 2>&1); then - warning "${fn}: error on 'jq' parse pods: ${containers}." - return 1 + local qos_class + if [[ $clean_id =~ .+(besteffort|burstable) ]]; then + qos_class="${BASH_REMATCH[1]}" + else + qos_class="guaranteed" fi # available labels: # namespace, pod_name, pod_uid, container_name, container_id, node_name - local labels if [ -n "$cntr_id" ]; then - if labels=$(grep "$cntr_id" <<< "$containers" 2> /dev/null); then + if [ -n "$labels" ] || labels=$(grep "$cntr_id" <<< "$containers" 2> /dev/null); then labels+=',kind="container"' + labels+=",qos_class=\"$qos_class\"" [ -n "$kube_system_uid" ] && [ "$kube_system_uid" != "null" ] && labels+=",cluster_id=\"$kube_system_uid\"" + [ -n "$kube_cluster_name" ] && [ "$kube_cluster_name" != "unknown" ] && labels+=",cluster_name=\"$kube_cluster_name\"" name="cntr" name+="_$(get_lbl_val "$labels" namespace)" name+="_$(get_lbl_val "$labels" pod_name)" name+="_$(get_lbl_val "$labels" container_name)" labels=$(add_lbl_prefix "$labels" "k8s_") name+=" $labels" + else + return 2 fi elif [ -n "$pod_uid" ]; then if labels=$(grep "$pod_uid" -m 1 <<< "$containers" 2> /dev/null); then labels="${labels%%,container_*}" labels+=',kind="pod"' + labels+=",qos_class=\"$qos_class\"" [ -n "$kube_system_uid" ] && [ "$kube_system_uid" != "null" ] && labels+=",cluster_id=\"$kube_system_uid\"" + [ -n "$kube_cluster_name" ] && [ "$kube_cluster_name" != "unknown" ] && labels+=",cluster_name=\"$kube_cluster_name\"" name="pod" name+="_$(get_lbl_val "$labels" namespace)" name+="_$(get_lbl_val "$labels" pod_name)" labels=$(add_lbl_prefix "$labels" "k8s_") name+=" $labels" + else + return 2 fi fi # jq filter nonexistent field and nonexistent label value is 'null' if [[ $name =~ _null(_|$) ]]; then warning "${fn}: invalid name: $name (cgroup '$id')" - name="" + return 1 fi echo "$name" @@ -313,15 +389,13 @@ function k8s_get_kubepod_name() { function k8s_get_name() { local fn="${FUNCNAME[0]}" - local id="${1}" - - NAME=$(k8s_get_kubepod_name "$id") + local cgroup_path="${1}" + local id="${2}" - if [ -z "${NAME}" ]; then - warning "${fn}: cannot find the name of cgroup with id '${id}'. Setting name to ${id} and disabling it." - NAME="${id}" - NAME_NOT_FOUND=3 - else + NAME=$(k8s_get_kubepod_name "$cgroup_path" "$id") + + case "$?" in + 0) NAME="k8s_${NAME}" local name labels @@ -332,7 +406,24 @@ function k8s_get_name() { else info "${fn}: cgroup '${id}' has chart name '${NAME}'" fi - fi + EXIT_CODE=$EXIT_SUCCESS + ;; + 1) + NAME="k8s_${id}" + warning "${fn}: cannot find the name of cgroup with id '${id}'. Setting name to ${NAME} and enabling it." + EXIT_CODE=$EXIT_SUCCESS + ;; + 2) + NAME="k8s_${id}" + warning "${fn}: cannot find the name of cgroup with id '${id}'. Setting name to ${NAME} and asking for retry." + EXIT_CODE=$EXIT_RETRY + ;; + *) + NAME="k8s_${id}" + warning "${fn}: cannot find the name of cgroup with id '${id}'. Setting name to ${NAME} and disabling it." + EXIT_CODE=$EXIT_DISABLE + ;; + esac } function docker_get_name() { @@ -344,7 +435,7 @@ function docker_get_name() { fi if [ -z "${NAME}" ]; then warning "cannot find the name of docker container '${id}'" - NAME_NOT_FOUND=2 + EXIT_CODE=$EXIT_RETRY NAME="${id:0:12}" else info "docker container '${id}' is named '${NAME}'" @@ -369,7 +460,7 @@ function podman_get_name() { if [ -z "${NAME}" ]; then warning "cannot find the name of podman container '${id}'" - NAME_NOT_FOUND=2 + EXIT_CODE=$EXIT_RETRY NAME="${id:0:12}" else info "podman container '${id}' is named '${NAME}'" @@ -387,13 +478,14 @@ function podman_validate_id() { # ----------------------------------------------------------------------------- -[ -z "${NETDATA_USER_CONFIG_DIR}" ] && NETDATA_USER_CONFIG_DIR="@configdir_POST@" -[ -z "${NETDATA_STOCK_CONFIG_DIR}" ] && NETDATA_STOCK_CONFIG_DIR="@libconfigdir_POST@" - DOCKER_HOST="${DOCKER_HOST:=/var/run/docker.sock}" PODMAN_HOST="${PODMAN_HOST:=/run/podman/podman.sock}" -CGROUP="${1}" -NAME_NOT_FOUND=0 +CGROUP_PATH="${1}" # the path as it is (e.g. '/docker/efcf4c409') +CGROUP="${2}" # the modified path (e.g. 'docker_efcf4c409') +EXIT_SUCCESS=0 +EXIT_RETRY=2 +EXIT_DISABLE=3 +EXIT_CODE=$EXIT_SUCCESS NAME= # ----------------------------------------------------------------------------- @@ -402,22 +494,9 @@ if [ -z "${CGROUP}" ]; then fatal "called without a cgroup name. Nothing to do." fi -for CONFIG in "${NETDATA_USER_CONFIG_DIR}/cgroups-names.conf" "${NETDATA_STOCK_CONFIG_DIR}/cgroups-names.conf"; do - if [ -f "${CONFIG}" ]; then - NAME="$(grep "^${CGROUP} " "${CONFIG}" | sed 's/[[:space:]]\+/ /g' | cut -d ' ' -f 2)" - if [ -z "${NAME}" ]; then - info "cannot find cgroup '${CGROUP}' in '${CONFIG}'." - else - break - fi - #else - # info "configuration file '${CONFIG}' is not available." - fi -done - if [ -z "${NAME}" ]; then if [[ ${CGROUP} =~ ^.*kubepods.* ]]; then - k8s_get_name "${CGROUP}" + k8s_get_name "${CGROUP_PATH}" "${CGROUP}" fi fi @@ -488,4 +567,4 @@ fi info "cgroup '${CGROUP}' is called '${NAME}'" echo "${NAME}" -exit ${NAME_NOT_FOUND} +exit ${EXIT_CODE} diff --git a/collectors/cgroups.plugin/cgroup-network-helper.sh b/collectors/cgroups.plugin/cgroup-network-helper.sh index f355480b8..07318d774 100755 --- a/collectors/cgroups.plugin/cgroup-network-helper.sh +++ b/collectors/cgroups.plugin/cgroup-network-helper.sh @@ -218,15 +218,8 @@ netnsid_find_all_interfaces_for_pid() { netnsid_find_all_interfaces_for_cgroup() { local c="${1}" # the cgroup path - # for each pid of the cgroup - # find any tun/tap devices linked to the pid - if [ -f "${c}/cgroup.procs" ] - then - local p - for p in $(< "${c}/cgroup.procs" ) - do - netnsid_find_all_interfaces_for_pid "${p}" - done + if [ -f "${c}/cgroup.procs" ]; then + netnsid_find_all_interfaces_for_pid "$(head -n 1 "${c}/cgroup.procs" 2>/dev/null)" else debug "Cannot find file '${c}/cgroup.procs', not searching for netnsid interfaces." fi diff --git a/collectors/cgroups.plugin/cgroup-network.c b/collectors/cgroups.plugin/cgroup-network.c index 6465c91e7..ec3d814c6 100644 --- a/collectors/cgroups.plugin/cgroup-network.c +++ b/collectors/cgroups.plugin/cgroup-network.c @@ -27,6 +27,14 @@ struct iface { struct iface *next; }; +unsigned int calc_num_ifaces(struct iface *root) { + unsigned int num = 0; + for (struct iface *h = root; h; h = h->next) { + num++; + } + return num; +} + unsigned int read_iface_iflink(const char *prefix, const char *iface) { if(!prefix) prefix = ""; @@ -447,6 +455,25 @@ void detect_veth_interfaces(pid_t pid) { goto cleanup; } + unsigned int host_dev_num = calc_num_ifaces(host); + unsigned int cgroup_dev_num = calc_num_ifaces(cgroup); + // host ifaces == guest ifaces => we are still in the host namespace + // and we can't really identify which ifaces belong to the cgroup (e.g. Proxmox VM). + if (host_dev_num == cgroup_dev_num) { + unsigned int m = 0; + for (h = host; h; h = h->next) { + for (c = cgroup; c; c = c->next) { + if (h->ifindex == c->ifindex && h->iflink == c->iflink) { + m++; + break; + } + } + } + if (host_dev_num == m) { + goto cleanup; + } + } + for(h = host; h ; h = h->next) { if(iface_is_eligible(h)) { for (c = cgroup; c; c = c->next) { @@ -479,7 +506,17 @@ void call_the_helper(pid_t pid, const char *cgroup) { info("running: %s", command); pid_t cgroup_pid; - FILE *fp = mypopene(command, &cgroup_pid, environment); + FILE *fp; + + if(cgroup) { + (void)mypopen_raw_default_flags(&cgroup_pid, environment, &fp, PLUGINS_DIR "/cgroup-network-helper.sh", "--cgroup", cgroup); + } + else { + char buffer[100]; + snprintfz(buffer, sizeof(buffer) - 1, "%d", pid); + (void)mypopen_raw_default_flags(&cgroup_pid, environment, &fp, PLUGINS_DIR "/cgroup-network-helper.sh", "--pid", buffer); + } + if(fp) { char buffer[CGROUP_NETWORK_INTERFACE_MAX_LINE + 1]; char *s; @@ -643,8 +680,13 @@ int main(int argc, char **argv) { if(argc != 3) usage(); - if(!strcmp(argv[1], "-p") || !strcmp(argv[1], "--pid")) { - pid = atoi(argv[2]); + int arg = 1; + int helper = 1; + if (getenv("KUBERNETES_SERVICE_HOST") != NULL && getenv("KUBERNETES_SERVICE_PORT") != NULL) + helper = 0; + + if(!strcmp(argv[arg], "-p") || !strcmp(argv[arg], "--pid")) { + pid = atoi(argv[arg+1]); if(pid <= 0) { errno = 0; @@ -652,17 +694,17 @@ int main(int argc, char **argv) { return 2; } - call_the_helper(pid, NULL); + if(helper) call_the_helper(pid, NULL); } - else if(!strcmp(argv[1], "--cgroup")) { - char *cgroup = argv[2]; + else if(!strcmp(argv[arg], "--cgroup")) { + char *cgroup = argv[arg+1]; if(verify_path(cgroup) == -1) { error("cgroup '%s' does not exist or is not valid.", cgroup); return 1; } pid = read_pid_from_cgroup(cgroup); - call_the_helper(pid, cgroup); + if(helper) call_the_helper(pid, cgroup); if(pid <= 0 && !detected_devices) { errno = 0; diff --git a/collectors/cgroups.plugin/sys_fs_cgroup.c b/collectors/cgroups.plugin/sys_fs_cgroup.c index 8efb68cf0..5676ef8ca 100644 --- a/collectors/cgroups.plugin/sys_fs_cgroup.c +++ b/collectors/cgroups.plugin/sys_fs_cgroup.c @@ -6,14 +6,39 @@ #define PLUGIN_CGROUPS_MODULE_SYSTEMD_NAME "systemd" #define PLUGIN_CGROUPS_MODULE_CGROUPS_NAME "/sys/fs/cgroup" +// main cgroups thread worker jobs +#define WORKER_CGROUPS_LOCK 0 +#define WORKER_CGROUPS_READ 1 +#define WORKER_CGROUPS_CHART 2 + +// discovery cgroup thread worker jobs +#define WORKER_DISCOVERY_INIT 0 +#define WORKER_DISCOVERY_FIND 1 +#define WORKER_DISCOVERY_PROCESS 2 +#define WORKER_DISCOVERY_PROCESS_RENAME 3 +#define WORKER_DISCOVERY_PROCESS_NETWORK 4 +#define WORKER_DISCOVERY_PROCESS_FIRST_TIME 5 +#define WORKER_DISCOVERY_UPDATE 6 +#define WORKER_DISCOVERY_CLEANUP 7 +#define WORKER_DISCOVERY_COPY 8 +#define WORKER_DISCOVERY_SHARE 9 +#define WORKER_DISCOVERY_LOCK 10 + +#if WORKER_UTILIZATION_MAX_JOB_TYPES < 11 +#error WORKER_UTILIZATION_MAX_JOB_TYPES has to be at least 11 +#endif + // ---------------------------------------------------------------------------- // cgroup globals +static int is_inside_k8s = 0; + static long system_page_size = 4096; // system will be queried via sysconf() in configuration() static int cgroup_enable_cpuacct_stat = CONFIG_BOOLEAN_AUTO; static int cgroup_enable_cpuacct_usage = CONFIG_BOOLEAN_AUTO; static int cgroup_enable_cpuacct_cpu_throttling = CONFIG_BOOLEAN_YES; +static int cgroup_enable_cpuacct_cpu_shares = CONFIG_BOOLEAN_NO; static int cgroup_enable_memory = CONFIG_BOOLEAN_AUTO; static int cgroup_enable_detailed_memory = CONFIG_BOOLEAN_AUTO; static int cgroup_enable_memory_failcnt = CONFIG_BOOLEAN_AUTO; @@ -39,7 +64,6 @@ static int cgroup_unified_exist = CONFIG_BOOLEAN_AUTO; static int cgroup_search_in_devices = 1; -static int cgroup_enable_new_cgroups_detected_at_runtime = 1; static int cgroup_check_for_new_every = 10; static int cgroup_update_every = 1; static int cgroup_containers_chart_priority = NETDATA_CHART_PRIO_CGROUPS_CONTAINERS; @@ -59,11 +83,14 @@ static int cgroup_root_count = 0; static int cgroup_root_max = 1000; static int cgroup_max_depth = 0; -static SIMPLE_PATTERN *enabled_cgroup_patterns = NULL; static SIMPLE_PATTERN *enabled_cgroup_paths = NULL; +static SIMPLE_PATTERN *enabled_cgroup_names = NULL; +static SIMPLE_PATTERN *search_cgroup_paths = NULL; static SIMPLE_PATTERN *enabled_cgroup_renames = NULL; static SIMPLE_PATTERN *systemd_services_cgroups = NULL; +static SIMPLE_PATTERN *entrypoint_parent_process_comm = NULL; + static char *cgroups_rename_script = NULL; static char *cgroups_network_interface_script = NULL; @@ -283,6 +310,7 @@ void read_cgroup_plugin_configuration() { cgroup_enable_cpuacct_stat = config_get_boolean_ondemand("plugin:cgroups", "enable cpuacct stat (total CPU)", cgroup_enable_cpuacct_stat); cgroup_enable_cpuacct_usage = config_get_boolean_ondemand("plugin:cgroups", "enable cpuacct usage (per core CPU)", cgroup_enable_cpuacct_usage); cgroup_enable_cpuacct_cpu_throttling = config_get_boolean_ondemand("plugin:cgroups", "enable cpuacct cpu throttling", cgroup_enable_cpuacct_cpu_throttling); + cgroup_enable_cpuacct_cpu_shares = config_get_boolean_ondemand("plugin:cgroups", "enable cpuacct cpu shares", cgroup_enable_cpuacct_cpu_shares); cgroup_enable_memory = config_get_boolean_ondemand("plugin:cgroups", "enable memory", cgroup_enable_memory); cgroup_enable_detailed_memory = config_get_boolean_ondemand("plugin:cgroups", "enable detailed memory", cgroup_enable_detailed_memory); @@ -407,9 +435,7 @@ void read_cgroup_plugin_configuration() { cgroup_root_max = (int)config_get_number("plugin:cgroups", "max cgroups to allow", cgroup_root_max); cgroup_max_depth = (int)config_get_number("plugin:cgroups", "max cgroups depth to monitor", cgroup_max_depth); - cgroup_enable_new_cgroups_detected_at_runtime = config_get_boolean("plugin:cgroups", "enable new cgroups detected at run time", cgroup_enable_new_cgroups_detected_at_runtime); - - enabled_cgroup_patterns = simple_pattern_create( + enabled_cgroup_paths = simple_pattern_create( config_get("plugin:cgroups", "enable by default cgroups matching", // ---------------------------------------------------------------- @@ -451,7 +477,12 @@ void read_cgroup_plugin_configuration() { " * " // enable anything else ), NULL, SIMPLE_PATTERN_EXACT); - enabled_cgroup_paths = simple_pattern_create( + enabled_cgroup_names = simple_pattern_create( + config_get("plugin:cgroups", "enable by default cgroups names matching", + " * " + ), NULL, SIMPLE_PATTERN_EXACT); + + search_cgroup_paths = simple_pattern_create( config_get("plugin:cgroups", "search for cgroups in subpaths matching", " !*/init.scope " // ignore init.scope " !*-qemu " // #345 @@ -492,7 +523,9 @@ void read_cgroup_plugin_configuration() { " *docker* " " *lxc* " " *qemu* " - " *kubepods* " // #3396 kubernetes + " /kubepods/pod*/* " // k8s containers + " /kubepods/*/pod*/* " // k8s containers + " !/kubepods* " // all other k8s cgroups " *.libvirt-qemu " // #3010 " * " ), NULL, SIMPLE_PATTERN_EXACT); @@ -705,6 +738,17 @@ struct cpuacct_cpu_throttling { unsigned long long nr_throttled_perc; }; +// https://access.redhat.com/documentation/en-us/red_hat_enterprise_linux/6/html/resource_management_guide/sec-cpu#sect-cfs +// https://access.redhat.com/documentation/en-us/red_hat_enterprise_linux/8/html/managing_monitoring_and_updating_the_kernel/using-cgroups-v2-to-control-distribution-of-cpu-time-for-applications_managing-monitoring-and-updating-the-kernel#proc_controlling-distribution-of-cpu-time-for-applications-by-adjusting-cpu-weight_using-cgroups-v2-to-control-distribution-of-cpu-time-for-applications +struct cpuacct_cpu_shares { + int updated; + int enabled; // CONFIG_BOOLEAN_YES or CONFIG_BOOLEAN_AUTO + + char *filename; + + unsigned long long shares; +}; + struct cgroup_network_interface { const char *host_device; const char *container_device; @@ -715,6 +759,9 @@ struct cgroup_network_interface { struct cgroup { uint32_t options; + int first_time_seen; // first time seen by the discoverer + int processed; // the discoverer is done processing a cgroup (resolved name, set 'enabled' option) + char available; // found in the filesystem char enabled; // enabled in the config @@ -734,6 +781,7 @@ struct cgroup { struct cpuacct_stat cpuacct_stat; struct cpuacct_usage cpuacct_usage; struct cpuacct_cpu_throttling cpuacct_cpu_throttling; + struct cpuacct_cpu_shares cpuacct_cpu_shares; struct memory memory; @@ -758,6 +806,7 @@ struct cgroup { RRDSET *st_cpu_per_core; RRDSET *st_cpu_nr_throttled; RRDSET *st_cpu_throttled_time; + RRDSET *st_cpu_shares; RRDSET *st_mem; RRDSET *st_mem_utilization; @@ -842,7 +891,115 @@ struct discovery_thread { int exited; } discovery_thread; -// ---------------------------------------------------------------------------- +// --------------------------------------------------------------------------------------------- + +static inline int matches_enabled_cgroup_paths(char *id) { + return simple_pattern_matches(enabled_cgroup_paths, id); +} + +static inline int matches_enabled_cgroup_names(char *name) { + return simple_pattern_matches(enabled_cgroup_names, name); +} + +static inline int matches_enabled_cgroup_renames(char *id) { + return simple_pattern_matches(enabled_cgroup_renames, id); +} + +static inline int matches_systemd_services_cgroups(char *id) { + return simple_pattern_matches(systemd_services_cgroups, id); +} + +static inline int matches_search_cgroup_paths(const char *dir) { + return simple_pattern_matches(search_cgroup_paths, dir); +} + +static inline int matches_entrypoint_parent_process_comm(const char *comm) { + return simple_pattern_matches(entrypoint_parent_process_comm, comm); +} + +static inline int is_cgroup_systemd_service(struct cgroup *cg) { + return (cg->options & CGROUP_OPTIONS_SYSTEM_SLICE_SERVICE); +} + +// --------------------------------------------------------------------------------------------- +static int k8s_is_container(const char *id) { + // examples: + // https://github.com/netdata/netdata/blob/0fc101679dcd12f1cb8acdd07bb4c85d8e553e53/collectors/cgroups.plugin/cgroup-name.sh#L121-L147 + const char *p = id; + const char *pp = NULL; + int i = 0; + size_t l = 3; // pod + while ((p = strstr(p, "pod"))) { + i++; + p += l; + pp = p; + } + return !(i < 2 || !pp || !(pp = strchr(pp, '/')) || !pp++ || !*pp); +} + +#define TASK_COMM_LEN 16 + +static int k8s_get_container_first_proc_comm(const char *id, char *comm) { + if (!k8s_is_container(id)) { + return 1; + } + + static procfile *ff = NULL; + + char filename[FILENAME_MAX + 1]; + snprintfz(filename, FILENAME_MAX, "%s/%s/cgroup.procs", cgroup_cpuacct_base, id); + + ff = procfile_reopen(ff, filename, NULL, PROCFILE_FLAG_DEFAULT); + if (unlikely(!ff)) { + debug(D_CGROUP, "CGROUP: k8s_is_pause_container(): cannot open file '%s'.", filename); + return 1; + } + + ff = procfile_readall(ff); + if (unlikely(!ff)) { + debug(D_CGROUP, "CGROUP: k8s_is_pause_container(): cannot read file '%s'.", filename); + return 1; + } + + unsigned long lines = procfile_lines(ff); + if (likely(lines < 2)) { + return 1; + } + + char *pid = procfile_lineword(ff, 0, 0); + if (!pid || !*pid) { + return 1; + } + + snprintfz(filename, FILENAME_MAX, "%s/proc/%s/comm", netdata_configured_host_prefix, pid); + + ff = procfile_reopen(ff, filename, NULL, PROCFILE_FLAG_DEFAULT); + if (unlikely(!ff)) { + debug(D_CGROUP, "CGROUP: k8s_is_pause_container(): cannot open file '%s'.", filename); + return 1; + } + + ff = procfile_readall(ff); + if (unlikely(!ff)) { + debug(D_CGROUP, "CGROUP: k8s_is_pause_container(): cannot read file '%s'.", filename); + return 1; + } + + lines = procfile_lines(ff); + if (unlikely(lines != 2)) { + return 1; + } + + char *proc_comm = procfile_lineword(ff, 0, 0); + if (!proc_comm || !*proc_comm) { + return 1; + } + + strncpyz(comm, proc_comm, TASK_COMM_LEN); + return 0; +} + +// --------------------------------------------------------------------------------------------- static unsigned long long calc_delta(unsigned long long curr, unsigned long long prev) { if (prev > curr) { @@ -858,6 +1015,15 @@ static unsigned long long calc_percentage(unsigned long long value, unsigned lon return (calculated_number)value / (calculated_number)total * 100; } +static int calc_cgroup_depth(const char *id) { + int depth = 0; + const char *s; + for (s = id; *s; s++) { + depth += unlikely(*s == '/'); + } + return depth; +} + // ---------------------------------------------------------------------------- // read values from /sys @@ -1029,6 +1195,24 @@ static inline void cgroup2_read_cpuacct_cpu_stat(struct cpuacct_stat *cp, struct } } +static inline void cgroup_read_cpuacct_cpu_shares(struct cpuacct_cpu_shares *cp) { + if (unlikely(!cp->filename)) { + return; + } + + if (unlikely(read_single_number_file(cp->filename, &cp->shares))) { + cp->updated = 0; + cgroups_check = 1; + return; + } + + cp->updated = 1; + if (unlikely((cp->enabled == CONFIG_BOOLEAN_AUTO)) && + (cp->shares || netdata_zero_metrics_enabled == CONFIG_BOOLEAN_YES)) { + cp->enabled = CONFIG_BOOLEAN_YES; + } +} + static inline void cgroup_read_cpuacct_usage(struct cpuacct_usage *ca) { static procfile *ff = NULL; @@ -1234,14 +1418,17 @@ static inline void cgroup2_read_pressure(struct pressure *res) { return; } - res->some.value10 = strtod(procfile_lineword(ff, 0, 2), NULL); - res->some.value60 = strtod(procfile_lineword(ff, 0, 4), NULL); - res->some.value300 = strtod(procfile_lineword(ff, 0, 6), NULL); + + res->some.share_time.value10 = strtod(procfile_lineword(ff, 0, 2), NULL); + res->some.share_time.value60 = strtod(procfile_lineword(ff, 0, 4), NULL); + res->some.share_time.value300 = strtod(procfile_lineword(ff, 0, 6), NULL); + res->some.total_time.value_total = str2ull(procfile_lineword(ff, 0, 8)) / 1000; // us->ms if (lines > 2) { - res->full.value10 = strtod(procfile_lineword(ff, 1, 2), NULL); - res->full.value60 = strtod(procfile_lineword(ff, 1, 4), NULL); - res->full.value300 = strtod(procfile_lineword(ff, 1, 6), NULL); + res->full.share_time.value10 = strtod(procfile_lineword(ff, 1, 2), NULL); + res->full.share_time.value60 = strtod(procfile_lineword(ff, 1, 4), NULL); + res->full.share_time.value300 = strtod(procfile_lineword(ff, 1, 6), NULL); + res->full.total_time.value_total = str2ull(procfile_lineword(ff, 0, 8)) / 1000; // us->ms } res->updated = 1; @@ -1394,12 +1581,13 @@ memory_next: } } -static inline void cgroup_read(struct cgroup *cg) { +static inline void read_cgroup(struct cgroup *cg) { debug(D_CGROUP, "reading metrics for cgroups '%s'", cg->id); if(!(cg->options & CGROUP_OPTIONS_IS_UNIFIED)) { cgroup_read_cpuacct_stat(&cg->cpuacct_stat); cgroup_read_cpuacct_usage(&cg->cpuacct_usage); cgroup_read_cpuacct_cpu_stat(&cg->cpuacct_cpu_throttling); + cgroup_read_cpuacct_cpu_shares(&cg->cpuacct_cpu_shares); cgroup_read_memory(&cg->memory, 0); cgroup_read_blkio(&cg->io_service_bytes); cgroup_read_blkio(&cg->io_serviced); @@ -1413,6 +1601,7 @@ static inline void cgroup_read(struct cgroup *cg) { cgroup2_read_blkio(&cg->io_service_bytes, 0); cgroup2_read_blkio(&cg->io_serviced, 4); cgroup2_read_cpuacct_cpu_stat(&cg->cpuacct_stat, &cg->cpuacct_cpu_throttling); + cgroup_read_cpuacct_cpu_shares(&cg->cpuacct_cpu_shares); cgroup2_read_pressure(&cg->cpu_pressure); cgroup2_read_pressure(&cg->io_pressure); cgroup2_read_pressure(&cg->memory_pressure); @@ -1420,14 +1609,15 @@ static inline void cgroup_read(struct cgroup *cg) { } } -static inline void read_all_cgroups(struct cgroup *root) { +static inline void read_all_discovered_cgroups(struct cgroup *root) { debug(D_CGROUP, "reading metrics for all cgroups"); struct cgroup *cg; - - for(cg = root; cg ; cg = cg->next) - if(cg->enabled && !cg->pending_renames) - cgroup_read(cg); + for (cg = root; cg; cg = cg->next) { + if (cg->enabled && !cg->pending_renames) { + read_cgroup(cg); + } + } } // ---------------------------------------------------------------------------- @@ -1438,19 +1628,20 @@ static inline void read_cgroup_network_interfaces(struct cgroup *cg) { debug(D_CGROUP, "looking for the network interfaces of cgroup '%s' with chart id '%s' and title '%s'", cg->id, cg->chart_id, cg->chart_title); pid_t cgroup_pid; - char command[CGROUP_NETWORK_INTERFACE_MAX_LINE + 1]; + char cgroup_identifier[CGROUP_NETWORK_INTERFACE_MAX_LINE + 1]; if(!(cg->options & CGROUP_OPTIONS_IS_UNIFIED)) { - snprintfz(command, CGROUP_NETWORK_INTERFACE_MAX_LINE, "exec %s --cgroup '%s%s'", cgroups_network_interface_script, cgroup_cpuacct_base, cg->id); + snprintfz(cgroup_identifier, CGROUP_NETWORK_INTERFACE_MAX_LINE, "%s%s", cgroup_cpuacct_base, cg->id); } else { - snprintfz(command, CGROUP_NETWORK_INTERFACE_MAX_LINE, "exec %s --cgroup '%s%s'", cgroups_network_interface_script, cgroup_unified_base, cg->id); + snprintfz(cgroup_identifier, CGROUP_NETWORK_INTERFACE_MAX_LINE, "%s%s", cgroup_unified_base, cg->id); } - debug(D_CGROUP, "executing command '%s' for cgroup '%s'", command, cg->id); - FILE *fp = mypopen(command, &cgroup_pid); + debug(D_CGROUP, "executing cgroup_identifier %s --cgroup '%s' for cgroup '%s'", cgroups_network_interface_script, cgroup_identifier, cg->id); + FILE *fp; + (void)mypopen_raw_default_flags_and_environment(&cgroup_pid, &fp, cgroups_network_interface_script, "--cgroup", cgroup_identifier); if(!fp) { - error("CGROUP: cannot popen(\"%s\", \"r\").", command); + error("CGROUP: cannot popen(%s --cgroup \"%s\", \"r\").", cgroups_network_interface_script, cgroup_identifier); return; } @@ -1491,7 +1682,7 @@ static inline void read_cgroup_network_interfaces(struct cgroup *cg) { } mypclose(fp, cgroup_pid); - // debug(D_CGROUP, "closed command for cgroup '%s'", cg->id); + // debug(D_CGROUP, "closed cgroup_identifier for cgroup '%s'", cg->id); } static inline void free_cgroup_network_interfaces(struct cgroup *cg) { @@ -1544,8 +1735,7 @@ static inline void substitute_dots_in_id(char *s) { } } -char *parse_k8s_data(struct label **labels, char *data) -{ +char *k8s_parse_resolved_name(struct label **labels, char *data) { char *name = mystrsep(&data, " "); if (!data) { @@ -1573,187 +1763,11 @@ char *parse_k8s_data(struct label **labels, char *data) return name; } -static inline void cgroup_get_chart_name(struct cgroup *cg) { - debug(D_CGROUP, "looking for the name of cgroup '%s' with chart id '%s' and title '%s'", cg->id, cg->chart_id, cg->chart_title); - - pid_t cgroup_pid; - char command[CGROUP_CHARTID_LINE_MAX + 1]; - - // TODO: use cg->id when the renaming script is fixed - snprintfz(command, CGROUP_CHARTID_LINE_MAX, "exec %s '%s'", cgroups_rename_script, cg->intermediate_id); - - debug(D_CGROUP, "executing command \"%s\" for cgroup '%s'", command, cg->chart_id); - FILE *fp = mypopen(command, &cgroup_pid); - if(fp) { - // debug(D_CGROUP, "reading from command '%s' for cgroup '%s'", command, cg->id); - char buffer[CGROUP_CHARTID_LINE_MAX + 1]; - char *s = fgets(buffer, CGROUP_CHARTID_LINE_MAX, fp); - // debug(D_CGROUP, "closing command for cgroup '%s'", cg->id); - int name_error = mypclose(fp, cgroup_pid); - // debug(D_CGROUP, "closed command for cgroup '%s'", cg->id); - - if(s && *s && *s != '\n') { - debug(D_CGROUP, "cgroup '%s' should be renamed to '%s'", cg->chart_id, s); - - s = trim(s); - if (s) { - if(likely(name_error==0)) - cg->pending_renames = 0; - else if (unlikely(name_error==3)) { - debug(D_CGROUP, "cgroup '%s' disabled based due to rename command output", cg->chart_id); - cg->enabled = 0; - } - - if (likely(cg->pending_renames < 2)) { - char *name = s; - - if (!strncmp(s, "k8s_", 4)) { - free_label_list(cg->chart_labels); - name = parse_k8s_data(&cg->chart_labels, s); - } - - freez(cg->chart_title); - cg->chart_title = cgroup_title_strdupz(name); - - freez(cg->chart_id); - cg->chart_id = cgroup_chart_id_strdupz(name); - substitute_dots_in_id(cg->chart_id); - cg->hash_chart = simple_hash(cg->chart_id); - } - } - } - } - else - error("CGROUP: cannot popen(\"%s\", \"r\").", command); -} - -static inline struct cgroup *cgroup_add(const char *id) { - if(!id || !*id) id = "/"; - debug(D_CGROUP, "adding to list, cgroup with id '%s'", id); - - if(cgroup_root_count >= cgroup_root_max) { - info("CGROUP: maximum number of cgroups reached (%d). Not adding cgroup '%s'", cgroup_root_count, id); - return NULL; - } - - int def = simple_pattern_matches(enabled_cgroup_patterns, id)?cgroup_enable_new_cgroups_detected_at_runtime:0; - struct cgroup *cg = callocz(1, sizeof(struct cgroup)); - - cg->id = strdupz(id); - cg->hash = simple_hash(cg->id); - - cg->chart_title = cgroup_title_strdupz(id); - - cg->intermediate_id = cgroup_chart_id_strdupz(id); - - cg->chart_id = cgroup_chart_id_strdupz(id); - substitute_dots_in_id(cg->chart_id); - cg->hash_chart = simple_hash(cg->chart_id); - - if(cgroup_use_unified_cgroups) cg->options |= CGROUP_OPTIONS_IS_UNIFIED; - - if(!discovered_cgroup_root) - discovered_cgroup_root = cg; - else { - // append it - struct cgroup *e; - for(e = discovered_cgroup_root; e->discovered_next ;e = e->discovered_next) ; - e->discovered_next = cg; - } - - cgroup_root_count++; - - // fix the chart_id and title by calling the external script - if(simple_pattern_matches(enabled_cgroup_renames, cg->id)) { - - cg->pending_renames = 2; - cgroup_get_chart_name(cg); - - debug(D_CGROUP, "cgroup '%s' renamed to '%s' (title: '%s')", cg->id, cg->chart_id, cg->chart_title); - } - else - debug(D_CGROUP, "cgroup '%s' will not be renamed - it matches the list of disabled cgroup renames (will be shown as '%s')", cg->id, cg->chart_id); - - int user_configurable = 1; - - // check if this cgroup should be a systemd service - if(cgroup_enable_systemd_services) { - if(simple_pattern_matches(systemd_services_cgroups, cg->id) || - simple_pattern_matches(systemd_services_cgroups, cg->chart_id)) { - debug(D_CGROUP, "cgroup '%s' with chart id '%s' (title: '%s') matches systemd services cgroups", cg->id, cg->chart_id, cg->chart_title); - - char buffer[CGROUP_CHARTID_LINE_MAX + 1]; - cg->options |= CGROUP_OPTIONS_SYSTEM_SLICE_SERVICE; - - strncpy(buffer, cg->id, CGROUP_CHARTID_LINE_MAX); - char *s = buffer; - - // skip to the last slash - size_t len = strlen(s); - while(len--) if(unlikely(s[len] == '/')) break; - if(len) s = &s[len + 1]; - - // remove extension - len = strlen(s); - while(len--) if(unlikely(s[len] == '.')) break; - if(len) s[len] = '\0'; - - freez(cg->chart_title); - cg->chart_title = cgroup_title_strdupz(s); - - cg->enabled = 1; - user_configurable = 0; - - debug(D_CGROUP, "cgroup '%s' renamed to '%s' (title: '%s')", cg->id, cg->chart_id, cg->chart_title); - } - else - debug(D_CGROUP, "cgroup '%s' with chart id '%s' (title: '%s') does not match systemd services groups", cg->id, cg->chart_id, cg->chart_title); - } - - if(user_configurable) { - // allow the user to enable/disable this individually - char option[FILENAME_MAX + 1]; - snprintfz(option, FILENAME_MAX, "enable cgroup %s", cg->chart_title); - cg->enabled = (char) config_get_boolean("plugin:cgroups", option, def); - } - - // detect duplicate cgroups - if(cg->enabled) { - struct cgroup *t; - for (t = discovered_cgroup_root; t; t = t->discovered_next) { - if (t != cg && t->enabled && t->hash_chart == cg->hash_chart && !strcmp(t->chart_id, cg->chart_id)) { - // TODO: use it after refactoring if system.slice might be scanned before init.scope/system.slice - // - // if (!strncmp(t->id, "/system.slice/", 14) && !strncmp(cg->id, "/init.scope/system.slice/", 25)) { - // error("CGROUP: chart id '%s' already exists with id '%s' and is enabled. Swapping them by enabling cgroup with id '%s' and disabling cgroup with id '%s'.", - // cg->chart_id, t->id, cg->id, t->id); - // t->enabled = 0; - // t->options |= CGROUP_OPTIONS_DISABLED_DUPLICATE; - // } - // else {} - // - // https://github.com/netdata/netdata/issues/797#issuecomment-241248884 - error("CGROUP: chart id '%s' already exists with id '%s' and is enabled and available. Disabling cgroup with id '%s'.", - cg->chart_id, t->id, cg->id); - cg->enabled = 0; - cg->options |= CGROUP_OPTIONS_DISABLED_DUPLICATE; - - break; - } - } - } - - if(cg->enabled && !cg->pending_renames && !(cg->options & CGROUP_OPTIONS_SYSTEM_SLICE_SERVICE)) - read_cgroup_network_interfaces(cg); - - debug(D_CGROUP, "ADDED CGROUP: '%s' with chart id '%s' and title '%s' as %s (default was %s)", cg->id, cg->chart_id, cg->chart_title, (cg->enabled)?"enabled":"disabled", (def)?"enabled":"disabled"); - - return cg; -} - static inline void free_pressure(struct pressure *res) { - if (res->some.st) rrdset_is_obsolete(res->some.st); - if (res->full.st) rrdset_is_obsolete(res->full.st); + if (res->some.share_time.st) rrdset_is_obsolete(res->some.share_time.st); + if (res->some.total_time.st) rrdset_is_obsolete(res->some.total_time.st); + if (res->full.share_time.st) rrdset_is_obsolete(res->full.share_time.st); + if (res->full.total_time.st) rrdset_is_obsolete(res->full.total_time.st); freez(res->filename); } @@ -1765,6 +1779,7 @@ static inline void cgroup_free(struct cgroup *cg) { if(cg->st_cpu_per_core) rrdset_is_obsolete(cg->st_cpu_per_core); if(cg->st_cpu_nr_throttled) rrdset_is_obsolete(cg->st_cpu_nr_throttled); if(cg->st_cpu_throttled_time) rrdset_is_obsolete(cg->st_cpu_throttled_time); + if(cg->st_cpu_shares) rrdset_is_obsolete(cg->st_cpu_shares); if(cg->st_mem) rrdset_is_obsolete(cg->st_mem); if(cg->st_writeback) rrdset_is_obsolete(cg->st_writeback); if(cg->st_mem_activity) rrdset_is_obsolete(cg->st_mem_activity); @@ -1793,6 +1808,7 @@ static inline void cgroup_free(struct cgroup *cg) { freez(cg->cpuacct_stat.filename); freez(cg->cpuacct_usage.filename); freez(cg->cpuacct_cpu_throttling.filename); + freez(cg->cpuacct_cpu_shares.filename); arl_free(cg->memory.arl_base); freez(cg->memory.filename_detailed); @@ -1825,71 +1841,197 @@ static inline void cgroup_free(struct cgroup *cg) { cgroup_root_count--; } -// find if a given cgroup exists -static inline struct cgroup *cgroup_find(const char *id) { - debug(D_CGROUP, "searching for cgroup '%s'", id); +// ---------------------------------------------------------------------------- - uint32_t hash = simple_hash(id); +static inline void discovery_rename_cgroup(struct cgroup *cg) { + if (!cg->pending_renames) { + return; + } + cg->pending_renames--; - struct cgroup *cg; - for(cg = discovered_cgroup_root; cg ; cg = cg->discovered_next) { - if(hash == cg->hash && strcmp(id, cg->id) == 0) + debug(D_CGROUP, "looking for the name of cgroup '%s' with chart id '%s' and title '%s'", cg->id, cg->chart_id, cg->chart_title); + debug(D_CGROUP, "executing command %s \"%s\" for cgroup '%s'", cgroups_rename_script, cg->intermediate_id, cg->chart_id); + pid_t cgroup_pid; + + FILE *fp; + (void)mypopen_raw_default_flags_and_environment(&cgroup_pid, &fp, cgroups_rename_script, cg->id, cg->intermediate_id); + if (!fp) { + error("CGROUP: cannot popen(%s \"%s\", \"r\").", cgroups_rename_script, cg->intermediate_id); + cg->pending_renames = 0; + cg->processed = 1; + return; + } + + char buffer[CGROUP_CHARTID_LINE_MAX + 1]; + char *new_name = fgets(buffer, CGROUP_CHARTID_LINE_MAX, fp); + int exit_code = mypclose(fp, cgroup_pid); + + switch (exit_code) { + case 0: + cg->pending_renames = 0; + break; + case 3: + cg->pending_renames = 0; + cg->processed = 1; break; } - debug(D_CGROUP, "cgroup '%s' %s in memory", id, (cg)?"found":"not found"); - return cg; + if (cg->pending_renames || cg->processed) { + return; + } + if (!(new_name && *new_name && *new_name != '\n')) { + return; + } + new_name = trim(new_name); + if (!(new_name)) { + return; + } + char *name = new_name; + if (!strncmp(new_name, "k8s_", 4)) { + free_label_list(cg->chart_labels); + name = k8s_parse_resolved_name(&cg->chart_labels, new_name); + } + freez(cg->chart_title); + cg->chart_title = cgroup_title_strdupz(name); + freez(cg->chart_id); + cg->chart_id = cgroup_chart_id_strdupz(name); + substitute_dots_in_id(cg->chart_id); + cg->hash_chart = simple_hash(cg->chart_id); } -// ---------------------------------------------------------------------------- -// detect running cgroups +static void is_cgroup_procs_exist(netdata_ebpf_cgroup_shm_body_t *out, char *id) { + struct stat buf; -// callback for find_file_in_subdirs() -static inline void found_subdir_in_dir(const char *dir) { - debug(D_CGROUP, "examining cgroup dir '%s'", dir); + snprintfz(out->path, FILENAME_MAX, "%s%s/cgroup.procs", cgroup_cpuset_base, id); + if (likely(stat(out->path, &buf) == 0)) { + return; + } + + snprintfz(out->path, FILENAME_MAX, "%s%s/cgroup.procs", cgroup_blkio_base, id); + if (likely(stat(out->path, &buf) == 0)) { + return; + } - struct cgroup *cg = cgroup_find(dir); - if(!cg) { - if(*dir && cgroup_max_depth > 0) { - int depth = 0; - const char *s; + snprintfz(out->path, FILENAME_MAX, "%s%s/cgroup.procs", cgroup_memory_base, id); + if (likely(stat(out->path, &buf) == 0)) { + return; + } - for(s = dir; *s ;s++) - if(unlikely(*s == '/')) - depth++; + snprintfz(out->path, FILENAME_MAX, "%s%s/cgroup.procs", cgroup_devices_base, id); + if (likely(stat(out->path, &buf) == 0)) { + return; + } - if(depth > cgroup_max_depth) { - info("CGROUP: '%s' is too deep (%d, while max is %d)", dir, depth, cgroup_max_depth); - return; - } + out->path[0] = '\0'; + out->enabled = 0; +} + +static inline void convert_cgroup_to_systemd_service(struct cgroup *cg) { + char buffer[CGROUP_CHARTID_LINE_MAX]; + cg->options |= CGROUP_OPTIONS_SYSTEM_SLICE_SERVICE; + strncpyz(buffer, cg->id, CGROUP_CHARTID_LINE_MAX); + char *s = buffer; + + // skip to the last slash + size_t len = strlen(s); + while (len--) { + if (unlikely(s[len] == '/')) { + break; } - // debug(D_CGROUP, "will add dir '%s' as cgroup", dir); - cg = cgroup_add(dir); + } + if (len) { + s = &s[len + 1]; } - if(cg) { - // delay renaming of the cgroup and looking for network interfaces to deal with the docker lag when starting the container - if(unlikely(cg->pending_renames == 1)) { - // fix the chart_id and title by calling the external script - if(simple_pattern_matches(enabled_cgroup_renames, cg->id)) { + // remove extension + len = strlen(s); + while (len--) { + if (unlikely(s[len] == '.')) { + break; + } + } + if (len) { + s[len] = '\0'; + } - cgroup_get_chart_name(cg); - cg->pending_renames = 0; + freez(cg->chart_title); + cg->chart_title = cgroup_title_strdupz(s); +} - if(cg->enabled && !(cg->options & CGROUP_OPTIONS_SYSTEM_SLICE_SERVICE)) - read_cgroup_network_interfaces(cg); +static inline struct cgroup *discovery_cgroup_add(const char *id) { + debug(D_CGROUP, "adding to list, cgroup with id '%s'", id); - debug(D_CGROUP, "cgroup '%s' renamed to '%s' (title: '%s')", cg->id, cg->chart_id, cg->chart_title); - } - else - debug(D_CGROUP, "cgroup '%s' will not be renamed - it matches the list of disabled cgroup renames (will be shown as '%s')", cg->id, cg->chart_id); + struct cgroup *cg = callocz(1, sizeof(struct cgroup)); + cg->id = strdupz(id); + cg->hash = simple_hash(cg->id); + cg->chart_title = cgroup_title_strdupz(id); + cg->intermediate_id = cgroup_chart_id_strdupz(id); + cg->chart_id = cgroup_chart_id_strdupz(id); + substitute_dots_in_id(cg->chart_id); + cg->hash_chart = simple_hash(cg->chart_id); + if (cgroup_use_unified_cgroups) { + cg->options |= CGROUP_OPTIONS_IS_UNIFIED; + } + + if (!discovered_cgroup_root) + discovered_cgroup_root = cg; + else { + struct cgroup *t; + for (t = discovered_cgroup_root; t->discovered_next; t = t->discovered_next) { } + t->discovered_next = cg; + } + + return cg; +} + +static inline struct cgroup *discovery_cgroup_find(const char *id) { + debug(D_CGROUP, "searching for cgroup '%s'", id); + + uint32_t hash = simple_hash(id); + + struct cgroup *cg; + for(cg = discovered_cgroup_root; cg ; cg = cg->discovered_next) { + if(hash == cg->hash && strcmp(id, cg->id) == 0) + break; + } + + debug(D_CGROUP, "cgroup '%s' %s in memory", id, (cg)?"found":"not found"); + return cg; +} +static inline void discovery_find_cgroup_in_dir_callback(const char *dir) { + if (!dir || !*dir) { + dir = "/"; + } + debug(D_CGROUP, "examining cgroup dir '%s'", dir); + + struct cgroup *cg = discovery_cgroup_find(dir); + if (cg) { cg->available = 1; + return; } + + if (cgroup_root_count >= cgroup_root_max) { + info("CGROUP: maximum number of cgroups reached (%d). Not adding cgroup '%s'", cgroup_root_count, dir); + return; + } + + if (cgroup_max_depth > 0) { + int depth = calc_cgroup_depth(dir); + if (depth > cgroup_max_depth) { + info("CGROUP: '%s' is too deep (%d, while max is %d)", dir, depth, cgroup_max_depth); + return; + } + } + + cg = discovery_cgroup_add(dir); + cg->available = 1; + cg->first_time_seen = 1; + cgroup_root_count++; } -static inline int find_dir_in_subdirs(const char *base, const char *this, void (*callback)(const char *)) { +static inline int discovery_find_dir_in_subdirs(const char *base, const char *this, void (*callback)(const char *)) { if(!this) this = base; debug(D_CGROUP, "searching for directories in '%s' (base '%s')", this?this:"", base); @@ -1925,15 +2067,7 @@ static inline int find_dir_in_subdirs(const char *base, const char *this, void ( if(*r == '\0') r = "/"; // do not decent in directories we are not interested - int def = simple_pattern_matches(enabled_cgroup_paths, r); - - // we check for this option here - // so that the config will not have settings - // for leaf directories - char option[FILENAME_MAX + 1]; - snprintfz(option, FILENAME_MAX, "search for cgroups under %s", r); - option[FILENAME_MAX] = '\0'; - enabled = config_get_boolean("plugin:cgroups", option, def); + enabled = matches_search_cgroup_paths(r); } if(enabled) { @@ -1941,7 +2075,7 @@ static inline int find_dir_in_subdirs(const char *base, const char *this, void ( strcpy(s, this); strcat(s, "/"); strcat(s, de->d_name); - int ret2 = find_dir_in_subdirs(base, s, callback); + int ret2 = discovery_find_dir_in_subdirs(base, s, callback); if(ret2 > 0) ret += ret2; freez(s); } @@ -1952,28 +2086,19 @@ static inline int find_dir_in_subdirs(const char *base, const char *this, void ( return ret; } -static inline void mark_all_cgroups_as_not_available() { +static inline void discovery_mark_all_cgroups_as_unavailable() { debug(D_CGROUP, "marking all cgroups as not available"); - struct cgroup *cg; - - // mark all as not available - for(cg = discovered_cgroup_root; cg ; cg = cg->discovered_next) { + for (cg = discovered_cgroup_root; cg; cg = cg->discovered_next) { cg->available = 0; } } -static inline void update_filenames() -{ +static inline void discovery_update_filenames() { struct cgroup *cg; struct stat buf; for(cg = discovered_cgroup_root; cg ; cg = cg->discovered_next) { - // fprintf(stderr, " >>> CGROUP '%s' (%u - %s) with name '%s'\n", cg->id, cg->hash, cg->available?"available":"stopped", cg->name); - - if(unlikely(cg->pending_renames)) - cg->pending_renames--; - - if(unlikely(!cg->available || cg->pending_renames)) + if(unlikely(!cg->available || !cg->enabled || cg->pending_renames)) continue; debug(D_CGROUP, "checking paths for cgroup '%s'", cg->id); @@ -1999,7 +2124,7 @@ static inline void update_filenames() debug(D_CGROUP, "cpuacct.stat file for cgroup '%s': '%s' does not exist.", cg->id, filename); } - if(unlikely(cgroup_enable_cpuacct_usage && !cg->cpuacct_usage.filename && !(cg->options & CGROUP_OPTIONS_SYSTEM_SLICE_SERVICE))) { + if(unlikely(cgroup_enable_cpuacct_usage && !cg->cpuacct_usage.filename && !is_cgroup_systemd_service(cg))) { snprintfz(filename, FILENAME_MAX, "%s%s/cpuacct.usage_percpu", cgroup_cpuacct_base, cg->id); if(likely(stat(filename, &buf) != -1)) { cg->cpuacct_usage.filename = strdupz(filename); @@ -2009,7 +2134,7 @@ static inline void update_filenames() else debug(D_CGROUP, "cpuacct.usage_percpu file for cgroup '%s': '%s' does not exist.", cg->id, filename); } - if(unlikely(cgroup_enable_cpuacct_cpu_throttling && !cg->cpuacct_cpu_throttling.filename && !(cg->options & CGROUP_OPTIONS_SYSTEM_SLICE_SERVICE))) { + if(unlikely(cgroup_enable_cpuacct_cpu_throttling && !cg->cpuacct_cpu_throttling.filename && !is_cgroup_systemd_service(cg))) { snprintfz(filename, FILENAME_MAX, "%s%s/cpu.stat", cgroup_cpuacct_base, cg->id); if(likely(stat(filename, &buf) != -1)) { cg->cpuacct_cpu_throttling.filename = strdupz(filename); @@ -2019,8 +2144,20 @@ static inline void update_filenames() else debug(D_CGROUP, "cpu.stat file for cgroup '%s': '%s' does not exist.", cg->id, filename); } + if (unlikely( + cgroup_enable_cpuacct_cpu_shares && !cg->cpuacct_cpu_shares.filename && + !is_cgroup_systemd_service(cg))) { + snprintfz(filename, FILENAME_MAX, "%s%s/cpu.shares", cgroup_cpuacct_base, cg->id); + if (likely(stat(filename, &buf) != -1)) { + cg->cpuacct_cpu_shares.filename = strdupz(filename); + cg->cpuacct_cpu_shares.enabled = cgroup_enable_cpuacct_cpu_shares; + debug( + D_CGROUP, "cpu.shares filename for cgroup '%s': '%s'", cg->id, cg->cpuacct_cpu_shares.filename); + } else + debug(D_CGROUP, "cpu.shares file for cgroup '%s': '%s' does not exist.", cg->id, filename); + } - if(unlikely((cgroup_enable_detailed_memory || cgroup_used_memory) && !cg->memory.filename_detailed && (cgroup_used_memory || cgroup_enable_systemd_services_detailed_memory || !(cg->options & CGROUP_OPTIONS_SYSTEM_SLICE_SERVICE)))) { + if(unlikely((cgroup_enable_detailed_memory || cgroup_used_memory) && !cg->memory.filename_detailed && (cgroup_used_memory || cgroup_enable_systemd_services_detailed_memory || !is_cgroup_systemd_service(cg)))) { snprintfz(filename, FILENAME_MAX, "%s%s/memory.stat", cgroup_memory_base, cg->id); if(likely(stat(filename, &buf) != -1)) { cg->memory.filename_detailed = strdupz(filename); @@ -2219,7 +2356,17 @@ static inline void update_filenames() else debug(D_CGROUP, "cpu.stat file for unified cgroup '%s': '%s' does not exist.", cg->id, filename); } - if(unlikely((cgroup_enable_detailed_memory || cgroup_used_memory) && !cg->memory.filename_detailed && (cgroup_used_memory || cgroup_enable_systemd_services_detailed_memory || !(cg->options & CGROUP_OPTIONS_SYSTEM_SLICE_SERVICE)))) { + if (unlikely(cgroup_enable_cpuacct_cpu_shares && !cg->cpuacct_cpu_shares.filename)) { + snprintfz(filename, FILENAME_MAX, "%s%s/cpu.weight", cgroup_unified_base, cg->id); + if (likely(stat(filename, &buf) != -1)) { + cg->cpuacct_cpu_shares.filename = strdupz(filename); + cg->cpuacct_cpu_shares.enabled = cgroup_enable_cpuacct_cpu_shares; + debug(D_CGROUP, "cpu.weight filename for cgroup '%s': '%s'", cg->id, cg->cpuacct_cpu_shares.filename); + } else + debug(D_CGROUP, "cpu.weight file for cgroup '%s': '%s' does not exist.", cg->id, filename); + } + + if(unlikely((cgroup_enable_detailed_memory || cgroup_used_memory) && !cg->memory.filename_detailed && (cgroup_used_memory || cgroup_enable_systemd_services_detailed_memory || !is_cgroup_systemd_service(cg)))) { snprintfz(filename, FILENAME_MAX, "%s%s/memory.stat", cgroup_unified_base, cg->id); if(likely(stat(filename, &buf) != -1)) { cg->memory.filename_detailed = strdupz(filename); @@ -2295,7 +2442,7 @@ static inline void update_filenames() } } -static inline void cleanup_all_cgroups() { +static inline void discovery_cleanup_all_cgroups() { struct cgroup *cg = discovered_cgroup_root, *last = NULL; for(; cg ;) { @@ -2332,49 +2479,19 @@ static inline void cleanup_all_cgroups() { } } -static inline void copy_discovered_cgroups() -{ +static inline void discovery_copy_discovered_cgroups_to_reader() { debug(D_CGROUP, "copy discovered cgroups to the main group list"); struct cgroup *cg; - for(cg = discovered_cgroup_root; cg ; cg = cg->discovered_next) { + for (cg = discovered_cgroup_root; cg; cg = cg->discovered_next) { cg->next = cg->discovered_next; } cgroup_root = discovered_cgroup_root; } -static void is_there_cgroup_procs(netdata_ebpf_cgroup_shm_body_t *out, char *id) -{ - struct stat buf; - - snprintfz(out->path, FILENAME_MAX, "%s%s/cgroup.procs", cgroup_cpuset_base, id); - if (likely(stat(out->path, &buf) == 0)) { - return; - } - - snprintfz(out->path, FILENAME_MAX, "%s%s/cgroup.procs", cgroup_blkio_base, id); - if (likely(stat(out->path, &buf) == 0)) { - return; - } - - snprintfz(out->path, FILENAME_MAX, "%s%s/cgroup.procs", cgroup_memory_base, id); - if (likely(stat(out->path, &buf) == 0)) { - return; - } - - snprintfz(out->path, FILENAME_MAX, "%s%s/cgroup.procs", cgroup_devices_base, id); - if (likely(stat(out->path, &buf) == 0)) { - return; - } - - out->path[0] = '\0'; - out->enabled = 0; -} - -static inline void share_cgroups() -{ +static inline void discovery_share_cgroups_with_ebpf() { struct cgroup *cg; int count; struct stat buf; @@ -2384,9 +2501,9 @@ static inline void share_cgroups() } sem_wait(shm_mutex_cgroup_ebpf); - for (cg = cgroup_root, count = 0; cg ; cg = cg->next, count++) { + for (cg = cgroup_root, count = 0; cg; cg = cg->next, count++) { netdata_ebpf_cgroup_shm_body_t *ptr = &shm_cgroup_ebpf.body[count]; - char *prefix = (cg->options & CGROUP_OPTIONS_SYSTEM_SLICE_SERVICE) ? "" : "cgroup_"; + char *prefix = (is_cgroup_systemd_service(cg)) ? "" : "cgroup_"; snprintfz(ptr->name, CGROUP_EBPF_NAME_SHARED_LENGTH - 1, "%s%s", prefix, cg->chart_title); ptr->hash = simple_hash(ptr->name); ptr->options = cg->options; @@ -2398,7 +2515,7 @@ static inline void share_cgroups() ptr->enabled = 0; } } else { - is_there_cgroup_procs(ptr, cg->id); + is_cgroup_procs_exist(ptr, cg->id); } debug(D_CGROUP, "cgroup shared: NAME=%s, ENABLED=%d", ptr->name, ptr->enabled); @@ -2408,63 +2525,197 @@ static inline void share_cgroups() sem_post(shm_mutex_cgroup_ebpf); } -static inline void find_all_cgroups() { - debug(D_CGROUP, "searching for cgroups"); +static inline void discovery_find_all_cgroups_v1() { + if (cgroup_enable_cpuacct_stat || cgroup_enable_cpuacct_usage) { + if (discovery_find_dir_in_subdirs(cgroup_cpuacct_base, NULL, discovery_find_cgroup_in_dir_callback) == -1) { + cgroup_enable_cpuacct_stat = cgroup_enable_cpuacct_usage = CONFIG_BOOLEAN_NO; + error("CGROUP: disabled cpu statistics."); + } + } - mark_all_cgroups_as_not_available(); - if(!cgroup_use_unified_cgroups) { - if(cgroup_enable_cpuacct_stat || cgroup_enable_cpuacct_usage) { - if(find_dir_in_subdirs(cgroup_cpuacct_base, NULL, found_subdir_in_dir) == -1) { - cgroup_enable_cpuacct_stat = - cgroup_enable_cpuacct_usage = CONFIG_BOOLEAN_NO; - error("CGROUP: disabled cpu statistics."); - } + if (cgroup_enable_blkio_io || cgroup_enable_blkio_ops || cgroup_enable_blkio_throttle_io || + cgroup_enable_blkio_throttle_ops || cgroup_enable_blkio_merged_ops || cgroup_enable_blkio_queued_ops) { + if (discovery_find_dir_in_subdirs(cgroup_blkio_base, NULL, discovery_find_cgroup_in_dir_callback) == -1) { + cgroup_enable_blkio_io = cgroup_enable_blkio_ops = cgroup_enable_blkio_throttle_io = + cgroup_enable_blkio_throttle_ops = cgroup_enable_blkio_merged_ops = cgroup_enable_blkio_queued_ops = + CONFIG_BOOLEAN_NO; + error("CGROUP: disabled blkio statistics."); } + } - if(cgroup_enable_blkio_io || cgroup_enable_blkio_ops || cgroup_enable_blkio_throttle_io || cgroup_enable_blkio_throttle_ops || cgroup_enable_blkio_merged_ops || cgroup_enable_blkio_queued_ops) { - if(find_dir_in_subdirs(cgroup_blkio_base, NULL, found_subdir_in_dir) == -1) { - cgroup_enable_blkio_io = - cgroup_enable_blkio_ops = - cgroup_enable_blkio_throttle_io = - cgroup_enable_blkio_throttle_ops = - cgroup_enable_blkio_merged_ops = - cgroup_enable_blkio_queued_ops = CONFIG_BOOLEAN_NO; - error("CGROUP: disabled blkio statistics."); - } + if (cgroup_enable_memory || cgroup_enable_detailed_memory || cgroup_enable_swap || cgroup_enable_memory_failcnt) { + if (discovery_find_dir_in_subdirs(cgroup_memory_base, NULL, discovery_find_cgroup_in_dir_callback) == -1) { + cgroup_enable_memory = cgroup_enable_detailed_memory = cgroup_enable_swap = cgroup_enable_memory_failcnt = + CONFIG_BOOLEAN_NO; + error("CGROUP: disabled memory statistics."); } + } - if(cgroup_enable_memory || cgroup_enable_detailed_memory || cgroup_enable_swap || cgroup_enable_memory_failcnt) { - if(find_dir_in_subdirs(cgroup_memory_base, NULL, found_subdir_in_dir) == -1) { - cgroup_enable_memory = - cgroup_enable_detailed_memory = - cgroup_enable_swap = - cgroup_enable_memory_failcnt = CONFIG_BOOLEAN_NO; - error("CGROUP: disabled memory statistics."); - } + if (cgroup_search_in_devices) { + if (discovery_find_dir_in_subdirs(cgroup_devices_base, NULL, discovery_find_cgroup_in_dir_callback) == -1) { + cgroup_search_in_devices = 0; + error("CGROUP: disabled devices statistics."); } + } +} - if(cgroup_search_in_devices) { - if(find_dir_in_subdirs(cgroup_devices_base, NULL, found_subdir_in_dir) == -1) { - cgroup_search_in_devices = 0; - error("CGROUP: disabled devices statistics."); - } +static inline void discovery_find_all_cgroups_v2() { + if (discovery_find_dir_in_subdirs(cgroup_unified_base, NULL, discovery_find_cgroup_in_dir_callback) == -1) { + cgroup_unified_exist = CONFIG_BOOLEAN_NO; + error("CGROUP: disabled unified cgroups statistics."); + } +} + +static int is_digits_only(const char *s) { + do { + if (!isdigit(*s++)) { + return 0; + } + } while (*s); + + return 1; +} + +static inline void discovery_process_first_time_seen_cgroup(struct cgroup *cg) { + if (!cg->first_time_seen) { + return; + } + cg->first_time_seen = 0; + + char comm[TASK_COMM_LEN]; + + if (is_inside_k8s && !k8s_get_container_first_proc_comm(cg->id, comm)) { + // container initialization may take some time when CPU % is high + // seen on GKE: comm is '6' before 'runc:[2:INIT]' (dunno if it could be another number) + if (is_digits_only(comm) || matches_entrypoint_parent_process_comm(comm)) { + cg->first_time_seen = 1; + return; + } + if (!strcmp(comm, "pause")) { + // a container that holds the network namespace for the pod + // we don't need to collect its metrics + cg->processed = 1; + return; } } - else { - if (find_dir_in_subdirs(cgroup_unified_base, NULL, found_subdir_in_dir) == -1) { - cgroup_unified_exist = CONFIG_BOOLEAN_NO; - error("CGROUP: disabled unified cgroups statistics."); + + if (cgroup_enable_systemd_services && matches_systemd_services_cgroups(cg->id)) { + debug(D_CGROUP, "cgroup '%s' (name '%s') matches 'cgroups to match as systemd services'", cg->id, cg->chart_title); + convert_cgroup_to_systemd_service(cg); + return; + } + + if (matches_enabled_cgroup_renames(cg->id)) { + debug(D_CGROUP, "cgroup '%s' (name '%s') matches 'run script to rename cgroups matching', will try to rename it", cg->id, cg->chart_title); + if (is_inside_k8s && k8s_is_container(cg->id)) { + // it may take up to a minute for the K8s API to return data for the container + // tested on AWS K8s cluster with 100% CPU utilization + cg->pending_renames = 9; // 1.5 minute + } else { + cg->pending_renames = 2; } } +} - update_filenames(); +static int discovery_is_cgroup_duplicate(struct cgroup *cg) { + // https://github.com/netdata/netdata/issues/797#issuecomment-241248884 + struct cgroup *c; + for (c = discovered_cgroup_root; c; c = c->discovered_next) { + if (c != cg && c->enabled && c->hash_chart == cg->hash_chart && !strcmp(c->chart_id, cg->chart_id)) { + error("CGROUP: chart id '%s' already exists with id '%s' and is enabled and available. Disabling cgroup with id '%s'.", cg->chart_id, c->id, cg->id); + return 1; + } + } + return 0; +} +static inline void discovery_process_cgroup(struct cgroup *cg) { + if (!cg) { + debug(D_CGROUP, "discovery_process_cgroup() received NULL"); + return; + } + if (!cg->available || cg->processed) { + return; + } + + if (cg->first_time_seen) { + worker_is_busy(WORKER_DISCOVERY_PROCESS_FIRST_TIME); + discovery_process_first_time_seen_cgroup(cg); + if (unlikely(cg->first_time_seen || cg->processed)) { + return; + } + } + + if (cg->pending_renames) { + worker_is_busy(WORKER_DISCOVERY_PROCESS_RENAME); + discovery_rename_cgroup(cg); + if (unlikely(cg->pending_renames || cg->processed)) { + return; + } + } + + cg->processed = 1; + + if (is_cgroup_systemd_service(cg)) { + cg->enabled = 1; + return; + } + + if (!(cg->enabled = matches_enabled_cgroup_names(cg->chart_title))) { + debug(D_CGROUP, "cgroup '%s' (name '%s') disabled by 'enable by default cgroups names matching'", cg->id, cg->chart_title); + return; + } + + if (!(cg->enabled = matches_enabled_cgroup_paths(cg->id))) { + debug(D_CGROUP, "cgroup '%s' (name '%s') disabled by 'enable by default cgroups matching'", cg->id, cg->chart_title); + return; + } + + if (discovery_is_cgroup_duplicate(cg)) { + cg->enabled = 0; + cg->options |= CGROUP_OPTIONS_DISABLED_DUPLICATE; + return; + } + + worker_is_busy(WORKER_DISCOVERY_PROCESS_NETWORK); + read_cgroup_network_interfaces(cg); +} + +static inline void discovery_find_all_cgroups() { + debug(D_CGROUP, "searching for cgroups"); + + worker_is_busy(WORKER_DISCOVERY_INIT); + discovery_mark_all_cgroups_as_unavailable(); + + worker_is_busy(WORKER_DISCOVERY_FIND); + if (!cgroup_use_unified_cgroups) { + discovery_find_all_cgroups_v1(); + } else { + discovery_find_all_cgroups_v2(); + } + + struct cgroup *cg; + for (cg = discovered_cgroup_root; cg; cg = cg->discovered_next) { + worker_is_busy(WORKER_DISCOVERY_PROCESS); + discovery_process_cgroup(cg); + } + + worker_is_busy(WORKER_DISCOVERY_UPDATE); + discovery_update_filenames(); + + worker_is_busy(WORKER_DISCOVERY_LOCK); uv_mutex_lock(&cgroup_root_mutex); - cleanup_all_cgroups(); - copy_discovered_cgroups(); + + worker_is_busy(WORKER_DISCOVERY_CLEANUP); + discovery_cleanup_all_cgroups(); + + worker_is_busy(WORKER_DISCOVERY_COPY); + discovery_copy_discovered_cgroups_to_reader(); + uv_mutex_unlock(&cgroup_root_mutex); - share_cgroups(); + worker_is_busy(WORKER_DISCOVERY_SHARE); + discovery_share_cgroups_with_ebpf(); debug(D_CGROUP, "done searching for cgroups"); } @@ -2473,7 +2724,28 @@ void cgroup_discovery_worker(void *ptr) { UNUSED(ptr); + worker_register("CGROUPSDISC"); + worker_register_job_name(WORKER_DISCOVERY_INIT, "init"); + worker_register_job_name(WORKER_DISCOVERY_FIND, "find"); + worker_register_job_name(WORKER_DISCOVERY_PROCESS, "process"); + worker_register_job_name(WORKER_DISCOVERY_PROCESS_RENAME, "rename"); + worker_register_job_name(WORKER_DISCOVERY_PROCESS_NETWORK, "network"); + worker_register_job_name(WORKER_DISCOVERY_PROCESS_FIRST_TIME, "new"); + worker_register_job_name(WORKER_DISCOVERY_UPDATE, "update"); + worker_register_job_name(WORKER_DISCOVERY_CLEANUP, "cleanup"); + worker_register_job_name(WORKER_DISCOVERY_COPY, "copy"); + worker_register_job_name(WORKER_DISCOVERY_SHARE, "share"); + worker_register_job_name(WORKER_DISCOVERY_LOCK, "lock"); + + entrypoint_parent_process_comm = simple_pattern_create( + " runc:[* " // http://terenceli.github.io/%E6%8A%80%E6%9C%AF/2021/12/28/runc-internals-3) + " exe ", // https://github.com/falcosecurity/falco/blob/9d41b0a151b83693929d3a9c84f7c5c85d070d3a/rules/falco_rules.yaml#L1961 + NULL, + SIMPLE_PATTERN_EXACT); + while (!netdata_exit) { + worker_is_idle(); + uv_mutex_lock(&discovery_thread.mutex); while (!discovery_thread.start_discovery) uv_cond_wait(&discovery_thread.cond_var, &discovery_thread.mutex); @@ -2483,10 +2755,11 @@ void cgroup_discovery_worker(void *ptr) if (unlikely(netdata_exit)) break; - find_all_cgroups(); + discovery_find_all_cgroups(); } discovery_thread.exited = 1; + worker_unregister(); } // ---------------------------------------------------------------------------- @@ -3069,7 +3342,7 @@ void update_systemd_services_charts( // update the values struct cgroup *cg; for(cg = cgroup_root; cg ; cg = cg->next) { - if(unlikely(!cg->enabled || cg->pending_renames || !(cg->options & CGROUP_OPTIONS_SYSTEM_SLICE_SERVICE))) + if(unlikely(!cg->enabled || cg->pending_renames || !is_cgroup_systemd_service(cg))) continue; if(likely(do_cpu && cg->cpuacct_stat.updated)) { @@ -3386,7 +3659,7 @@ static inline void update_cpu_limits2(struct cgroup *cg) { cg->cpuset_cpus = get_system_cpus(); char *s = "max\n\0"; - if(strsame(s, procfile_lineword(ff, 0, 0)) == 0){ + if(strcmp(s, procfile_lineword(ff, 0, 0)) == 0){ cg->cpu_cfs_quota = cg->cpu_cfs_period * cg->cpuset_cpus; } else { cg->cpu_cfs_quota = str2ull(procfile_lineword(ff, 0, 0)); @@ -3434,7 +3707,7 @@ static inline int update_memory_limits(char **filename, RRDSETVAR **chart_var, u return 0; } char *s = "max\n\0"; - if(strsame(s, buffer) == 0){ + if(strcmp(s, buffer) == 0){ *value = UINT64_MAX; rrdsetvar_custom_chart_variable_set(*chart_var, (calculated_number)(*value / (1024 * 1024))); return 1; @@ -3471,7 +3744,7 @@ void update_cgroup_charts(int update_every) { if(unlikely(!cg->enabled || cg->pending_renames)) continue; - if(likely(cgroup_enable_systemd_services && cg->options & CGROUP_OPTIONS_SYSTEM_SLICE_SERVICE)) { + if(likely(cgroup_enable_systemd_services && is_cgroup_systemd_service(cg))) { if(cg->cpuacct_stat.updated && cg->cpuacct_stat.enabled == CONFIG_BOOLEAN_YES) services_do_cpu++; if(cgroup_enable_systemd_services_detailed_memory && cg->memory.updated_detailed && cg->memory.enabled_detailed) services_do_mem_detailed++; @@ -3670,6 +3943,34 @@ void update_cgroup_charts(int update_every) { } } + if (likely(cg->cpuacct_cpu_shares.updated && cg->cpuacct_cpu_shares.enabled == CONFIG_BOOLEAN_YES)) { + if (unlikely(!cg->st_cpu_shares)) { + snprintfz(title, CHART_TITLE_MAX, "CPU Time Relative Share"); + + cg->st_cpu_shares = rrdset_create_localhost( + cgroup_chart_type(type, cg->chart_id, RRD_ID_LENGTH_MAX) + , "cpu_shares" + , NULL + , "cpu" + , "cgroup.cpu_shares" + , title + , "shares" + , PLUGIN_CGROUPS_NAME + , PLUGIN_CGROUPS_MODULE_CGROUPS_NAME + , cgroup_containers_chart_priority + 20 + , update_every + , RRDSET_TYPE_LINE + ); + + rrdset_update_labels(cg->st_cpu_shares, cg->chart_labels); + rrddim_add(cg->st_cpu_shares, "shares", NULL, 1, 1, RRD_ALGORITHM_ABSOLUTE); + } else { + rrdset_next(cg->st_cpu_shares); + rrddim_set(cg->st_cpu_shares, "shares", cg->cpuacct_cpu_shares.shares); + rrdset_done(cg->st_cpu_shares); + } + } + if(likely(cg->cpuacct_usage.updated && cg->cpuacct_usage.enabled == CONFIG_BOOLEAN_YES)) { char id[RRD_ID_LENGTH_MAX + 1]; unsigned int i; @@ -4239,17 +4540,20 @@ void update_cgroup_charts(int update_every) { if (cg->options & CGROUP_OPTIONS_IS_UNIFIED) { struct pressure *res = &cg->cpu_pressure; + if (likely(res->updated && res->some.enabled)) { - if (unlikely(!res->some.st)) { - RRDSET *chart; - snprintfz(title, CHART_TITLE_MAX, "CPU pressure"); + struct pressure_charts *pcs; + pcs = &res->some; - chart = res->some.st = rrdset_create_localhost( + if (unlikely(!pcs->share_time.st)) { + RRDSET *chart; + snprintfz(title, CHART_TITLE_MAX, "CPU some pressure"); + chart = pcs->share_time.st = rrdset_create_localhost( cgroup_chart_type(type, cg->chart_id, RRD_ID_LENGTH_MAX) - , "cpu_pressure" + , "cpu_some_pressure" , NULL , "cpu" - , "cgroup.cpu_pressure" + , "cgroup.cpu_some_pressure" , title , "percentage" , PLUGIN_CGROUPS_NAME @@ -4258,31 +4562,105 @@ void update_cgroup_charts(int update_every) { , update_every , RRDSET_TYPE_LINE ); - - rrdset_update_labels(chart = res->some.st, cg->chart_labels); - - res->some.rd10 = rrddim_add(chart, "some 10", NULL, 1, 100, RRD_ALGORITHM_ABSOLUTE); - res->some.rd60 = rrddim_add(chart, "some 60", NULL, 1, 100, RRD_ALGORITHM_ABSOLUTE); - res->some.rd300 = rrddim_add(chart, "some 300", NULL, 1, 100, RRD_ALGORITHM_ABSOLUTE); + rrdset_update_labels(chart = pcs->share_time.st, cg->chart_labels); + pcs->share_time.rd10 = rrddim_add(chart, "some 10", NULL, 1, 100, RRD_ALGORITHM_ABSOLUTE); + pcs->share_time.rd60 = rrddim_add(chart, "some 60", NULL, 1, 100, RRD_ALGORITHM_ABSOLUTE); + pcs->share_time.rd300 = rrddim_add(chart, "some 300", NULL, 1, 100, RRD_ALGORITHM_ABSOLUTE); + } else { + rrdset_next(pcs->share_time.st); + } + if (unlikely(!pcs->total_time.st)) { + RRDSET *chart; + snprintfz(title, CHART_TITLE_MAX, "CPU some pressure stall time"); + chart = pcs->total_time.st = rrdset_create_localhost( + cgroup_chart_type(type, cg->chart_id, RRD_ID_LENGTH_MAX) + , "cpu_some_pressure_stall_time" + , NULL + , "cpu" + , "cgroup.cpu_some_pressure_stall_time" + , title + , "ms" + , PLUGIN_CGROUPS_NAME + , PLUGIN_CGROUPS_MODULE_CGROUPS_NAME + , cgroup_containers_chart_priority + 2220 + , update_every + , RRDSET_TYPE_LINE + ); + rrdset_update_labels(chart = pcs->total_time.st, cg->chart_labels); + pcs->total_time.rdtotal = rrddim_add(chart, "time", NULL, 1, 1, RRD_ALGORITHM_INCREMENTAL); } else { - rrdset_next(res->some.st); + rrdset_next(pcs->total_time.st); } + update_pressure_charts(pcs); + } + if (likely(res->updated && res->full.enabled)) { + struct pressure_charts *pcs; + pcs = &res->full; - update_pressure_chart(&res->some); + if (unlikely(!pcs->share_time.st)) { + RRDSET *chart; + snprintfz(title, CHART_TITLE_MAX, "CPU full pressure"); + chart = pcs->share_time.st = rrdset_create_localhost( + cgroup_chart_type(type, cg->chart_id, RRD_ID_LENGTH_MAX) + , "cpu_full_pressure" + , NULL + , "cpu" + , "cgroup.cpu_full_pressure" + , title + , "percentage" + , PLUGIN_CGROUPS_NAME + , PLUGIN_CGROUPS_MODULE_CGROUPS_NAME + , cgroup_containers_chart_priority + 2240 + , update_every + , RRDSET_TYPE_LINE + ); + rrdset_update_labels(chart = pcs->share_time.st, cg->chart_labels); + pcs->share_time.rd10 = rrddim_add(chart, "full 10", NULL, 1, 100, RRD_ALGORITHM_ABSOLUTE); + pcs->share_time.rd60 = rrddim_add(chart, "full 60", NULL, 1, 100, RRD_ALGORITHM_ABSOLUTE); + pcs->share_time.rd300 = rrddim_add(chart, "full 300", NULL, 1, 100, RRD_ALGORITHM_ABSOLUTE); + } else { + rrdset_next(pcs->share_time.st); + } + if (unlikely(!pcs->total_time.st)) { + RRDSET *chart; + snprintfz(title, CHART_TITLE_MAX, "CPU full pressure stall time"); + chart = pcs->total_time.st = rrdset_create_localhost( + cgroup_chart_type(type, cg->chart_id, RRD_ID_LENGTH_MAX) + , "cpu_full_pressure_stall_time" + , NULL + , "cpu" + , "cgroup.cpu_full_pressure_stall_time" + , title + , "ms" + , PLUGIN_CGROUPS_NAME + , PLUGIN_CGROUPS_MODULE_CGROUPS_NAME + , cgroup_containers_chart_priority + 2260 + , update_every + , RRDSET_TYPE_LINE + ); + rrdset_update_labels(chart = pcs->total_time.st, cg->chart_labels); + pcs->total_time.rdtotal = rrddim_add(chart, "time", NULL, 1, 1, RRD_ALGORITHM_INCREMENTAL); + } else { + rrdset_next(pcs->total_time.st); + } + update_pressure_charts(pcs); } res = &cg->memory_pressure; + if (likely(res->updated && res->some.enabled)) { - if (unlikely(!res->some.st)) { - RRDSET *chart; - snprintfz(title, CHART_TITLE_MAX, "Memory pressure"); + struct pressure_charts *pcs; + pcs = &res->some; - chart = res->some.st = rrdset_create_localhost( + if (unlikely(!pcs->share_time.st)) { + RRDSET *chart; + snprintfz(title, CHART_TITLE_MAX, "Memory some pressure"); + chart = pcs->share_time.st = rrdset_create_localhost( cgroup_chart_type(type, cg->chart_id, RRD_ID_LENGTH_MAX) - , "mem_pressure" + , "mem_some_pressure" , NULL , "mem" - , "cgroup.memory_pressure" + , "cgroup.memory_some_pressure" , title , "percentage" , PLUGIN_CGROUPS_NAME @@ -4290,26 +4668,48 @@ void update_cgroup_charts(int update_every) { , cgroup_containers_chart_priority + 2300 , update_every , RRDSET_TYPE_LINE - ); - - rrdset_update_labels(chart = res->some.st, cg->chart_labels); - - res->some.rd10 = rrddim_add(chart, "some 10", NULL, 1, 100, RRD_ALGORITHM_ABSOLUTE); - res->some.rd60 = rrddim_add(chart, "some 60", NULL, 1, 100, RRD_ALGORITHM_ABSOLUTE); - res->some.rd300 = rrddim_add(chart, "some 300", NULL, 1, 100, RRD_ALGORITHM_ABSOLUTE); + ); + rrdset_update_labels(chart = pcs->share_time.st, cg->chart_labels); + pcs->share_time.rd10 = rrddim_add(chart, "some 10", NULL, 1, 100, RRD_ALGORITHM_ABSOLUTE); + pcs->share_time.rd60 = rrddim_add(chart, "some 60", NULL, 1, 100, RRD_ALGORITHM_ABSOLUTE); + pcs->share_time.rd300 = rrddim_add(chart, "some 300", NULL, 1, 100, RRD_ALGORITHM_ABSOLUTE); } else { - rrdset_next(res->some.st); + rrdset_next(pcs->share_time.st); } - - update_pressure_chart(&res->some); + if (unlikely(!pcs->total_time.st)) { + RRDSET *chart; + snprintfz(title, CHART_TITLE_MAX, "Memory some pressure stall time"); + chart = pcs->total_time.st = rrdset_create_localhost( + cgroup_chart_type(type, cg->chart_id, RRD_ID_LENGTH_MAX) + , "memory_some_pressure_stall_time" + , NULL + , "mem" + , "cgroup.memory_some_pressure_stall_time" + , title + , "ms" + , PLUGIN_CGROUPS_NAME + , PLUGIN_CGROUPS_MODULE_CGROUPS_NAME + , cgroup_containers_chart_priority + 2320 + , update_every + , RRDSET_TYPE_LINE + ); + rrdset_update_labels(chart = pcs->total_time.st, cg->chart_labels); + pcs->total_time.rdtotal = rrddim_add(chart, "time", NULL, 1, 1, RRD_ALGORITHM_INCREMENTAL); + } else { + rrdset_next(pcs->total_time.st); + } + update_pressure_charts(pcs); } if (likely(res->updated && res->full.enabled)) { - if (unlikely(!res->full.st)) { + struct pressure_charts *pcs; + pcs = &res->full; + + if (unlikely(!pcs->share_time.st)) { RRDSET *chart; snprintfz(title, CHART_TITLE_MAX, "Memory full pressure"); - chart = res->full.st = rrdset_create_localhost( + chart = pcs->share_time.st = rrdset_create_localhost( cgroup_chart_type(type, cg->chart_id, RRD_ID_LENGTH_MAX) , "mem_full_pressure" , NULL @@ -4319,35 +4719,58 @@ void update_cgroup_charts(int update_every) { , "percentage" , PLUGIN_CGROUPS_NAME , PLUGIN_CGROUPS_MODULE_CGROUPS_NAME - , cgroup_containers_chart_priority + 2350 + , cgroup_containers_chart_priority + 2340 , update_every , RRDSET_TYPE_LINE ); - rrdset_update_labels(chart = res->full.st, cg->chart_labels); - - res->full.rd10 = rrddim_add(chart, "full 10", NULL, 1, 100, RRD_ALGORITHM_ABSOLUTE); - res->full.rd60 = rrddim_add(chart, "full 60", NULL, 1, 100, RRD_ALGORITHM_ABSOLUTE); - res->full.rd300 = rrddim_add(chart, "full 300", NULL, 1, 100, RRD_ALGORITHM_ABSOLUTE); + rrdset_update_labels(chart = pcs->share_time.st, cg->chart_labels); + pcs->share_time.rd10 = rrddim_add(chart, "full 10", NULL, 1, 100, RRD_ALGORITHM_ABSOLUTE); + pcs->share_time.rd60 = rrddim_add(chart, "full 60", NULL, 1, 100, RRD_ALGORITHM_ABSOLUTE); + pcs->share_time.rd300 = rrddim_add(chart, "full 300", NULL, 1, 100, RRD_ALGORITHM_ABSOLUTE); } else { - rrdset_next(res->full.st); + rrdset_next(pcs->share_time.st); } - - update_pressure_chart(&res->full); + if (unlikely(!pcs->total_time.st)) { + RRDSET *chart; + snprintfz(title, CHART_TITLE_MAX, "Memory full pressure stall time"); + chart = pcs->total_time.st = rrdset_create_localhost( + cgroup_chart_type(type, cg->chart_id, RRD_ID_LENGTH_MAX) + , "memory_full_pressure_stall_time" + , NULL + , "mem" + , "cgroup.memory_full_pressure_stall_time" + , title + , "ms" + , PLUGIN_CGROUPS_NAME + , PLUGIN_CGROUPS_MODULE_CGROUPS_NAME + , cgroup_containers_chart_priority + 2360 + , update_every + , RRDSET_TYPE_LINE + ); + rrdset_update_labels(chart = pcs->total_time.st, cg->chart_labels); + pcs->total_time.rdtotal = rrddim_add(chart, "time", NULL, 1, 1, RRD_ALGORITHM_INCREMENTAL); + } else { + rrdset_next(pcs->total_time.st); + } + update_pressure_charts(pcs); } res = &cg->io_pressure; + if (likely(res->updated && res->some.enabled)) { - if (unlikely(!res->some.st)) { - RRDSET *chart; - snprintfz(title, CHART_TITLE_MAX, "I/O pressure"); + struct pressure_charts *pcs; + pcs = &res->some; - chart = res->some.st = rrdset_create_localhost( + if (unlikely(!pcs->share_time.st)) { + RRDSET *chart; + snprintfz(title, CHART_TITLE_MAX, "I/O some pressure"); + chart = pcs->share_time.st = rrdset_create_localhost( cgroup_chart_type(type, cg->chart_id, RRD_ID_LENGTH_MAX) - , "io_pressure" + , "io_some_pressure" , NULL , "disk" - , "cgroup.io_pressure" + , "cgroup.io_some_pressure" , title , "percentage" , PLUGIN_CGROUPS_NAME @@ -4356,25 +4779,46 @@ void update_cgroup_charts(int update_every) { , update_every , RRDSET_TYPE_LINE ); - - rrdset_update_labels(chart = res->some.st, cg->chart_labels); - - res->some.rd10 = rrddim_add(chart, "some 10", NULL, 1, 100, RRD_ALGORITHM_ABSOLUTE); - res->some.rd60 = rrddim_add(chart, "some 60", NULL, 1, 100, RRD_ALGORITHM_ABSOLUTE); - res->some.rd300 = rrddim_add(chart, "some 300", NULL, 1, 100, RRD_ALGORITHM_ABSOLUTE); + rrdset_update_labels(chart = pcs->share_time.st, cg->chart_labels); + pcs->share_time.rd10 = rrddim_add(chart, "some 10", NULL, 1, 100, RRD_ALGORITHM_ABSOLUTE); + pcs->share_time.rd60 = rrddim_add(chart, "some 60", NULL, 1, 100, RRD_ALGORITHM_ABSOLUTE); + pcs->share_time.rd300 = rrddim_add(chart, "some 300", NULL, 1, 100, RRD_ALGORITHM_ABSOLUTE); } else { - rrdset_next(res->some.st); + rrdset_next(pcs->share_time.st); } - - update_pressure_chart(&res->some); + if (unlikely(!pcs->total_time.st)) { + RRDSET *chart; + snprintfz(title, CHART_TITLE_MAX, "I/O some pressure stall time"); + chart = pcs->total_time.st = rrdset_create_localhost( + cgroup_chart_type(type, cg->chart_id, RRD_ID_LENGTH_MAX) + , "io_some_pressure_stall_time" + , NULL + , "disk" + , "cgroup.io_some_pressure_stall_time" + , title + , "ms" + , PLUGIN_CGROUPS_NAME + , PLUGIN_CGROUPS_MODULE_CGROUPS_NAME + , cgroup_containers_chart_priority + 2420 + , update_every + , RRDSET_TYPE_LINE + ); + rrdset_update_labels(chart = pcs->total_time.st, cg->chart_labels); + pcs->total_time.rdtotal = rrddim_add(chart, "time", NULL, 1, 1, RRD_ALGORITHM_INCREMENTAL); + } else { + rrdset_next(pcs->total_time.st); + } + update_pressure_charts(pcs); } if (likely(res->updated && res->full.enabled)) { - if (unlikely(!res->full.st)) { + struct pressure_charts *pcs; + pcs = &res->full; + + if (unlikely(!pcs->share_time.st)) { RRDSET *chart; snprintfz(title, CHART_TITLE_MAX, "I/O full pressure"); - - chart = res->full.st = rrdset_create_localhost( + chart = pcs->share_time.st = rrdset_create_localhost( cgroup_chart_type(type, cg->chart_id, RRD_ID_LENGTH_MAX) , "io_full_pressure" , NULL @@ -4384,21 +4828,40 @@ void update_cgroup_charts(int update_every) { , "percentage" , PLUGIN_CGROUPS_NAME , PLUGIN_CGROUPS_MODULE_CGROUPS_NAME - , cgroup_containers_chart_priority + 2450 + , cgroup_containers_chart_priority + 2440 , update_every , RRDSET_TYPE_LINE ); - - rrdset_update_labels(chart = res->full.st, cg->chart_labels); - - res->full.rd10 = rrddim_add(chart, "full 10", NULL, 1, 100, RRD_ALGORITHM_ABSOLUTE); - res->full.rd60 = rrddim_add(chart, "full 60", NULL, 1, 100, RRD_ALGORITHM_ABSOLUTE); - res->full.rd300 = rrddim_add(chart, "full 300", NULL, 1, 100, RRD_ALGORITHM_ABSOLUTE); + rrdset_update_labels(chart = pcs->share_time.st, cg->chart_labels); + pcs->share_time.rd10 = rrddim_add(chart, "full 10", NULL, 1, 100, RRD_ALGORITHM_ABSOLUTE); + pcs->share_time.rd60 = rrddim_add(chart, "full 60", NULL, 1, 100, RRD_ALGORITHM_ABSOLUTE); + pcs->share_time.rd300 = rrddim_add(chart, "full 300", NULL, 1, 100, RRD_ALGORITHM_ABSOLUTE); } else { - rrdset_next(res->full.st); + rrdset_next(pcs->share_time.st); } - - update_pressure_chart(&res->full); + if (unlikely(!pcs->total_time.st)) { + RRDSET *chart; + snprintfz(title, CHART_TITLE_MAX, "I/O full pressure stall time"); + chart = pcs->total_time.st = rrdset_create_localhost( + cgroup_chart_type(type, cg->chart_id, RRD_ID_LENGTH_MAX) + , "io_full_pressure_stall_time" + , NULL + , "disk" + , "cgroup.io_full_pressure_stall_time" + , title + , "ms" + , PLUGIN_CGROUPS_NAME + , PLUGIN_CGROUPS_MODULE_CGROUPS_NAME + , cgroup_containers_chart_priority + 2460 + , update_every + , RRDSET_TYPE_LINE + ); + rrdset_update_labels(chart = pcs->total_time.st, cg->chart_labels); + pcs->total_time.rdtotal = rrddim_add(chart, "time", NULL, 1, 1, RRD_ALGORITHM_INCREMENTAL); + } else { + rrdset_next(pcs->total_time.st); + } + update_pressure_charts(pcs); } } } @@ -4417,6 +4880,8 @@ void update_cgroup_charts(int update_every) { // cgroups main static void cgroup_main_cleanup(void *ptr) { + worker_unregister(); + struct netdata_static_thread *static_thread = (struct netdata_static_thread *)ptr; static_thread->enabled = NETDATA_MAIN_THREAD_EXITING; @@ -4455,18 +4920,21 @@ static void cgroup_main_cleanup(void *ptr) { } void *cgroups_main(void *ptr) { - netdata_thread_cleanup_push(cgroup_main_cleanup, ptr); + worker_register("CGROUPS"); + worker_register_job_name(WORKER_CGROUPS_LOCK, "lock"); + worker_register_job_name(WORKER_CGROUPS_READ, "read"); + worker_register_job_name(WORKER_CGROUPS_CHART, "chart"); - struct rusage thread; + netdata_thread_cleanup_push(cgroup_main_cleanup, ptr); - // when ZERO, attempt to do it - int vdo_cpu_netdata = config_get_boolean("plugin:cgroups", "cgroups plugin resource charts", 1); + if (getenv("KUBERNETES_SERVICE_HOST") != NULL && getenv("KUBERNETES_SERVICE_PORT") != NULL) { + is_inside_k8s = 1; + cgroup_enable_cpuacct_cpu_shares = CONFIG_BOOLEAN_YES; + } read_cgroup_plugin_configuration(); netdata_cgroup_ebpf_initialize_shm(); - RRDSET *stcpu_thread = NULL; - if (uv_mutex_init(&cgroup_root_mutex)) { error("CGROUP: cannot initialize mutex for the main cgroup list"); goto exit; @@ -4498,57 +4966,34 @@ void *cgroups_main(void *ptr) { usec_t find_every = cgroup_check_for_new_every * USEC_PER_SEC, find_dt = 0; while(!netdata_exit) { + worker_is_idle(); + usec_t hb_dt = heartbeat_next(&hb, step); if(unlikely(netdata_exit)) break; find_dt += hb_dt; - if(unlikely(find_dt >= find_every || cgroups_check)) { + if (unlikely(find_dt >= find_every || (!is_inside_k8s && cgroups_check))) { uv_cond_signal(&discovery_thread.cond_var); discovery_thread.start_discovery = 1; find_dt = 0; cgroups_check = 0; } + worker_is_busy(WORKER_CGROUPS_LOCK); uv_mutex_lock(&cgroup_root_mutex); - read_all_cgroups(cgroup_root); - update_cgroup_charts(cgroup_update_every); - uv_mutex_unlock(&cgroup_root_mutex); - - // -------------------------------------------------------------------- - if(vdo_cpu_netdata) { - getrusage(RUSAGE_THREAD, &thread); + worker_is_busy(WORKER_CGROUPS_READ); + read_all_discovered_cgroups(cgroup_root); - if(unlikely(!stcpu_thread)) { - - stcpu_thread = rrdset_create_localhost( - "netdata" - , "plugin_cgroups_cpu" - , NULL - , "cgroups" - , NULL - , "Netdata CGroups Plugin CPU usage" - , "milliseconds/s" - , PLUGIN_CGROUPS_NAME - , "stats" - , 132000 - , cgroup_update_every - , RRDSET_TYPE_STACKED - ); - - rrddim_add(stcpu_thread, "user", NULL, 1, 1000, RRD_ALGORITHM_INCREMENTAL); - rrddim_add(stcpu_thread, "system", NULL, 1, 1000, RRD_ALGORITHM_INCREMENTAL); - } - else - rrdset_next(stcpu_thread); + worker_is_busy(WORKER_CGROUPS_CHART); + update_cgroup_charts(cgroup_update_every); - rrddim_set(stcpu_thread, "user" , thread.ru_utime.tv_sec * 1000000ULL + thread.ru_utime.tv_usec); - rrddim_set(stcpu_thread, "system", thread.ru_stime.tv_sec * 1000000ULL + thread.ru_stime.tv_usec); - rrdset_done(stcpu_thread); - } + worker_is_idle(); + uv_mutex_unlock(&cgroup_root_mutex); } exit: + worker_unregister(); netdata_thread_cleanup_pop(1); return NULL; } diff --git a/collectors/cgroups.plugin/sys_fs_cgroup.h b/collectors/cgroups.plugin/sys_fs_cgroup.h index 85968a4da..8301ec26a 100644 --- a/collectors/cgroups.plugin/sys_fs_cgroup.h +++ b/collectors/cgroups.plugin/sys_fs_cgroup.h @@ -39,6 +39,6 @@ typedef struct netdata_ebpf_cgroup_shm { #include "../proc.plugin/plugin_proc.h" -extern char *parse_k8s_data(struct label **labels, char *data); +extern char *k8s_parse_resolved_name(struct label **labels, char *data); #endif //NETDATA_SYS_FS_CGROUP_H diff --git a/collectors/cgroups.plugin/tests/test_cgroups_plugin.c b/collectors/cgroups.plugin/tests/test_cgroups_plugin.c index be8ea2c48..057ac9280 100644 --- a/collectors/cgroups.plugin/tests/test_cgroups_plugin.c +++ b/collectors/cgroups.plugin/tests/test_cgroups_plugin.c @@ -8,7 +8,7 @@ int netdata_zero_metrics_enabled = 1; struct config netdata_config; char *netdata_configured_primary_plugins_dir = NULL; -static void test_parse_k8s_data(void **state) +static void test_k8s_parse_resolved_name(void **state) { UNUSED(state); @@ -89,7 +89,7 @@ static void test_parse_k8s_data(void **state) expect_value(__wrap_add_label_to_list, label_source, LABEL_SOURCE_KUBERNETES); } - char *name = parse_k8s_data(&labels, data); + char *name = k8s_parse_resolved_name(&labels, data); assert_string_equal(name, test_data[i].name); assert_ptr_equal(labels, 0xff); @@ -101,10 +101,10 @@ static void test_parse_k8s_data(void **state) int main(void) { const struct CMUnitTest tests[] = { - cmocka_unit_test(test_parse_k8s_data), + cmocka_unit_test(test_k8s_parse_resolved_name), }; - int test_res = cmocka_run_group_tests_name("test_parse_k8s_data", tests, NULL, NULL); + int test_res = cmocka_run_group_tests_name("test_k8s_parse_resolved_name", tests, NULL, NULL); return test_res; } diff --git a/collectors/cgroups.plugin/tests/test_doubles.c b/collectors/cgroups.plugin/tests/test_doubles.c index 5572fb2f5..9cefa6c98 100644 --- a/collectors/cgroups.plugin/tests/test_doubles.c +++ b/collectors/cgroups.plugin/tests/test_doubles.c @@ -142,9 +142,9 @@ void rrdset_done(RRDSET *st) UNUSED(st); } -void update_pressure_chart(struct pressure_chart *chart) +void update_pressure_charts(struct pressure_charts *charts) { - UNUSED(chart); + UNUSED(charts); } void netdev_rename_device_add( diff --git a/collectors/charts.d.plugin/apcupsd/apcupsd.chart.sh b/collectors/charts.d.plugin/apcupsd/apcupsd.chart.sh index b4edc0caf..ef9a90596 100644 --- a/collectors/charts.d.plugin/apcupsd/apcupsd.chart.sh +++ b/collectors/charts.d.plugin/apcupsd/apcupsd.chart.sh @@ -74,41 +74,42 @@ apcupsd_check() { } apcupsd_create() { - local host src + local host for host in "${!apcupsd_sources[@]}"; do - src=${apcupsd_sources[${host}]} - # create the charts cat << EOF -CHART apcupsd_${host}.charge '' "UPS Charge for ${host} on ${src}" "percentage" ups apcupsd.charge area $((apcupsd_priority + 1)) $apcupsd_update_every '' '' 'apcupsd' +CHART apcupsd_${host}.charge '' "UPS Charge" "percentage" ups apcupsd.charge area $((apcupsd_priority + 2)) $apcupsd_update_every '' '' 'apcupsd' DIMENSION battery_charge charge absolute 1 100 -CHART apcupsd_${host}.battery_voltage '' "UPS Battery Voltage for ${host} on ${src}" "Volts" ups apcupsd.battery.voltage line $((apcupsd_priority + 3)) $apcupsd_update_every '' '' 'apcupsd' +CHART apcupsd_${host}.battery_voltage '' "UPS Battery Voltage" "Volts" ups apcupsd.battery.voltage line $((apcupsd_priority + 4)) $apcupsd_update_every '' '' 'apcupsd' DIMENSION battery_voltage voltage absolute 1 100 DIMENSION battery_voltage_nominal nominal absolute 1 100 -CHART apcupsd_${host}.input_voltage '' "UPS Input Voltage for ${host} on ${src}" "Volts" input apcupsd.input.voltage line $((apcupsd_priority + 4)) $apcupsd_update_every '' '' 'apcupsd' +CHART apcupsd_${host}.input_voltage '' "UPS Input Voltage" "Volts" input apcupsd.input.voltage line $((apcupsd_priority + 5)) $apcupsd_update_every '' '' 'apcupsd' DIMENSION input_voltage voltage absolute 1 100 DIMENSION input_voltage_min min absolute 1 100 DIMENSION input_voltage_max max absolute 1 100 -CHART apcupsd_${host}.input_frequency '' "UPS Input Frequency for ${host} on ${src}" "Hz" input apcupsd.input.frequency line $((apcupsd_priority + 5)) $apcupsd_update_every '' '' 'apcupsd' +CHART apcupsd_${host}.input_frequency '' "UPS Input Frequency" "Hz" input apcupsd.input.frequency line $((apcupsd_priority + 6)) $apcupsd_update_every '' '' 'apcupsd' DIMENSION input_frequency frequency absolute 1 100 -CHART apcupsd_${host}.output_voltage '' "UPS Output Voltage for ${host} on ${src}" "Volts" output apcupsd.output.voltage line $((apcupsd_priority + 6)) $apcupsd_update_every '' '' 'apcupsd' +CHART apcupsd_${host}.output_voltage '' "UPS Output Voltage" "Volts" output apcupsd.output.voltage line $((apcupsd_priority + 7)) $apcupsd_update_every '' '' 'apcupsd' DIMENSION output_voltage voltage absolute 1 100 DIMENSION output_voltage_nominal nominal absolute 1 100 -CHART apcupsd_${host}.load '' "UPS Load for ${host} on ${src}" "percentage" ups apcupsd.load area $((apcupsd_priority)) $apcupsd_update_every '' '' 'apcupsd' +CHART apcupsd_${host}.load '' "UPS Load" "percentage" ups apcupsd.load area $((apcupsd_priority)) $apcupsd_update_every '' '' 'apcupsd' DIMENSION load load absolute 1 100 -CHART apcupsd_${host}.temp '' "UPS Temperature for ${host} on ${src}" "Celsius" ups apcupsd.temperature line $((apcupsd_priority + 7)) $apcupsd_update_every '' '' 'apcupsd' +CHART apcupsd_${host}.load_usage '' "UPS Load Usage" "Watts" ups apcupsd.load_usage area $((apcupsd_priority + 1)) $apcupsd_update_every '' '' 'apcupsd' +DIMENSION load_usage load absolute 1 100 + +CHART apcupsd_${host}.temp '' "UPS Temperature" "Celsius" ups apcupsd.temperature line $((apcupsd_priority + 8)) $apcupsd_update_every '' '' 'apcupsd' DIMENSION temp temp absolute 1 100 -CHART apcupsd_${host}.time '' "UPS Time Remaining for ${host} on ${src}" "Minutes" ups apcupsd.time area $((apcupsd_priority + 2)) $apcupsd_update_every '' '' 'apcupsd' +CHART apcupsd_${host}.time '' "UPS Time Remaining" "Minutes" ups apcupsd.time area $((apcupsd_priority + 3)) $apcupsd_update_every '' '' 'apcupsd' DIMENSION time time absolute 1 100 -CHART apcupsd_${host}.online '' "UPS ONLINE flag for ${host} on ${src}" "boolean" ups apcupsd.online line $((apcupsd_priority + 8)) $apcupsd_update_every '' '' 'apcupsd' +CHART apcupsd_${host}.online '' "UPS ONLINE flag" "boolean" ups apcupsd.online line $((apcupsd_priority + 9)) $apcupsd_update_every '' '' 'apcupsd' DIMENSION online online absolute 0 1 EOF @@ -141,6 +142,8 @@ BEGIN { load = 0; temp = 0; time = 0; + nompower = 0; + load_usage = 0; } /^BCHARGE.*/ { battery_charge = \$3 * 100 }; /^BATTV.*/ { battery_voltage = \$3 * 100 }; @@ -153,9 +156,12 @@ BEGIN { /^NOMOUTV.*/ { output_voltage_nominal = \$3 * 100 }; /^LOADPCT.*/ { load = \$3 * 100 }; /^ITEMP.*/ { temp = \$3 * 100 }; +/^NOMPOWER.*/ { nompower = \$3 }; /^TIMELEFT.*/ { time = \$3 * 100 }; /^STATUS.*/ { online=(\$3 != \"COMMLOST\" && !(\$3 == \"SHUTTING\" && \$4 == \"DOWN\"))?1:0 }; END { + { load_usage = nompower * load / 100 }; + print \"BEGIN apcupsd_${host}.online $1\"; print \"SET online = \" online; print \"END\" @@ -189,6 +195,10 @@ END { print \"SET load = \" load; print \"END\" + print \"BEGIN apcupsd_${host}.load_usage $1\"; + print \"SET load_usage = \" load_usage; + print \"END\" + print \"BEGIN apcupsd_${host}.temp $1\"; print \"SET temp = \" temp; print \"END\" diff --git a/collectors/cups.plugin/cups_plugin.c b/collectors/cups.plugin/cups_plugin.c index cc57dbf1f..f6481a468 100644 --- a/collectors/cups.plugin/cups_plugin.c +++ b/collectors/cups.plugin/cups_plugin.c @@ -137,7 +137,8 @@ getIntegerOption( return ((int)intvalue); } -int reset_job_metrics(void *entry, void *data) { +static int reset_job_metrics(const char *name, void *entry, void *data) { + (void)name; (void)data; struct job_metrics *jm = (struct job_metrics *)entry; @@ -158,7 +159,7 @@ struct job_metrics *get_job_metrics(char *dest) { if (unlikely(!jm)) { struct job_metrics new_job_metrics; - reset_job_metrics(&new_job_metrics, NULL); + reset_job_metrics(NULL, &new_job_metrics, NULL); jm = dictionary_set(dict_dest_job_metrics, dest, &new_job_metrics, sizeof(struct job_metrics)); printf("CHART cups.job_num_%s '' 'Active job number of destination %s' jobs '%s' cups.job_num stacked %i %i\n", dest, dest, dest, netdata_priority++, netdata_update_every); @@ -174,7 +175,7 @@ struct job_metrics *get_job_metrics(char *dest) { return jm; } -int collect_job_metrics(char *name, void *entry, void *data) { +int collect_job_metrics(const char *name, void *entry, void *data) { (void)data; struct job_metrics *jm = (struct job_metrics *)entry; @@ -204,7 +205,7 @@ int collect_job_metrics(char *name, void *entry, void *data) { printf("DIMENSION pending '' absolute 1 1\n"); printf("DIMENSION held '' absolute 1 1\n"); printf("DIMENSION processing '' absolute 1 1\n"); - dictionary_del(dict_dest_job_metrics, name); + dictionary_del_having_write_lock(dict_dest_job_metrics, name); } return 0; @@ -219,11 +220,12 @@ void reset_metrics() { num_dest_printing = 0; num_dest_stopped = 0; - reset_job_metrics(&global_job_metrics, NULL); - dictionary_get_all(dict_dest_job_metrics, reset_job_metrics, NULL); + reset_job_metrics(NULL, &global_job_metrics, NULL); + dictionary_walkthrough_write(dict_dest_job_metrics, reset_job_metrics, NULL); } int main(int argc, char **argv) { + clocks_init(); // ------------------------------------------------------------------------ // initialization of netdata plugin @@ -369,7 +371,7 @@ int main(int argc, char **argv) { } cupsFreeJobs(num_jobs, jobs); - dictionary_get_all_name_value(dict_dest_job_metrics, collect_job_metrics, NULL); + dictionary_walkthrough_write(dict_dest_job_metrics, collect_job_metrics, NULL); static int cups_printer_by_option_created = 0; if (unlikely(!cups_printer_by_option_created)) diff --git a/collectors/diskspace.plugin/plugin_diskspace.c b/collectors/diskspace.plugin/plugin_diskspace.c index b6a52c061..663bb82fc 100644 --- a/collectors/diskspace.plugin/plugin_diskspace.c +++ b/collectors/diskspace.plugin/plugin_diskspace.c @@ -52,7 +52,8 @@ static DICTIONARY *dict_mountpoints = NULL; #define rrdset_obsolete_and_pointer_null(st) do { if(st) { rrdset_is_obsolete(st); (st) = NULL; } } while(st) -int mount_point_cleanup(void *entry, void *data) { +int mount_point_cleanup(const char *name, void *entry, void *data) { + (void)name; (void)data; struct mount_point_metadata *mp = (struct mount_point_metadata *)entry; @@ -365,6 +366,8 @@ static inline void do_disk_space_stats(struct mountinfo *mi, int update_every) { } static void diskspace_main_cleanup(void *ptr) { + worker_unregister(); + struct netdata_static_thread *static_thread = (struct netdata_static_thread *)ptr; static_thread->enabled = NETDATA_MAIN_THREAD_EXITING; @@ -373,10 +376,21 @@ static void diskspace_main_cleanup(void *ptr) { static_thread->enabled = NETDATA_MAIN_THREAD_EXITED; } +#define WORKER_JOB_MOUNTINFO 0 +#define WORKER_JOB_MOUNTPOINT 1 +#define WORKER_JOB_CLEANUP 2 + +#if WORKER_UTILIZATION_MAX_JOB_TYPES < 3 +#error WORKER_UTILIZATION_MAX_JOB_TYPES has to be at least 3 +#endif + void *diskspace_main(void *ptr) { - netdata_thread_cleanup_push(diskspace_main_cleanup, ptr); + worker_register("DISKSPACE"); + worker_register_job_name(WORKER_JOB_MOUNTINFO, "mountinfo"); + worker_register_job_name(WORKER_JOB_MOUNTPOINT, "mountpoint"); + worker_register_job_name(WORKER_JOB_CLEANUP, "cleanup"); - int vdo_cpu_netdata = config_get_boolean("plugin:proc", "netdata server resources", 1); + netdata_thread_cleanup_push(diskspace_main_cleanup, ptr); cleanup_mount_points = config_get_boolean(CONFIG_SECTION_DISKSPACE, "remove charts of unmounted disks" , cleanup_mount_points); @@ -388,14 +402,11 @@ void *diskspace_main(void *ptr) { if(check_for_new_mountpoints_every < update_every) check_for_new_mountpoints_every = update_every; - struct rusage thread; - - usec_t duration = 0; usec_t step = update_every * USEC_PER_SEC; heartbeat_t hb; heartbeat_init(&hb); while(!netdata_exit) { - duration = heartbeat_monotonic_dt_to_now_usec(&hb); + worker_is_idle(); /* usec_t hb_dt = */ heartbeat_next(&hb, step); if(unlikely(netdata_exit)) break; @@ -404,9 +415,9 @@ void *diskspace_main(void *ptr) { // -------------------------------------------------------------------------- // this is smart enough not to reload it every time + worker_is_busy(WORKER_JOB_MOUNTINFO); mountinfo_reload(0); - // -------------------------------------------------------------------------- // disk space metrics @@ -420,80 +431,20 @@ void *diskspace_main(void *ptr) { if(mi->flags & MOUNTINFO_READONLY && !strcmp(mi->root, mi->mount_point)) continue; + worker_is_busy(WORKER_JOB_MOUNTPOINT); do_disk_space_stats(mi, update_every); if(unlikely(netdata_exit)) break; } if(unlikely(netdata_exit)) break; - if(dict_mountpoints) - dictionary_get_all(dict_mountpoints, mount_point_cleanup, NULL); - - if(vdo_cpu_netdata) { - static RRDSET *stcpu_thread = NULL, *st_duration = NULL; - static RRDDIM *rd_user = NULL, *rd_system = NULL, *rd_duration = NULL; - - // ---------------------------------------------------------------- - - getrusage(RUSAGE_THREAD, &thread); - - if(unlikely(!stcpu_thread)) { - stcpu_thread = rrdset_create_localhost( - "netdata" - , "plugin_diskspace" - , NULL - , "diskspace" - , NULL - , "Netdata Disk Space Plugin CPU usage" - , "milliseconds/s" - , PLUGIN_DISKSPACE_NAME - , NULL - , NETDATA_CHART_PRIO_NETDATA_DISKSPACE - , update_every - , RRDSET_TYPE_STACKED - ); - - rd_user = rrddim_add(stcpu_thread, "user", NULL, 1, 1000, RRD_ALGORITHM_INCREMENTAL); - rd_system = rrddim_add(stcpu_thread, "system", NULL, 1, 1000, RRD_ALGORITHM_INCREMENTAL); - } - else - rrdset_next(stcpu_thread); - - rrddim_set_by_pointer(stcpu_thread, rd_user, thread.ru_utime.tv_sec * 1000000ULL + thread.ru_utime.tv_usec); - rrddim_set_by_pointer(stcpu_thread, rd_system, thread.ru_stime.tv_sec * 1000000ULL + thread.ru_stime.tv_usec); - rrdset_done(stcpu_thread); - - // ---------------------------------------------------------------- - - if(unlikely(!st_duration)) { - st_duration = rrdset_create_localhost( - "netdata" - , "plugin_diskspace_dt" - , NULL - , "diskspace" - , NULL - , "Netdata Disk Space Plugin Duration" - , "milliseconds/run" - , PLUGIN_DISKSPACE_NAME - , NULL - , 132021 - , update_every - , RRDSET_TYPE_AREA - ); - - rd_duration = rrddim_add(st_duration, "duration", NULL, 1, 1000, RRD_ALGORITHM_ABSOLUTE); - } - else - rrdset_next(st_duration); - - rrddim_set_by_pointer(st_duration, rd_duration, duration); - rrdset_done(st_duration); - - // ---------------------------------------------------------------- - - if(unlikely(netdata_exit)) break; + if(dict_mountpoints) { + worker_is_busy(WORKER_JOB_CLEANUP); + dictionary_walkthrough_read(dict_mountpoints, mount_point_cleanup, NULL); } + } + worker_unregister(); netdata_thread_cleanup_pop(1); return NULL; diff --git a/collectors/ebpf.plugin/README.md b/collectors/ebpf.plugin/README.md index c32133b1c..dc406b7f8 100644 --- a/collectors/ebpf.plugin/README.md +++ b/collectors/ebpf.plugin/README.md @@ -29,7 +29,7 @@ Netdata uses the following features from the Linux kernel to run eBPF programs: - Tracepoints are hooks to call specific functions. Tracepoints are more stable than `kprobes` and are preferred when both options are available. - Trampolines are bridges between kernel functions, and BPF programs. Netdata uses them by default whenever available. -- Kprobes and return probes (`kretprobe`): Probes can insert virtually into any kernel instruction. When eBPF runs in `entry` mode, it attaches only `kprobes` for internal functions monitoring calls and some arguments every time a function is called. The user can also change configuration to use [`return`](#global) mode, and this will allow users to monitor return from these functions and detect possible failures. +- Kprobes and return probes (`kretprobe`): Probes can insert virtually into any kernel instruction. When eBPF runs in `entry` mode, it attaches only `kprobes` for internal functions monitoring calls and some arguments every time a function is called. The user can also change configuration to use [`return`](#global-configuration-options) mode, and this will allow users to monitor return from these functions and detect possible failures. In each case, wherever a normal kprobe, kretprobe, or tracepoint would have run its hook function, an eBPF program is run instead, performing various collection logic before letting the kernel continue its normal control flow. @@ -137,7 +137,7 @@ _enable_ the integration with `cgroups.plugin`, change the `cgroups` setting to If you do not need to monitor specific metrics for your `cgroups`, you can enable `cgroups` inside `ebpf.d.conf`, and then disable the plugin for a specific `thread` by following the steps in the -[Configuration](#configuration) section. +[Configuration](#configuring-ebpfplugin) section. #### Integration Dashboard Elements @@ -419,7 +419,7 @@ collected in the previous and current seconds. ### System overview Not all charts within the System Overview menu are enabled by default. Charts that rely on `kprobes` are disabled by default because they add around 100ns overhead for each function call. This is a small number from a human's perspective, but the functions are called many times and create an impact -on host. See the [configuration](#configuration) section for details about how to enable them. +on host. See the [configuration](#configuring-ebpfplugin) section for details about how to enable them. #### Processes @@ -863,7 +863,7 @@ eBPF monitoring is complex and produces a large volume of metrics. We've discove significantly increases kernel memory usage by several hundred MB. If your node is experiencing high memory usage and there is no obvious culprit to be found in the `apps.mem` chart, -consider testing for high kernel memory usage by [disabling eBPF monitoring](#configuration). Next, +consider testing for high kernel memory usage by [disabling eBPF monitoring](#configuring-ebpfplugin). Next, [restart Netdata](/docs/configure/start-stop-restart.md) with `sudo systemctl restart netdata` to see if system memory usage (see the `system.ram` chart) has dropped significantly. diff --git a/collectors/ebpf.plugin/ebpf.c b/collectors/ebpf.plugin/ebpf.c index b93c2dfd7..2b25f50a3 100644 --- a/collectors/ebpf.plugin/ebpf.c +++ b/collectors/ebpf.plugin/ebpf.c @@ -60,7 +60,7 @@ ebpf_module_t ebpf_modules[] = { .config_file = NETDATA_CACHESTAT_CONFIG_FILE, .kernels = NETDATA_V3_10 | NETDATA_V4_14 | NETDATA_V4_16 | NETDATA_V4_18| NETDATA_V5_4 | NETDATA_V5_15 | NETDATA_V5_16, - .load = EBPF_LOAD_LEGACY, .targets = NULL}, + .load = EBPF_LOAD_LEGACY, .targets = cachestat_targets}, { .thread_name = "sync", .config_name = "sync", .enabled = 0, .start_routine = ebpf_sync_thread, .update_every = EBPF_DEFAULT_UPDATE_EVERY, .global_charts = 1, .apps_charts = CONFIG_BOOLEAN_NO, .cgroup_charts = CONFIG_BOOLEAN_NO, .mode = MODE_ENTRY, .optional = 0, .apps_routine = NULL, .maps = NULL, @@ -76,7 +76,7 @@ ebpf_module_t ebpf_modules[] = { .pid_map_size = ND_EBPF_DEFAULT_PID_SIZE, .names = NULL, .cfg = &dcstat_config, .config_file = NETDATA_DIRECTORY_DCSTAT_CONFIG_FILE, .kernels = NETDATA_V3_10 | NETDATA_V4_14 | NETDATA_V4_16 | NETDATA_V4_18 | NETDATA_V5_4, - .load = EBPF_LOAD_LEGACY, .targets = NULL}, + .load = EBPF_LOAD_LEGACY, .targets = dc_targets}, { .thread_name = "swap", .config_name = "swap", .enabled = 0, .start_routine = ebpf_swap_thread, .update_every = EBPF_DEFAULT_UPDATE_EVERY, .global_charts = 1, .apps_charts = CONFIG_BOOLEAN_NO, .cgroup_charts = CONFIG_BOOLEAN_NO, .mode = MODE_ENTRY, .optional = 0, @@ -84,7 +84,7 @@ ebpf_module_t ebpf_modules[] = { .pid_map_size = ND_EBPF_DEFAULT_PID_SIZE, .names = NULL, .cfg = &swap_config, .config_file = NETDATA_DIRECTORY_SWAP_CONFIG_FILE, .kernels = NETDATA_V3_10 | NETDATA_V4_14 | NETDATA_V4_16 | NETDATA_V4_18 | NETDATA_V5_4, - .load = EBPF_LOAD_LEGACY, .targets = NULL}, + .load = EBPF_LOAD_LEGACY, .targets = swap_targets}, { .thread_name = "vfs", .config_name = "vfs", .enabled = 0, .start_routine = ebpf_vfs_thread, .update_every = EBPF_DEFAULT_UPDATE_EVERY, .global_charts = 1, .apps_charts = CONFIG_BOOLEAN_NO, .cgroup_charts = CONFIG_BOOLEAN_NO, .mode = MODE_ENTRY, .optional = 0, @@ -1083,10 +1083,32 @@ int ebpf_start_pthread_variables() } /** + * Am I collecting PIDs? + * + * Test if eBPF plugin needs to collect PID information. + * + * @return It returns 1 if at least one thread needs to collect the data, or zero otherwise. + */ +static inline uint32_t ebpf_am_i_collect_pids() +{ + uint32_t ret = 0; + int i; + for (i = 0; ebpf_modules[i].thread_name; i++) { + ret |= ebpf_modules[i].cgroup_charts | ebpf_modules[i].apps_charts; + } + + return ret; +} + +/** * Allocate the vectors used for all threads. */ static void ebpf_allocate_common_vectors() { + if (unlikely(!ebpf_am_i_collect_pids())) { + return; + } + all_pids = callocz((size_t)pid_max, sizeof(struct pid_stat *)); global_process_stat = callocz((size_t)ebpf_nprocs, sizeof(ebpf_process_stat_t)); } @@ -1172,23 +1194,6 @@ static inline void epbf_update_load_mode(char *str) ebpf_set_load_mode(load); } -#ifdef LIBBPF_MAJOR_VERSION -/** - * Set default btf file - * - * Load the default BTF file on environment. - */ -static void ebpf_set_default_btf_file() -{ - char path[PATH_MAX + 1]; - snprintfz(path, PATH_MAX, "%s/vmlinux", btf_path); - default_btf = ebpf_parse_btf_file(path); - if (!default_btf) - info("Your environment does not have BTF file %s/vmlinux. The plugin will work with 'legacy' code.", - btf_path); -} -#endif - /** * Read collector values * @@ -1210,10 +1215,10 @@ static void read_collector_values(int *disable_apps, int *disable_cgroups, int u how_to_load(value); btf_path = appconfig_get(&collector_config, EBPF_GLOBAL_SECTION, EBPF_CFG_PROGRAM_PATH, - EBPF_DEFAULT_BTF_FILE); + EBPF_DEFAULT_BTF_PATH); #ifdef LIBBPF_MAJOR_VERSION - ebpf_set_default_btf_file(); + default_btf = ebpf_load_btf_file(btf_path, EBPF_DEFAULT_BTF_FILE); #endif value = appconfig_get(&collector_config, EBPF_GLOBAL_SECTION, EBPF_CFG_TYPE_FORMAT, EBPF_CFG_DEFAULT_PROGRAM); @@ -1444,8 +1449,6 @@ void set_global_variables() /** * Load collector config - * - * @param lmode the mode that will be used for them. */ static inline void ebpf_load_thread_config() { @@ -1881,6 +1884,8 @@ static void ebpf_manage_pid(pid_t pid) */ int main(int argc, char **argv) { + clocks_init(); + set_global_variables(); ebpf_parse_args(argc, argv); ebpf_manage_pid(getpid()); diff --git a/collectors/ebpf.plugin/ebpf.d.conf b/collectors/ebpf.plugin/ebpf.d.conf index 0ca9ff0d6..aeba473ed 100644 --- a/collectors/ebpf.plugin/ebpf.d.conf +++ b/collectors/ebpf.plugin/ebpf.d.conf @@ -21,6 +21,7 @@ cgroups = no update every = 5 pid table size = 32768 + btf path = /sys/kernel/btf/ # # eBPF Programs @@ -57,7 +58,7 @@ oomkill = yes process = yes shm = yes - socket = no # Disabled while we are fixing race condition + socket = yes softirq = yes sync = yes swap = no diff --git a/collectors/ebpf.plugin/ebpf.d/cachestat.conf b/collectors/ebpf.plugin/ebpf.d/cachestat.conf index 41205930a..e2418394e 100644 --- a/collectors/ebpf.plugin/ebpf.d/cachestat.conf +++ b/collectors/ebpf.plugin/ebpf.d/cachestat.conf @@ -10,10 +10,21 @@ # # The `pid table size` defines the maximum number of PIDs stored inside the application hash table. # +# The `ebpf type format` option accepts the following values : +# `auto` : The eBPF collector will investigate hardware and select between the two next options. +# `legacy`: The eBPF collector will load the legacy code. Note: This has a bigger overload. +# `co-re` : The eBPF collector will use latest tracing method. Note: This is not available on all platforms. +# +# The `ebpf co-re tracing` option accepts the following values: +# `trampoline`: This is the default mode used by the eBPF collector, due the small overhead added to host. +# `probe` : This is the same as legacy code. +# # Uncomment lines to define specific options for thread. -#[global] +[global] # ebpf load mode = entry # apps = yes # cgroups = no # update every = 10 # pid table size = 32768 + ebpf type format = auto + ebpf co-re tracing = trampoline diff --git a/collectors/ebpf.plugin/ebpf.d/dcstat.conf b/collectors/ebpf.plugin/ebpf.d/dcstat.conf index a65e0acbc..3986ae4f8 100644 --- a/collectors/ebpf.plugin/ebpf.d/dcstat.conf +++ b/collectors/ebpf.plugin/ebpf.d/dcstat.conf @@ -8,10 +8,21 @@ # If you want to disable the integration with `apps.plugin` or `cgroups.plugin` along with the above charts, change # the setting `apps` and `cgroups` to 'no'. # +# The `ebpf type format` option accepts the following values : +# `auto` : The eBPF collector will investigate hardware and select between the two next options. +# `legacy`: The eBPF collector will load the legacy code. Note: This has a bigger overload. +# `co-re` : The eBPF collector will use latest tracing method. Note: This is not available on all platforms. +# +# The `ebpf co-re tracing` option accepts the following values: +# `trampoline`: This is the default mode used by the eBPF collector, due the small overhead added to host. +# `probe` : This is the same as legacy code. +# # Uncomment lines to define specific options for thread. -#[global] +[global] # ebpf load mode = entry # apps = yes # cgroups = no # update every = 10 # pid table size = 32768 + ebpf type format = auto + ebpf co-re tracing = trampoline diff --git a/collectors/ebpf.plugin/ebpf.d/swap.conf b/collectors/ebpf.plugin/ebpf.d/swap.conf index a65e0acbc..3986ae4f8 100644 --- a/collectors/ebpf.plugin/ebpf.d/swap.conf +++ b/collectors/ebpf.plugin/ebpf.d/swap.conf @@ -8,10 +8,21 @@ # If you want to disable the integration with `apps.plugin` or `cgroups.plugin` along with the above charts, change # the setting `apps` and `cgroups` to 'no'. # +# The `ebpf type format` option accepts the following values : +# `auto` : The eBPF collector will investigate hardware and select between the two next options. +# `legacy`: The eBPF collector will load the legacy code. Note: This has a bigger overload. +# `co-re` : The eBPF collector will use latest tracing method. Note: This is not available on all platforms. +# +# The `ebpf co-re tracing` option accepts the following values: +# `trampoline`: This is the default mode used by the eBPF collector, due the small overhead added to host. +# `probe` : This is the same as legacy code. +# # Uncomment lines to define specific options for thread. -#[global] +[global] # ebpf load mode = entry # apps = yes # cgroups = no # update every = 10 # pid table size = 32768 + ebpf type format = auto + ebpf co-re tracing = trampoline diff --git a/collectors/ebpf.plugin/ebpf_apps.c b/collectors/ebpf.plugin/ebpf_apps.c index abc112642..2c65db8d1 100644 --- a/collectors/ebpf.plugin/ebpf_apps.c +++ b/collectors/ebpf.plugin/ebpf_apps.c @@ -1091,6 +1091,9 @@ static inline void aggregate_pid_on_target(struct target *w, struct pid_stat *p, */ void collect_data_for_all_processes(int tbl_pid_stats_fd) { + if (unlikely(!all_pids)) + return; + struct pid_stat *pids = root_of_pids; // global list of all processes running while (pids) { if (pids->updated_twice) { diff --git a/collectors/ebpf.plugin/ebpf_cachestat.c b/collectors/ebpf.plugin/ebpf_cachestat.c index ed4c14288..b565f635f 100644 --- a/collectors/ebpf.plugin/ebpf_cachestat.c +++ b/collectors/ebpf.plugin/ebpf_cachestat.c @@ -45,6 +45,248 @@ struct config cachestat_config = { .first_section = NULL, .index = { .avl_tree = { .root = NULL, .compar = appconfig_section_compare }, .rwlock = AVL_LOCK_INITIALIZER } }; +netdata_ebpf_targets_t cachestat_targets[] = { {.name = "add_to_page_cache_lru", .mode = EBPF_LOAD_TRAMPOLINE}, + {.name = "mark_page_accessed", .mode = EBPF_LOAD_TRAMPOLINE}, + {.name = NULL, .mode = EBPF_LOAD_TRAMPOLINE}, + {.name = "mark_buffer_dirty", .mode = EBPF_LOAD_TRAMPOLINE}, + {.name = NULL, .mode = EBPF_LOAD_TRAMPOLINE}}; + +#ifdef LIBBPF_MAJOR_VERSION +#include "includes/cachestat.skel.h" // BTF code + +static struct cachestat_bpf *bpf_obj = NULL; + +/** + * Disable probe + * + * Disable all probes to use exclusively another method. + * + * @param obj is the main structure for bpf objects + */ +static void ebpf_cachestat_disable_probe(struct cachestat_bpf *obj) +{ + bpf_program__set_autoload(obj->progs.netdata_add_to_page_cache_lru_kprobe, false); + bpf_program__set_autoload(obj->progs.netdata_mark_page_accessed_kprobe, false); + bpf_program__set_autoload(obj->progs.netdata_folio_mark_dirty_kprobe, false); + bpf_program__set_autoload(obj->progs.netdata_set_page_dirty_kprobe, false); + bpf_program__set_autoload(obj->progs.netdata_account_page_dirtied_kprobe, false); + bpf_program__set_autoload(obj->progs.netdata_mark_buffer_dirty_kprobe, false); +} + +/* + * Disable specific probe + * + * Disable probes according the kernel version + * + * @param obj is the main structure for bpf objects + */ +static void ebpf_cachestat_disable_specific_probe(struct cachestat_bpf *obj) +{ + if (running_on_kernel >= NETDATA_EBPF_KERNEL_5_16) { + bpf_program__set_autoload(obj->progs.netdata_account_page_dirtied_kprobe, false); + bpf_program__set_autoload(obj->progs.netdata_set_page_dirty_kprobe, false); + } else if (running_on_kernel >= NETDATA_EBPF_KERNEL_5_15) { + bpf_program__set_autoload(obj->progs.netdata_folio_mark_dirty_kprobe, false); + bpf_program__set_autoload(obj->progs.netdata_account_page_dirtied_kprobe, false); + } else { + bpf_program__set_autoload(obj->progs.netdata_folio_mark_dirty_kprobe, false); + bpf_program__set_autoload(obj->progs.netdata_set_page_dirty_kprobe, false); + } +} + +/* + * Disable trampoline + * + * Disable all trampoline to use exclusively another method. + * + * @param obj is the main structure for bpf objects. + */ +static void ebpf_cachestat_disable_trampoline(struct cachestat_bpf *obj) +{ + bpf_program__set_autoload(obj->progs.netdata_add_to_page_cache_lru_fentry, false); + bpf_program__set_autoload(obj->progs.netdata_mark_page_accessed_fentry, false); + bpf_program__set_autoload(obj->progs.netdata_folio_mark_dirty_fentry, false); + bpf_program__set_autoload(obj->progs.netdata_set_page_dirty_fentry, false); + bpf_program__set_autoload(obj->progs.netdata_account_page_dirtied_fentry, false); + bpf_program__set_autoload(obj->progs.netdata_mark_buffer_dirty_fentry, false); +} + +/* + * Disable specific trampoline + * + * Disable trampoline according to kernel version. + * + * @param obj is the main structure for bpf objects. + */ +static void ebpf_cachestat_disable_specific_trampoline(struct cachestat_bpf *obj) +{ + if (running_on_kernel >= NETDATA_EBPF_KERNEL_5_16) { + bpf_program__set_autoload(obj->progs.netdata_account_page_dirtied_fentry, false); + bpf_program__set_autoload(obj->progs.netdata_set_page_dirty_fentry, false); + } else if (running_on_kernel >= NETDATA_EBPF_KERNEL_5_15) { + bpf_program__set_autoload(obj->progs.netdata_folio_mark_dirty_fentry, false); + bpf_program__set_autoload(obj->progs.netdata_account_page_dirtied_fentry, false); + } else { + bpf_program__set_autoload(obj->progs.netdata_folio_mark_dirty_fentry, false); + bpf_program__set_autoload(obj->progs.netdata_set_page_dirty_fentry, false); + } +} + +/** + * Set trampoline target + * + * Set the targets we will monitor. + * + * @param obj is the main structure for bpf objects. + */ +static inline void netdata_set_trampoline_target(struct cachestat_bpf *obj) +{ + bpf_program__set_attach_target(obj->progs.netdata_add_to_page_cache_lru_fentry, 0, + cachestat_targets[NETDATA_KEY_CALLS_ADD_TO_PAGE_CACHE_LRU].name); + + bpf_program__set_attach_target(obj->progs.netdata_mark_page_accessed_fentry, 0, + cachestat_targets[NETDATA_KEY_CALLS_MARK_PAGE_ACCESSED].name); + + if (running_on_kernel >= NETDATA_EBPF_KERNEL_5_16) { + bpf_program__set_attach_target(obj->progs.netdata_folio_mark_dirty_fentry, 0, + cachestat_targets[NETDATA_KEY_CALLS_ACCOUNT_PAGE_DIRTIED].name); + } else if (running_on_kernel >= NETDATA_EBPF_KERNEL_5_15) { + bpf_program__set_attach_target(obj->progs.netdata_set_page_dirty_fentry, 0, + cachestat_targets[NETDATA_KEY_CALLS_ACCOUNT_PAGE_DIRTIED].name); + } else { + bpf_program__set_attach_target(obj->progs.netdata_account_page_dirtied_fentry, 0, + cachestat_targets[NETDATA_KEY_CALLS_ACCOUNT_PAGE_DIRTIED].name); + } + + bpf_program__set_attach_target(obj->progs.netdata_mark_buffer_dirty_fentry, 0, + cachestat_targets[NETDATA_KEY_CALLS_MARK_BUFFER_DIRTY].name); +} + +/** + * Mount Attach Probe + * + * Attach probes to target + * + * @param obj is the main structure for bpf objects. + * + * @return It returns 0 on success and -1 otherwise. + */ +static int ebpf_cachestat_attach_probe(struct cachestat_bpf *obj) +{ + obj->links.netdata_add_to_page_cache_lru_kprobe = bpf_program__attach_kprobe(obj->progs.netdata_add_to_page_cache_lru_kprobe, + false, + cachestat_targets[NETDATA_KEY_CALLS_ADD_TO_PAGE_CACHE_LRU].name); + int ret = libbpf_get_error(obj->links.netdata_add_to_page_cache_lru_kprobe); + if (ret) + return -1; + + obj->links.netdata_mark_page_accessed_kprobe = bpf_program__attach_kprobe(obj->progs.netdata_mark_page_accessed_kprobe, + false, + cachestat_targets[NETDATA_KEY_CALLS_MARK_PAGE_ACCESSED].name); + ret = libbpf_get_error(obj->links.netdata_mark_page_accessed_kprobe); + if (ret) + return -1; + + if (running_on_kernel >= NETDATA_EBPF_KERNEL_5_16) { + obj->links.netdata_folio_mark_dirty_kprobe = bpf_program__attach_kprobe(obj->progs.netdata_folio_mark_dirty_kprobe, + false, + cachestat_targets[NETDATA_KEY_CALLS_ACCOUNT_PAGE_DIRTIED].name); + ret = libbpf_get_error(obj->links.netdata_folio_mark_dirty_kprobe); + } else if (running_on_kernel >= NETDATA_EBPF_KERNEL_5_15) { + obj->links.netdata_set_page_dirty_kprobe = bpf_program__attach_kprobe(obj->progs.netdata_set_page_dirty_kprobe, + false, + cachestat_targets[NETDATA_KEY_CALLS_ACCOUNT_PAGE_DIRTIED].name); + ret = libbpf_get_error(obj->links.netdata_set_page_dirty_kprobe); + } else { + obj->links.netdata_account_page_dirtied_kprobe = bpf_program__attach_kprobe(obj->progs.netdata_account_page_dirtied_kprobe, + false, + cachestat_targets[NETDATA_KEY_CALLS_ACCOUNT_PAGE_DIRTIED].name); + ret = libbpf_get_error(obj->links.netdata_account_page_dirtied_kprobe); + } + + if (ret) + return -1; + + obj->links.netdata_mark_buffer_dirty_kprobe = bpf_program__attach_kprobe(obj->progs.netdata_mark_buffer_dirty_kprobe, + false, + cachestat_targets[NETDATA_KEY_CALLS_MARK_BUFFER_DIRTY].name); + ret = libbpf_get_error(obj->links.netdata_mark_buffer_dirty_kprobe); + if (ret) + return -1; + + return 0; +} + +/** + * Adjust Map Size + * + * Resize maps according input from users. + * + * @param obj is the main structure for bpf objects. + * @param em structure with configuration + */ +static void ebpf_cachestat_adjust_map_size(struct cachestat_bpf *obj, ebpf_module_t *em) +{ + ebpf_update_map_size(obj->maps.cstat_pid, &cachestat_maps[NETDATA_CACHESTAT_PID_STATS], + em, bpf_map__name(obj->maps.cstat_pid)); +} + +/** + * Set hash tables + * + * Set the values for maps according the value given by kernel. + * + * @param obj is the main structure for bpf objects. + */ +static void ebpf_cachestat_set_hash_tables(struct cachestat_bpf *obj) +{ + cachestat_maps[NETDATA_CACHESTAT_GLOBAL_STATS].map_fd = bpf_map__fd(obj->maps.cstat_global); + cachestat_maps[NETDATA_CACHESTAT_PID_STATS].map_fd = bpf_map__fd(obj->maps.cstat_pid); + cachestat_maps[NETDATA_CACHESTAT_CTRL].map_fd = bpf_map__fd(obj->maps.cstat_ctrl); +} + +/** + * Load and attach + * + * Load and attach the eBPF code in kernel. + * + * @param obj is the main structure for bpf objects. + * @param em structure with configuration + * + * @return it returns 0 on succes and -1 otherwise + */ +static inline int ebpf_cachestat_load_and_attach(struct cachestat_bpf *obj, ebpf_module_t *em) +{ + netdata_ebpf_targets_t *mt = em->targets; + netdata_ebpf_program_loaded_t test = mt[NETDATA_KEY_CALLS_ADD_TO_PAGE_CACHE_LRU].mode; + + if (test == EBPF_LOAD_TRAMPOLINE) { + ebpf_cachestat_disable_probe(obj); + ebpf_cachestat_disable_specific_trampoline(obj); + + netdata_set_trampoline_target(obj); + } else { + ebpf_cachestat_disable_trampoline(obj); + ebpf_cachestat_disable_specific_probe(obj); + } + + int ret = cachestat_bpf__load(obj); + if (ret) { + return ret; + } + + ebpf_cachestat_adjust_map_size(obj, em); + + ret = (test == EBPF_LOAD_TRAMPOLINE) ? cachestat_bpf__attach(obj) : ebpf_cachestat_attach_probe(obj); + if (!ret) { + ebpf_cachestat_set_hash_tables(obj); + + ebpf_update_controller(cachestat_maps[NETDATA_CACHESTAT_CTRL].map_fd, em); + } + + return ret; +} +#endif /***************************************************************** * * FUNCTIONS TO CLOSE THE THREAD @@ -98,6 +340,10 @@ static void ebpf_cachestat_cleanup(void *ptr) } bpf_object__close(objects); } +#ifdef LIBBPF_MAJOR_VERSION + else if (bpf_obj) + cachestat_bpf__destroy(bpf_obj); +#endif } /***************************************************************** @@ -962,6 +1208,54 @@ static void ebpf_cachestat_allocate_global_vectors(int apps) *****************************************************************/ /** + * Update Internal value + * + * Update values used during runtime. + */ +static void ebpf_cachestat_set_internal_value() +{ + static char *account_page[] = { "account_page_dirtied", "__set_page_dirty", "__folio_mark_dirty" }; + if (running_on_kernel >= NETDATA_EBPF_KERNEL_5_16) + cachestat_targets[NETDATA_KEY_CALLS_ACCOUNT_PAGE_DIRTIED].name = account_page[NETDATA_CACHESTAT_FOLIO_DIRTY]; + else if (running_on_kernel >= NETDATA_EBPF_KERNEL_5_15) + cachestat_targets[NETDATA_KEY_CALLS_ACCOUNT_PAGE_DIRTIED].name = account_page[NETDATA_CACHESTAT_SET_PAGE_DIRTY]; + else + cachestat_targets[NETDATA_KEY_CALLS_ACCOUNT_PAGE_DIRTIED].name = account_page[NETDATA_CACHESTAT_ACCOUNT_PAGE_DIRTY]; +} + +/* + * Load BPF + * + * Load BPF files. + * + * @param em the structure with configuration + */ +static int ebpf_cachestat_load_bpf(ebpf_module_t *em) +{ + int ret = 0; + if (em->load == EBPF_LOAD_LEGACY) { + probe_links = ebpf_load_program(ebpf_plugin_dir, em, running_on_kernel, isrh, &objects); + if (!probe_links) { + ret = -1; + } + } +#ifdef LIBBPF_MAJOR_VERSION + else { + bpf_obj = cachestat_bpf__open(); + if (!bpf_obj) + ret = -1; + else + ret = ebpf_cachestat_load_and_attach(bpf_obj, em); + } +#endif + + if (ret) + error("%s %s", EBPF_DEFAULT_ERROR_MSG, em->thread_name); + + return ret; +} + +/** * Cachestat thread * * Thread used to make cachestat thread @@ -982,17 +1276,17 @@ void *ebpf_cachestat_thread(void *ptr) if (!em->enabled) goto endcachestat; - pthread_mutex_lock(&lock); - ebpf_cachestat_allocate_global_vectors(em->apps_charts); + ebpf_cachestat_set_internal_value(); - probe_links = ebpf_load_program(ebpf_plugin_dir, em, running_on_kernel, isrh, &objects); - if (!probe_links) { - pthread_mutex_unlock(&lock); +#ifdef LIBBPF_MAJOR_VERSION + ebpf_adjust_thread_load(em, default_btf); +#endif + if (ebpf_cachestat_load_bpf(em)) { em->enabled = CONFIG_BOOLEAN_NO; goto endcachestat; } - ebpf_update_stats(&plugin_statistics, em); + ebpf_cachestat_allocate_global_vectors(em->apps_charts); int algorithms[NETDATA_CACHESTAT_END] = { NETDATA_EBPF_ABSOLUTE_IDX, NETDATA_EBPF_INCREMENTAL_IDX, NETDATA_EBPF_ABSOLUTE_IDX, NETDATA_EBPF_ABSOLUTE_IDX @@ -1002,8 +1296,9 @@ void *ebpf_cachestat_thread(void *ptr) cachestat_counter_dimension_name, cachestat_counter_dimension_name, algorithms, NETDATA_CACHESTAT_END); + pthread_mutex_lock(&lock); + ebpf_update_stats(&plugin_statistics, em); ebpf_create_memory_charts(em); - pthread_mutex_unlock(&lock); cachestat_collector(em); diff --git a/collectors/ebpf.plugin/ebpf_cachestat.h b/collectors/ebpf.plugin/ebpf_cachestat.h index 8c56d2417..b386e383c 100644 --- a/collectors/ebpf.plugin/ebpf_cachestat.h +++ b/collectors/ebpf.plugin/ebpf_cachestat.h @@ -45,6 +45,12 @@ enum cachestat_counters { NETDATA_CACHESTAT_END }; +enum cachestat_account_dirty_pages { + NETDATA_CACHESTAT_ACCOUNT_PAGE_DIRTY, + NETDATA_CACHESTAT_SET_PAGE_DIRTY, + NETDATA_CACHESTAT_FOLIO_DIRTY +}; + enum cachestat_indexes { NETDATA_CACHESTAT_IDX_RATIO, NETDATA_CACHESTAT_IDX_DIRTY, @@ -54,7 +60,8 @@ enum cachestat_indexes { enum cachestat_tables { NETDATA_CACHESTAT_GLOBAL_STATS, - NETDATA_CACHESTAT_PID_STATS + NETDATA_CACHESTAT_PID_STATS, + NETDATA_CACHESTAT_CTRL }; typedef struct netdata_publish_cachestat_pid { @@ -78,5 +85,6 @@ extern void *ebpf_cachestat_thread(void *ptr); extern void clean_cachestat_pid_structures(); extern struct config cachestat_config; +extern netdata_ebpf_targets_t cachestat_targets[]; #endif // NETDATA_EBPF_CACHESTAT_H diff --git a/collectors/ebpf.plugin/ebpf_dcstat.c b/collectors/ebpf.plugin/ebpf_dcstat.c index fba87007f..619d8520b 100644 --- a/collectors/ebpf.plugin/ebpf_dcstat.c +++ b/collectors/ebpf.plugin/ebpf_dcstat.c @@ -49,6 +49,179 @@ static ebpf_specify_name_t dc_optional_name[] = { {.program_name = "netdata_look .retprobe = CONFIG_BOOLEAN_NO}, {.program_name = NULL}}; +netdata_ebpf_targets_t dc_targets[] = { {.name = "lookup_fast", .mode = EBPF_LOAD_TRAMPOLINE}, + {.name = "d_lookup", .mode = EBPF_LOAD_TRAMPOLINE}, + {.name = NULL, .mode = EBPF_LOAD_TRAMPOLINE}}; + +#ifdef LIBBPF_MAJOR_VERSION +#include "includes/dc.skel.h" // BTF code + +static struct dc_bpf *bpf_obj = NULL; + +/** + * Disable probe + * + * Disable all probes to use exclusively another method. + * + * @param obj is the main structure for bpf objects + */ +static inline void ebpf_dc_disable_probes(struct dc_bpf *obj) +{ + bpf_program__set_autoload(obj->progs.netdata_lookup_fast_kprobe, false); + bpf_program__set_autoload(obj->progs.netdata_d_lookup_kretprobe, false); +} + +/* + * Disable trampoline + * + * Disable all trampoline to use exclusively another method. + * + * @param obj is the main structure for bpf objects. + */ +static inline void ebpf_dc_disable_trampoline(struct dc_bpf *obj) +{ + bpf_program__set_autoload(obj->progs.netdata_lookup_fast_fentry, false); + bpf_program__set_autoload(obj->progs.netdata_d_lookup_fexit, false); +} + +/** + * Set trampoline target + * + * Set the targets we will monitor. + * + * @param obj is the main structure for bpf objects. + */ +static void ebpf_dc_set_trampoline_target(struct dc_bpf *obj) +{ + bpf_program__set_attach_target(obj->progs.netdata_lookup_fast_fentry, 0, + dc_targets[NETDATA_DC_TARGET_LOOKUP_FAST].name); + + bpf_program__set_attach_target(obj->progs.netdata_d_lookup_fexit, 0, + dc_targets[NETDATA_DC_TARGET_D_LOOKUP].name); +} + +/** + * Mount Attach Probe + * + * Attach probes to target + * + * @param obj is the main structure for bpf objects. + * + * @return It returns 0 on success and -1 otherwise. + */ +static int ebpf_dc_attach_probes(struct dc_bpf *obj) +{ + obj->links.netdata_d_lookup_kretprobe = bpf_program__attach_kprobe(obj->progs.netdata_d_lookup_kretprobe, + true, + dc_targets[NETDATA_DC_TARGET_D_LOOKUP].name); + int ret = libbpf_get_error(obj->links.netdata_d_lookup_kretprobe); + if (ret) + return -1; + + char *lookup_name = (dc_optional_name[NETDATA_DC_TARGET_LOOKUP_FAST].optional) ? + dc_optional_name[NETDATA_DC_TARGET_LOOKUP_FAST].optional : + dc_targets[NETDATA_DC_TARGET_LOOKUP_FAST].name ; + + obj->links.netdata_lookup_fast_kprobe = bpf_program__attach_kprobe(obj->progs.netdata_lookup_fast_kprobe, + false, + lookup_name); + ret = libbpf_get_error(obj->links.netdata_lookup_fast_kprobe); + if (ret) + return -1; + + return 0; +} + +/** + * Adjust Map Size + * + * Resize maps according input from users. + * + * @param obj is the main structure for bpf objects. + * @param em structure with configuration + */ +static void ebpf_dc_adjust_map_size(struct dc_bpf *obj, ebpf_module_t *em) +{ + ebpf_update_map_size(obj->maps.dcstat_pid, &dcstat_maps[NETDATA_DCSTAT_PID_STATS], + em, bpf_map__name(obj->maps.dcstat_pid)); +} + +/** + * Set hash tables + * + * Set the values for maps according the value given by kernel. + * + * @param obj is the main structure for bpf objects. + */ +static void ebpf_dc_set_hash_tables(struct dc_bpf *obj) +{ + dcstat_maps[NETDATA_DCSTAT_GLOBAL_STATS].map_fd = bpf_map__fd(obj->maps.dcstat_global); + dcstat_maps[NETDATA_DCSTAT_PID_STATS].map_fd = bpf_map__fd(obj->maps.dcstat_pid); + dcstat_maps[NETDATA_DCSTAT_CTRL].map_fd = bpf_map__fd(obj->maps.dcstat_ctrl); +} + +/** + * Update Load + * + * For directory cache, some distributions change the function name, and we do not have condition to use + * TRAMPOLINE like other functions. + * + * @param em structure with configuration + * + * @return When then symbols were not modified, it returns TRAMPOLINE, else it returns RETPROBE. + */ +netdata_ebpf_program_loaded_t ebpf_dc_update_load(ebpf_module_t *em) +{ + if (!strcmp(dc_optional_name[NETDATA_DC_TARGET_LOOKUP_FAST].optional, + dc_optional_name[NETDATA_DC_TARGET_LOOKUP_FAST].function_to_attach)) + return EBPF_LOAD_TRAMPOLINE; + + if (em->targets[NETDATA_DC_TARGET_LOOKUP_FAST].mode != EBPF_LOAD_RETPROBE) + info("When your kernel was compiled the symbol %s was modified, instead to use `trampoline`, the plugin will use `probes`.", + dc_optional_name[NETDATA_DC_TARGET_LOOKUP_FAST].function_to_attach); + + return EBPF_LOAD_RETPROBE; +} + +/** + * Load and attach + * + * Load and attach the eBPF code in kernel. + * + * @param obj is the main structure for bpf objects. + * @param em structure with configuration + * + * @return it returns 0 on succes and -1 otherwise + */ +static inline int ebpf_dc_load_and_attach(struct dc_bpf *obj, ebpf_module_t *em) +{ + netdata_ebpf_program_loaded_t test = ebpf_dc_update_load(em); + if (test == EBPF_LOAD_TRAMPOLINE) { + ebpf_dc_disable_probes(obj); + + ebpf_dc_set_trampoline_target(obj); + } else { + ebpf_dc_disable_trampoline(obj); + } + + int ret = dc_bpf__load(obj); + if (ret) { + return ret; + } + + ebpf_dc_adjust_map_size(obj, em); + + ret = (test == EBPF_LOAD_TRAMPOLINE) ? dc_bpf__attach(obj) : ebpf_dc_attach_probes(obj); + if (!ret) { + ebpf_dc_set_hash_tables(obj); + + ebpf_update_controller(dcstat_maps[NETDATA_DCSTAT_CTRL].map_fd, em); + } + + return ret; +} +#endif + /***************************************************************** * * COMMON FUNCTIONS @@ -141,6 +314,10 @@ static void ebpf_dcstat_cleanup(void *ptr) } bpf_object__close(objects); } +#ifdef LIBBPF_MAJOR_VERSION + else if (bpf_obj) + dc_bpf__destroy(bpf_obj); +#endif } /***************************************************************** @@ -937,6 +1114,38 @@ static void ebpf_dcstat_allocate_global_vectors(int apps) * *****************************************************************/ +/* + * Load BPF + * + * Load BPF files. + * + * @param em the structure with configuration + */ +static int ebpf_dcstat_load_bpf(ebpf_module_t *em) +{ + int ret = 0; + if (em->load == EBPF_LOAD_LEGACY) { + probe_links = ebpf_load_program(ebpf_plugin_dir, em, running_on_kernel, isrh, &objects); + if (!probe_links) { + ret = -1; + } + } +#ifdef LIBBPF_MAJOR_VERSION + else { + bpf_obj = dc_bpf__open(); + if (!bpf_obj) + ret = -1; + else + ret = ebpf_dc_load_and_attach(bpf_obj, em); + } +#endif + + if (ret) + error("%s %s", EBPF_DEFAULT_ERROR_MSG, em->thread_name); + + return ret; +} + /** * Directory Cache thread * @@ -960,17 +1169,16 @@ void *ebpf_dcstat_thread(void *ptr) if (!em->enabled) goto enddcstat; - ebpf_dcstat_allocate_global_vectors(em->apps_charts); - - pthread_mutex_lock(&lock); - - probe_links = ebpf_load_program(ebpf_plugin_dir, em, running_on_kernel, isrh, &objects); - if (!probe_links) { - pthread_mutex_unlock(&lock); +#ifdef LIBBPF_MAJOR_VERSION + ebpf_adjust_thread_load(em, default_btf); +#endif + if (ebpf_dcstat_load_bpf(em)) { em->enabled = CONFIG_BOOLEAN_NO; goto enddcstat; } + ebpf_dcstat_allocate_global_vectors(em->apps_charts); + int algorithms[NETDATA_DCSTAT_IDX_END] = { NETDATA_EBPF_ABSOLUTE_IDX, NETDATA_EBPF_ABSOLUTE_IDX, NETDATA_EBPF_ABSOLUTE_IDX, NETDATA_EBPF_ABSOLUTE_IDX @@ -980,9 +1188,9 @@ void *ebpf_dcstat_thread(void *ptr) dcstat_counter_dimension_name, dcstat_counter_dimension_name, algorithms, NETDATA_DCSTAT_IDX_END); + pthread_mutex_lock(&lock); ebpf_create_filesystem_charts(em->update_every); ebpf_update_stats(&plugin_statistics, em); - pthread_mutex_unlock(&lock); dcstat_collector(em); diff --git a/collectors/ebpf.plugin/ebpf_dcstat.h b/collectors/ebpf.plugin/ebpf_dcstat.h index c5e6e2bcf..940864737 100644 --- a/collectors/ebpf.plugin/ebpf_dcstat.h +++ b/collectors/ebpf.plugin/ebpf_dcstat.h @@ -42,7 +42,8 @@ enum directory_cache_indexes { enum directory_cache_tables { NETDATA_DCSTAT_GLOBAL_STATS, - NETDATA_DCSTAT_PID_STATS + NETDATA_DCSTAT_PID_STATS, + NETDATA_DCSTAT_CTRL }; // variables @@ -55,6 +56,11 @@ enum directory_cache_counters { NETDATA_DIRECTORY_CACHE_END }; +enum directory_cache_targets { + NETDATA_DC_TARGET_LOOKUP_FAST, + NETDATA_DC_TARGET_D_LOOKUP +}; + typedef struct netdata_publish_dcstat_pid { uint64_t cache_access; uint64_t file_system; @@ -73,5 +79,6 @@ extern void *ebpf_dcstat_thread(void *ptr); extern void ebpf_dcstat_create_apps_charts(struct ebpf_module *em, void *ptr); extern void clean_dcstat_pid_structures(); extern struct config dcstat_config; +extern netdata_ebpf_targets_t dc_targets[]; #endif // NETDATA_EBPF_DCSTAT_H diff --git a/collectors/ebpf.plugin/ebpf_oomkill.c b/collectors/ebpf.plugin/ebpf_oomkill.c index f38801875..463a32904 100644 --- a/collectors/ebpf.plugin/ebpf_oomkill.c +++ b/collectors/ebpf.plugin/ebpf_oomkill.c @@ -377,6 +377,15 @@ void *ebpf_oomkill_thread(void *ptr) ebpf_module_t *em = (ebpf_module_t *)ptr; em->maps = oomkill_maps; + if (unlikely(!all_pids || !em->apps_charts)) { + // When we are not running integration with apps, we won't fill necessary variables for this thread to run, so + // we need to disable it. + if (em->enabled) + info("Disabling OOMKILL thread, because apps integration is completely disabled."); + + em->enabled = 0; + } + if (!em->enabled) { goto endoomkill; } diff --git a/collectors/ebpf.plugin/ebpf_process.c b/collectors/ebpf.plugin/ebpf_process.c index d61bdf66c..f894f0707 100644 --- a/collectors/ebpf.plugin/ebpf_process.c +++ b/collectors/ebpf.plugin/ebpf_process.c @@ -579,6 +579,9 @@ void ebpf_process_create_apps_charts(struct ebpf_module *em, void *ptr) */ static void ebpf_create_apps_charts(struct target *root) { + if (unlikely(!all_pids)) + return; + struct target *w; int newly_added = 0; diff --git a/collectors/ebpf.plugin/ebpf_socket.c b/collectors/ebpf.plugin/ebpf_socket.c index da42f0a49..7b2d4a5bf 100644 --- a/collectors/ebpf.plugin/ebpf_socket.c +++ b/collectors/ebpf.plugin/ebpf_socket.c @@ -3965,7 +3965,9 @@ void *ebpf_socket_thread(void *ptr) int algorithms[NETDATA_MAX_SOCKET_VECTOR] = { NETDATA_EBPF_ABSOLUTE_IDX, NETDATA_EBPF_ABSOLUTE_IDX, NETDATA_EBPF_ABSOLUTE_IDX, - NETDATA_EBPF_ABSOLUTE_IDX, NETDATA_EBPF_ABSOLUTE_IDX, NETDATA_EBPF_ABSOLUTE_IDX + NETDATA_EBPF_ABSOLUTE_IDX, NETDATA_EBPF_ABSOLUTE_IDX, NETDATA_EBPF_ABSOLUTE_IDX, + NETDATA_EBPF_ABSOLUTE_IDX, NETDATA_EBPF_ABSOLUTE_IDX, NETDATA_EBPF_INCREMENTAL_IDX, + NETDATA_EBPF_INCREMENTAL_IDX }; ebpf_global_labels( socket_aggregated_data, socket_publish_aggregated, socket_dimension_names, socket_id_names, diff --git a/collectors/ebpf.plugin/ebpf_swap.c b/collectors/ebpf.plugin/ebpf_swap.c index 906c83da5..7d8423358 100644 --- a/collectors/ebpf.plugin/ebpf_swap.c +++ b/collectors/ebpf.plugin/ebpf_swap.c @@ -41,6 +41,154 @@ static struct bpf_object *objects = NULL; struct netdata_static_thread swap_threads = {"SWAP KERNEL", NULL, NULL, 1, NULL, NULL, NULL}; +netdata_ebpf_targets_t swap_targets[] = { {.name = "swap_readpage", .mode = EBPF_LOAD_TRAMPOLINE}, + {.name = "swap_writepage", .mode = EBPF_LOAD_TRAMPOLINE}, + {.name = NULL, .mode = EBPF_LOAD_TRAMPOLINE}}; + +#ifdef LIBBPF_MAJOR_VERSION +#include "includes/swap.skel.h" // BTF code + +static struct swap_bpf *bpf_obj = NULL; + +/** + * Disable probe + * + * Disable all probes to use exclusively another method. + * + * @param obj is the main structure for bpf objects + */ +static void ebpf_swap_disable_probe(struct swap_bpf *obj) +{ + bpf_program__set_autoload(obj->progs.netdata_swap_readpage_probe, false); + bpf_program__set_autoload(obj->progs.netdata_swap_writepage_probe, false); +} + +/* + * Disable trampoline + * + * Disable all trampoline to use exclusively another method. + * + * @param obj is the main structure for bpf objects. + */ +static void ebpf_swap_disable_trampoline(struct swap_bpf *obj) +{ + bpf_program__set_autoload(obj->progs.netdata_swap_readpage_fentry, false); + bpf_program__set_autoload(obj->progs.netdata_swap_writepage_fentry, false); +} + +/** + * Set trampoline target + * + * Set the targets we will monitor. + * + * @param obj is the main structure for bpf objects. + */ +static void ebpf_swap_set_trampoline_target(struct swap_bpf *obj) +{ + bpf_program__set_attach_target(obj->progs.netdata_swap_readpage_fentry, 0, + swap_targets[NETDATA_KEY_SWAP_READPAGE_CALL].name); + + bpf_program__set_attach_target(obj->progs.netdata_swap_writepage_fentry, 0, + swap_targets[NETDATA_KEY_SWAP_WRITEPAGE_CALL].name); +} + +/** + * Mount Attach Probe + * + * Attach probes to target + * + * @param obj is the main structure for bpf objects. + * + * @return It returns 0 on success and -1 otherwise. + */ +static int ebpf_swap_attach_kprobe(struct swap_bpf *obj) +{ + obj->links.netdata_swap_readpage_probe = bpf_program__attach_kprobe(obj->progs.netdata_swap_readpage_probe, + false, + swap_targets[NETDATA_KEY_SWAP_READPAGE_CALL].name); + int ret = libbpf_get_error(obj->links.netdata_swap_readpage_probe); + if (ret) + return -1; + + obj->links.netdata_swap_writepage_probe = bpf_program__attach_kprobe(obj->progs.netdata_swap_writepage_probe, + false, + swap_targets[NETDATA_KEY_SWAP_WRITEPAGE_CALL].name); + ret = libbpf_get_error(obj->links.netdata_swap_writepage_probe); + if (ret) + return -1; + + return 0; +} + +/** + * Set hash tables + * + * Set the values for maps according the value given by kernel. + * + * @param obj is the main structure for bpf objects. + */ +static void ebpf_swap_set_hash_tables(struct swap_bpf *obj) +{ + swap_maps[NETDATA_PID_SWAP_TABLE].map_fd = bpf_map__fd(obj->maps.tbl_pid_swap); + swap_maps[NETDATA_SWAP_CONTROLLER].map_fd = bpf_map__fd(obj->maps.swap_ctrl); + swap_maps[NETDATA_SWAP_GLOBAL_TABLE].map_fd = bpf_map__fd(obj->maps.tbl_swap); +} + +/** + * Adjust Map Size + * + * Resize maps according input from users. + * + * @param obj is the main structure for bpf objects. + * @param em structure with configuration + */ +static void ebpf_swap_adjust_map_size(struct swap_bpf *obj, ebpf_module_t *em) +{ + ebpf_update_map_size(obj->maps.tbl_pid_swap, &swap_maps[NETDATA_PID_SWAP_TABLE], + em, bpf_map__name(obj->maps.tbl_pid_swap)); +} + +/** + * Load and attach + * + * Load and attach the eBPF code in kernel. + * + * @param obj is the main structure for bpf objects. + * @param em structure with configuration + * + * @return it returns 0 on succes and -1 otherwise + */ +static inline int ebpf_swap_load_and_attach(struct swap_bpf *obj, ebpf_module_t *em) +{ + netdata_ebpf_targets_t *mt = em->targets; + netdata_ebpf_program_loaded_t test = mt[NETDATA_KEY_SWAP_READPAGE_CALL].mode; + + if (test == EBPF_LOAD_TRAMPOLINE) { + ebpf_swap_disable_probe(obj); + + ebpf_swap_set_trampoline_target(obj); + } else { + ebpf_swap_disable_trampoline(obj); + } + + int ret = swap_bpf__load(obj); + if (ret) { + return ret; + } + + ebpf_swap_adjust_map_size(obj, em); + + ret = (test == EBPF_LOAD_TRAMPOLINE) ? swap_bpf__attach(obj) : ebpf_swap_attach_kprobe(obj); + if (!ret) { + ebpf_swap_set_hash_tables(obj); + + ebpf_update_controller(swap_maps[NETDATA_SWAP_CONTROLLER].map_fd, em); + } + + return ret; +} +#endif + /***************************************************************** * * FUNCTIONS TO CLOSE THE THREAD @@ -92,6 +240,10 @@ static void ebpf_swap_cleanup(void *ptr) } bpf_object__close(objects); } +#ifdef LIBBPF_MAJOR_VERSION + else if (bpf_obj) + swap_bpf__destroy(bpf_obj); +#endif } /***************************************************************** @@ -654,6 +806,38 @@ static void ebpf_create_swap_charts(int update_every) update_every, NETDATA_EBPF_MODULE_NAME_SWAP); } +/* + * Load BPF + * + * Load BPF files. + * + * @param em the structure with configuration + */ +static int ebpf_swap_load_bpf(ebpf_module_t *em) +{ + int ret = 0; + if (em->load == EBPF_LOAD_LEGACY) { + probe_links = ebpf_load_program(ebpf_plugin_dir, em, running_on_kernel, isrh, &objects); + if (!probe_links) { + ret = -1; + } + } +#ifdef LIBBPF_MAJOR_VERSION + else { + bpf_obj = swap_bpf__open(); + if (!bpf_obj) + ret = -1; + else + ret = ebpf_swap_load_and_attach(bpf_obj, em); + } +#endif + + if (ret) + error("%s %s", EBPF_DEFAULT_ERROR_MSG, em->thread_name); + + return ret; +} + /** * SWAP thread * @@ -675,8 +859,10 @@ void *ebpf_swap_thread(void *ptr) if (!em->enabled) goto endswap; - probe_links = ebpf_load_program(ebpf_plugin_dir, em, running_on_kernel, isrh, &objects); - if (!probe_links) { +#ifdef LIBBPF_MAJOR_VERSION + ebpf_adjust_thread_load(em, default_btf); +#endif + if (ebpf_swap_load_bpf(em)) { em->enabled = CONFIG_BOOLEAN_NO; goto endswap; } diff --git a/collectors/ebpf.plugin/ebpf_swap.h b/collectors/ebpf.plugin/ebpf_swap.h index 1dba9c17a..31bda16a2 100644 --- a/collectors/ebpf.plugin/ebpf_swap.h +++ b/collectors/ebpf.plugin/ebpf_swap.h @@ -49,5 +49,6 @@ extern void ebpf_swap_create_apps_charts(struct ebpf_module *em, void *ptr); extern void clean_swap_pid_structures(); extern struct config swap_config; +extern netdata_ebpf_targets_t swap_targets[]; #endif diff --git a/collectors/ebpf.plugin/ebpf_sync.c b/collectors/ebpf.plugin/ebpf_sync.c index 233c34a5b..b45ec86c1 100644 --- a/collectors/ebpf.plugin/ebpf_sync.c +++ b/collectors/ebpf.plugin/ebpf_sync.c @@ -44,13 +44,41 @@ struct config sync_config = { .first_section = NULL, .rwlock = AVL_LOCK_INITIALIZER } }; ebpf_sync_syscalls_t local_syscalls[] = { - {.syscall = NETDATA_SYSCALLS_SYNC, .enabled = CONFIG_BOOLEAN_YES, .objects = NULL, .probe_links = NULL}, - {.syscall = NETDATA_SYSCALLS_SYNCFS, .enabled = CONFIG_BOOLEAN_YES, .objects = NULL, .probe_links = NULL}, - {.syscall = NETDATA_SYSCALLS_MSYNC, .enabled = CONFIG_BOOLEAN_YES, .objects = NULL, .probe_links = NULL}, - {.syscall = NETDATA_SYSCALLS_FSYNC, .enabled = CONFIG_BOOLEAN_YES, .objects = NULL, .probe_links = NULL}, - {.syscall = NETDATA_SYSCALLS_FDATASYNC, .enabled = CONFIG_BOOLEAN_YES, .objects = NULL, .probe_links = NULL}, - {.syscall = NETDATA_SYSCALLS_SYNC_FILE_RANGE, .enabled = CONFIG_BOOLEAN_YES, .objects = NULL, .probe_links = NULL}, - {.syscall = NULL, .enabled = CONFIG_BOOLEAN_NO, .objects = NULL, .probe_links = NULL} + {.syscall = NETDATA_SYSCALLS_SYNC, .enabled = CONFIG_BOOLEAN_YES, .objects = NULL, .probe_links = NULL, +#ifdef LIBBPF_MAJOR_VERSION + .sync_obj = NULL +#endif + }, + {.syscall = NETDATA_SYSCALLS_SYNCFS, .enabled = CONFIG_BOOLEAN_YES, .objects = NULL, .probe_links = NULL, +#ifdef LIBBPF_MAJOR_VERSION + .sync_obj = NULL +#endif + }, + {.syscall = NETDATA_SYSCALLS_MSYNC, .enabled = CONFIG_BOOLEAN_YES, .objects = NULL, .probe_links = NULL, +#ifdef LIBBPF_MAJOR_VERSION + .sync_obj = NULL +#endif + }, + {.syscall = NETDATA_SYSCALLS_FSYNC, .enabled = CONFIG_BOOLEAN_YES, .objects = NULL, .probe_links = NULL, +#ifdef LIBBPF_MAJOR_VERSION + .sync_obj = NULL +#endif + }, + {.syscall = NETDATA_SYSCALLS_FDATASYNC, .enabled = CONFIG_BOOLEAN_YES, .objects = NULL, .probe_links = NULL, +#ifdef LIBBPF_MAJOR_VERSION + .sync_obj = NULL +#endif + }, + {.syscall = NETDATA_SYSCALLS_SYNC_FILE_RANGE, .enabled = CONFIG_BOOLEAN_YES, .objects = NULL, .probe_links = NULL, +#ifdef LIBBPF_MAJOR_VERSION + .sync_obj = NULL +#endif + }, + {.syscall = NULL, .enabled = CONFIG_BOOLEAN_NO, .objects = NULL, .probe_links = NULL, +#ifdef LIBBPF_MAJOR_VERSION + .sync_obj = NULL +#endif + } }; netdata_ebpf_targets_t sync_targets[] = { {.name = NETDATA_SYSCALLS_SYNC, .mode = EBPF_LOAD_TRAMPOLINE}, @@ -228,7 +256,7 @@ static int ebpf_sync_initialize_syscall(ebpf_module_t *em) { int i; const char *saved_name = em->thread_name; - sync_syscalls_index_t errors = 0; + int errors = 0; for (i = 0; local_syscalls[i].syscall; i++) { ebpf_sync_syscalls_t *w = &local_syscalls[i]; if (w->enabled) { @@ -246,12 +274,15 @@ static int ebpf_sync_initialize_syscall(ebpf_module_t *em) if (!w->sync_obj) { errors++; } else { - if (ebpf_sync_load_and_attach(w->sync_obj, em, syscall, i)) { + if (ebpf_is_function_inside_btf(default_btf, syscall)) { + if (ebpf_sync_load_and_attach(w->sync_obj, em, syscall, i)) { + errors++; + } + } else { if (ebpf_sync_load_legacy(w, em)) errors++; - - em->thread_name = saved_name; } + em->thread_name = saved_name; } } #endif @@ -263,7 +294,7 @@ static int ebpf_sync_initialize_syscall(ebpf_module_t *em) memset(sync_counter_publish_aggregated, 0 , NETDATA_SYNC_IDX_END * sizeof(netdata_publish_syscall_t)); memset(sync_hash_values, 0 , NETDATA_SYNC_IDX_END * sizeof(netdata_idx_t)); - return 0; + return (errors) ? -1 : 0; } /***************************************************************** diff --git a/collectors/fping.plugin/fping.plugin.in b/collectors/fping.plugin/fping.plugin.in index 83c431768..4b3d1d126 100755 --- a/collectors/fping.plugin/fping.plugin.in +++ b/collectors/fping.plugin/fping.plugin.in @@ -16,7 +16,7 @@ if [ "${1}" = "install" ] then [ "${UID}" != 0 ] && echo >&2 "Please run me as root. This will install a single binary file: /usr/local/bin/fping." && exit 1 - [ -z "${2}" ] && fping_version="5.0" || fping_version="${2}" + [ -z "${2}" ] && fping_version="5.1" || fping_version="${2}" run() { printf >&2 " > " diff --git a/collectors/freebsd.plugin/freebsd_ipfw.c b/collectors/freebsd.plugin/freebsd_ipfw.c index 76466c3dd..16e9fd332 100644 --- a/collectors/freebsd.plugin/freebsd_ipfw.c +++ b/collectors/freebsd.plugin/freebsd_ipfw.c @@ -233,7 +233,7 @@ int do_ipfw(int update_every, usec_t dt) { break; if (likely(do_static)) { - sprintf(rule_num_str, "%d_%d", rule->rulenum, rule->id); + sprintf(rule_num_str, "%"PRIu32"_%"PRIu32"", (uint32_t)rule->rulenum, (uint32_t)rule->id); rd_packets = rrddim_find_active(st_packets, rule_num_str); if (unlikely(!rd_packets)) diff --git a/collectors/freebsd.plugin/freebsd_kstat_zfs.c b/collectors/freebsd.plugin/freebsd_kstat_zfs.c index 8b5cc5799..142fdb974 100644 --- a/collectors/freebsd.plugin/freebsd_kstat_zfs.c +++ b/collectors/freebsd.plugin/freebsd_kstat_zfs.c @@ -5,6 +5,8 @@ extern struct arcstats arcstats; +unsigned long long zfs_arcstats_shrinkable_cache_size_bytes = 0; + // -------------------------------------------------------------------------------------------------------------------- // kstat.zfs.misc.arcstats @@ -213,6 +215,12 @@ int do_kstat_zfs_misc_arcstats(int update_every, usec_t dt) { // missing mib: GETSYSCTL_SIMPLE("kstat.zfs.misc.arcstats.arc_need_free", mibs.arc_need_free, arcstats.arc_need_free); // missing mib: GETSYSCTL_SIMPLE("kstat.zfs.misc.arcstats.arc_sys_free", mibs.arc_sys_free, arcstats.arc_sys_free); + if (arcstats.size > arcstats.c_min) { + zfs_arcstats_shrinkable_cache_size_bytes = arcstats.size - arcstats.c_min; + } else { + zfs_arcstats_shrinkable_cache_size_bytes = 0; + } + generate_charts_arcstats("freebsd.plugin", "zfs", show_zero_charts, update_every); generate_charts_arc_summary("freebsd.plugin", "zfs", show_zero_charts, update_every); diff --git a/collectors/freebsd.plugin/freebsd_sysctl.c b/collectors/freebsd.plugin/freebsd_sysctl.c index 3dc1fbfb1..c43743c35 100644 --- a/collectors/freebsd.plugin/freebsd_sysctl.c +++ b/collectors/freebsd.plugin/freebsd_sysctl.c @@ -972,8 +972,14 @@ int do_vm_swap_info(int update_every, usec_t dt) { int do_system_ram(int update_every, usec_t dt) { (void)dt; - static int mib_active_count[4] = {0, 0, 0, 0}, mib_inactive_count[4] = {0, 0, 0, 0}, mib_wire_count[4] = {0, 0, 0, 0}, - mib_cache_count[4] = {0, 0, 0, 0}, mib_vfs_bufspace[2] = {0, 0}, mib_free_count[4] = {0, 0, 0, 0}; + static int mib_active_count[4] = {0, 0, 0, 0}, + mib_inactive_count[4] = {0, 0, 0, 0}, + mib_wire_count[4] = {0, 0, 0, 0}, +#if __FreeBSD_version < 1200016 + mib_cache_count[4] = {0, 0, 0, 0}, +#endif + mib_vfs_bufspace[2] = {0, 0}, + mib_free_count[4] = {0, 0, 0, 0}; vmmeter_t vmmeter_data; size_t vfs_bufspace_count; @@ -1026,10 +1032,8 @@ int do_system_ram(int update_every, usec_t dt) { rd_free = rrddim_add(st, "free", NULL, system_pagesize, MEGA_FACTOR, RRD_ALGORITHM_ABSOLUTE); rd_active = rrddim_add(st, "active", NULL, system_pagesize, MEGA_FACTOR, RRD_ALGORITHM_ABSOLUTE); rd_inactive = rrddim_add(st, "inactive", NULL, system_pagesize, MEGA_FACTOR, RRD_ALGORITHM_ABSOLUTE); - rd_wired = rrddim_add(st, "wired", NULL, system_pagesize, MEGA_FACTOR, RRD_ALGORITHM_ABSOLUTE); -#if __FreeBSD_version < 1200016 - rd_cache = rrddim_add(st, "cache", NULL, system_pagesize, MEGA_FACTOR, RRD_ALGORITHM_ABSOLUTE); -#endif + rd_wired = rrddim_add(st, "wired", NULL, 1, MEGA_FACTOR, RRD_ALGORITHM_ABSOLUTE); + rd_cache = rrddim_add(st, "cache", NULL, 1, MEGA_FACTOR, RRD_ALGORITHM_ABSOLUTE); #if defined(NETDATA_COLLECT_LAUNDRY) rd_laundry = rrddim_add(st, "laundry", NULL, system_pagesize, MEGA_FACTOR, RRD_ALGORITHM_ABSOLUTE); #endif @@ -1040,9 +1044,11 @@ int do_system_ram(int update_every, usec_t dt) { rrddim_set_by_pointer(st, rd_free, vmmeter_data.v_free_count); rrddim_set_by_pointer(st, rd_active, vmmeter_data.v_active_count); rrddim_set_by_pointer(st, rd_inactive, vmmeter_data.v_inactive_count); - rrddim_set_by_pointer(st, rd_wired, vmmeter_data.v_wire_count); + rrddim_set_by_pointer(st, rd_wired, vmmeter_data.v_wire_count * system_pagesize - zfs_arcstats_shrinkable_cache_size_bytes); #if __FreeBSD_version < 1200016 - rrddim_set_by_pointer(st, rd_cache, vmmeter_data.v_cache_count); + rrddim_set_by_pointer(st, rd_cache, vmmeter_data.v_cache_count * system_pagesize + zfs_arcstats_shrinkable_cache_size_bytes); +#else + rrddim_set_by_pointer(st, rd_cache, zfs_arcstats_shrinkable_cache_size_bytes); #endif #if defined(NETDATA_COLLECT_LAUNDRY) rrddim_set_by_pointer(st, rd_laundry, vmmeter_data.v_laundry_count); diff --git a/collectors/freebsd.plugin/plugin_freebsd.c b/collectors/freebsd.plugin/plugin_freebsd.c index 97ca1d9ae..a52ece3f9 100644 --- a/collectors/freebsd.plugin/plugin_freebsd.c +++ b/collectors/freebsd.plugin/plugin_freebsd.c @@ -9,7 +9,6 @@ static struct freebsd_module { int enabled; int (*func)(int update_every, usec_t dt); - usec_t duration; RRDDIM *rd; @@ -68,8 +67,14 @@ static struct freebsd_module { {.name = NULL, .dim = NULL, .enabled = 0, .func = NULL} }; +#if WORKER_UTILIZATION_MAX_JOB_TYPES < 33 +#error WORKER_UTILIZATION_MAX_JOB_TYPES has to be at least 33 +#endif + static void freebsd_main_cleanup(void *ptr) { + worker_unregister(); + struct netdata_static_thread *static_thread = (struct netdata_static_thread *)ptr; static_thread->enabled = NETDATA_MAIN_THREAD_EXITING; @@ -80,9 +85,9 @@ static void freebsd_main_cleanup(void *ptr) void *freebsd_main(void *ptr) { - netdata_thread_cleanup_push(freebsd_main_cleanup, ptr); + worker_register("FREEBSD"); - int vdo_cpu_netdata = config_get_boolean("plugin:freebsd", "netdata server resources", 1); + netdata_thread_cleanup_push(freebsd_main_cleanup, ptr); // initialize FreeBSD plugin if (freebsd_plugin_init()) @@ -94,8 +99,9 @@ void *freebsd_main(void *ptr) struct freebsd_module *pm = &freebsd_modules[i]; pm->enabled = config_get_boolean("plugin:freebsd", pm->name, pm->enabled); - pm->duration = 0ULL; pm->rd = NULL; + + worker_register_job_name(i, freebsd_modules[i].dim); } usec_t step = localhost->rrd_update_every * USEC_PER_SEC; @@ -103,14 +109,13 @@ void *freebsd_main(void *ptr) heartbeat_init(&hb); while (!netdata_exit) { + worker_is_idle(); + usec_t hb_dt = heartbeat_next(&hb, step); - usec_t duration = 0ULL; if (unlikely(netdata_exit)) break; - // BEGIN -- the job to be done - for (i = 0; freebsd_modules[i].name; i++) { struct freebsd_module *pm = &freebsd_modules[i]; if (unlikely(!pm->enabled)) @@ -118,92 +123,12 @@ void *freebsd_main(void *ptr) debug(D_PROCNETDEV_LOOP, "FREEBSD calling %s.", pm->name); + worker_is_busy(i); pm->enabled = !pm->func(localhost->rrd_update_every, hb_dt); - pm->duration = heartbeat_monotonic_dt_to_now_usec(&hb) - duration; - duration += pm->duration; if (unlikely(netdata_exit)) break; } - - // END -- the job is done - - if (vdo_cpu_netdata) { - static RRDSET *st_cpu_thread = NULL, *st_duration = NULL; - static RRDDIM *rd_user = NULL, *rd_system = NULL; - - // ---------------------------------------------------------------- - - struct rusage thread; - getrusage(RUSAGE_THREAD, &thread); - - if (unlikely(!st_cpu_thread)) { - st_cpu_thread = rrdset_create_localhost( - "netdata", - "plugin_freebsd_cpu", - NULL, - "freebsd", - NULL, - "Netdata FreeBSD plugin CPU usage", - "milliseconds/s", - "freebsd.plugin", - "stats", - 132000, - localhost->rrd_update_every, - RRDSET_TYPE_STACKED); - - rd_user = rrddim_add(st_cpu_thread, "user", NULL, 1, USEC_PER_MS, RRD_ALGORITHM_INCREMENTAL); - rd_system = rrddim_add(st_cpu_thread, "system", NULL, 1, USEC_PER_MS, RRD_ALGORITHM_INCREMENTAL); - } else { - rrdset_next(st_cpu_thread); - } - - rrddim_set_by_pointer( - st_cpu_thread, rd_user, thread.ru_utime.tv_sec * USEC_PER_SEC + thread.ru_utime.tv_usec); - rrddim_set_by_pointer( - st_cpu_thread, rd_system, thread.ru_stime.tv_sec * USEC_PER_SEC + thread.ru_stime.tv_usec); - rrdset_done(st_cpu_thread); - - // ---------------------------------------------------------------- - - if (unlikely(!st_duration)) { - st_duration = rrdset_find_active_bytype_localhost("netdata", "plugin_freebsd_modules"); - - if (!st_duration) { - st_duration = rrdset_create_localhost( - "netdata", - "plugin_freebsd_modules", - NULL, - "freebsd", - NULL, - "Netdata FreeBSD plugin modules durations", - "milliseconds/run", - "freebsd.plugin", - "stats", - 132001, - localhost->rrd_update_every, - RRDSET_TYPE_STACKED); - - for (i = 0; freebsd_modules[i].name; i++) { - struct freebsd_module *pm = &freebsd_modules[i]; - if (unlikely(!pm->enabled)) - continue; - - pm->rd = rrddim_add(st_duration, pm->dim, NULL, 1, 1000, RRD_ALGORITHM_ABSOLUTE); - } - } - } else - rrdset_next(st_duration); - - for (i = 0; freebsd_modules[i].name; i++) { - struct freebsd_module *pm = &freebsd_modules[i]; - if (unlikely(!pm->enabled)) - continue; - - rrddim_set_by_pointer(st_duration, pm->rd, pm->duration); - } - rrdset_done(st_duration); - } } netdata_thread_cleanup_pop(1); diff --git a/collectors/freebsd.plugin/plugin_freebsd.h b/collectors/freebsd.plugin/plugin_freebsd.h index 26f76b6bf..3a4ec13a7 100644 --- a/collectors/freebsd.plugin/plugin_freebsd.h +++ b/collectors/freebsd.plugin/plugin_freebsd.h @@ -49,4 +49,7 @@ extern int do_kstat_zfs_misc_arcstats(int update_every, usec_t dt); extern int do_kstat_zfs_misc_zio_trim(int update_every, usec_t dt); extern int do_ipfw(int update_every, usec_t dt); +// metrics that need to be shared among data collectors +extern unsigned long long zfs_arcstats_shrinkable_cache_size_bytes; + #endif /* NETDATA_PLUGIN_FREEBSD_H */ diff --git a/collectors/freeipmi.plugin/freeipmi_plugin.c b/collectors/freeipmi.plugin/freeipmi_plugin.c index 6c6f3d747..351b6e32b 100644 --- a/collectors/freeipmi.plugin/freeipmi_plugin.c +++ b/collectors/freeipmi.plugin/freeipmi_plugin.c @@ -1596,6 +1596,7 @@ int host_is_local(const char *host) } int main (int argc, char **argv) { + clocks_init(); // ------------------------------------------------------------------------ // initialization of netdata plugin diff --git a/collectors/idlejitter.plugin/plugin_idlejitter.c b/collectors/idlejitter.plugin/plugin_idlejitter.c index 12ab8601a..535819c69 100644 --- a/collectors/idlejitter.plugin/plugin_idlejitter.c +++ b/collectors/idlejitter.plugin/plugin_idlejitter.c @@ -5,6 +5,8 @@ #define CPU_IDLEJITTER_SLEEP_TIME_MS 20 static void cpuidlejitter_main_cleanup(void *ptr) { + worker_unregister(); + struct netdata_static_thread *static_thread = (struct netdata_static_thread *)ptr; static_thread->enabled = NETDATA_MAIN_THREAD_EXITING; @@ -14,6 +16,9 @@ static void cpuidlejitter_main_cleanup(void *ptr) { } void *cpuidlejitter_main(void *ptr) { + worker_register("IDLEJITTER"); + worker_register_job_name(0, "measurements"); + netdata_thread_cleanup_push(cpuidlejitter_main_cleanup, ptr); usec_t sleep_ut = config_get_number("plugin:idlejitter", "loop time in ms", CPU_IDLEJITTER_SLEEP_TIME_MS) * USEC_PER_MS; @@ -55,7 +60,9 @@ void *cpuidlejitter_main(void *ptr) { while(elapsed < update_every_ut) { now_monotonic_high_precision_timeval(&before); + worker_is_idle(); sleep_usec(sleep_ut); + worker_is_busy(0); now_monotonic_high_precision_timeval(&after); usec_t dt = dt_usec(&after, &before); diff --git a/collectors/macos.plugin/plugin_macos.c b/collectors/macos.plugin/plugin_macos.c index 4566c09ee..10472bdb8 100644 --- a/collectors/macos.plugin/plugin_macos.c +++ b/collectors/macos.plugin/plugin_macos.c @@ -9,7 +9,6 @@ static struct macos_module { int enabled; int (*func)(int update_every, usec_t dt); - usec_t duration; RRDDIM *rd; @@ -22,8 +21,14 @@ static struct macos_module { {.name = NULL, .dim = NULL, .enabled = 0, .func = NULL} }; +#if WORKER_UTILIZATION_MAX_JOB_TYPES < 3 +#error WORKER_UTILIZATION_MAX_JOB_TYPES has to be at least 3 +#endif + static void macos_main_cleanup(void *ptr) { + worker_unregister(); + struct netdata_static_thread *static_thread = (struct netdata_static_thread *)ptr; static_thread->enabled = NETDATA_MAIN_THREAD_EXITING; @@ -34,17 +39,18 @@ static void macos_main_cleanup(void *ptr) void *macos_main(void *ptr) { - netdata_thread_cleanup_push(macos_main_cleanup, ptr); + worker_register("MACOS"); - int vdo_cpu_netdata = config_get_boolean("plugin:macos", "netdata server resources", CONFIG_BOOLEAN_YES); + netdata_thread_cleanup_push(macos_main_cleanup, ptr); // check the enabled status for each module for (int i = 0; macos_modules[i].name; i++) { struct macos_module *pm = &macos_modules[i]; pm->enabled = config_get_boolean("plugin:macos", pm->name, pm->enabled); - pm->duration = 0ULL; pm->rd = NULL; + + worker_register_job_name(i, macos_modules[i].dim); } usec_t step = localhost->rrd_update_every * USEC_PER_SEC; @@ -52,10 +58,8 @@ void *macos_main(void *ptr) heartbeat_init(&hb); while (!netdata_exit) { + worker_is_idle(); usec_t hb_dt = heartbeat_next(&hb, step); - usec_t duration = 0ULL; - - // BEGIN -- the job to be done for (int i = 0; macos_modules[i].name; i++) { struct macos_module *pm = &macos_modules[i]; @@ -64,92 +68,12 @@ void *macos_main(void *ptr) debug(D_PROCNETDEV_LOOP, "macos calling %s.", pm->name); + worker_is_busy(i); pm->enabled = !pm->func(localhost->rrd_update_every, hb_dt); - pm->duration = heartbeat_monotonic_dt_to_now_usec(&hb) - duration; - duration += pm->duration; if (unlikely(netdata_exit)) break; } - - // END -- the job is done - - if (vdo_cpu_netdata) { - static RRDSET *st_cpu_thread = NULL, *st_duration = NULL; - static RRDDIM *rd_user = NULL, *rd_system = NULL; - - // ---------------------------------------------------------------- - - struct rusage thread; - getrusage(RUSAGE_THREAD, &thread); - - if (unlikely(!st_cpu_thread)) { - st_cpu_thread = rrdset_create_localhost( - "netdata", - "plugin_macos_cpu", - NULL, - "macos", - NULL, - "Netdata macOS plugin CPU usage", - "milliseconds/s", - "macos.plugin", - "stats", - 132000, - localhost->rrd_update_every, - RRDSET_TYPE_STACKED); - - rd_user = rrddim_add(st_cpu_thread, "user", NULL, 1, USEC_PER_MS, RRD_ALGORITHM_INCREMENTAL); - rd_system = rrddim_add(st_cpu_thread, "system", NULL, 1, USEC_PER_MS, RRD_ALGORITHM_INCREMENTAL); - } else { - rrdset_next(st_cpu_thread); - } - - rrddim_set_by_pointer( - st_cpu_thread, rd_user, thread.ru_utime.tv_sec * USEC_PER_SEC + thread.ru_utime.tv_usec); - rrddim_set_by_pointer( - st_cpu_thread, rd_system, thread.ru_stime.tv_sec * USEC_PER_SEC + thread.ru_stime.tv_usec); - rrdset_done(st_cpu_thread); - - // ---------------------------------------------------------------- - - if (unlikely(!st_duration)) { - st_duration = rrdset_find_active_bytype_localhost("netdata", "plugin_macos_modules"); - - if (!st_duration) { - st_duration = rrdset_create_localhost( - "netdata", - "plugin_macos_modules", - NULL, - "macos", - NULL, - "Netdata macOS plugin modules durations", - "milliseconds/run", - "macos.plugin", - "stats", - 132001, - localhost->rrd_update_every, - RRDSET_TYPE_STACKED); - - for (int i = 0; macos_modules[i].name; i++) { - struct macos_module *pm = &macos_modules[i]; - if (unlikely(!pm->enabled)) - continue; - - pm->rd = rrddim_add(st_duration, pm->dim, NULL, 1, 1000, RRD_ALGORITHM_ABSOLUTE); - } - } - } else - rrdset_next(st_duration); - - for (int i = 0; macos_modules[i].name; i++) { - struct macos_module *pm = &macos_modules[i]; - if (unlikely(!pm->enabled)) - continue; - - rrddim_set_by_pointer(st_duration, pm->rd, pm->duration); - } - rrdset_done(st_duration); - } } netdata_thread_cleanup_pop(1); diff --git a/collectors/nfacct.plugin/plugin_nfacct.c b/collectors/nfacct.plugin/plugin_nfacct.c index 35209a281..eeadb3ccc 100644 --- a/collectors/nfacct.plugin/plugin_nfacct.c +++ b/collectors/nfacct.plugin/plugin_nfacct.c @@ -745,6 +745,7 @@ void nfacct_signals() } int main(int argc, char **argv) { + clocks_init(); // ------------------------------------------------------------------------ // initialization of netdata plugin diff --git a/collectors/node.d.plugin/Makefile.am b/collectors/node.d.plugin/Makefile.am deleted file mode 100644 index 1b8281748..000000000 --- a/collectors/node.d.plugin/Makefile.am +++ /dev/null @@ -1,57 +0,0 @@ -# SPDX-License-Identifier: GPL-3.0-or-later - -MAINTAINERCLEANFILES = $(srcdir)/Makefile.in -CLEANFILES = \ - node.d.plugin \ - $(NULL) - -include $(top_srcdir)/build/subst.inc -SUFFIXES = .in - -dist_libconfig_DATA = \ - node.d.conf \ - $(NULL) - -dist_plugins_SCRIPTS = \ - node.d.plugin \ - $(NULL) - -dist_noinst_DATA = \ - node.d.plugin.in \ - README.md \ - $(NULL) - -usernodeconfigdir=$(configdir)/node.d -dist_usernodeconfig_DATA = \ - $(NULL) - -# Explicitly install directories to avoid permission issues due to umask -install-exec-local: - $(INSTALL) -d $(DESTDIR)$(usernodeconfigdir) - -nodeconfigdir=$(libconfigdir)/node.d -dist_nodeconfig_DATA = \ - $(NULL) - -dist_node_DATA = \ - $(NULL) - -include snmp/Makefile.inc - -nodemodulesdir=$(nodedir)/node_modules -dist_nodemodules_DATA = \ - node_modules/netdata.js \ - node_modules/extend.js \ - node_modules/pixl-xml.js \ - node_modules/net-snmp.js \ - node_modules/asn1-ber.js \ - $(NULL) - -nodemoduleslibberdir=$(nodedir)/node_modules/lib/ber -dist_nodemoduleslibber_DATA = \ - node_modules/lib/ber/index.js \ - node_modules/lib/ber/errors.js \ - node_modules/lib/ber/reader.js \ - node_modules/lib/ber/types.js \ - node_modules/lib/ber/writer.js \ - $(NULL) diff --git a/collectors/node.d.plugin/README.md b/collectors/node.d.plugin/README.md deleted file mode 100644 index 4c5f278bd..000000000 --- a/collectors/node.d.plugin/README.md +++ /dev/null @@ -1,236 +0,0 @@ -<!-- -title: "node.d.plugin" -custom_edit_url: https://github.com/netdata/netdata/edit/master/collectors/node.d.plugin/README.md ---> - -# node.d.plugin - -`node.d.plugin` is a Netdata external plugin. It is an **orchestrator** for data collection modules written in `node.js`. - -1. It runs as an independent process `ps fax` shows it -2. It is started and stopped automatically by Netdata -3. It communicates with Netdata via a unidirectional pipe (sending data to the `netdata` daemon) -4. Supports any number of data collection **modules** -5. Allows each **module** to have one or more data collection **jobs** -6. Each **job** is collecting one or more metrics from a single data source - -## Pull Request Checklist for Node.js Plugins - -This is a generic checklist for submitting a new Node.js plugin for Netdata. It is by no means comprehensive. - -At minimum, to be buildable and testable, the PR needs to include: - -- The module itself, following proper naming conventions: `node.d/<module_dir>/<module_name>.node.js` -- A README.md file for the plugin. -- The configuration file for the module -- A basic configuration for the plugin in the appropriate global config file: `conf.d/node.d.conf`, which is also in JSON format. If the module should be enabled by default, add a section for it in the `modules` dictionary. -- A line for the plugin in the appropriate `Makefile.am` file: `node.d/Makefile.am` under `dist_node_DATA`. -- A line for the plugin configuration file in `conf.d/Makefile.am`: under `dist_nodeconfig_DATA` -- Optionally, chart information in `web/dashboard_info.js`. This generally involves specifying a name and icon for the section, and may include descriptions for the section or individual charts. - -## Motivation - -Node.js is perfect for asynchronous operations. It is very fast and quite common (actually the whole web is based on it). -Since data collection is not a CPU intensive task, node.js is an ideal solution for it. - -`node.d.plugin` is a Netdata plugin that provides an abstraction layer to allow easy and quick development of data -collectors in node.js. It also manages all its data collectors (placed in `/usr/libexec/netdata/node.d`) using a single -instance of node, thus lowering the memory footprint of data collection. - -Of course, there can be independent plugins written in node.js (placed in `/usr/libexec/netdata/plugins`). -These will have to be developed using the guidelines of **[External Plugins](/collectors/plugins.d/README.md)**. - -To run `node.js` plugins you need to have `node` installed in your system. - -In some older systems, the package named `node` is not node.js. It is a terminal emulation program called `ax25-node`. -In this case the node.js package may be referred as `nodejs`. Once you install `nodejs`, we suggest to link -`/usr/bin/nodejs` to `/usr/bin/node`, so that typing `node` in your terminal, opens node.js. - -## configuring `node.d.plugin` - -`node.d.plugin` can work even without any configuration. Its default configuration file is -`node.d.conf`. To edit it on your system, run `/etc/netdata/edit-config node.d.conf`. - -## configuring `node.d.plugin` modules - -`node.d.plugin` modules accept configuration in `JSON` format. - -Unfortunately, `JSON` files do not accept comments. So, the best way to describe them is to have markdown text files -with instructions. - -`JSON` has a very strict formatting. If you get errors from Netdata at `/var/log/netdata/error.log` that a certain -configuration file cannot be loaded, we suggest to verify it at <http://jsonlint.com/>. - -The files in this directory, provide usable examples for configuring each `node.d.plugin` module. - -## debugging modules written for node.d.plugin - -To test `node.d.plugin` modules, which are placed in `/usr/libexec/netdata/node.d`, you can run `node.d.plugin` by hand, -like this: - -```sh -# become user netdata -sudo su -s /bin/sh netdata - -# run the plugin in debug mode -/usr/libexec/netdata/plugins.d/node.d.plugin debug 1 X Y Z -``` - -`node.d.plugin` will run in `debug` mode (lots of debug info), with an update frequency of `1` second, evaluating only -the collector scripts `X` (i.e. `/usr/libexec/netdata/node.d/X.node.js`), `Y` and `Z`. -You can define zero or more modules. If none is defined, `node.d.plugin` will evaluate all modules available. - -Keep in mind that if your configs are not in `/etc/netdata`, you should do the following before running `node.d.plugin`: - -```sh -export NETDATA_USER_CONFIG_DIR="/path/to/etc/netdata" -``` - ---- - -## developing `node.d.plugin` modules - -Your data collection module should be split in 3 parts: - -- a function to fetch the data from its source. `node.d.plugin` already can fetch data from web sources, - so you don't need to do anything about it for http. - -- a function to process the fetched/manipulate the data fetched. This function will make a number of calls - to create charts and dimensions and pass the collected values to Netdata. - This is the only function you need to write for collecting http JSON data. - -- a `configure` and an `update` function, which take care of your module configuration and data refresh - respectively. You can use the supplied ones. - -Your module will automatically be able to process any number of servers, with different settings (even different -data collection frequencies). You will write just the work needed for one and `node.d.plugin` will do the rest. -For each server you are going to fetch data from, you will have to create a `service` (more later). - -### writing the data collection module - -To provide a module called `mymodule`, you have create the file `/usr/libexec/netdata/node.d/mymodule.node.js`, with this structure: - -```js -// the processor is needed only -// if you need a custom processor -// other than http -netdata.processors.myprocessor = { - name: 'myprocessor', - - process: function(service, callback) { - - /* do data collection here */ - - callback(data); - } -}; - -// this is the mymodule definition -var mymodule = { - processResponse: function(service, data) { - - /* send information to the Netdata server here */ - - }, - - configure: function(config) { - var eligible_services = 0; - - if(typeof(config.servers) === 'undefined' || config.servers.length === 0) { - - /* - * create a service using internal defaults; - * this is used for auto-detecting the settings - * if possible - */ - - netdata.service({ - name: 'a name for this service', - update_every: this.update_every, - module: this, - processor: netdata.processors.myprocessor, - // any other information your processor needs - }).execute(this.processResponse); - - eligible_services++; - } - else { - - /* - * create a service for each server in the - * configuration file - */ - - var len = config.servers.length; - while(len--) { - var server = config.servers[len]; - - netdata.service({ - name: server.name, - update_every: server.update_every, - module: this, - processor: netdata.processors.myprocessor, - // any other information your processor needs - }).execute(this.processResponse); - - eligible_services++; - } - } - - return eligible_services; - }, - - update: function(service, callback) { - - /* - * this function is called when each service - * created by the configure function, needs to - * collect updated values. - * - * You normally will not need to change it. - */ - - service.execute(function(service, data) { - mymodule.processResponse(service, data); - callback(); - }); - }, -}; - -module.exports = mymodule; -``` - -#### configure(config) - -`configure(config)` is called just once, when `node.d.plugin` starts. -The config file will contain the contents of `/etc/netdata/node.d/mymodule.conf`. -This file should have the following format: - -```js -{ - "enable_autodetect": false, - "update_every": 5, - "servers": [ { /* server 1 */ }, { /* server 2 */ } ] -} -``` - -If the config file `/etc/netdata/node.d/mymodule.conf` does not give a `enable_autodetect` or `update_every`, these -will be added by `node.d.plugin`. So you module will always have them. - -The configuration file `/etc/netdata/node.d/mymodule.conf` may contain whatever else is needed for `mymodule`. - -#### processResponse(data) - -`data` may be `null` or whatever the processor specified in the `service` returned. - -The `service` object defines a set of functions to allow you send information to the Netdata core about: - -1. Charts and dimension definitions -2. Updated values, from the collected values - ---- - -_FIXME: document an operational node.d.plugin data collector - the best example is the -[snmp collector](https://raw.githubusercontent.com/netdata/netdata/master/collectors/node.d.plugin/snmp/snmp.node.js)_ - - diff --git a/collectors/node.d.plugin/node.d.conf b/collectors/node.d.plugin/node.d.conf deleted file mode 100644 index c79274a5e..000000000 --- a/collectors/node.d.plugin/node.d.conf +++ /dev/null @@ -1,33 +0,0 @@ -{
- "___help_1": "Default options for node.d.plugin - this is a JSON file.",
- "___help_2": "Use http://jsonlint.com/ to verify it is valid JSON.",
- "___help_3": "------------------------------------------------------------",
-
- "___help_update_every": "Minimum data collection frequency for all node.d/*.node.js modules. Set it to 0 to inherit it from netdata.",
- "update_every": 0,
-
- "___help_modules_enable_autodetect": "Enable/disable auto-detection for node.d/*.node.js modules that support it.",
- "modules_enable_autodetect": true,
-
- "___help_modules_enable_all": "Enable all node.d/*.node.js modules by default.",
- "modules_enable_all": true,
-
- "___help_modules": "Enable/disable the following modules. Give only XXX for node.d/XXX.node.js",
- "modules": {
- "snmp": {
- "enabled": true
- }
- },
-
- "___help_paths": "Paths that control the operation of node.d.plugin",
- "paths": {
- "___help_plugins": "The full path to the modules javascript node.d/ directory",
- "plugins": null,
-
- "___help_config": "The full path to the modules configs node.d/ directory",
- "config": null,
-
- "___help_modules": "Array of paths to add to node.js when searching for node_modules",
- "modules": []
- }
-}
diff --git a/collectors/node.d.plugin/node.d.plugin.in b/collectors/node.d.plugin/node.d.plugin.in deleted file mode 100755 index 05c126e90..000000000 --- a/collectors/node.d.plugin/node.d.plugin.in +++ /dev/null @@ -1,303 +0,0 @@ -#!/usr/bin/env bash -':' //; exec "$(command -v nodejs || command -v node || echo "ERROR node IS NOT AVAILABLE IN THIS SYSTEM")" "$0" "$@" - -// shebang hack from: -// http://unix.stackexchange.com/questions/65235/universal-node-js-shebang - -// Initially this is run as a shell script. -// Then, the second line, finds nodejs or node or js in the system path -// and executes it with the shell parameters. - -// netdata -// real-time performance and health monitoring, done right! -// (C) 2017 Costa Tsaousis <costa@tsaousis.gr> -// SPDX-License-Identifier: GPL-3.0-or-later - -// -------------------------------------------------------------------------------------------------------------------- - -'use strict'; - -// -------------------------------------------------------------------------------------------------------------------- -// get NETDATA environment variables - -var NETDATA_PLUGINS_DIR = process.env.NETDATA_PLUGINS_DIR || __dirname; -var NETDATA_USER_CONFIG_DIR = process.env.NETDATA_USER_CONFIG_DIR || '@configdir_POST@'; -var NETDATA_STOCK_CONFIG_DIR = process.env.NETDATA_STOCK_CONFIG_DIR || '@libconfigdir_POST@'; -var NETDATA_UPDATE_EVERY = process.env.NETDATA_UPDATE_EVERY || 1; -var NODE_D_DIR = NETDATA_PLUGINS_DIR + '/../node.d'; - -// make sure the modules are found -process.mainModule.paths.unshift(NODE_D_DIR + '/node_modules'); -process.mainModule.paths.unshift(NODE_D_DIR); - - -// -------------------------------------------------------------------------------------------------------------------- -// load required modules - -var fs = require('fs'); -var url = require('url'); -var util = require('util'); -var http = require('http'); -var path = require('path'); -var extend = require('extend'); -var netdata = require('netdata'); - - -// -------------------------------------------------------------------------------------------------------------------- -// configuration - -function netdata_read_json_config_file(module_filename) { - var f = path.basename(module_filename); - - var ufilename, sfilename; - - var m = f.match('.plugin' + '$'); - if(m !== null) { - ufilename = netdata.options.paths.config + '/' + f.substring(0, m.index) + '.conf'; - sfilename = netdata.options.paths.stock_config + '/' + f.substring(0, m.index) + '.conf'; - } - - m = f.match('.node.js' + '$'); - if(m !== null) { - ufilename = netdata.options.paths.config + '/node.d/' + f.substring(0, m.index) + '.conf'; - sfilename = netdata.options.paths.stock_config + '/node.d/' + f.substring(0, m.index) + '.conf'; - } - - try { - netdata.debug('loading module\'s ' + module_filename + ' user-config ' + ufilename); - return JSON.parse(fs.readFileSync(ufilename, 'utf8')); - } - catch(e) { - netdata.error('Cannot read user-configuration file ' + ufilename + ': ' + e.message + '.'); - dumpError(e); - } - - try { - netdata.debug('loading module\'s ' + module_filename + ' stock-config ' + sfilename); - return JSON.parse(fs.readFileSync(sfilename, 'utf8')); - } - catch(e) { - netdata.error('Cannot read stock-configuration file ' + sfilename + ': ' + e.message + ', using internal defaults.'); - dumpError(e); - } - - return {}; -} - -// internal defaults -extend(true, netdata.options, { - filename: path.basename(__filename), - - update_every: NETDATA_UPDATE_EVERY, - - paths: { - plugins: NETDATA_PLUGINS_DIR, - config: NETDATA_USER_CONFIG_DIR, - stock_config: NETDATA_STOCK_CONFIG_DIR, - modules: [] - }, - - modules_enable_autodetect: true, - modules_enable_all: true, - modules: {} -}); - -// load configuration file -netdata.options_loaded = netdata_read_json_config_file(__filename); -extend(true, netdata.options, netdata.options_loaded); - -if(!netdata.options.paths.plugins) - netdata.options.paths.plugins = NETDATA_PLUGINS_DIR; - -if(!netdata.options.paths.config) - netdata.options.paths.config = NETDATA_USER_CONFIG_DIR; - -if(!netdata.options.paths.stock_config) - netdata.options.paths.stock_config = NETDATA_STOCK_CONFIG_DIR; - -// console.error('merged netdata object:'); -// console.error(util.inspect(netdata, {depth: 10})); - - -// apply module paths to node.js process -function applyModulePaths() { - var len = netdata.options.paths.modules.length; - while(len--) - process.mainModule.paths.unshift(netdata.options.paths.modules[len]); -} -applyModulePaths(); - - -// -------------------------------------------------------------------------------------------------------------------- -// tracing - -function dumpError(err) { - if (typeof err === 'object') { - if (err.stack) { - netdata.debug(err.stack); - } - } -} - -// -------------------------------------------------------------------------------------------------------------------- -// get command line arguments -{ - var found_myself = false; - var found_number = false; - var found_modules = false; - process.argv.forEach(function (val, index, array) { - netdata.debug('PARAM: ' + val); - - if(!found_myself) { - if(val === __filename) - found_myself = true; - } - else { - switch(val) { - case 'debug': - netdata.options.DEBUG = true; - netdata.debug('DEBUG enabled'); - break; - - default: - if(found_number === true) { - if(found_modules === false) { - for(var i in netdata.options.modules) - netdata.options.modules[i].enabled = false; - } - - if(typeof netdata.options.modules[val] === 'undefined') - netdata.options.modules[val] = {}; - - netdata.options.modules[val].enabled = true; - netdata.options.modules_enable_all = false; - netdata.debug('enabled module ' + val); - } - else { - try { - var x = parseInt(val); - if(x > 0) { - netdata.options.update_every = x; - if(netdata.options.update_every < NETDATA_UPDATE_EVERY) { - netdata.options.update_every = NETDATA_UPDATE_EVERY; - netdata.debug('Update frequency ' + x + 's is too low'); - } - - found_number = true; - netdata.debug('Update frequency set to ' + netdata.options.update_every + ' seconds'); - } - else netdata.error('Ignoring parameter: ' + val); - } - catch(e) { - netdata.error('Cannot get value of parameter: ' + val); - dumpError(e); - } - } - break; - } - } - }); -} - -if(netdata.options.update_every < 1) { - netdata.debug('Adjusting update frequency to 1 second'); - netdata.options.update_every = 1; -} - -// -------------------------------------------------------------------------------------------------------------------- -// find modules - -function findModules() { - var found = 0; - - var files = fs.readdirSync(NODE_D_DIR); - var len = files.length; - while(len--) { - var m = files[len].match('.node.js' + '$'); - if(m !== null) { - var n = files[len].substring(0, m.index); - - if(typeof(netdata.options.modules[n]) === 'undefined') - netdata.options.modules[n] = { name: n, enabled: netdata.options.modules_enable_all }; - - if(netdata.options.modules[n].enabled === true) { - netdata.options.modules[n].name = n; - netdata.options.modules[n].filename = NODE_D_DIR + '/' + files[len]; - netdata.options.modules[n].loaded = false; - - // load the module - try { - netdata.debug('loading module ' + netdata.options.modules[n].filename); - netdata.options.modules[n].module = require(netdata.options.modules[n].filename); - netdata.options.modules[n].module.name = n; - netdata.debug('loaded module ' + netdata.options.modules[n].name + ' from ' + netdata.options.modules[n].filename); - } - catch(e) { - netdata.options.modules[n].enabled = false; - netdata.error('Cannot load module: ' + netdata.options.modules[n].filename + ' exception: ' + e); - dumpError(e); - continue; - } - - // load its configuration - var c = { - enable_autodetect: netdata.options.modules_enable_autodetect, - update_every: netdata.options.update_every - }; - - var c2 = netdata_read_json_config_file(files[len]); - extend(true, c, c2); - - // call module auto-detection / configuration - try { - netdata.modules_configuring++; - netdata.debug('Configuring module ' + netdata.options.modules[n].name); - var serv = netdata.configure(netdata.options.modules[n].module, c, function() { - netdata.debug('Configured module ' + netdata.options.modules[n].name); - netdata.modules_configuring--; - }); - - netdata.debug('Configuring module ' + netdata.options.modules[n].name + ' reports ' + serv + ' eligible services.'); - } - catch(e) { - netdata.modules_configuring--; - netdata.options.modules[n].enabled = false; - netdata.error('Failed module auto-detection: ' + netdata.options.modules[n].name + ' exception: ' + e + ', disabling module.'); - dumpError(e); - continue; - } - - netdata.options.modules[n].loaded = true; - found++; - } - } - } - - // netdata.debug(netdata.options.modules); - return found; -} - -if(findModules() === 0) { - netdata.error('Cannot load any .node.js module from: ' + NODE_D_DIR); - netdata.disableNodePlugin(); - process.exit(1); -} - - -// -------------------------------------------------------------------------------------------------------------------- -// start - -function start_when_configuring_ends() { - if(netdata.modules_configuring > 0) { - netdata.debug('Waiting modules configuration, still running ' + netdata.modules_configuring); - setTimeout(start_when_configuring_ends, 500); - return; - } - - netdata.modules_configuring = 0; - netdata.start(); -} -start_when_configuring_ends(); - -//netdata.debug('netdata object:') -//netdata.debug(netdata); diff --git a/collectors/node.d.plugin/node_modules/asn1-ber.js b/collectors/node.d.plugin/node_modules/asn1-ber.js deleted file mode 100644 index 55c8f688e..000000000 --- a/collectors/node.d.plugin/node_modules/asn1-ber.js +++ /dev/null @@ -1,7 +0,0 @@ -// SPDX-License-Identifier: MIT - -var Ber = require('./lib/ber/index') - -exports.Ber = Ber -exports.BerReader = Ber.Reader -exports.BerWriter = Ber.Writer diff --git a/collectors/node.d.plugin/node_modules/extend.js b/collectors/node.d.plugin/node_modules/extend.js deleted file mode 100644 index 3cd2e9155..000000000 --- a/collectors/node.d.plugin/node_modules/extend.js +++ /dev/null @@ -1,88 +0,0 @@ -// https://github.com/justmoon/node-extend -// SPDX-License-Identifier: MIT - -'use strict'; - -var hasOwn = Object.prototype.hasOwnProperty; -var toStr = Object.prototype.toString; - -var isArray = function isArray(arr) { - if (typeof Array.isArray === 'function') { - return Array.isArray(arr); - } - - return toStr.call(arr) === '[object Array]'; -}; - -var isPlainObject = function isPlainObject(obj) { - if (!obj || toStr.call(obj) !== '[object Object]') { - return false; - } - - var hasOwnConstructor = hasOwn.call(obj, 'constructor'); - var hasIsPrototypeOf = obj.constructor && obj.constructor.prototype && hasOwn.call(obj.constructor.prototype, 'isPrototypeOf'); - // Not own constructor property must be Object - if (obj.constructor && !hasOwnConstructor && !hasIsPrototypeOf) { - return false; - } - - // Own properties are enumerated firstly, so to speed up, - // if last one is own, then all properties are own. - var key; - for (key in obj) { /**/ } - - return typeof key === 'undefined' || hasOwn.call(obj, key); -}; - -module.exports = function extend() { - var options, name, src, copy, copyIsArray, clone; - var target = arguments[0]; - var i = 1; - var length = arguments.length; - var deep = false; - - // Handle a deep copy situation - if (typeof target === 'boolean') { - deep = target; - target = arguments[1] || {}; - // skip the boolean and the target - i = 2; - } else if ((typeof target !== 'object' && typeof target !== 'function') || target == null) { - target = {}; - } - - for (; i < length; ++i) { - options = arguments[i]; - // Only deal with non-null/undefined values - if (options != null) { - // Extend the base object - for (name in options) { - src = target[name]; - copy = options[name]; - - // Prevent never-ending loop - if (target !== copy) { - // Recurse if we're merging plain objects or arrays - if (deep && copy && (isPlainObject(copy) || (copyIsArray = isArray(copy)))) { - if (copyIsArray) { - copyIsArray = false; - clone = src && isArray(src) ? src : []; - } else { - clone = src && isPlainObject(src) ? src : {}; - } - - // Never move original objects, clone them - target[name] = extend(deep, clone, copy); - - // Don't bring in undefined values - } else if (typeof copy !== 'undefined') { - target[name] = copy; - } - } - } - } - } - - // Return the modified object - return target; -}; diff --git a/collectors/node.d.plugin/node_modules/lib/ber/errors.js b/collectors/node.d.plugin/node_modules/lib/ber/errors.js deleted file mode 100644 index 1c0df7b13..000000000 --- a/collectors/node.d.plugin/node_modules/lib/ber/errors.js +++ /dev/null @@ -1,10 +0,0 @@ -// SPDX-License-Identifier: MIT - -module.exports = { - InvalidAsn1Error: function(msg) { - var e = new Error() - e.name = 'InvalidAsn1Error' - e.message = msg || '' - return e - } -} diff --git a/collectors/node.d.plugin/node_modules/lib/ber/index.js b/collectors/node.d.plugin/node_modules/lib/ber/index.js deleted file mode 100644 index eb69ec526..000000000 --- a/collectors/node.d.plugin/node_modules/lib/ber/index.js +++ /dev/null @@ -1,18 +0,0 @@ -// SPDX-License-Identifier: MIT - -var errors = require('./errors') -var types = require('./types') - -var Reader = require('./reader') -var Writer = require('./writer') - -for (var t in types) - if (types.hasOwnProperty(t)) - exports[t] = types[t] - -for (var e in errors) - if (errors.hasOwnProperty(e)) - exports[e] = errors[e] - -exports.Reader = Reader -exports.Writer = Writer diff --git a/collectors/node.d.plugin/node_modules/lib/ber/reader.js b/collectors/node.d.plugin/node_modules/lib/ber/reader.js deleted file mode 100644 index 06decf4b9..000000000 --- a/collectors/node.d.plugin/node_modules/lib/ber/reader.js +++ /dev/null @@ -1,270 +0,0 @@ -// SPDX-License-Identifier: MIT - -var assert = require('assert'); - -var ASN1 = require('./types'); -var errors = require('./errors'); - - -///--- Globals - -var InvalidAsn1Error = errors.InvalidAsn1Error; - - - -///--- API - -function Reader(data) { - if (!data || !Buffer.isBuffer(data)) - throw new TypeError('data must be a node Buffer'); - - this._buf = data; - this._size = data.length; - - // These hold the "current" state - this._len = 0; - this._offset = 0; -} - -Object.defineProperty(Reader.prototype, 'length', { - enumerable: true, - get: function () { return (this._len); } -}); - -Object.defineProperty(Reader.prototype, 'offset', { - enumerable: true, - get: function () { return (this._offset); } -}); - -Object.defineProperty(Reader.prototype, 'remain', { - get: function () { return (this._size - this._offset); } -}); - -Object.defineProperty(Reader.prototype, 'buffer', { - get: function () { return (this._buf.slice(this._offset)); } -}); - - -/** - * Reads a single byte and advances offset; you can pass in `true` to make this - * a "peek" operation (i.e., get the byte, but don't advance the offset). - * - * @param {Boolean} peek true means don't move offset. - * @return {Number} the next byte, null if not enough data. - */ -Reader.prototype.readByte = function(peek) { - if (this._size - this._offset < 1) - return null; - - var b = this._buf[this._offset] & 0xff; - - if (!peek) - this._offset += 1; - - return b; -}; - - -Reader.prototype.peek = function() { - return this.readByte(true); -}; - - -/** - * Reads a (potentially) variable length off the BER buffer. This call is - * not really meant to be called directly, as callers have to manipulate - * the internal buffer afterwards. - * - * As a result of this call, you can call `Reader.length`, until the - * next thing called that does a readLength. - * - * @return {Number} the amount of offset to advance the buffer. - * @throws {InvalidAsn1Error} on bad ASN.1 - */ -Reader.prototype.readLength = function(offset) { - if (offset === undefined) - offset = this._offset; - - if (offset >= this._size) - return null; - - var lenB = this._buf[offset++] & 0xff; - if (lenB === null) - return null; - - if ((lenB & 0x80) == 0x80) { - lenB &= 0x7f; - - if (lenB == 0) - throw InvalidAsn1Error('Indefinite length not supported'); - - if (lenB > 4) - throw InvalidAsn1Error('encoding too long'); - - if (this._size - offset < lenB) - return null; - - this._len = 0; - for (var i = 0; i < lenB; i++) - this._len = (this._len << 8) + (this._buf[offset++] & 0xff); - - } else { - // Wasn't a variable length - this._len = lenB; - } - - return offset; -}; - - -/** - * Parses the next sequence in this BER buffer. - * - * To get the length of the sequence, call `Reader.length`. - * - * @return {Number} the sequence's tag. - */ -Reader.prototype.readSequence = function(tag) { - var seq = this.peek(); - if (seq === null) - return null; - if (tag !== undefined && tag !== seq) - throw InvalidAsn1Error('Expected 0x' + tag.toString(16) + - ': got 0x' + seq.toString(16)); - - var o = this.readLength(this._offset + 1); // stored in `length` - if (o === null) - return null; - - this._offset = o; - return seq; -}; - - -Reader.prototype.readInt = function(tag) { - if (typeof(tag) !== 'number') - tag = ASN1.Integer; - - return this._readTag(ASN1.Integer); -}; - - -Reader.prototype.readBoolean = function(tag) { - if (typeof(tag) !== 'number') - tag = ASN1.Boolean; - - return (this._readTag(tag) === 0 ? false : true); -}; - - -Reader.prototype.readEnumeration = function(tag) { - if (typeof(tag) !== 'number') - tag = ASN1.Enumeration; - - return this._readTag(ASN1.Enumeration); -}; - - -Reader.prototype.readString = function(tag, retbuf) { - if (!tag) - tag = ASN1.OctetString; - - var b = this.peek(); - if (b === null) - return null; - - if (b !== tag) - throw InvalidAsn1Error('Expected 0x' + tag.toString(16) + - ': got 0x' + b.toString(16)); - - var o = this.readLength(this._offset + 1); // stored in `length` - - if (o === null) - return null; - - if (this.length > this._size - o) - return null; - - this._offset = o; - - if (this.length === 0) - return retbuf ? new Buffer(0) : ''; - - var str = this._buf.slice(this._offset, this._offset + this.length); - this._offset += this.length; - - return retbuf ? str : str.toString('utf8'); -}; - -Reader.prototype.readOID = function(tag) { - if (!tag) - tag = ASN1.OID; - - var b = this.readString(tag, true); - if (b === null) - return null; - - var values = []; - var value = 0; - - for (var i = 0; i < b.length; i++) { - var byte = b[i] & 0xff; - - value <<= 7; - value += byte & 0x7f; - if ((byte & 0x80) == 0) { - values.push(value >>> 0); - value = 0; - } - } - - value = values.shift(); - values.unshift(value % 40); - values.unshift((value / 40) >> 0); - - return values.join('.'); -}; - - -Reader.prototype._readTag = function(tag) { - assert.ok(tag !== undefined); - - var b = this.peek(); - - if (b === null) - return null; - - if (b !== tag) - throw InvalidAsn1Error('Expected 0x' + tag.toString(16) + - ': got 0x' + b.toString(16)); - - var o = this.readLength(this._offset + 1); // stored in `length` - if (o === null) - return null; - - if (this.length > 4) - throw InvalidAsn1Error('Integer too long: ' + this.length); - - if (this.length > this._size - o) - return null; - this._offset = o; - - var fb = this._buf[this._offset]; - var value = 0; - - for (var i = 0; i < this.length; i++) { - value <<= 8; - value |= (this._buf[this._offset++] & 0xff); - } - - if ((fb & 0x80) == 0x80 && i !== 4) - value -= (1 << (i * 8)); - - return value >> 0; -}; - - - -///--- Exported API - -module.exports = Reader; diff --git a/collectors/node.d.plugin/node_modules/lib/ber/types.js b/collectors/node.d.plugin/node_modules/lib/ber/types.js deleted file mode 100644 index 7519ddcf5..000000000 --- a/collectors/node.d.plugin/node_modules/lib/ber/types.js +++ /dev/null @@ -1,35 +0,0 @@ -// SPDX-License-Identifier: MIT - -module.exports = { - EOC: 0, - Boolean: 1, - Integer: 2, - BitString: 3, - OctetString: 4, - Null: 5, - OID: 6, - ObjectDescriptor: 7, - External: 8, - Real: 9, - Enumeration: 10, - PDV: 11, - Utf8String: 12, - RelativeOID: 13, - Sequence: 16, - Set: 17, - NumericString: 18, - PrintableString: 19, - T61String: 20, - VideotexString: 21, - IA5String: 22, - UTCTime: 23, - GeneralizedTime: 24, - GraphicString: 25, - VisibleString: 26, - GeneralString: 28, - UniversalString: 29, - CharacterString: 30, - BMPString: 31, - Constructor: 32, - Context: 128 -} diff --git a/collectors/node.d.plugin/node_modules/lib/ber/writer.js b/collectors/node.d.plugin/node_modules/lib/ber/writer.js deleted file mode 100644 index d3a718f14..000000000 --- a/collectors/node.d.plugin/node_modules/lib/ber/writer.js +++ /dev/null @@ -1,318 +0,0 @@ -// SPDX-License-Identifier: MIT - -var assert = require('assert'); -var ASN1 = require('./types'); -var errors = require('./errors'); - - -///--- Globals - -var InvalidAsn1Error = errors.InvalidAsn1Error; - -var DEFAULT_OPTS = { - size: 1024, - growthFactor: 8 -}; - - -///--- Helpers - -function merge(from, to) { - assert.ok(from); - assert.equal(typeof(from), 'object'); - assert.ok(to); - assert.equal(typeof(to), 'object'); - - var keys = Object.getOwnPropertyNames(from); - keys.forEach(function(key) { - if (to[key]) - return; - - var value = Object.getOwnPropertyDescriptor(from, key); - Object.defineProperty(to, key, value); - }); - - return to; -} - - - -///--- API - -function Writer(options) { - options = merge(DEFAULT_OPTS, options || {}); - - this._buf = new Buffer(options.size || 1024); - this._size = this._buf.length; - this._offset = 0; - this._options = options; - - // A list of offsets in the buffer where we need to insert - // sequence tag/len pairs. - this._seq = []; -} - -Object.defineProperty(Writer.prototype, 'buffer', { - get: function () { - if (this._seq.length) - throw new InvalidAsn1Error(this._seq.length + ' unended sequence(s)'); - - return (this._buf.slice(0, this._offset)); - } -}); - -Writer.prototype.writeByte = function(b) { - if (typeof(b) !== 'number') - throw new TypeError('argument must be a Number'); - - this._ensure(1); - this._buf[this._offset++] = b; -}; - - -Writer.prototype.writeInt = function(i, tag) { - if (typeof(i) !== 'number') - throw new TypeError('argument must be a Number'); - if (typeof(tag) !== 'number') - tag = ASN1.Integer; - - var sz = 4; - - while ((((i & 0xff800000) === 0) || ((i & 0xff800000) === 0xff800000 >> 0)) && - (sz > 1)) { - sz--; - i <<= 8; - } - - if (sz > 4) - throw new InvalidAsn1Error('BER ints cannot be > 0xffffffff'); - - this._ensure(2 + sz); - this._buf[this._offset++] = tag; - this._buf[this._offset++] = sz; - - while (sz-- > 0) { - this._buf[this._offset++] = ((i & 0xff000000) >>> 24); - i <<= 8; - } - -}; - - -Writer.prototype.writeNull = function() { - this.writeByte(ASN1.Null); - this.writeByte(0x00); -}; - - -Writer.prototype.writeEnumeration = function(i, tag) { - if (typeof(i) !== 'number') - throw new TypeError('argument must be a Number'); - if (typeof(tag) !== 'number') - tag = ASN1.Enumeration; - - return this.writeInt(i, tag); -}; - - -Writer.prototype.writeBoolean = function(b, tag) { - if (typeof(b) !== 'boolean') - throw new TypeError('argument must be a Boolean'); - if (typeof(tag) !== 'number') - tag = ASN1.Boolean; - - this._ensure(3); - this._buf[this._offset++] = tag; - this._buf[this._offset++] = 0x01; - this._buf[this._offset++] = b ? 0xff : 0x00; -}; - - -Writer.prototype.writeString = function(s, tag) { - if (typeof(s) !== 'string') - throw new TypeError('argument must be a string (was: ' + typeof(s) + ')'); - if (typeof(tag) !== 'number') - tag = ASN1.OctetString; - - var len = Buffer.byteLength(s); - this.writeByte(tag); - this.writeLength(len); - if (len) { - this._ensure(len); - this._buf.write(s, this._offset); - this._offset += len; - } -}; - - -Writer.prototype.writeBuffer = function(buf, tag) { - if (!Buffer.isBuffer(buf)) - throw new TypeError('argument must be a buffer'); - - // If no tag is specified we will assume `buf` already contains tag and length - if (typeof(tag) === 'number') { - this.writeByte(tag); - this.writeLength(buf.length); - } - - this._ensure(buf.length); - buf.copy(this._buf, this._offset, 0, buf.length); - this._offset += buf.length; -}; - - -Writer.prototype.writeStringArray = function(strings, tag) { - if (! (strings instanceof Array)) - throw new TypeError('argument must be an Array[String]'); - - var self = this; - strings.forEach(function(s) { - self.writeString(s, tag); - }); -}; - -// This is really to solve DER cases, but whatever for now -Writer.prototype.writeOID = function(s, tag) { - if (typeof(s) !== 'string') - throw new TypeError('argument must be a string'); - if (typeof(tag) !== 'number') - tag = ASN1.OID; - - if (!/^([0-9]+\.){3,}[0-9]+$/.test(s)) - throw new Error('argument is not a valid OID string'); - - function encodeOctet(bytes, octet) { - if (octet < 128) { - bytes.push(octet); - } else if (octet < 16384) { - bytes.push((octet >>> 7) | 0x80); - bytes.push(octet & 0x7F); - } else if (octet < 2097152) { - bytes.push((octet >>> 14) | 0x80); - bytes.push(((octet >>> 7) | 0x80) & 0xFF); - bytes.push(octet & 0x7F); - } else if (octet < 268435456) { - bytes.push((octet >>> 21) | 0x80); - bytes.push(((octet >>> 14) | 0x80) & 0xFF); - bytes.push(((octet >>> 7) | 0x80) & 0xFF); - bytes.push(octet & 0x7F); - } else { - bytes.push(((octet >>> 28) | 0x80) & 0xFF); - bytes.push(((octet >>> 21) | 0x80) & 0xFF); - bytes.push(((octet >>> 14) | 0x80) & 0xFF); - bytes.push(((octet >>> 7) | 0x80) & 0xFF); - bytes.push(octet & 0x7F); - } - } - - var tmp = s.split('.'); - var bytes = []; - bytes.push(parseInt(tmp[0], 10) * 40 + parseInt(tmp[1], 10)); - tmp.slice(2).forEach(function(b) { - encodeOctet(bytes, parseInt(b, 10)); - }); - - var self = this; - this._ensure(2 + bytes.length); - this.writeByte(tag); - this.writeLength(bytes.length); - bytes.forEach(function(b) { - self.writeByte(b); - }); -}; - - -Writer.prototype.writeLength = function(len) { - if (typeof(len) !== 'number') - throw new TypeError('argument must be a Number'); - - this._ensure(4); - - if (len <= 0x7f) { - this._buf[this._offset++] = len; - } else if (len <= 0xff) { - this._buf[this._offset++] = 0x81; - this._buf[this._offset++] = len; - } else if (len <= 0xffff) { - this._buf[this._offset++] = 0x82; - this._buf[this._offset++] = len >> 8; - this._buf[this._offset++] = len; - } else if (len <= 0xffffff) { - this._buf[this._offset++] = 0x83; - this._buf[this._offset++] = len >> 16; - this._buf[this._offset++] = len >> 8; - this._buf[this._offset++] = len; - } else { - throw new InvalidAsn1Error('Length too long (> 4 bytes)'); - } -}; - -Writer.prototype.startSequence = function(tag) { - if (typeof(tag) !== 'number') - tag = ASN1.Sequence | ASN1.Constructor; - - this.writeByte(tag); - this._seq.push(this._offset); - this._ensure(3); - this._offset += 3; -}; - - -Writer.prototype.endSequence = function() { - var seq = this._seq.pop(); - var start = seq + 3; - var len = this._offset - start; - - if (len <= 0x7f) { - this._shift(start, len, -2); - this._buf[seq] = len; - } else if (len <= 0xff) { - this._shift(start, len, -1); - this._buf[seq] = 0x81; - this._buf[seq + 1] = len; - } else if (len <= 0xffff) { - this._buf[seq] = 0x82; - this._buf[seq + 1] = len >> 8; - this._buf[seq + 2] = len; - } else if (len <= 0xffffff) { - this._shift(start, len, 1); - this._buf[seq] = 0x83; - this._buf[seq + 1] = len >> 16; - this._buf[seq + 2] = len >> 8; - this._buf[seq + 3] = len; - } else { - throw new InvalidAsn1Error('Sequence too long'); - } -}; - - -Writer.prototype._shift = function(start, len, shift) { - assert.ok(start !== undefined); - assert.ok(len !== undefined); - assert.ok(shift); - - this._buf.copy(this._buf, start + shift, start, start + len); - this._offset += shift; -}; - -Writer.prototype._ensure = function(len) { - assert.ok(len); - - if (this._size - this._offset < len) { - var sz = this._size * this._options.growthFactor; - if (sz - this._offset < len) - sz += len; - - var buf = new Buffer(sz); - - this._buf.copy(buf, 0, 0, this._offset); - this._buf = buf; - this._size = sz; - } -}; - - - -///--- Exported API - -module.exports = Writer; diff --git a/collectors/node.d.plugin/node_modules/net-snmp.js b/collectors/node.d.plugin/node_modules/net-snmp.js deleted file mode 100644 index 6b5b754ea..000000000 --- a/collectors/node.d.plugin/node_modules/net-snmp.js +++ /dev/null @@ -1,3452 +0,0 @@ -// Copyright 2013 Stephen Vickers <stephen.vickers.sv@gmail.com> -// SPDX-License-Identifier: MIT - -var ber = require("asn1-ber").Ber; -var dgram = require("dgram"); -var events = require("events"); -var util = require("util"); -var crypto = require("crypto"); - -var DEBUG = false; - -var MAX_INT32 = 2147483647; - -function debug(line) { - if (DEBUG) { - console.debug(line); - } -} - -/***************************************************************************** - ** Constants - **/ - - -function _expandConstantObject(object) { - var keys = []; - for (var key in object) - keys.push(key); - for (var i = 0; i < keys.length; i++) - object[object[keys[i]]] = parseInt(keys[i]); -} - -var ErrorStatus = { - 0: "NoError", - 1: "TooBig", - 2: "NoSuchName", - 3: "BadValue", - 4: "ReadOnly", - 5: "GeneralError", - 6: "NoAccess", - 7: "WrongType", - 8: "WrongLength", - 9: "WrongEncoding", - 10: "WrongValue", - 11: "NoCreation", - 12: "InconsistentValue", - 13: "ResourceUnavailable", - 14: "CommitFailed", - 15: "UndoFailed", - 16: "AuthorizationError", - 17: "NotWritable", - 18: "InconsistentName" -}; - -_expandConstantObject(ErrorStatus); - -var ObjectType = { - 1: "Boolean", - 2: "Integer", - 4: "OctetString", - 5: "Null", - 6: "OID", - 64: "IpAddress", - 65: "Counter", - 66: "Gauge", - 67: "TimeTicks", - 68: "Opaque", - 70: "Counter64", - 128: "NoSuchObject", - 129: "NoSuchInstance", - 130: "EndOfMibView" -}; - -_expandConstantObject(ObjectType); - -ObjectType.Integer32 = ObjectType.Integer; -ObjectType.Counter32 = ObjectType.Counter; -ObjectType.Gauge32 = ObjectType.Gauge; -ObjectType.Unsigned32 = ObjectType.Gauge32; - -var PduType = { - 160: "GetRequest", - 161: "GetNextRequest", - 162: "GetResponse", - 163: "SetRequest", - 164: "Trap", - 165: "GetBulkRequest", - 166: "InformRequest", - 167: "TrapV2", - 168: "Report" -}; - -_expandConstantObject(PduType); - -var TrapType = { - 0: "ColdStart", - 1: "WarmStart", - 2: "LinkDown", - 3: "LinkUp", - 4: "AuthenticationFailure", - 5: "EgpNeighborLoss", - 6: "EnterpriseSpecific" -}; - -_expandConstantObject(TrapType); - -var SecurityLevel = { - 1: "noAuthNoPriv", - 2: "authNoPriv", - 3: "authPriv" -}; - -_expandConstantObject(SecurityLevel); - -var AuthProtocols = { - "1": "none", - "2": "md5", - "3": "sha" -}; - -_expandConstantObject(AuthProtocols); - -var PrivProtocols = { - "1": "none", - "2": "des" -}; - -_expandConstantObject(PrivProtocols); - -var MibProviderType = { - "1": "Scalar", - "2": "Table" -}; - -_expandConstantObject(MibProviderType); - -var Version1 = 0; -var Version2c = 1; -var Version3 = 3; - -var Version = { - "1": Version1, - "2c": Version2c, - "3": Version3 -}; - -/***************************************************************************** - ** Exception class definitions - **/ - -function ResponseInvalidError(message) { - this.name = "ResponseInvalidError"; - this.message = message; - Error.captureStackTrace(this, ResponseInvalidError); -} - -util.inherits(ResponseInvalidError, Error); - -function RequestInvalidError(message) { - this.name = "RequestInvalidError"; - this.message = message; - Error.captureStackTrace(this, RequestInvalidError); -} - -util.inherits(RequestInvalidError, Error); - -function RequestFailedError(message, status) { - this.name = "RequestFailedError"; - this.message = message; - this.status = status; - Error.captureStackTrace(this, RequestFailedError); -} - -util.inherits(RequestFailedError, Error); - -function RequestTimedOutError(message) { - this.name = "RequestTimedOutError"; - this.message = message; - Error.captureStackTrace(this, RequestTimedOutError); -} - -util.inherits(RequestTimedOutError, Error); - -/***************************************************************************** - ** OID and varbind helper functions - **/ - -function isVarbindError(varbind) { - return !!(varbind.type == ObjectType.NoSuchObject - || varbind.type == ObjectType.NoSuchInstance - || varbind.type == ObjectType.EndOfMibView); -} - -function varbindError(varbind) { - return (ObjectType[varbind.type] || "NotAnError") + ": " + varbind.oid; -} - -function oidFollowsOid(oidString, nextString) { - var oid = {str: oidString, len: oidString.length, idx: 0}; - var next = {str: nextString, len: nextString.length, idx: 0}; - var dotCharCode = ".".charCodeAt(0); - - function getNumber(item) { - var n = 0; - if (item.idx >= item.len) - return null; - while (item.idx < item.len) { - var charCode = item.str.charCodeAt(item.idx++); - if (charCode == dotCharCode) - return n; - n = (n ? (n * 10) : n) + (charCode - 48); - } - return n; - } - - while (1) { - var oidNumber = getNumber(oid); - var nextNumber = getNumber(next); - - if (oidNumber !== null) { - if (nextNumber !== null) { - if (nextNumber > oidNumber) { - return true; - } else if (nextNumber < oidNumber) { - return false; - } - } else { - return true; - } - } else { - return true; - } - } -} - -function oidInSubtree(oidString, nextString) { - var oid = oidString.split("."); - var next = nextString.split("."); - - if (oid.length > next.length) - return false; - - for (var i = 0; i < oid.length; i++) { - if (next[i] != oid[i]) - return false; - } - - return true; -} - -/** - ** Some SNMP agents produce integers on the wire such as 00 ff ff ff ff. - ** The ASN.1 BER parser we use throws an error when parsing this, which we - ** believe is correct. So, we decided not to bother the "asn1" developer(s) - ** with this, instead opting to work around it here. - ** - ** If an integer is 5 bytes in length we check if the first byte is 0, and if so - ** simply drop it and parse it like it was a 4 byte integer, otherwise throw - ** an error since the integer is too large. - **/ - -function readInt(buffer) { - return readUint(buffer, true); -} - -function readIpAddress(buffer) { - var bytes = buffer.readString(ObjectType.IpAddress, true); - if (bytes.length != 4) - throw new ResponseInvalidError("Length '" + bytes.length - + "' of IP address '" + bytes.toString("hex") - + "' is not 4"); - var value = bytes[0] + "." + bytes[1] + "." + bytes[2] + "." + bytes[3]; - return value; -} - -function readUint(buffer, isSigned) { - buffer.readByte(); - var length = buffer.readByte(); - var value = 0; - var signedBitSet = false; - - if (length > 5) { - throw new RangeError("Integer too long '" + length + "'"); - } else if (length == 5) { - if (buffer.readByte() !== 0) - throw new RangeError("Integer too long '" + length + "'"); - length = 4; - } - - for (var i = 0; i < length; i++) { - value *= 256; - value += buffer.readByte(); - - if (isSigned && i <= 0) { - if ((value & 0x80) == 0x80) - signedBitSet = true; - } - } - - if (signedBitSet) - value -= (1 << (i * 8)); - - return value; -} - -function readUint64(buffer) { - var value = buffer.readString(ObjectType.Counter64, true); - - return value; -} - -function readVarbinds(buffer, varbinds) { - buffer.readSequence(); - - while (1) { - buffer.readSequence(); - if (buffer.peek() != ObjectType.OID) - break; - var oid = buffer.readOID(); - var type = buffer.peek(); - - if (type == null) - break; - - var value; - - if (type == ObjectType.Boolean) { - value = buffer.readBoolean(); - } else if (type == ObjectType.Integer) { - value = readInt(buffer); - } else if (type == ObjectType.OctetString) { - value = buffer.readString(null, true); - } else if (type == ObjectType.Null) { - buffer.readByte(); - buffer.readByte(); - value = null; - } else if (type == ObjectType.OID) { - value = buffer.readOID(); - } else if (type == ObjectType.IpAddress) { - var bytes = buffer.readString(ObjectType.IpAddress, true); - if (bytes.length != 4) - throw new ResponseInvalidError("Length '" + bytes.length - + "' of IP address '" + bytes.toString("hex") - + "' is not 4"); - value = bytes[0] + "." + bytes[1] + "." + bytes[2] + "." + bytes[3]; - } else if (type == ObjectType.Counter) { - value = readUint(buffer); - } else if (type == ObjectType.Gauge) { - value = readUint(buffer); - } else if (type == ObjectType.TimeTicks) { - value = readUint(buffer); - } else if (type == ObjectType.Opaque) { - value = buffer.readString(ObjectType.Opaque, true); - } else if (type == ObjectType.Counter64) { - value = readUint64(buffer); - } else if (type == ObjectType.NoSuchObject) { - buffer.readByte(); - buffer.readByte(); - value = null; - } else if (type == ObjectType.NoSuchInstance) { - buffer.readByte(); - buffer.readByte(); - value = null; - } else if (type == ObjectType.EndOfMibView) { - buffer.readByte(); - buffer.readByte(); - value = null; - } else { - throw new ResponseInvalidError("Unknown type '" + type - + "' in response"); - } - - varbinds.push({ - oid: oid, - type: type, - value: value - }); - } -} - -function writeUint(buffer, type, value) { - var b = Buffer.alloc(4); - b.writeUInt32BE(value, 0); - buffer.writeBuffer(b, type); -} - -function writeUint64(buffer, value) { - buffer.writeBuffer(value, ObjectType.Counter64); -} - -function writeVarbinds(buffer, varbinds) { - buffer.startSequence(); - for (var i = 0; i < varbinds.length; i++) { - buffer.startSequence(); - buffer.writeOID(varbinds[i].oid); - - if (varbinds[i].type && varbinds[i].hasOwnProperty("value")) { - var type = varbinds[i].type; - var value = varbinds[i].value; - - if (type == ObjectType.Boolean) { - buffer.writeBoolean(value ? true : false); - } else if (type == ObjectType.Integer) { // also Integer32 - buffer.writeInt(value); - } else if (type == ObjectType.OctetString) { - if (typeof value == "string") - buffer.writeString(value); - else - buffer.writeBuffer(value, ObjectType.OctetString); - } else if (type == ObjectType.Null) { - buffer.writeNull(); - } else if (type == ObjectType.OID) { - buffer.writeOID(value); - } else if (type == ObjectType.IpAddress) { - var bytes = value.split("."); - if (bytes.length != 4) - throw new RequestInvalidError("Invalid IP address '" - + value + "'"); - buffer.writeBuffer(Buffer.from(bytes), 64); - } else if (type == ObjectType.Counter) { // also Counter32 - writeUint(buffer, ObjectType.Counter, value); - } else if (type == ObjectType.Gauge) { // also Gauge32 & Unsigned32 - writeUint(buffer, ObjectType.Gauge, value); - } else if (type == ObjectType.TimeTicks) { - writeUint(buffer, ObjectType.TimeTicks, value); - } else if (type == ObjectType.Opaque) { - buffer.writeBuffer(value, ObjectType.Opaque); - } else if (type == ObjectType.Counter64) { - writeUint64(buffer, value); - } else if (type == ObjectType.EndOfMibView) { - buffer.writeByte(130); - buffer.writeByte(0); - } else { - throw new RequestInvalidError("Unknown type '" + type - + "' in request"); - } - } else { - buffer.writeNull(); - } - - buffer.endSequence(); - } - buffer.endSequence(); -} - -/***************************************************************************** - ** PDU class definitions - **/ - -var SimplePdu = function () { -}; - -SimplePdu.prototype.toBuffer = function (buffer) { - buffer.startSequence(this.type); - - buffer.writeInt(this.id); - buffer.writeInt((this.type == PduType.GetBulkRequest) - ? (this.options.nonRepeaters || 0) - : 0); - buffer.writeInt((this.type == PduType.GetBulkRequest) - ? (this.options.maxRepetitions || 0) - : 0); - - writeVarbinds(buffer, this.varbinds); - - buffer.endSequence(); -}; - -SimplePdu.prototype.initializeFromVariables = function (id, varbinds, options) { - this.id = id; - this.varbinds = varbinds; - this.options = options || {}; - this.contextName = (options && options.context) ? options.context : ""; -} - -SimplePdu.prototype.initializeFromBuffer = function (reader) { - this.type = reader.peek(); - reader.readSequence(); - - this.id = reader.readInt(); - this.nonRepeaters = reader.readInt(); - this.maxRepetitions = reader.readInt(); - - this.varbinds = []; - readVarbinds(reader, this.varbinds); - -}; - -SimplePdu.prototype.getResponsePduForRequest = function () { - var responsePdu = GetResponsePdu.createFromVariables(this.id, [], {}); - if (this.contextEngineID) { - responsePdu.contextEngineID = this.contextEngineID; - responsePdu.contextName = this.contextName; - } - return responsePdu; -}; - -SimplePdu.createFromVariables = function (pduClass, id, varbinds, options) { - var pdu = new pduClass(id, varbinds, options); - pdu.id = id; - pdu.varbinds = varbinds; - pdu.options = options || {}; - pdu.contextName = (options && options.context) ? options.context : ""; - return pdu; -}; - -var GetBulkRequestPdu = function () { - this.type = PduType.GetBulkRequest; - GetBulkRequestPdu.super_.apply(this, arguments); -}; - -util.inherits(GetBulkRequestPdu, SimplePdu); - -GetBulkRequestPdu.createFromBuffer = function (reader) { - var pdu = new GetBulkRequestPdu(); - pdu.initializeFromBuffer(reader); - return pdu; -}; - -var GetNextRequestPdu = function () { - this.type = PduType.GetNextRequest; - GetNextRequestPdu.super_.apply(this, arguments); -}; - -util.inherits(GetNextRequestPdu, SimplePdu); - -GetNextRequestPdu.createFromBuffer = function (reader) { - var pdu = new GetNextRequestPdu(); - pdu.initializeFromBuffer(reader); - return pdu; -}; - -var GetRequestPdu = function () { - this.type = PduType.GetRequest; - GetRequestPdu.super_.apply(this, arguments); -}; - -util.inherits(GetRequestPdu, SimplePdu); - -GetRequestPdu.createFromBuffer = function (reader) { - var pdu = new GetRequestPdu(); - pdu.initializeFromBuffer(reader); - return pdu; -}; - -GetRequestPdu.createFromVariables = function (id, varbinds, options) { - var pdu = new GetRequestPdu(); - pdu.initializeFromVariables(id, varbinds, options); - return pdu; -}; - -var InformRequestPdu = function () { - this.type = PduType.InformRequest; - InformRequestPdu.super_.apply(this, arguments); -}; - -util.inherits(InformRequestPdu, SimplePdu); - -InformRequestPdu.createFromBuffer = function (reader) { - var pdu = new InformRequestPdu(); - pdu.initializeFromBuffer(reader); - return pdu; -}; - -var SetRequestPdu = function () { - this.type = PduType.SetRequest; - SetRequestPdu.super_.apply(this, arguments); -}; - -util.inherits(SetRequestPdu, SimplePdu); - -SetRequestPdu.createFromBuffer = function (reader) { - var pdu = new SetRequestPdu(); - pdu.initializeFromBuffer(reader); - return pdu; -}; - -var TrapPdu = function () { - this.type = PduType.Trap; -}; - -TrapPdu.prototype.toBuffer = function (buffer) { - buffer.startSequence(this.type); - - buffer.writeOID(this.enterprise); - buffer.writeBuffer(Buffer.from(this.agentAddr.split(".")), - ObjectType.IpAddress); - buffer.writeInt(this.generic); - buffer.writeInt(this.specific); - writeUint(buffer, ObjectType.TimeTicks, - this.upTime || Math.floor(process.uptime() * 100)); - - writeVarbinds(buffer, this.varbinds); - - buffer.endSequence(); -}; - -TrapPdu.createFromBuffer = function (reader) { - var pdu = new TrapPdu(); - reader.readSequence(); - - pdu.enterprise = reader.readOID(); - pdu.agentAddr = readIpAddress(reader); - pdu.generic = reader.readInt(); - pdu.specific = reader.readInt(); - pdu.upTime = readUint(reader) - - pdu.varbinds = []; - readVarbinds(reader, pdu.varbinds); - - return pdu; -}; - -TrapPdu.createFromVariables = function (typeOrOid, varbinds, options) { - var pdu = new TrapPdu(); - pdu.agentAddr = options.agentAddr || "127.0.0.1"; - pdu.upTime = options.upTime; - - if (typeof typeOrOid == "string") { - pdu.generic = TrapType.EnterpriseSpecific; - pdu.specific = parseInt(typeOrOid.match(/\.(\d+)$/)[1]); - pdu.enterprise = typeOrOid.replace(/\.(\d+)$/, ""); - } else { - pdu.generic = typeOrOid; - pdu.specific = 0; - pdu.enterprise = "1.3.6.1.4.1"; - } - - pdu.varbinds = varbinds; - - return pdu; -}; - -var TrapV2Pdu = function () { - this.type = PduType.TrapV2; - TrapV2Pdu.super_.apply(this, arguments); -}; - -util.inherits(TrapV2Pdu, SimplePdu); - -TrapV2Pdu.createFromBuffer = function (reader) { - var pdu = new TrapV2Pdu(); - pdu.initializeFromBuffer(reader); - return pdu; -}; - -TrapV2Pdu.createFromVariables = function (id, varbinds, options) { - var pdu = new TrapV2Pdu(); - pdu.initializeFromVariables(id, varbinds, options); - return pdu; -}; - -var SimpleResponsePdu = function () { -}; - -SimpleResponsePdu.prototype.toBuffer = function (writer) { - writer.startSequence(this.type); - - writer.writeInt(this.id); - writer.writeInt(this.errorStatus || 0); - writer.writeInt(this.errorIndex || 0); - writeVarbinds(writer, this.varbinds); - writer.endSequence(); - -}; - -SimpleResponsePdu.prototype.initializeFromBuffer = function (reader) { - reader.readSequence(this.type); - - this.id = reader.readInt(); - this.errorStatus = reader.readInt(); - this.errorIndex = reader.readInt(); - - this.varbinds = []; - readVarbinds(reader, this.varbinds); -}; - -SimpleResponsePdu.prototype.initializeFromVariables = function (id, varbinds, options) { - this.id = id; - this.varbinds = varbinds; - this.options = options || {}; -}; - -var GetResponsePdu = function () { - this.type = PduType.GetResponse; - GetResponsePdu.super_.apply(this, arguments); -}; - -util.inherits(GetResponsePdu, SimpleResponsePdu); - -GetResponsePdu.createFromBuffer = function (reader) { - var pdu = new GetResponsePdu(); - pdu.initializeFromBuffer(reader); - return pdu; -}; - -GetResponsePdu.createFromVariables = function (id, varbinds, options) { - var pdu = new GetResponsePdu(); - pdu.initializeFromVariables(id, varbinds, options); - return pdu; -}; - -var ReportPdu = function () { - this.type = PduType.Report; - ReportPdu.super_.apply(this, arguments); -}; - -util.inherits(ReportPdu, SimpleResponsePdu); - -ReportPdu.createFromBuffer = function (reader) { - var pdu = new ReportPdu(); - pdu.initializeFromBuffer(reader); - return pdu; -}; - -ReportPdu.createFromVariables = function (id, varbinds, options) { - var pdu = new ReportPdu(); - pdu.initializeFromVariables(id, varbinds, options); - return pdu; -}; - -var readPdu = function (reader, scoped) { - var pdu; - var contextEngineID; - var contextName; - if (scoped) { - reader.readSequence(); - contextEngineID = reader.readString(ber.OctetString, true); - contextName = reader.readString(); - } - var type = reader.peek(); - - if (type == PduType.GetResponse) { - pdu = GetResponsePdu.createFromBuffer(reader); - } else if (type == PduType.Report) { - pdu = ReportPdu.createFromBuffer(reader); - } else if (type == PduType.Trap) { - pdu = TrapPdu.createFromBuffer(reader); - } else if (type == PduType.TrapV2) { - pdu = TrapV2Pdu.createFromBuffer(reader); - } else if (type == PduType.InformRequest) { - pdu = InformRequestPdu.createFromBuffer(reader); - } else if (type == PduType.GetRequest) { - pdu = GetRequestPdu.createFromBuffer(reader); - } else if (type == PduType.SetRequest) { - pdu = SetRequestPdu.createFromBuffer(reader); - } else if (type == PduType.GetNextRequest) { - pdu = GetNextRequestPdu.createFromBuffer(reader); - } else if (type == PduType.GetBulkRequest) { - pdu = GetBulkRequestPdu.createFromBuffer(reader); - } else { - throw new ResponseInvalidError("Unknown PDU type '" + type - + "' in response"); - } - if (scoped) { - pdu.contextEngineID = contextEngineID; - pdu.contextName = contextName; - } - pdu.scoped = scoped; - return pdu; -}; - -var createDiscoveryPdu = function (context) { - return GetRequestPdu.createFromVariables(_generateId(), [], {context: context}); -}; - -var Authentication = {}; - -Authentication.HMAC_BUFFER_SIZE = 1024 * 1024; -Authentication.HMAC_BLOCK_SIZE = 64; -Authentication.AUTHENTICATION_CODE_LENGTH = 12; -Authentication.AUTH_PARAMETERS_PLACEHOLDER = Buffer.from('8182838485868788898a8b8c', 'hex'); - -Authentication.algorithms = {}; - -Authentication.algorithms[AuthProtocols.md5] = { - // KEY_LENGTH: 16, - CRYPTO_ALGORITHM: 'md5' -}; - -Authentication.algorithms[AuthProtocols.sha] = { - // KEY_LENGTH: 20, - CRYPTO_ALGORITHM: 'sha1' -}; - -// Adapted from RFC3414 Appendix A.2.1. Password to Key Sample Code for MD5 -Authentication.passwordToKey = function (authProtocol, authPasswordString, engineID) { - var hashAlgorithm; - var firstDigest; - var finalDigest; - var buf = Buffer.alloc(Authentication.HMAC_BUFFER_SIZE); - var bufOffset = 0; - var passwordIndex = 0; - var count = 0; - var password = Buffer.from(authPasswordString); - var cryptoAlgorithm = Authentication.algorithms[authProtocol].CRYPTO_ALGORITHM; - - while (count < Authentication.HMAC_BUFFER_SIZE) { - for (var i = 0; i < Authentication.HMAC_BLOCK_SIZE; i++) { - buf.writeUInt8(password[passwordIndex++ % password.length], bufOffset++); - } - count += Authentication.HMAC_BLOCK_SIZE; - } - hashAlgorithm = crypto.createHash(cryptoAlgorithm); - hashAlgorithm.update(buf); - firstDigest = hashAlgorithm.digest(); - // debug ("First digest: " + firstDigest.toString('hex')); - - hashAlgorithm = crypto.createHash(cryptoAlgorithm); - hashAlgorithm.update(firstDigest); - hashAlgorithm.update(engineID); - hashAlgorithm.update(firstDigest); - finalDigest = hashAlgorithm.digest(); - debug("Localized key: " + finalDigest.toString('hex')); - - return finalDigest; -}; - -Authentication.addParametersToMessageBuffer = function (messageBuffer, authProtocol, authPassword, engineID) { - var authenticationParametersOffset; - var digestToAdd; - - // clear the authenticationParameters field in message - authenticationParametersOffset = messageBuffer.indexOf(Authentication.AUTH_PARAMETERS_PLACEHOLDER); - messageBuffer.fill(0, authenticationParametersOffset, authenticationParametersOffset + Authentication.AUTHENTICATION_CODE_LENGTH); - - digestToAdd = Authentication.calculateDigest(messageBuffer, authProtocol, authPassword, engineID); - digestToAdd.copy(messageBuffer, authenticationParametersOffset, 0, Authentication.AUTHENTICATION_CODE_LENGTH); - debug("Added Auth Parameters: " + digestToAdd.toString('hex')); -}; - -Authentication.isAuthentic = function (messageBuffer, authProtocol, authPassword, engineID, digestInMessage) { - var authenticationParametersOffset; - var calculatedDigest; - - // clear the authenticationParameters field in message - authenticationParametersOffset = messageBuffer.indexOf(digestInMessage); - messageBuffer.fill(0, authenticationParametersOffset, authenticationParametersOffset + Authentication.AUTHENTICATION_CODE_LENGTH); - - calculatedDigest = Authentication.calculateDigest(messageBuffer, authProtocol, authPassword, engineID); - - // replace previously cleared authenticationParameters field in message - digestInMessage.copy(messageBuffer, authenticationParametersOffset, 0, Authentication.AUTHENTICATION_CODE_LENGTH); - - debug("Digest in message: " + digestInMessage.toString('hex')); - debug("Calculated digest: " + calculatedDigest.toString('hex')); - return calculatedDigest.equals(digestInMessage, Authentication.AUTHENTICATION_CODE_LENGTH); -}; - -Authentication.calculateDigest = function (messageBuffer, authProtocol, authPassword, engineID) { - var authKey = Authentication.passwordToKey(authProtocol, authPassword, engineID); - - // Adapted from RFC3147 Section 6.3.1. Processing an Outgoing Message - var hashAlgorithm; - var kIpad; - var kOpad; - var firstDigest; - var finalDigest; - var truncatedDigest; - var i; - var cryptoAlgorithm = Authentication.algorithms[authProtocol].CRYPTO_ALGORITHM; - - if (authKey.length > Authentication.HMAC_BLOCK_SIZE) { - hashAlgorithm = crypto.createHash(cryptoAlgorithm); - hashAlgorithm.update(authKey); - authKey = hashAlgorithm.digest(); - } - - // MD(K XOR opad, MD(K XOR ipad, msg)) - kIpad = Buffer.alloc(Authentication.HMAC_BLOCK_SIZE); - kOpad = Buffer.alloc(Authentication.HMAC_BLOCK_SIZE); - for (i = 0; i < authKey.length; i++) { - kIpad[i] = authKey[i] ^ 0x36; - kOpad[i] = authKey[i] ^ 0x5c; - } - kIpad.fill(0x36, authKey.length); - kOpad.fill(0x5c, authKey.length); - - // inner MD - hashAlgorithm = crypto.createHash(cryptoAlgorithm); - hashAlgorithm.update(kIpad); - hashAlgorithm.update(messageBuffer); - firstDigest = hashAlgorithm.digest(); - // outer MD - hashAlgorithm = crypto.createHash(cryptoAlgorithm); - hashAlgorithm.update(kOpad); - hashAlgorithm.update(firstDigest); - finalDigest = hashAlgorithm.digest(); - - truncatedDigest = Buffer.alloc(Authentication.AUTHENTICATION_CODE_LENGTH); - finalDigest.copy(truncatedDigest, 0, 0, Authentication.AUTHENTICATION_CODE_LENGTH); - return truncatedDigest; -}; - -var Encryption = {}; - -Encryption.INPUT_KEY_LENGTH = 16; -Encryption.DES_KEY_LENGTH = 8; -Encryption.DES_BLOCK_LENGTH = 8; -Encryption.CRYPTO_DES_ALGORITHM = 'des-cbc'; -Encryption.PRIV_PARAMETERS_PLACEHOLDER = Buffer.from('9192939495969798', 'hex'); - -Encryption.encryptPdu = function (scopedPdu, privProtocol, privPassword, authProtocol, engineID) { - var privLocalizedKey; - var encryptionKey; - var preIv; - var salt; - var iv; - var i; - var paddedScopedPduLength; - var paddedScopedPdu; - var encryptedPdu; - var cbcProtocol = Encryption.CRYPTO_DES_ALGORITHM; - - privLocalizedKey = Authentication.passwordToKey(authProtocol, privPassword, engineID); - encryptionKey = Buffer.alloc(Encryption.DES_KEY_LENGTH); - privLocalizedKey.copy(encryptionKey, 0, 0, Encryption.DES_KEY_LENGTH); - preIv = Buffer.alloc(Encryption.DES_BLOCK_LENGTH); - privLocalizedKey.copy(preIv, 0, Encryption.DES_KEY_LENGTH, Encryption.DES_KEY_LENGTH + Encryption.DES_BLOCK_LENGTH); - - salt = Buffer.alloc(Encryption.DES_BLOCK_LENGTH); - // set local SNMP engine boots part of salt to 1, as we have no persistent engine state - salt.fill('00000001', 0, 4, 'hex'); - // set local integer part of salt to random - salt.fill(crypto.randomBytes(4), 4, 8); - iv = Buffer.alloc(Encryption.DES_BLOCK_LENGTH); - for (i = 0; i < iv.length; i++) { - iv[i] = preIv[i] ^ salt[i]; - } - - if (scopedPdu.length % Encryption.DES_BLOCK_LENGTH == 0) { - paddedScopedPdu = scopedPdu; - } else { - paddedScopedPduLength = Encryption.DES_BLOCK_LENGTH * (Math.floor(scopedPdu.length / Encryption.DES_BLOCK_LENGTH) + 1); - paddedScopedPdu = Buffer.alloc(paddedScopedPduLength); - scopedPdu.copy(paddedScopedPdu, 0, 0, scopedPdu.length); - } - cipher = crypto.createCipheriv(cbcProtocol, encryptionKey, iv); - encryptedPdu = cipher.update(paddedScopedPdu); - encryptedPdu = Buffer.concat([encryptedPdu, cipher.final()]); - debug("Key: " + encryptionKey.toString('hex')); - debug("IV: " + iv.toString('hex')); - debug("Plain: " + paddedScopedPdu.toString('hex')); - debug("Encrypted: " + encryptedPdu.toString('hex')); - - return { - encryptedPdu: encryptedPdu, - msgPrivacyParameters: salt - }; -}; - -Encryption.decryptPdu = function (encryptedPdu, privProtocol, privParameters, privPassword, authProtocol, engineID, forceAutoPaddingDisable) { - var privLocalizedKey; - var decryptionKey; - var preIv; - var salt; - var iv; - var i; - var decryptedPdu; - var cbcProtocol = Encryption.CRYPTO_DES_ALGORITHM; - ; - - privLocalizedKey = Authentication.passwordToKey(authProtocol, privPassword, engineID); - decryptionKey = Buffer.alloc(Encryption.DES_KEY_LENGTH); - privLocalizedKey.copy(decryptionKey, 0, 0, Encryption.DES_KEY_LENGTH); - preIv = Buffer.alloc(Encryption.DES_BLOCK_LENGTH); - privLocalizedKey.copy(preIv, 0, Encryption.DES_KEY_LENGTH, Encryption.DES_KEY_LENGTH + Encryption.DES_BLOCK_LENGTH); - - salt = privParameters; - iv = Buffer.alloc(Encryption.DES_BLOCK_LENGTH); - for (i = 0; i < iv.length; i++) { - iv[i] = preIv[i] ^ salt[i]; - } - - decipher = crypto.createDecipheriv(cbcProtocol, decryptionKey, iv); - if (forceAutoPaddingDisable) { - decipher.setAutoPadding(false); - } - decryptedPdu = decipher.update(encryptedPdu); - // This try-catch is a workaround for a seemingly incorrect error condition - // - where sometimes a decrypt error is thrown with decipher.final() - // It replaces this line which should have been sufficient: - // decryptedPdu = Buffer.concat ([decryptedPdu, decipher.final()]); - try { - decryptedPdu = Buffer.concat([decryptedPdu, decipher.final()]); - } catch (error) { - // debug("Decrypt error: " + error); - decipher = crypto.createDecipheriv(cbcProtocol, decryptionKey, iv); - decipher.setAutoPadding(false); - decryptedPdu = decipher.update(encryptedPdu); - decryptedPdu = Buffer.concat([decryptedPdu, decipher.final()]); - } - debug("Key: " + decryptionKey.toString('hex')); - debug("IV: " + iv.toString('hex')); - debug("Encrypted: " + encryptedPdu.toString('hex')); - debug("Plain: " + decryptedPdu.toString('hex')); - - return decryptedPdu; - -}; - -Encryption.addParametersToMessageBuffer = function (messageBuffer, msgPrivacyParameters) { - privacyParametersOffset = messageBuffer.indexOf(Encryption.PRIV_PARAMETERS_PLACEHOLDER); - msgPrivacyParameters.copy(messageBuffer, privacyParametersOffset, 0, Encryption.DES_IV_LENGTH); -}; - -/***************************************************************************** - ** Message class definition - **/ - -var Message = function () { -} - -Message.prototype.getReqId = function () { - return this.version == Version3 ? this.msgGlobalData.msgID : this.pdu.id; -}; - -Message.prototype.toBuffer = function () { - if (this.version == Version3) { - return this.toBufferV3(); - } else { - return this.toBufferCommunity(); - } -} - -Message.prototype.toBufferCommunity = function () { - if (this.buffer) - return this.buffer; - - var writer = new ber.Writer(); - - writer.startSequence(); - - writer.writeInt(this.version); - writer.writeString(this.community); - - this.pdu.toBuffer(writer); - - writer.endSequence(); - - this.buffer = writer.buffer; - - return this.buffer; -}; - -Message.prototype.toBufferV3 = function () { - var encryptionResult; - - if (this.buffer) - return this.buffer; - - var writer = new ber.Writer(); - - writer.startSequence(); - - writer.writeInt(this.version); - - // HeaderData - writer.startSequence(); - writer.writeInt(this.msgGlobalData.msgID); - writer.writeInt(this.msgGlobalData.msgMaxSize); - writer.writeByte(ber.OctetString); - writer.writeByte(1); - writer.writeByte(this.msgGlobalData.msgFlags); - writer.writeInt(this.msgGlobalData.msgSecurityModel); - writer.endSequence(); - - // msgSecurityParameters - var msgSecurityParametersWriter = new ber.Writer(); - msgSecurityParametersWriter.startSequence(); - //msgSecurityParametersWriter.writeString (this.msgSecurityParameters.msgAuthoritativeEngineID); - // writing a zero-length buffer fails - should fix asn1-ber for this condition - if (this.msgSecurityParameters.msgAuthoritativeEngineID.length == 0) { - msgSecurityParametersWriter.writeString(""); - } else { - msgSecurityParametersWriter.writeBuffer(this.msgSecurityParameters.msgAuthoritativeEngineID, ber.OctetString); - } - msgSecurityParametersWriter.writeInt(this.msgSecurityParameters.msgAuthoritativeEngineBoots); - msgSecurityParametersWriter.writeInt(this.msgSecurityParameters.msgAuthoritativeEngineTime); - msgSecurityParametersWriter.writeString(this.msgSecurityParameters.msgUserName); - - if (this.hasAuthentication()) { - msgSecurityParametersWriter.writeBuffer(Authentication.AUTH_PARAMETERS_PLACEHOLDER, ber.OctetString); - // should never happen where msgFlags has no authentication but authentication parameters still present - } else if (this.msgSecurityParameters.msgAuthenticationParameters.length > 0) { - msgSecurityParametersWriter.writeBuffer(this.msgSecurityParameters.msgAuthenticationParameters, ber.OctetString); - } else { - msgSecurityParametersWriter.writeString(""); - } - - if (this.hasPrivacy()) { - msgSecurityParametersWriter.writeBuffer(Encryption.PRIV_PARAMETERS_PLACEHOLDER, ber.OctetString); - // should never happen where msgFlags has no privacy but privacy parameters still present - } else if (this.msgSecurityParameters.msgPrivacyParameters.length > 0) { - msgSecurityParametersWriter.writeBuffer(this.msgSecurityParameters.msgPrivacyParameters, ber.OctetString); - } else { - msgSecurityParametersWriter.writeString(""); - } - msgSecurityParametersWriter.endSequence(); - - writer.writeBuffer(msgSecurityParametersWriter.buffer, ber.OctetString); - - // ScopedPDU - var scopedPduWriter = new ber.Writer(); - scopedPduWriter.startSequence(); - var contextEngineID = this.pdu.contextEngineID ? this.pdu.contextEngineID : this.msgSecurityParameters.msgAuthoritativeEngineID; - if (contextEngineID.length == 0) { - scopedPduWriter.writeString(""); - } else { - scopedPduWriter.writeBuffer(contextEngineID, ber.OctetString); - } - scopedPduWriter.writeString(this.pdu.contextName); - this.pdu.toBuffer(scopedPduWriter); - scopedPduWriter.endSequence(); - - if (this.hasPrivacy()) { - encryptionResult = Encryption.encryptPdu(scopedPduWriter.buffer, this.user.privProtocol, this.user.privKey, this.user.authProtocol, this.msgSecurityParameters.msgAuthoritativeEngineID); - writer.writeBuffer(encryptionResult.encryptedPdu, ber.OctetString); - } else { - writer.writeBuffer(scopedPduWriter.buffer); - } - - writer.endSequence(); - - this.buffer = writer.buffer; - - if (this.hasPrivacy()) { - Encryption.addParametersToMessageBuffer(this.buffer, encryptionResult.msgPrivacyParameters); - } - - if (this.hasAuthentication()) { - Authentication.addParametersToMessageBuffer(this.buffer, this.user.authProtocol, this.user.authKey, - this.msgSecurityParameters.msgAuthoritativeEngineID); - } - - return this.buffer; -}; - -Message.prototype.processIncomingSecurity = function (user, responseCb) { - if (this.hasPrivacy()) { - if (!this.decryptPdu(user, responseCb)) { - return false; - } - } - - if (this.hasAuthentication() && !this.isAuthenticationDisabled()) { - return this.checkAuthentication(user, responseCb); - } else { - return true; - } -}; - -Message.prototype.decryptPdu = function (user, responseCb) { - var decryptedPdu; - var decryptedPduReader; - try { - decryptedPdu = Encryption.decryptPdu(this.encryptedPdu, user.privProtocol, - this.msgSecurityParameters.msgPrivacyParameters, user.privKey, user.authProtocol, - this.msgSecurityParameters.msgAuthoritativeEngineID); - decryptedPduReader = new ber.Reader(decryptedPdu); - this.pdu = readPdu(decryptedPduReader, true); - return true; - // really really occasionally the decrypt truncates a single byte - // causing an ASN read failure in readPdu() - // in this case, disabling auto padding decrypts the PDU correctly - // this try-catch provides the workaround for this condition - } catch (possibleTruncationError) { - try { - decryptedPdu = Encryption.decryptPdu(this.encryptedPdu, user.privProtocol, - this.msgSecurityParameters.msgPrivacyParameters, user.privKey, user.authProtocol, - this.msgSecurityParameters.msgAuthoritativeEngineID, true); - decryptedPduReader = new ber.Reader(decryptedPdu); - this.pdu = readPdu(decryptedPduReader, true); - return true; - } catch (error) { - responseCb(new ResponseInvalidError("Failed to decrypt PDU: " + error)); - return false; - } - } - -}; - -Message.prototype.checkAuthentication = function (user, responseCb) { - if (Authentication.isAuthentic(this.buffer, user.authProtocol, user.authKey, - this.msgSecurityParameters.msgAuthoritativeEngineID, this.msgSecurityParameters.msgAuthenticationParameters)) { - return true; - } else { - responseCb(new ResponseInvalidError("Authentication digest " - + this.msgSecurityParameters.msgAuthenticationParameters.toString('hex') - + " received in message does not match digest " - + Authentication.calculateDigest(buffer, user.authProtocol, user.authKey, - this.msgSecurityParameters.msgAuthoritativeEngineID).toString('hex') - + " calculated for message")); - return false; - } - -}; - -Message.prototype.hasAuthentication = function () { - return this.msgGlobalData && this.msgGlobalData.msgFlags && this.msgGlobalData.msgFlags & 1; -}; - -Message.prototype.hasPrivacy = function () { - return this.msgGlobalData && this.msgGlobalData.msgFlags && this.msgGlobalData.msgFlags & 2; -}; - -Message.prototype.isReportable = function () { - return this.msgGlobalData && this.msgGlobalData.msgFlags && this.msgGlobalData.msgFlags & 4; -}; - -Message.prototype.setReportable = function (flag) { - if (this.msgGlobalData && this.msgGlobalData.msgFlags) { - if (flag) { - this.msgGlobalData.msgFlags = this.msgGlobalData.msgFlags | 4; - } else { - this.msgGlobalData.msgFlags = this.msgGlobalData.msgFlags & (255 - 4); - } - } -}; - -Message.prototype.isAuthenticationDisabled = function () { - return this.disableAuthentication; -}; - -Message.prototype.hasAuthoritativeEngineID = function () { - return this.msgSecurityParameters && this.msgSecurityParameters.msgAuthoritativeEngineID && - this.msgSecurityParameters.msgAuthoritativeEngineID != ""; -}; - -Message.prototype.createReportResponseMessage = function (engine, context) { - var user = { - name: "", - level: SecurityLevel.noAuthNoPriv - }; - var responseSecurityParameters = { - msgAuthoritativeEngineID: engine.engineID, - msgAuthoritativeEngineBoots: engine.engineBoots, - msgAuthoritativeEngineTime: engine.engineTime, - msgUserName: user.name, - msgAuthenticationParameters: "", - msgPrivacyParameters: "" - }; - var reportPdu = ReportPdu.createFromVariables(this.pdu.id, [], {}); - reportPdu.contextName = context; - var responseMessage = Message.createRequestV3(user, responseSecurityParameters, reportPdu); - responseMessage.msgGlobalData.msgID = this.msgGlobalData.msgID; - return responseMessage; -}; - -Message.prototype.createResponseForRequest = function (responsePdu) { - if (this.version == Version3) { - return this.createV3ResponseFromRequest(responsePdu); - } else { - return this.createCommunityResponseFromRequest(responsePdu); - } -}; - -Message.prototype.createCommunityResponseFromRequest = function (responsePdu) { - return Message.createCommunity(this.version, this.community, responsePdu); -}; - -Message.prototype.createV3ResponseFromRequest = function (responsePdu) { - var responseUser = { - name: this.user.name, - level: this.user.name, - authProtocol: this.user.authProtocol, - authKey: this.user.authKey, - privProtocol: this.user.privProtocol, - privKey: this.user.privKey - }; - var responseSecurityParameters = { - msgAuthoritativeEngineID: this.msgSecurityParameters.msgAuthoritativeEngineID, - msgAuthoritativeEngineBoots: this.msgSecurityParameters.msgAuthoritativeEngineBoots, - msgAuthoritativeEngineTime: this.msgSecurityParameters.msgAuthoritativeEngineTime, - msgUserName: this.msgSecurityParameters.msgUserName, - msgAuthenticationParameters: "", - msgPrivacyParameters: "" - }; - var responseGlobalData = { - msgID: this.msgGlobalData.msgID, - msgMaxSize: 65507, - msgFlags: this.msgGlobalData.msgFlags & (255 - 4), - msgSecurityModel: 3 - }; - return Message.createV3(responseUser, responseGlobalData, responseSecurityParameters, responsePdu); -}; - -Message.createCommunity = function (version, community, pdu) { - var message = new Message(); - - message.version = version; - message.community = community; - message.pdu = pdu; - - return message; -}; - -Message.createRequestV3 = function (user, msgSecurityParameters, pdu) { - var authFlag = user.level == SecurityLevel.authNoPriv || user.level == SecurityLevel.authPriv ? 1 : 0; - var privFlag = user.level == SecurityLevel.authPriv ? 1 : 0; - var reportableFlag = (pdu.type == PduType.GetResponse || pdu.type == PduType.TrapV2) ? 0 : 1; - var msgGlobalData = { - msgID: _generateId(), // random ID - msgMaxSize: 65507, - msgFlags: reportableFlag * 4 | privFlag * 2 | authFlag * 1, - msgSecurityModel: 3 - }; - return Message.createV3(user, msgGlobalData, msgSecurityParameters, pdu); -}; - -Message.createV3 = function (user, msgGlobalData, msgSecurityParameters, pdu) { - var message = new Message(); - - message.version = 3; - message.user = user; - message.msgGlobalData = msgGlobalData; - message.msgSecurityParameters = { - msgAuthoritativeEngineID: msgSecurityParameters.msgAuthoritativeEngineID || Buffer.from(""), - msgAuthoritativeEngineBoots: msgSecurityParameters.msgAuthoritativeEngineBoots || 0, - msgAuthoritativeEngineTime: msgSecurityParameters.msgAuthoritativeEngineTime || 0, - msgUserName: user.name || "", - msgAuthenticationParameters: "", - msgPrivacyParameters: "" - }; - message.pdu = pdu; - - return message; -}; - -Message.createDiscoveryV3 = function (pdu) { - var msgSecurityParameters = { - msgAuthoritativeEngineID: Buffer.from(""), - msgAuthoritativeEngineBoots: 0, - msgAuthoritativeEngineTime: 0 - }; - var emptyUser = { - name: "", - level: SecurityLevel.noAuthNoPriv - }; - return Message.createRequestV3(emptyUser, msgSecurityParameters, pdu); -} - -Message.createFromBuffer = function (buffer, user) { - var reader = new ber.Reader(buffer); - var message = new Message(); - - reader.readSequence(); - - message.version = reader.readInt(); - - if (message.version != 3) { - message.community = reader.readString(); - message.pdu = readPdu(reader, false); - } else { - // HeaderData - message.msgGlobalData = {}; - reader.readSequence(); - message.msgGlobalData.msgID = reader.readInt(); - message.msgGlobalData.msgMaxSize = reader.readInt(); - message.msgGlobalData.msgFlags = reader.readString(ber.OctetString, true)[0]; - message.msgGlobalData.msgSecurityModel = reader.readInt(); - - // msgSecurityParameters - message.msgSecurityParameters = {}; - var msgSecurityParametersReader = new ber.Reader(reader.readString(ber.OctetString, true)); - msgSecurityParametersReader.readSequence(); - message.msgSecurityParameters.msgAuthoritativeEngineID = msgSecurityParametersReader.readString(ber.OctetString, true); - message.msgSecurityParameters.msgAuthoritativeEngineBoots = msgSecurityParametersReader.readInt(); - message.msgSecurityParameters.msgAuthoritativeEngineTime = msgSecurityParametersReader.readInt(); - message.msgSecurityParameters.msgUserName = msgSecurityParametersReader.readString(); - message.msgSecurityParameters.msgAuthenticationParameters = Buffer.from(msgSecurityParametersReader.readString(ber.OctetString, true)); - message.msgSecurityParameters.msgPrivacyParameters = Buffer.from(msgSecurityParametersReader.readString(ber.OctetString, true)); - scopedPdu = true; - - if (message.hasPrivacy()) { - message.encryptedPdu = reader.readString(ber.OctetString, true); - message.pdu = null; - } else { - message.pdu = readPdu(reader, true); - } - } - - message.buffer = buffer; - - return message; -}; - - -var Req = function (session, message, feedCb, responseCb, options) { - - this.message = message; - this.responseCb = responseCb; - this.retries = session.retries; - this.timeout = session.timeout; - this.onResponse = session.onSimpleGetResponse; - this.feedCb = feedCb; - this.port = (options && options.port) ? options.port : session.port; - this.context = session.context; -}; - -Req.prototype.getId = function () { - return this.message.getReqId(); -}; - - -/***************************************************************************** - ** Session class definition - **/ - -var Session = function (target, authenticator, options) { - this.target = target || "127.0.0.1"; - - this.version = (options && options.version) - ? options.version - : Version1; - - if (this.version == Version3) { - this.user = authenticator; - } else { - this.community = authenticator || "public"; - } - - this.transport = (options && options.transport) - ? options.transport - : "udp4"; - this.port = (options && options.port) - ? options.port - : 161; - this.trapPort = (options && options.trapPort) - ? options.trapPort - : 162; - - this.retries = (options && (options.retries || options.retries == 0)) - ? options.retries - : 1; - this.timeout = (options && options.timeout) - ? options.timeout - : 5000; - - this.sourceAddress = (options && options.sourceAddress) - ? options.sourceAddress - : undefined; - this.sourcePort = (options && options.sourcePort) - ? parseInt(options.sourcePort) - : undefined; - - this.idBitsSize = (options && options.idBitsSize) - ? parseInt(options.idBitsSize) - : 32; - - this.context = (options && options.context) ? options.context : ""; - - DEBUG = options.debug; - - this.reqs = {}; - this.reqCount = 0; - - this.dgram = dgram.createSocket(this.transport); - this.dgram.unref(); - - var me = this; - this.dgram.on("message", me.onMsg.bind(me)); - this.dgram.on("close", me.onClose.bind(me)); - this.dgram.on("error", me.onError.bind(me)); - - if (this.sourceAddress || this.sourcePort) - this.dgram.bind(this.sourcePort, this.sourceAddress); -}; - -util.inherits(Session, events.EventEmitter); - -Session.prototype.close = function () { - this.dgram.close(); - return this; -}; - -Session.prototype.cancelRequests = function (error) { - var id; - for (id in this.reqs) { - var req = this.reqs[id]; - this.unregisterRequest(req.getId()); - req.responseCb(error); - } -}; - -function _generateId(bitSize) { - if (bitSize === 16) { - return Math.floor(Math.random() * 10000) % 65535; - } - return Math.floor(Math.random() * 100000000) % 4294967295; -} - -Session.prototype.get = function (oids, responseCb) { - function feedCb(req, message) { - var pdu = message.pdu; - var varbinds = []; - - if (req.message.pdu.varbinds.length != pdu.varbinds.length) { - req.responseCb(new ResponseInvalidError("Requested OIDs do not " - + "match response OIDs")); - } else { - for (var i = 0; i < req.message.pdu.varbinds.length; i++) { - if (req.message.pdu.varbinds[i].oid != pdu.varbinds[i].oid) { - req.responseCb(new ResponseInvalidError("OID '" - + req.message.pdu.varbinds[i].oid - + "' in request at positiion '" + i + "' does not " - + "match OID '" + pdu.varbinds[i].oid + "' in response " - + "at position '" + i + "'")); - return; - } else { - varbinds.push(pdu.varbinds[i]); - } - } - - req.responseCb(null, varbinds); - } - } - - var pduVarbinds = []; - - for (var i = 0; i < oids.length; i++) { - var varbind = { - oid: oids[i] - }; - pduVarbinds.push(varbind); - } - - this.simpleGet(GetRequestPdu, feedCb, pduVarbinds, responseCb); - - return this; -}; - -Session.prototype.getBulk = function () { - var oids, nonRepeaters, maxRepetitions, responseCb; - - if (arguments.length >= 4) { - oids = arguments[0]; - nonRepeaters = arguments[1]; - maxRepetitions = arguments[2]; - responseCb = arguments[3]; - } else if (arguments.length >= 3) { - oids = arguments[0]; - nonRepeaters = arguments[1]; - maxRepetitions = 10; - responseCb = arguments[2]; - } else { - oids = arguments[0]; - nonRepeaters = 0; - maxRepetitions = 10; - responseCb = arguments[1]; - } - - function feedCb(req, message) { - var pdu = message.pdu; - var varbinds = []; - var i = 0; - - // first walk through and grab non-repeaters - if (pdu.varbinds.length < nonRepeaters) { - req.responseCb(new ResponseInvalidError("Varbind count in " - + "response '" + pdu.varbinds.length + "' is less than " - + "non-repeaters '" + nonRepeaters + "' in request")); - } else { - for (; i < nonRepeaters; i++) { - if (isVarbindError(pdu.varbinds[i])) { - varbinds.push(pdu.varbinds[i]); - } else if (!oidFollowsOid(req.message.pdu.varbinds[i].oid, - pdu.varbinds[i].oid)) { - req.responseCb(new ResponseInvalidError("OID '" - + req.message.pdu.varbinds[i].oid + "' in request at " - + "positiion '" + i + "' does not precede " - + "OID '" + pdu.varbinds[i].oid + "' in response " - + "at position '" + i + "'")); - return; - } else { - varbinds.push(pdu.varbinds[i]); - } - } - } - - var repeaters = req.message.pdu.varbinds.length - nonRepeaters; - - // secondly walk through and grab repeaters - if (pdu.varbinds.length % (repeaters)) { - req.responseCb(new ResponseInvalidError("Varbind count in " - + "response '" + pdu.varbinds.length + "' is not a " - + "multiple of repeaters '" + repeaters - + "' plus non-repeaters '" + nonRepeaters + "' in request")); - } else { - while (i < pdu.varbinds.length) { - for (var j = 0; j < repeaters; j++, i++) { - var reqIndex = nonRepeaters + j; - var respIndex = i; - - if (isVarbindError(pdu.varbinds[respIndex])) { - if (!varbinds[reqIndex]) - varbinds[reqIndex] = []; - varbinds[reqIndex].push(pdu.varbinds[respIndex]); - } else if (!oidFollowsOid( - req.message.pdu.varbinds[reqIndex].oid, - pdu.varbinds[respIndex].oid)) { - req.responseCb(new ResponseInvalidError("OID '" - + req.message.pdu.varbinds[reqIndex].oid - + "' in request at positiion '" + (reqIndex) - + "' does not precede OID '" - + pdu.varbinds[respIndex].oid - + "' in response at position '" + (respIndex) + "'")); - return; - } else { - if (!varbinds[reqIndex]) - varbinds[reqIndex] = []; - varbinds[reqIndex].push(pdu.varbinds[respIndex]); - } - } - } - } - - req.responseCb(null, varbinds); - } - - var pduVarbinds = []; - - for (var i = 0; i < oids.length; i++) { - var varbind = { - oid: oids[i] - }; - pduVarbinds.push(varbind); - } - - var options = { - nonRepeaters: nonRepeaters, - maxRepetitions: maxRepetitions - }; - - this.simpleGet(GetBulkRequestPdu, feedCb, pduVarbinds, responseCb, - options); - - return this; -}; - -Session.prototype.getNext = function (oids, responseCb) { - function feedCb(req, message) { - var pdu = message.pdu; - var varbinds = []; - - if (req.message.pdu.varbinds.length != pdu.varbinds.length) { - req.responseCb(new ResponseInvalidError("Requested OIDs do not " - + "match response OIDs")); - } else { - for (var i = 0; i < req.message.pdu.varbinds.length; i++) { - if (isVarbindError(pdu.varbinds[i])) { - varbinds.push(pdu.varbinds[i]); - } else if (!oidFollowsOid(req.message.pdu.varbinds[i].oid, - pdu.varbinds[i].oid)) { - req.responseCb(new ResponseInvalidError("OID '" - + req.message.pdu.varbinds[i].oid + "' in request at " - + "positiion '" + i + "' does not precede " - + "OID '" + pdu.varbinds[i].oid + "' in response " - + "at position '" + i + "'")); - return; - } else { - varbinds.push(pdu.varbinds[i]); - } - } - - req.responseCb(null, varbinds); - } - } - - var pduVarbinds = []; - - for (var i = 0; i < oids.length; i++) { - var varbind = { - oid: oids[i] - }; - pduVarbinds.push(varbind); - } - - this.simpleGet(GetNextRequestPdu, feedCb, pduVarbinds, responseCb); - - return this; -}; - -Session.prototype.inform = function () { - var typeOrOid = arguments[0]; - var varbinds, options = {}, responseCb; - - /** - ** Support the following signatures: - ** - ** typeOrOid, varbinds, options, callback - ** typeOrOid, varbinds, callback - ** typeOrOid, options, callback - ** typeOrOid, callback - **/ - if (arguments.length >= 4) { - varbinds = arguments[1]; - options = arguments[2]; - responseCb = arguments[3]; - } else if (arguments.length >= 3) { - if (arguments[1].constructor != Array) { - varbinds = []; - options = arguments[1]; - responseCb = arguments[2]; - } else { - varbinds = arguments[1]; - responseCb = arguments[2]; - } - } else { - varbinds = []; - responseCb = arguments[1]; - } - - if (this.version == Version1) { - responseCb(new RequestInvalidError("Inform not allowed for SNMPv1")); - return; - } - - function feedCb(req, message) { - var pdu = message.pdu; - var varbinds = []; - - if (req.message.pdu.varbinds.length != pdu.varbinds.length) { - req.responseCb(new ResponseInvalidError("Inform OIDs do not " - + "match response OIDs")); - } else { - for (var i = 0; i < req.message.pdu.varbinds.length; i++) { - if (req.message.pdu.varbinds[i].oid != pdu.varbinds[i].oid) { - req.responseCb(new ResponseInvalidError("OID '" - + req.message.pdu.varbinds[i].oid - + "' in inform at positiion '" + i + "' does not " - + "match OID '" + pdu.varbinds[i].oid + "' in response " - + "at position '" + i + "'")); - return; - } else { - varbinds.push(pdu.varbinds[i]); - } - } - - req.responseCb(null, varbinds); - } - } - - if (typeof typeOrOid != "string") - typeOrOid = "1.3.6.1.6.3.1.1.5." + (typeOrOid + 1); - - var pduVarbinds = [ - { - oid: "1.3.6.1.2.1.1.3.0", - type: ObjectType.TimeTicks, - value: options.upTime || Math.floor(process.uptime() * 100) - }, - { - oid: "1.3.6.1.6.3.1.1.4.1.0", - type: ObjectType.OID, - value: typeOrOid - } - ]; - - for (var i = 0; i < varbinds.length; i++) { - var varbind = { - oid: varbinds[i].oid, - type: varbinds[i].type, - value: varbinds[i].value - }; - pduVarbinds.push(varbind); - } - - options.port = this.trapPort; - - this.simpleGet(InformRequestPdu, feedCb, pduVarbinds, responseCb, options); - - return this; -}; - -Session.prototype.onClose = function () { - this.cancelRequests(new Error("Socket forcibly closed")); - this.emit("close"); -}; - -Session.prototype.onError = function (error) { - this.emit(error); -}; - -Session.prototype.onMsg = function (buffer) { - try { - var message = Message.createFromBuffer(buffer); - - var req = this.unregisterRequest(message.getReqId()); - if (!req) - return; - - if (!message.processIncomingSecurity(this.user, req.responseCb)) - return; - - try { - if (message.version != req.message.version) { - req.responseCb(new ResponseInvalidError("Version in request '" - + req.message.version + "' does not match version in " - + "response '" + message.version + "'")); - } else if (message.community != req.message.community) { - req.responseCb(new ResponseInvalidError("Community '" - + req.message.community + "' in request does not match " - + "community '" + message.community + "' in response")); - } else if (message.pdu.type == PduType.GetResponse) { - req.onResponse(req, message); - } else if (message.pdu.type == PduType.Report) { - if (!req.originalPdu) { - req.responseCb(new ResponseInvalidError("Unexpected Report PDU")); - return; - } - this.msgSecurityParameters = { - msgAuthoritativeEngineID: message.msgSecurityParameters.msgAuthoritativeEngineID, - msgAuthoritativeEngineBoots: message.msgSecurityParameters.msgAuthoritativeEngineBoots, - msgAuthoritativeEngineTime: message.msgSecurityParameters.msgAuthoritativeEngineTime - }; - req.originalPdu.contextName = this.context; - this.sendV3Req(req.originalPdu, req.feedCb, req.responseCb, req.options, req.port); - } else { - req.responseCb(new ResponseInvalidError("Unknown PDU type '" - + message.pdu.type + "' in response")); - } - } catch (error) { - req.responseCb(error); - } - } catch (error) { - this.emit("error", error); - } -}; - -Session.prototype.onSimpleGetResponse = function (req, message) { - var pdu = message.pdu; - - if (pdu.errorStatus > 0) { - var statusString = ErrorStatus[pdu.errorStatus] - || ErrorStatus.GeneralError; - var statusCode = ErrorStatus[statusString] - || ErrorStatus[ErrorStatus.GeneralError]; - - if (pdu.errorIndex <= 0 || pdu.errorIndex > pdu.varbinds.length) { - req.responseCb(new RequestFailedError(statusString, statusCode)); - } else { - var oid = pdu.varbinds[pdu.errorIndex - 1].oid; - var error = new RequestFailedError(statusString + ": " + oid, - statusCode); - req.responseCb(error); - } - } else { - req.feedCb(req, message); - } -}; - -Session.prototype.registerRequest = function (req) { - if (!this.reqs[req.getId()]) { - this.reqs[req.getId()] = req; - if (this.reqCount <= 0) - this.dgram.ref(); - this.reqCount++; - } - var me = this; - req.timer = setTimeout(function () { - if (req.retries-- > 0) { - me.send(req); - } else { - me.unregisterRequest(req.getId()); - req.responseCb(new RequestTimedOutError( - "Request timed out")); - } - }, req.timeout); -}; - -Session.prototype.send = function (req, noWait) { - try { - var me = this; - - var buffer = req.message.toBuffer(); - - this.dgram.send(buffer, 0, buffer.length, req.port, this.target, - function (error, bytes) { - if (error) { - req.responseCb(error); - } else { - if (noWait) { - req.responseCb(null); - } else { - me.registerRequest(req); - } - } - }); - } catch (error) { - req.responseCb(error); - } - - return this; -}; - -Session.prototype.set = function (varbinds, responseCb) { - function feedCb(req, message) { - var pdu = message.pdu; - var varbinds = []; - - if (req.message.pdu.varbinds.length != pdu.varbinds.length) { - req.responseCb(new ResponseInvalidError("Requested OIDs do not " - + "match response OIDs")); - } else { - for (var i = 0; i < req.message.pdu.varbinds.length; i++) { - if (req.message.pdu.varbinds[i].oid != pdu.varbinds[i].oid) { - req.responseCb(new ResponseInvalidError("OID '" - + req.message.pdu.varbinds[i].oid - + "' in request at positiion '" + i + "' does not " - + "match OID '" + pdu.varbinds[i].oid + "' in response " - + "at position '" + i + "'")); - return; - } else { - varbinds.push(pdu.varbinds[i]); - } - } - - req.responseCb(null, varbinds); - } - } - - var pduVarbinds = []; - - for (var i = 0; i < varbinds.length; i++) { - var varbind = { - oid: varbinds[i].oid, - type: varbinds[i].type, - value: varbinds[i].value - }; - pduVarbinds.push(varbind); - } - - this.simpleGet(SetRequestPdu, feedCb, pduVarbinds, responseCb); - - return this; -}; - -Session.prototype.simpleGet = function (pduClass, feedCb, varbinds, - responseCb, options) { - try { - var id = _generateId(this.idBitsSize); - var pdu = SimplePdu.createFromVariables(pduClass, id, varbinds, options); - var message; - var req; - - if (this.version == Version3) { - if (this.msgSecurityParameters) { - this.sendV3Req(pdu, feedCb, responseCb, options, this.port); - } else { - // SNMPv3 discovery - var discoveryPdu = createDiscoveryPdu(this.context); - var discoveryMessage = Message.createDiscoveryV3(discoveryPdu); - var discoveryReq = new Req(this, discoveryMessage, feedCb, responseCb, options); - discoveryReq.originalPdu = pdu; - this.send(discoveryReq); - } - } else { - message = Message.createCommunity(this.version, this.community, pdu); - req = new Req(this, message, feedCb, responseCb, options); - this.send(req); - } - } catch (error) { - if (responseCb) - responseCb(error); - } -} - -function subtreeCb(req, varbinds) { - var done = 0; - - for (var i = varbinds.length; i > 0; i--) { - if (!oidInSubtree(req.baseOid, varbinds[i - 1].oid)) { - done = 1; - varbinds.pop(); - } - } - - if (varbinds.length > 0) - req.feedCb(varbinds); - - if (done) - return true; -} - -Session.prototype.subtree = function () { - var me = this; - var oid = arguments[0]; - var maxRepetitions, feedCb, doneCb; - - if (arguments.length < 4) { - maxRepetitions = 20; - feedCb = arguments[1]; - doneCb = arguments[2]; - } else { - maxRepetitions = arguments[1]; - feedCb = arguments[2]; - doneCb = arguments[3]; - } - - var req = { - feedCb: feedCb, - doneCb: doneCb, - maxRepetitions: maxRepetitions, - baseOid: oid - }; - - this.walk(oid, maxRepetitions, subtreeCb.bind(me, req), doneCb); - - return this; -}; - -function tableColumnsResponseCb(req, error) { - if (error) { - req.responseCb(error); - } else if (req.error) { - req.responseCb(req.error); - } else { - if (req.columns.length > 0) { - var column = req.columns.pop(); - var me = this; - this.subtree(req.rowOid + column, req.maxRepetitions, - tableColumnsFeedCb.bind(me, req), - tableColumnsResponseCb.bind(me, req)); - } else { - req.responseCb(null, req.table); - } - } -} - -function tableColumnsFeedCb(req, varbinds) { - for (var i = 0; i < varbinds.length; i++) { - if (isVarbindError(varbinds[i])) { - req.error = new RequestFailedError(varbindError(varbind[i])); - return true; - } - - var oid = varbinds[i].oid.replace(req.rowOid, ""); - if (oid && oid != varbinds[i].oid) { - var match = oid.match(/^(\d+)\.(.+)$/); - if (match && match[1] > 0) { - if (!req.table[match[2]]) - req.table[match[2]] = {}; - req.table[match[2]][match[1]] = varbinds[i].value; - } - } - } -} - -Session.prototype.tableColumns = function () { - var me = this; - - var oid = arguments[0]; - var columns = arguments[1]; - var maxRepetitions, responseCb; - - if (arguments.length < 4) { - responseCb = arguments[2]; - maxRepetitions = 20; - } else { - maxRepetitions = arguments[2]; - responseCb = arguments[3]; - } - - var req = { - responseCb: responseCb, - maxRepetitions: maxRepetitions, - baseOid: oid, - rowOid: oid + ".1.", - columns: columns.slice(0), - table: {} - }; - - if (req.columns.length > 0) { - var column = req.columns.pop(); - this.subtree(req.rowOid + column, maxRepetitions, - tableColumnsFeedCb.bind(me, req), - tableColumnsResponseCb.bind(me, req)); - } - - return this; -}; - -function tableResponseCb(req, error) { - if (error) - req.responseCb(error); - else if (req.error) - req.responseCb(req.error); - else - req.responseCb(null, req.table); -} - -function tableFeedCb(req, varbinds) { - for (var i = 0; i < varbinds.length; i++) { - if (isVarbindError(varbinds[i])) { - req.error = new RequestFailedError(varbindError(varbind[i])); - return true; - } - - var oid = varbinds[i].oid.replace(req.rowOid, ""); - if (oid && oid != varbinds[i].oid) { - var match = oid.match(/^(\d+)\.(.+)$/); - if (match && match[1] > 0) { - if (!req.table[match[2]]) - req.table[match[2]] = {}; - req.table[match[2]][match[1]] = varbinds[i].value; - } - } - } -} - -Session.prototype.table = function () { - var me = this; - - var oid = arguments[0]; - var maxRepetitions, responseCb; - - if (arguments.length < 3) { - responseCb = arguments[1]; - maxRepetitions = 20; - } else { - maxRepetitions = arguments[1]; - responseCb = arguments[2]; - } - - var req = { - responseCb: responseCb, - maxRepetitions: maxRepetitions, - baseOid: oid, - rowOid: oid + ".1.", - table: {} - }; - - this.subtree(oid, maxRepetitions, tableFeedCb.bind(me, req), - tableResponseCb.bind(me, req)); - - return this; -}; - -Session.prototype.trap = function () { - var req = {}; - - try { - var typeOrOid = arguments[0]; - var varbinds, options = {}, responseCb; - var message; - - /** - ** Support the following signatures: - ** - ** typeOrOid, varbinds, options, callback - ** typeOrOid, varbinds, agentAddr, callback - ** typeOrOid, varbinds, callback - ** typeOrOid, agentAddr, callback - ** typeOrOid, options, callback - ** typeOrOid, callback - **/ - if (arguments.length >= 4) { - varbinds = arguments[1]; - if (typeof arguments[2] == "string") { - options.agentAddr = arguments[2]; - } else if (arguments[2].constructor != Array) { - options = arguments[2]; - } - responseCb = arguments[3]; - } else if (arguments.length >= 3) { - if (typeof arguments[1] == "string") { - varbinds = []; - options.agentAddr = arguments[1]; - } else if (arguments[1].constructor != Array) { - varbinds = []; - options = arguments[1]; - } else { - varbinds = arguments[1]; - agentAddr = null; - } - responseCb = arguments[2]; - } else { - varbinds = []; - responseCb = arguments[1]; - } - - var pdu, pduVarbinds = []; - - for (var i = 0; i < varbinds.length; i++) { - var varbind = { - oid: varbinds[i].oid, - type: varbinds[i].type, - value: varbinds[i].value - }; - pduVarbinds.push(varbind); - } - - var id = _generateId(this.idBitsSize); - - if (this.version == Version2c || this.version == Version3) { - if (typeof typeOrOid != "string") - typeOrOid = "1.3.6.1.6.3.1.1.5." + (typeOrOid + 1); - - pduVarbinds.unshift( - { - oid: "1.3.6.1.2.1.1.3.0", - type: ObjectType.TimeTicks, - value: options.upTime || Math.floor(process.uptime() * 100) - }, - { - oid: "1.3.6.1.6.3.1.1.4.1.0", - type: ObjectType.OID, - value: typeOrOid - } - ); - - pdu = TrapV2Pdu.createFromVariables(id, pduVarbinds, options); - } else { - pdu = TrapPdu.createFromVariables(typeOrOid, pduVarbinds, options); - } - - if (this.version == Version3) { - var msgSecurityParameters = { - msgAuthoritativeEngineID: this.user.engineID, - msgAuthoritativeEngineBoots: 0, - msgAuthoritativeEngineTime: 0 - }; - message = Message.createRequestV3(this.user, msgSecurityParameters, pdu); - } else { - message = Message.createCommunity(this.version, this.community, pdu); - } - - req = { - id: id, - message: message, - responseCb: responseCb, - port: this.trapPort - }; - - this.send(req, true); - } catch (error) { - if (req.responseCb) - req.responseCb(error); - } - - return this; -}; - -Session.prototype.unregisterRequest = function (id) { - var req = this.reqs[id]; - if (req) { - delete this.reqs[id]; - clearTimeout(req.timer); - delete req.timer; - this.reqCount--; - if (this.reqCount <= 0) - this.dgram.unref(); - return req; - } else { - return null; - } -}; - -function walkCb(req, error, varbinds) { - var done = 0; - var oid; - - if (error) { - if (error instanceof RequestFailedError) { - if (error.status != ErrorStatus.NoSuchName) { - req.doneCb(error); - return; - } else { - // signal the version 1 walk code below that it should stop - done = 1; - } - } else { - req.doneCb(error); - return; - } - } - - if (this.version == Version2c || this.version == Version3) { - for (var i = varbinds[0].length; i > 0; i--) { - if (varbinds[0][i - 1].type == ObjectType.EndOfMibView) { - varbinds[0].pop(); - done = 1; - } - } - if (req.feedCb(varbinds[0])) - done = 1; - if (!done) - oid = varbinds[0][varbinds[0].length - 1].oid; - } else { - if (!done) { - if (req.feedCb(varbinds)) { - done = 1; - } else { - oid = varbinds[0].oid; - } - } - } - - if (done) - req.doneCb(null); - else - this.walk(oid, req.maxRepetitions, req.feedCb, req.doneCb, - req.baseOid); -} - -Session.prototype.walk = function () { - var me = this; - var oid = arguments[0]; - var maxRepetitions, feedCb, doneCb, baseOid; - - if (arguments.length < 4) { - maxRepetitions = 20; - feedCb = arguments[1]; - doneCb = arguments[2]; - } else { - maxRepetitions = arguments[1]; - feedCb = arguments[2]; - doneCb = arguments[3]; - } - - var req = { - maxRepetitions: maxRepetitions, - feedCb: feedCb, - doneCb: doneCb - }; - - if (this.version == Version2c || this.version == Version3) - this.getBulk([oid], 0, maxRepetitions, - walkCb.bind(me, req)); - else - this.getNext([oid], walkCb.bind(me, req)); - - return this; -}; - -Session.prototype.sendV3Req = function (pdu, feedCb, responseCb, options, port) { - var message = Message.createRequestV3(this.user, this.msgSecurityParameters, pdu); - var reqOptions = options || {}; - var req = new Req(this, message, feedCb, responseCb, reqOptions); - req.port = port; - this.send(req); -}; - -var Engine = function (engineID, engineBoots, engineTime) { - if (engineID) { - this.engineID = Buffer.from(engineID, 'hex'); - } else { - this.generateEngineID(); - } - this.engineBoots = 0; - this.engineTime = 10; -}; - -Engine.prototype.generateEngineID = function () { - // generate a 17-byte engine ID in the following format: - // 0x80 + 0x00B983 (enterprise OID) | 0x80 (enterprise-specific format) | 12 bytes of random - this.engineID = Buffer.alloc(17); - this.engineID.fill('8000B98380', 'hex', 0, 5); - this.engineID.fill(crypto.randomBytes(12), 5, 17, 'hex'); -} - -var Listener = function (options, receiver) { - this.receiver = receiver; - this.callback = receiver.onMsg; - this.family = options.transport || 'udp4'; - this.port = options.port || 161; - this.disableAuthorization = options.disableAuthorization || false; -}; - -Listener.prototype.startListening = function (receiver) { - var me = this; - this.dgram = dgram.createSocket(this.family); - this.dgram.bind(this.port); - this.dgram.on("message", me.callback.bind(me.receiver)); -}; - -Listener.prototype.send = function (message, rinfo) { - var me = this; - - var buffer = message.toBuffer(); - - this.dgram.send(buffer, 0, buffer.length, rinfo.port, rinfo.address, - function (error, bytes) { - if (error) { - // me.callback (error); - console.error("Error sending: " + error.message); - } else { - // debug ("Listener sent response message"); - } - }); -}; - -Listener.formatCallbackData = function (pdu, rinfo) { - if (pdu.contextEngineID) { - pdu.contextEngineID = pdu.contextEngineID.toString('hex'); - } - delete pdu.nonRepeaters; - delete pdu.maxRepetitions; - return { - pdu: pdu, - rinfo: rinfo - }; -}; - -Listener.processIncoming = function (buffer, authorizer, callback) { - var message = Message.createFromBuffer(buffer); - var community; - - // Authorization - if (message.version == Version3) { - message.user = authorizer.users.filter(localUser => localUser.name == - message.msgSecurityParameters.msgUserName)[0]; - message.disableAuthentication = authorizer.disableAuthorization; - if (!message.user) { - if (message.msgSecurityParameters.msgUserName != "" && !authorizer.disableAuthorization) { - callback(new RequestFailedError("Local user not found for message with user " + - message.msgSecurityParameters.msgUserName)); - return; - } else if (message.hasAuthentication()) { - callback(new RequestFailedError("Local user not found and message requires authentication with user " + - message.msgSecurityParameters.msgUserName)); - return; - } else { - message.user = { - name: "", - level: SecurityLevel.noAuthNoPriv - }; - } - } - if (!message.processIncomingSecurity(message.user, callback)) { - return; - } - } else { - community = authorizer.communities.filter(localCommunity => localCommunity == message.community)[0]; - if (!community && !authorizer.disableAuthorization) { - callback(new RequestFailedError("Local community not found for message with community " + message.community)); - return; - } - } - - return message; -}; - -var Authorizer = function () { - this.communities = []; - this.users = []; -} - -Authorizer.prototype.addCommunity = function (community) { - if (this.getCommunity(community)) { - return; - } else { - this.communities.push(community); - } -}; - -Authorizer.prototype.getCommunity = function (community) { - return this.communities.filter(localCommunity => localCommunity == community)[0] || null; -}; - -Authorizer.prototype.getCommunities = function () { - return this.communities; -}; - -Authorizer.prototype.deleteCommunity = function (community) { - var index = this.communities.indexOf(community); - if (index > -1) { - this.communities.splice(index, 1); - } -}; - -Authorizer.prototype.addUser = function (user) { - if (this.getUser(user.name)) { - this.deleteUser(user.name); - } - this.users.push(user); -}; - -Authorizer.prototype.getUser = function (userName) { - return this.users.filter(localUser => localUser.name == userName)[0] || null; -}; - -Authorizer.prototype.getUsers = function () { - return this.users; -}; - -Authorizer.prototype.deleteUser = function (userName) { - var index = this.users.findIndex(localUser => localUser.name == userName); - if (index > -1) { - this.users.splice(index, 1); - } -}; - - -/***************************************************************************** - ** Receiver class definition - **/ - -var Receiver = function (options, callback) { - DEBUG = options.debug; - this.listener = new Listener(options, this); - this.authorizer = new Authorizer(); - this.engine = new Engine(options.engineID); - - this.engineBoots = 0; - this.engineTime = 10; - this.disableAuthorization = false; - - this.callback = callback; - this.family = options.transport || 'udp4'; - this.port = options.port || 162; - options.port = this.port; - this.disableAuthorization = options.disableAuthorization || false; - this.context = (options && options.context) ? options.context : ""; - this.listener = new Listener(options, this); -}; - -Receiver.prototype.addCommunity = function (community) { - this.authorizer.addCommunity(community); -}; - -Receiver.prototype.getCommunity = function (community) { - return this.authorizer.getCommunity(community); -}; - -Receiver.prototype.getCommunities = function () { - return this.authorizer.getCommunities(); -}; - -Receiver.prototype.deleteCommunity = function (community) { - this.authorizer.deleteCommunities(community); -}; - -Receiver.prototype.addUser = function (user) { - this.authorizer.addUser(user); -}; - -Receiver.prototype.getUser = function (userName) { - return this.authorizer.getUser(userName); -}; - -Receiver.prototype.getUsers = function () { - return this.authorizer.getUsers(); -}; - -Receiver.prototype.deleteUser = function (userName) { - this.authorizer.deleteUser(userName); -}; - -Receiver.prototype.onMsg = function (buffer, rinfo) { - var message = Listener.processIncoming(buffer, this.authorizer, this.callback); - var reportMessage; - - if (!message) { - return; - } - - // The only GetRequest PDUs supported are those used for SNMPv3 discovery - if (message.pdu.type == PduType.GetRequest) { - if (message.version != Version3) { - this.callback(new RequestInvalidError("Only SNMPv3 discovery GetRequests are supported")); - return; - } else if (message.hasAuthentication()) { - this.callback(new RequestInvalidError("Only discovery (noAuthNoPriv) GetRequests are supported but this message has authentication")); - return; - } else if (!message.isReportable()) { - this.callback(new RequestInvalidError("Only discovery GetRequests are supported and this message does not have the reportable flag set")); - return; - } - var reportMessage = message.createReportResponseMessage(this.engine, this.context); - this.listener.send(reportMessage, rinfo); - return; - } - ; - - // Inform/trap processing - debug(JSON.stringify(message.pdu, null, 2)); - if (message.pdu.type == PduType.Trap || message.pdu.type == PduType.TrapV2) { - this.callback(null, this.formatCallbackData(message.pdu, rinfo)); - } else if (message.pdu.type == PduType.InformRequest) { - message.pdu.type = PduType.GetResponse; - message.buffer = null; - message.setReportable(false); - this.listener.send(message, rinfo); - message.pdu.type = PduType.InformRequest; - this.callback(null, this.formatCallbackData(message.pdu, rinfo)); - } else { - this.callback(new RequestInvalidError("Unexpected PDU type " + message.pdu.type + " (" + PduType[message.pdu.type] + ")")); - } -} - -Receiver.prototype.formatCallbackData = function (pdu, rinfo) { - if (pdu.contextEngineID) { - pdu.contextEngineID = pdu.contextEngineID.toString('hex'); - } - delete pdu.nonRepeaters; - delete pdu.maxRepetitions; - return { - pdu: pdu, - rinfo: rinfo - }; -}; - -Receiver.prototype.close = function () { - this.listener.close(); -}; - -Receiver.create = function (options, callback) { - var receiver = new Receiver(options, callback); - receiver.listener.startListening(); - return receiver; -}; - -var MibNode = function (address, parent) { - this.address = address; - this.oid = this.address.join('.'); - ; - this.parent = parent; - this.children = {}; -}; - -MibNode.prototype.child = function (index) { - return this.children[index]; -}; - -MibNode.prototype.listChildren = function (lowest) { - var sorted = []; - - lowest = lowest || 0; - - this.children.forEach(function (c, i) { - if (i >= lowest) - sorted.push(i); - }); - - sorted.sort(function (a, b) { - return (a - b); - }); - - return sorted; -}; - -MibNode.prototype.isDescendant = function (address) { - return MibNode.oidIsDescended(this.address, address); -}; - -MibNode.prototype.isAncestor = function (address) { - return MibNode.oidIsDescended(address, this.address); -}; - -MibNode.prototype.getAncestorProvider = function () { - if (this.provider) { - return this; - } else if (!this.parent) { - return null; - } else { - return this.parent.getAncestorProvider(); - } -}; - -MibNode.prototype.getInstanceNodeForTableRow = function () { - var childCount = Object.keys(this.children).length; - if (childCount == 0) { - if (this.value) { - return this; - } else { - return null; - } - } else if (childCount == 1) { - return this.children[0].getInstanceNodeForTableRow(); - } else if (childCount > 1) { - return null; - } -}; - -MibNode.prototype.getInstanceNodeForTableRowIndex = function (index) { - var childCount = Object.keys(this.children).length; - if (childCount == 0) { - if (this.value) { - return this; - } else { - // not found - return null; - } - } else { - if (index.length == 0) { - return this.getInstanceNodeForTableRow(); - } else { - var nextChildIndexPart = index[0]; - if (!nextChildIndexPart) { - return null; - } - remainingIndex = index.slice(1); - return this.children[nextChildIndexPart].getInstanceNodeForTableRowIndex(remainingIndex); - } - } -}; - -MibNode.prototype.getNextInstanceNode = function () { - - node = this; - if (this.value) { - // Need upwards traversal first - node = this; - while (node) { - siblingIndex = node.address.slice(-1)[0]; - node = node.parent; - if (!node) { - // end of MIB - return null; - } else { - childrenAddresses = Object.keys(node.children).sort((a, b) => a - b); - siblingPosition = childrenAddresses.indexOf(siblingIndex.toString()); - if (siblingPosition + 1 < childrenAddresses.length) { - node = node.children[childrenAddresses[siblingPosition + 1]]; - break; - } - } - } - } - // Descent - while (node) { - if (node.value) { - return node; - } - childrenAddresses = Object.keys(node.children).sort((a, b) => a - b); - node = node.children[childrenAddresses[0]]; - if (!node) { - // unexpected - return null; - } - } -}; - -MibNode.prototype.delete = function () { - if (Object.keys(this.children) > 0) { - throw new Error("Cannot delete non-leaf MIB node"); - } - addressLastPart = this.address.slice(-1)[0]; - delete this.parent.children[addressLastPart]; - this.parent = null; -}; - -MibNode.prototype.pruneUpwards = function () { - if (!this.parent) { - return - } - if (Object.keys(this.children).length == 0) { - var lastAddressPart = this.address.splice(-1)[0].toString(); - delete this.parent.children[lastAddressPart]; - this.parent.pruneUpwards(); - this.parent = null; - } -} - -MibNode.prototype.dump = function (options) { - var valueString; - if ((!options.leavesOnly || options.showProviders) && this.provider) { - console.log(this.oid + " [" + MibProviderType[this.provider.type] + ": " + this.provider.name + "]"); - } else if ((!options.leavesOnly) || Object.keys(this.children).length == 0) { - if (this.value) { - valueString = " = "; - valueString += options.showTypes ? ObjectType[this.valueType] + ": " : ""; - valueString += options.showValues ? this.value : ""; - } else { - valueString = ""; - } - console.log(this.oid + valueString); - } - for (node of Object.keys(this.children).sort((a, b) => a - b)) { - this.children[node].dump(options); - } -}; - -MibNode.oidIsDescended = function (oid, ancestor) { - var ancestorAddress = Mib.convertOidToAddress(ancestor); - var address = Mib.convertOidToAddress(oid); - var isAncestor = true; - - if (address.length <= ancestorAddress.length) { - return false; - } - - ancestorAddress.forEach(function (o, i) { - if (address[i] !== ancestorAddress[i]) { - isAncestor = false; - } - }); - - return isAncestor; -}; - -var Mib = function () { - this.root = new MibNode([], null); - this.providers = {}; - this.providerNodes = {}; -}; - -Mib.prototype.addNodesForOid = function (oidString) { - var address = Mib.convertOidToAddress(oidString); - return this.addNodesForAddress(address); -}; - -Mib.prototype.addNodesForAddress = function (address) { - var address; - var node; - var i; - - node = this.root; - - for (i = 0; i < address.length; i++) { - if (!node.children.hasOwnProperty(address[i])) { - node.children[address[i]] = new MibNode(address.slice(0, i + 1), node); - } - node = node.children[address[i]]; - } - - return node; -}; - -Mib.prototype.lookup = function (oid) { - var address; - var i; - var node; - - address = Mib.convertOidToAddress(oid); - node = this.root; - for (i = 0; i < address.length; i++) { - if (!node.children.hasOwnProperty(address[i])) { - return null - } - node = node.children[address[i]]; - } - - return node; -}; - -Mib.prototype.getProviderNodeForInstance = function (instanceNode) { - if (instanceNode.provider) { - throw new ReferenceError("Instance node has provider which should never happen"); - } - return instanceNode.getAncestorProvider(); -}; - -Mib.prototype.addProviderToNode = function (provider) { - var node = this.addNodesForOid(provider.oid); - - node.provider = provider; - if (provider.type == MibProviderType.Table) { - if (!provider.index) { - provider.index = [1]; - } - } - this.providerNodes[provider.name] = node; - return node; -}; - -Mib.prototype.registerProvider = function (provider) { - this.providers[provider.name] = provider; -}; - -Mib.prototype.unregisterProvider = function (name) { - var providerNode = this.providerNodes[name]; - if (providerNode) { - providerNodeParent = providerNode.parent; - providerNode.delete(); - providerNodeParent.pruneUpwards(); - delete this.providerNodes[name]; - } - delete this.providers[name]; -}; - -Mib.prototype.getProvider = function (name) { - return this.providers[name]; -}; - -Mib.prototype.getProviders = function () { - return this.providers; -}; - -Mib.prototype.getScalarValue = function (scalarName) { - var providerNode = this.providerNodes[scalarName]; - if (!providerNode || !providerNode.provider || providerNode.provider.type != MibProviderType.Scalar) { - throw new ReferenceError("Failed to get node for registered MIB provider " + scalarName); - } - var instanceAddress = providerNode.address.concat([0]); - if (!this.lookup(instanceAddress)) { - throw new Error("Failed created instance node for registered MIB provider " + scalarName); - } - var instanceNode = this.lookup(instanceAddress); - return instanceNode.value; -}; - -Mib.prototype.setScalarValue = function (scalarName, newValue) { - var providerNode; - var instanceNode; - - if (!this.providers[scalarName]) { - throw new ReferenceError("Provider " + scalarName + " not registered with this MIB"); - } - - providerNode = this.providerNodes[scalarName]; - if (!providerNode) { - providerNode = this.addProviderToNode(this.providers[scalarName]); - } - if (!providerNode || !providerNode.provider || providerNode.provider.type != MibProviderType.Scalar) { - throw new ReferenceError("Could not find MIB node for registered provider " + scalarName); - } - var instanceAddress = providerNode.address.concat([0]); - instanceNode = this.lookup(instanceAddress); - if (!instanceNode) { - this.addNodesForAddress(instanceAddress); - instanceNode = this.lookup(instanceAddress); - instanceNode.valueType = providerNode.provider.scalarType; - } - instanceNode.value = newValue; -}; - -Mib.prototype.getProviderNodeForTable = function (table) { - var providerNode; - var provider; - - providerNode = this.providerNodes[table]; - if (!providerNode) { - throw new ReferenceError("No MIB provider registered for " + table); - } - provider = providerNode.provider; - if (!providerNode) { - throw new ReferenceError("No MIB provider definition for registered provider " + table); - } - if (provider.type != MibProviderType.Table) { - throw new TypeError("Registered MIB provider " + table + - " is not of the correct type (is type " + MibProviderType[provider.type] + ")"); - } - return providerNode; -}; - -Mib.prototype.addTableRow = function (table, row) { - var providerNode; - var provider; - var instance = []; - var instanceAddress; - var instanceNode; - - if (this.providers[table] && !this.providerNodes[table]) { - this.addProviderToNode(this.providers[table]); - } - providerNode = this.getProviderNodeForTable(table); - provider = providerNode.provider; - for (var indexPart of provider.index) { - columnPosition = provider.columns.findIndex(column => column.number == indexPart); - instance.push(row[columnPosition]); - } - for (var i = 0; i < providerNode.provider.columns.length; i++) { - var column = providerNode.provider.columns[i]; - instanceAddress = providerNode.address.concat(column.number).concat(instance); - this.addNodesForAddress(instanceAddress); - instanceNode = this.lookup(instanceAddress); - instanceNode.valueType = column.type; - instanceNode.value = row[i]; - } -}; - -Mib.prototype.getTableColumnDefinitions = function (table) { - var providerNode; - var provider; - - providerNode = this.getProviderNodeForTable(table); - provider = providerNode.provider; - return provider.columns; -}; - -Mib.prototype.getTableColumnCells = function (table, columnNumber) { - providerNode = this.getProviderNodeForTable(table); - columnNode = providerNode.children[columnNumber]; - column = [] - for (var row of Object.keys(columnNode.children)) { - instanceNode = columnNode.children[row].getInstanceNodeForTableRow(); - column.push(instanceNode.value); - } - return column; -}; - -Mib.prototype.getTableRowCells = function (table, rowIndex) { - var providerNode; - var columnNode; - var instanceNode; - var row = []; - - providerNode = this.getProviderNodeForTable(table); - for (var columnNumber of Object.keys(providerNode.children)) { - columnNode = providerNode.children[columnNumber]; - instanceNode = columnNode.getInstanceNodeForTableRowIndex(rowIndex); - row.push(instanceNode.value); - } - return row; -}; - -Mib.prototype.getTableCells = function (table, byRows) { - var providerNode; - var columnNode; - var data = []; - - providerNode = this.getProviderNodeForTable(table); - for (var columnNumber of Object.keys(providerNode.children)) { - columnNode = providerNode.children[columnNumber]; - column = []; - data.push(column); - for (var row of Object.keys(columnNode.children)) { - instanceNode = columnNode.children[row].getInstanceNodeForTableRow(); - column.push(instanceNode.value); - } - } - - if (byRows) { - return Object.keys(data[0]).map(function (c) { - return data.map(function (r) { - return r[c]; - }); - }); - } else { - return data; - } - -}; - -Mib.prototype.getTableSingleCell = function (table, columnNumber, rowIndex) { - var providerNode; - var columnNode; - var instanceNode; - - providerNode = this.getProviderNodeForTable(table); - columnNode = providerNode.children[columnNumber]; - instanceNode = columnNode.getInstanceNodeForTableRowIndex(rowIndex); - return instanceNode.value; -}; - -Mib.prototype.setTableSingleCell = function (table, columnNumber, rowIndex, value) { - var providerNode; - var columnNode; - var instanceNode; - - providerNode = this.getProviderNodeForTable(table); - columnNode = providerNode.children[columnNumber]; - instanceNode = columnNode.getInstanceNodeForTableRowIndex(rowIndex); - instanceNode.value = value; -}; - -Mib.prototype.deleteTableRow = function (table, rowIndex) { - var providerNode; - var columnNode; - var instanceNode; - var row = []; - - providerNode = this.getProviderNodeForTable(table); - for (var columnNumber of Object.keys(providerNode.children)) { - columnNode = providerNode.children[columnNumber]; - instanceNode = columnNode.getInstanceNodeForTableRowIndex(rowIndex); - if (instanceNode) { - instanceParentNode = instanceNode.parent; - instanceNode.delete(); - instanceParentNode.pruneUpwards(); - } else { - throw new ReferenceError("Cannot find row for index " + rowIndex + " at registered provider " + table); - } - } - return row; -}; - -Mib.prototype.dump = function (options) { - if (!options) { - options = {}; - } - var completedOptions = { - leavesOnly: options.leavesOnly || true, - showProviders: options.leavesOnly || true, - showValues: options.leavesOnly || true, - showTypes: options.leavesOnly || true - }; - this.root.dump(completedOptions); -}; - -Mib.convertOidToAddress = function (oid) { - var address; - var oidArray; - var i; - - if (typeof (oid) === 'object' && util.isArray(oid)) { - address = oid; - } else if (typeof (oid) === 'string') { - address = oid.split('.'); - } else { - throw new TypeError('oid (string or array) is required'); - } - - if (address.length < 3) - throw new RangeError('object identifier is too short'); - - oidArray = []; - for (i = 0; i < address.length; i++) { - var n; - - if (address[i] === '') - continue; - - if (address[i] === true || address[i] === false) { - throw new TypeError('object identifier component ' + - address[i] + ' is malformed'); - } - - n = Number(address[i]); - - if (isNaN(n)) { - throw new TypeError('object identifier component ' + - address[i] + ' is malformed'); - } - if (n % 1 !== 0) { - throw new TypeError('object identifier component ' + - address[i] + ' is not an integer'); - } - if (i === 0 && n > 2) { - throw new RangeError('object identifier does not ' + - 'begin with 0, 1, or 2'); - } - if (i === 1 && n > 39) { - throw new RangeError('object identifier second ' + - 'component ' + n + ' exceeds encoding limit of 39'); - } - if (n < 0) { - throw new RangeError('object identifier component ' + - address[i] + ' is negative'); - } - if (n > MAX_INT32) { - throw new RangeError('object identifier component ' + - address[i] + ' is too large'); - } - oidArray.push(n); - } - - return oidArray; - -}; - -var MibRequest = function (requestDefinition) { - this.operation = requestDefinition.operation; - this.address = Mib.convertOidToAddress(requestDefinition.oid); - this.oid = this.address.join('.'); - this.providerNode = requestDefinition.providerNode; - this.instanceNode = requestDefinition.instanceNode; -}; - -MibRequest.prototype.isScalar = function () { - return this.providerNode && this.providerNode.provider && - this.providerNode.provider.type == MibProviderType.Scalar; -}; - -MibRequest.prototype.isTabular = function () { - return this.providerNode && this.providerNode.provider && - this.providerNode.provider.type == MibProviderType.Table; -}; - -var Agent = function (options, callback) { - DEBUG = options.debug; - this.listener = new Listener(options, this); - this.engine = new Engine(options.engineID); - this.authorizer = new Authorizer(); - this.mib = new Mib(); - this.callback = callback || function () { - }; - this.context = ""; -}; - -Agent.prototype.getMib = function () { - return this.mib; -}; - -Agent.prototype.getAuthorizer = function () { - return this.authorizer; -}; - -Agent.prototype.registerProvider = function (provider) { - this.mib.registerProvider(provider); -}; - -Agent.prototype.unregisterProvider = function (provider) { - this.mib.unregisterProvider(provider); -}; - -Agent.prototype.getProvider = function (provider) { - return this.mib.getProvider(provider); -}; - -Agent.prototype.getProviders = function () { - return this.mib.getProviders(); -}; - -Agent.prototype.onMsg = function (buffer, rinfo) { - var message = Listener.processIncoming(buffer, this.authorizer, this.callback); - var reportMessage; - var responseMessage; - - if (!message) { - return; - } - - // SNMPv3 discovery - if (message.version == Version3 && message.pdu.type == PduType.GetRequest && - !message.hasAuthoritativeEngineID() && message.isReportable()) { - reportMessage = message.createReportResponseMessage(this.engine, this.context); - this.listener.send(reportMessage, rinfo); - return; - } - - // Request processing - debug(JSON.stringify(message.pdu, null, 2)); - if (message.pdu.type == PduType.GetRequest) { - responseMessage = this.request(message, rinfo); - } else if (message.pdu.type == PduType.SetRequest) { - responseMessage = this.request(message, rinfo); - } else if (message.pdu.type == PduType.GetNextRequest) { - responseMessage = this.getNextRequest(message, rinfo); - } else if (message.pdu.type == PduType.GetBulkRequest) { - responseMessage = this.getBulkRequest(message, rinfo); - } else { - this.callback(new RequestInvalidError("Unexpected PDU type " + - message.pdu.type + " (" + PduType[message.pdu.type] + ")")); - } - -}; - -Agent.prototype.request = function (requestMessage, rinfo) { - var me = this; - var varbindsCompleted = 0; - var requestPdu = requestMessage.pdu; - var varbindsLength = requestPdu.varbinds.length; - var responsePdu = requestPdu.getResponsePduForRequest(); - - for (var i = 0; i < requestPdu.varbinds.length; i++) { - var requestVarbind = requestPdu.varbinds[i]; - var instanceNode = this.mib.lookup(requestVarbind.oid); - var providerNode; - var mibRequest; - var handler; - var responseVarbindType; - - if (!instanceNode) { - mibRequest = new MibRequest({ - operation: requestPdu.type, - oid: requestVarbind.oid - }); - handler = function getNsoHandler(mibRequestForNso) { - mibRequestForNso.done({ - errorStatus: ErrorStatus.NoSuchName, - errorIndex: i - }); - }; - } else { - providerNode = this.mib.getProviderNodeForInstance(instanceNode); - mibRequest = new MibRequest({ - operation: requestPdu.type, - providerNode: providerNode, - instanceNode: instanceNode, - oid: requestVarbind.oid - }); - handler = providerNode.provider.handler; - } - - mibRequest.done = function (error) { - if (error) { - responsePdu.errorStatus = error.errorStatus; - responsePdu.errorIndex = error.errorIndex; - responseVarbind = { - oid: mibRequest.oid, - type: ObjectType.Null, - value: null - }; - } else { - if (requestPdu.type == PduType.SetRequest) { - mibRequest.instanceNode.value = requestVarbind.value; - } - if (requestPdu.type == PduType.GetNextRequest && requestVarbind.type == ObjectType.EndOfMibView) { - responseVarbindType = ObjectType.EndOfMibView; - } else { - responseVarbindType = mibRequest.instanceNode.valueType; - } - responseVarbind = { - oid: mibRequest.oid, - type: responseVarbindType, - value: mibRequest.instanceNode.value - }; - } - me.setSingleVarbind(responsePdu, i, responseVarbind); - if (++varbindsCompleted == varbindsLength) { - me.sendResponse.call(me, rinfo, requestMessage, responsePdu); - } - }; - if (handler) { - handler(mibRequest); - } else { - mibRequest.done(); - } - } - ; -}; - -Agent.prototype.addGetNextVarbind = function (targetVarbinds, startOid) { - var startNode = this.mib.lookup(startOid); - var getNextNode; - - if (!startNode) { - // Off-tree start specified - targetVarbinds.push({ - oid: requestVarbind.oid, - type: ObjectType.Null, - value: null - }); - } else { - getNextNode = startNode.getNextInstanceNode(); - if (!getNextNode) { - // End of MIB - targetVarbinds.push({ - oid: requestVarbind.oid, - type: ObjectType.EndOfMibView, - value: null - }); - } else { - // Normal response - targetVarbinds.push({ - oid: getNextNode.oid, - type: getNextNode.valueType, - value: getNextNode.value - }); - } - } - return getNextNode; -}; - -Agent.prototype.getNextRequest = function (requestMessage, rinfo) { - var requestPdu = requestMessage.pdu; - var varbindsLength = requestPdu.varbinds.length; - var getNextVarbinds = []; - - for (var i = 0; i < varbindsLength; i++) { - this.addGetNextVarbind(getNextVarbinds, requestPdu.varbinds[i].oid); - } - - requestMessage.pdu.varbinds = getNextVarbinds; - this.request(requestMessage, rinfo); -}; - -Agent.prototype.getBulkRequest = function (requestMessage, rinfo) { - var requestPdu = requestMessage.pdu; - var requestVarbinds = requestPdu.varbinds; - var getBulkVarbinds = []; - var startOid = []; - var getNextNode; - - for (var n = 0; n < requestPdu.nonRepeaters; n++) { - this.addGetNextVarbind(getBulkVarbinds, requestVarbinds[n].oid); - } - - for (var v = requestPdu.nonRepeaters; v < requestVarbinds.length; v++) { - startOid.push(requestVarbinds[v].oid); - } - - for (var r = 0; r < requestPdu.maxRepetitions; r++) { - for (var v = requestPdu.nonRepeaters; v < requestVarbinds.length; v++) { - getNextNode = this.addGetNextVarbind(getBulkVarbinds, startOid[v - requestPdu.nonRepeaters]); - if (getNextNode) { - startOid[v - requestPdu.nonRepeaters] = getNextNode.oid; - } - } - } - - requestMessage.pdu.varbinds = getBulkVarbinds; - this.request(requestMessage, rinfo); -}; - -Agent.prototype.setSingleVarbind = function (responsePdu, index, responseVarbind) { - responsePdu.varbinds[index] = responseVarbind; -}; - -Agent.prototype.sendResponse = function (rinfo, requestMessage, responsePdu) { - var responseMessage = requestMessage.createResponseForRequest(responsePdu); - this.listener.send(responseMessage, rinfo); - this.callback(null, Listener.formatCallbackData(responseMessage.pdu, rinfo)); -}; - -Agent.create = function (options, callback) { - var agent = new Agent(options, callback); - agent.listener.startListening(); - return agent; -}; - -/***************************************************************************** - ** Exports - **/ - -exports.Session = Session; - -exports.createSession = function (target, community, options) { - if (options.version && !(options.version == Version1 || options.version == Version2c)) { - throw new ResponseInvalidError("SNMP community session requested but version '" + options.version + "' specified in options not valid"); - } else { - return new Session(target, community, options); - } -}; - -exports.createV3Session = function (target, user, options) { - if (options.version && options.version != Version3) { - throw new ResponseInvalidError("SNMPv3 session requested but version '" + options.version + "' specified in options"); - } else { - options.version = Version3; - } - return new Session(target, user, options); -}; - -exports.createReceiver = Receiver.create; -exports.createAgent = Agent.create; - -exports.isVarbindError = isVarbindError; -exports.varbindError = varbindError; - -exports.Version1 = Version1; -exports.Version2c = Version2c; -exports.Version3 = Version3; -exports.Version = Version; - -exports.ErrorStatus = ErrorStatus; -exports.TrapType = TrapType; -exports.ObjectType = ObjectType; -exports.PduType = PduType; -exports.MibProviderType = MibProviderType; -exports.SecurityLevel = SecurityLevel; -exports.AuthProtocols = AuthProtocols; -exports.PrivProtocols = PrivProtocols; - -exports.ResponseInvalidError = ResponseInvalidError; -exports.RequestInvalidError = RequestInvalidError; -exports.RequestFailedError = RequestFailedError; -exports.RequestTimedOutError = RequestTimedOutError; - -/** - ** We've added this for testing. - **/ -exports.ObjectParser = { - readInt: readInt, - readUint: readUint -}; -exports.Authentication = Authentication; -exports.Encryption = Encryption; diff --git a/collectors/node.d.plugin/node_modules/netdata.js b/collectors/node.d.plugin/node_modules/netdata.js deleted file mode 100644 index 603922c6e..000000000 --- a/collectors/node.d.plugin/node_modules/netdata.js +++ /dev/null @@ -1,654 +0,0 @@ -'use strict'; - -// netdata -// real-time performance and health monitoring, done right! -// (C) 2016 Costa Tsaousis <costa@tsaousis.gr> -// SPDX-License-Identifier: GPL-3.0-or-later - -var url = require('url'); -var http = require('http'); -var util = require('util'); - -/* -var netdata = require('netdata'); - -var example_chart = { - id: 'id', // the unique id of the chart - name: 'name', // the name of the chart - title: 'title', // the title of the chart - units: 'units', // the units of the chart dimensions - family: 'family', // the family of the chart - context: 'context', // the context of the chart - type: netdata.chartTypes.line, // the type of the chart - priority: 0, // the priority relative to others in the same family - update_every: 1, // the expected update frequency of the chart - dimensions: { - 'dim1': { - id: 'dim1', // the unique id of the dimension - name: 'name', // the name of the dimension - algorithm: netdata.chartAlgorithms.absolute, // the id of the netdata algorithm - multiplier: 1, // the multiplier - divisor: 1, // the divisor - hidden: false, // is hidden (boolean) - }, - 'dim2': { - id: 'dim2', // the unique id of the dimension - name: 'name', // the name of the dimension - algorithm: 'absolute', // the id of the netdata algorithm - multiplier: 1, // the multiplier - divisor: 1, // the divisor - hidden: false, // is hidden (boolean) - } - // add as many dimensions as needed - } -}; -*/ - -var netdata = { - options: { - filename: __filename, - DEBUG: false, - update_every: 1 - }, - - chartAlgorithms: { - incremental: 'incremental', - absolute: 'absolute', - percentage_of_absolute_row: 'percentage-of-absolute-row', - percentage_of_incremental_row: 'percentage-of-incremental-row' - }, - - chartTypes: { - line: 'line', - area: 'area', - stacked: 'stacked' - }, - - services: new Array(), - modules_configuring: 0, - charts: {}, - - processors: { - http: { - name: 'http', - - process: function(service, callback) { - var __DEBUG = netdata.options.DEBUG; - - if(__DEBUG === true) - netdata.debug(service.module.name + ': ' + service.name + ': making ' + this.name + ' request: ' + netdata.stringify(service.request)); - - var req = http.request(service.request, function(response) { - if(__DEBUG === true) netdata.debug(service.module.name + ': ' + service.name + ': got server response...'); - - var end = false; - var data = ''; - response.setEncoding('utf8'); - - if(response.statusCode !== 200) { - if(end === false) { - service.error('Got HTTP code ' + response.statusCode + ', failed to get data.'); - end = true; - return callback(null); - } - } - - response.on('data', function(chunk) { - if(end === false) data += chunk; - }); - - response.on('error', function() { - if(end === false) { - service.error(': Read error, failed to get data.'); - end = true; - return callback(null); - } - }); - - response.on('end', function() { - if(end === false) { - if(__DEBUG === true) netdata.debug(service.module.name + ': ' + service.name + ': read completed.'); - end = true; - return callback(data); - } - }); - }); - - req.on('error', function(e) { - if(__DEBUG === true) netdata.debug('Failed to make request: ' + netdata.stringify(service.request) + ', message: ' + e.message); - service.error('Failed to make request, message: ' + e.message); - return callback(null); - }); - - // write data to request body - if(typeof service.postData !== 'undefined' && service.request.method === 'POST') { - if(__DEBUG === true) netdata.debug(service.module.name + ': ' + service.name + ': posting data: ' + service.postData); - req.write(service.postData); - } - - req.end(); - } - } - }, - - stringify: function(obj) { - return util.inspect(obj, {depth: 10}); - }, - - zeropad2: function(s) { - return ("00" + s).slice(-2); - }, - - logdate: function(d) { - if(typeof d === 'undefined') d = new Date(); - return d.getFullYear().toString() + '-' + this.zeropad2(d.getMonth() + 1) + '-' + this.zeropad2(d.getDate()) - + ' ' + this.zeropad2(d.getHours()) + ':' + this.zeropad2(d.getMinutes()) + ':' + this.zeropad2(d.getSeconds()); - }, - - // show debug info, if debug is enabled - debug: function(msg) { - if(this.options.DEBUG === true) { - console.error(this.logdate() + ': ' + netdata.options.filename + ': DEBUG: ' + ((typeof(msg) === 'object')?netdata.stringify(msg):msg).toString()); - } - }, - - // log an error - error: function(msg) { - console.error(this.logdate() + ': ' + netdata.options.filename + ': ERROR: ' + ((typeof(msg) === 'object')?netdata.stringify(msg):msg).toString()); - }, - - // send data to netdata - send: function(msg) { - console.log(msg.toString()); - }, - - service: function(service) { - if(typeof service === 'undefined') - service = {}; - - var now = Date.now(); - - service._current_chart = null; // the current chart we work on - service._queue = ''; // data to be sent to netdata - - service.error_reported = false; // error log flood control - - service.added = false; // added to netdata.services - service.enabled = true; - service.updates = 0; - service.running = false; - service.started = 0; - service.ended = 0; - - if(typeof service.module === 'undefined') { - service.module = { name: 'not-defined-module' }; - service.error('Attempted to create service without a module.'); - service.enabled = false; - } - - if(typeof service.name === 'undefined') { - service.name = 'unnamed@' + service.module.name + '/' + now; - } - - if(typeof service.processor === 'undefined') - service.processor = netdata.processors.http; - - if(typeof service.update_every === 'undefined') - service.update_every = service.module.update_every; - - if(typeof service.update_every === 'undefined') - service.update_every = netdata.options.update_every; - - if(service.update_every < netdata.options.update_every) - service.update_every = netdata.options.update_every; - - // align the runs - service.next_run = now - (now % (service.update_every * 1000)) + (service.update_every * 1000); - - service.commit = function() { - if(this.added !== true) { - this.added = true; - - var now = Date.now(); - this.next_run = now - (now % (service.update_every * 1000)) + (service.update_every * 1000); - - netdata.services.push(this); - if(netdata.options.DEBUG === true) netdata.debug(this.module.name + ': ' + this.name + ': service committed.'); - } - }; - - service.execute = function(responseProcessor) { - var __DEBUG = netdata.options.DEBUG; - - if(service.enabled === false) - return responseProcessor(null); - - this.module.active++; - this.running = true; - this.started = Date.now(); - this.updates++; - - if(__DEBUG === true) - netdata.debug(this.module.name + ': ' + this.name + ': making ' + this.processor.name + ' request: ' + netdata.stringify(this)); - - this.processor.process(this, function(response) { - service.ended = Date.now(); - service.duration = service.ended - service.started; - - if(typeof response === 'undefined') - response = null; - - if(response !== null) - service.errorClear(); - - if(__DEBUG === true) - netdata.debug(service.module.name + ': ' + service.name + ': processing ' + service.processor.name + ' response (received in ' + (service.ended - service.started).toString() + ' ms)'); - - try { - responseProcessor(service, response); - } - catch(e) { - netdata.error(e); - service.error("responseProcessor failed process response data."); - } - - service.running = false; - service.module.active--; - if(service.module.active < 0) { - service.module.active = 0; - if(__DEBUG === true) - netdata.debug(service.module.name + ': active module counter below zero.'); - } - - if(service.module.active === 0) { - // check if we run under configure - if(service.module.configure_callback !== null) { - if(__DEBUG === true) - netdata.debug(service.module.name + ': configuration finish callback called from processResponse().'); - - var configure_callback = service.module.configure_callback; - service.module.configure_callback = null; - configure_callback(); - } - } - }); - }; - - service.update = function() { - if(netdata.options.DEBUG === true) - netdata.debug(this.module.name + ': ' + this.name + ': starting data collection...'); - - this.module.update(this, function() { - if(netdata.options.DEBUG === true) - netdata.debug(service.module.name + ': ' + service.name + ': data collection ended in ' + service.duration.toString() + ' ms.'); - }); - }; - - service.error = function(message) { - if(this.error_reported === false) { - netdata.error(this.module.name + ': ' + this.name + ': ' + message); - this.error_reported = true; - } - else if(netdata.options.DEBUG === true) - netdata.debug(this.module.name + ': ' + this.name + ': ' + message); - }; - - service.errorClear = function() { - this.error_reported = false; - }; - - service.queue = function(txt) { - this._queue += txt + '\n'; - }; - - service._send_chart_to_netdata = function(chart) { - // internal function to send a chart to netdata - this.queue('CHART "' + chart.id + '" "' + chart.name + '" "' + chart.title + '" "' + chart.units + '" "' + chart.family + '" "' + chart.context + '" "' + chart.type + '" ' + chart.priority.toString() + ' ' + chart.update_every.toString()); - - if(typeof(chart.dimensions) !== 'undefined') { - var dims = Object.keys(chart.dimensions); - var len = dims.length; - while(len--) { - var d = chart.dimensions[dims[len]]; - - this.queue('DIMENSION "' + d.id + '" "' + d.name + '" "' + d.algorithm + '" ' + d.multiplier.toString() + ' ' + d.divisor.toString() + ' ' + ((d.hidden === true) ? 'hidden' : '').toString()); - d._created = true; - d._updated = false; - } - } - - chart._created = true; - chart._updated = false; - }; - - // begin data collection for a chart - service.begin = function(chart) { - if(this._current_chart !== null && this._current_chart !== chart) { - this.error('Called begin() for chart ' + chart.id + ' while chart ' + this._current_chart.id + ' is still open. Closing it.'); - this.end(); - } - - if(typeof(chart.id) === 'undefined' || netdata.charts[chart.id] !== chart) { - this.error('Called begin() for chart ' + chart.id + ' that is not mine. Where did you find it? Ignoring it.'); - return false; - } - - if(netdata.options.DEBUG === true) netdata.debug('setting current chart to ' + chart.id); - this._current_chart = chart; - this._current_chart._began = true; - - if(this._current_chart._dimensions_count !== 0) { - if(this._current_chart._created === false || this._current_chart._updated === true) - this._send_chart_to_netdata(this._current_chart); - - var now = this.ended; - this.queue('BEGIN ' + this._current_chart.id + ' ' + ((this._current_chart._last_updated > 0)?((now - this._current_chart._last_updated) * 1000):'').toString()); - } - // else this.error('Called begin() for chart ' + chart.id + ' which is empty.'); - - this._current_chart._last_updated = now; - this._current_chart._began = true; - this._current_chart._counter++; - - return true; - }; - - // set a collected value for a chart - // we do most things on the first value we attempt to set - service.set = function(dimension, value) { - if(this._current_chart === null) { - this.error('Called set(' + dimension + ', ' + value + ') without an open chart.'); - return false; - } - - if(typeof(this._current_chart.dimensions[dimension]) === 'undefined') { - this.error('Called set(' + dimension + ', ' + value + ') but dimension "' + dimension + '" does not exist in chart "' + this._current_chart.id + '".'); - return false; - } - - if(typeof value === 'undefined' || value === null) - return false; - - if(this._current_chart._dimensions_count !== 0) - this.queue('SET ' + dimension + ' = ' + value.toString()); - - return true; - }; - - // end data collection for the current chart - after calling begin() - service.end = function() { - if(this._current_chart !== null && this._current_chart._began === false) { - this.error('Called end() without an open chart.'); - return false; - } - - if(this._current_chart._dimensions_count !== 0) { - this.queue('END'); - netdata.send(this._queue); - } - - this._queue = ''; - this._current_chart._began = false; - if(netdata.options.DEBUG === true) netdata.debug('sent chart ' + this._current_chart.id); - this._current_chart = null; - return true; - }; - - // discard the collected values for the current chart - after calling begin() - service.flush = function() { - if(this._current_chart === null || this._current_chart._began === false) { - this.error('Called flush() without an open chart.'); - return false; - } - - this._queue = ''; - this._current_chart._began = false; - this._current_chart = null; - return true; - }; - - // create a netdata chart - service.chart = function(id, chart) { - var __DEBUG = netdata.options.DEBUG; - - if(typeof(netdata.charts[id]) === 'undefined') { - netdata.charts[id] = { - _created: false, - _updated: true, - _began: false, - _counter: 0, - _last_updated: 0, - _dimensions_count: 0, - id: id, - name: id, - title: 'untitled chart', - units: 'a unit', - family: '', - context: '', - type: netdata.chartTypes.line, - priority: 50000, - update_every: netdata.options.update_every, - dimensions: {} - }; - } - - var c = netdata.charts[id]; - - if(typeof(chart.name) !== 'undefined' && chart.name !== c.name) { - if(__DEBUG === true) netdata.debug('chart ' + id + ' updated its name'); - c.name = chart.name; - c._updated = true; - } - - if(typeof(chart.title) !== 'undefined' && chart.title !== c.title) { - if(__DEBUG === true) netdata.debug('chart ' + id + ' updated its title'); - c.title = chart.title; - c._updated = true; - } - - if(typeof(chart.units) !== 'undefined' && chart.units !== c.units) { - if(__DEBUG === true) netdata.debug('chart ' + id + ' updated its units'); - c.units = chart.units; - c._updated = true; - } - - if(typeof(chart.family) !== 'undefined' && chart.family !== c.family) { - if(__DEBUG === true) netdata.debug('chart ' + id + ' updated its family'); - c.family = chart.family; - c._updated = true; - } - - if(typeof(chart.context) !== 'undefined' && chart.context !== c.context) { - if(__DEBUG === true) netdata.debug('chart ' + id + ' updated its context'); - c.context = chart.context; - c._updated = true; - } - - if(typeof(chart.type) !== 'undefined' && chart.type !== c.type) { - if(__DEBUG === true) netdata.debug('chart ' + id + ' updated its type'); - c.type = chart.type; - c._updated = true; - } - - if(typeof(chart.priority) !== 'undefined' && chart.priority !== c.priority) { - if(__DEBUG === true) netdata.debug('chart ' + id + ' updated its priority'); - c.priority = chart.priority; - c._updated = true; - } - - if(typeof(chart.update_every) !== 'undefined' && chart.update_every !== c.update_every) { - if(__DEBUG === true) netdata.debug('chart ' + id + ' updated its update_every from ' + c.update_every + ' to ' + chart.update_every); - c.update_every = chart.update_every; - c._updated = true; - } - - if(typeof(chart.dimensions) !== 'undefined') { - var dims = Object.keys(chart.dimensions); - var len = dims.length; - while(len--) { - var x = dims[len]; - - if(typeof(c.dimensions[x]) === 'undefined') { - c._dimensions_count++; - - c.dimensions[x] = { - _created: false, - _updated: false, - id: x, // the unique id of the dimension - name: x, // the name of the dimension - algorithm: netdata.chartAlgorithms.absolute, // the id of the netdata algorithm - multiplier: 1, // the multiplier - divisor: 1, // the divisor - hidden: false // is hidden (boolean) - }; - - if(__DEBUG === true) netdata.debug('chart ' + id + ' created dimension ' + x); - c._updated = true; - } - - var dim = chart.dimensions[x]; - var d = c.dimensions[x]; - - if(typeof(dim.name) !== 'undefined' && d.name !== dim.name) { - if(__DEBUG === true) netdata.debug('chart ' + id + ', dimension ' + x + ' updated its name'); - d.name = dim.name; - d._updated = true; - } - - if(typeof(dim.algorithm) !== 'undefined' && d.algorithm !== dim.algorithm) { - if(__DEBUG === true) netdata.debug('chart ' + id + ', dimension ' + x + ' updated its algorithm from ' + d.algorithm + ' to ' + dim.algorithm); - d.algorithm = dim.algorithm; - d._updated = true; - } - - if(typeof(dim.multiplier) !== 'undefined' && d.multiplier !== dim.multiplier) { - if(__DEBUG === true) netdata.debug('chart ' + id + ', dimension ' + x + ' updated its multiplier'); - d.multiplier = dim.multiplier; - d._updated = true; - } - - if(typeof(dim.divisor) !== 'undefined' && d.divisor !== dim.divisor) { - if(__DEBUG === true) netdata.debug('chart ' + id + ', dimension ' + x + ' updated its divisor'); - d.divisor = dim.divisor; - d._updated = true; - } - - if(typeof(dim.hidden) !== 'undefined' && d.hidden !== dim.hidden) { - if(__DEBUG === true) netdata.debug('chart ' + id + ', dimension ' + x + ' updated its hidden status'); - d.hidden = dim.hidden; - d._updated = true; - } - - if(d._updated) c._updated = true; - } - } - - //if(netdata.options.DEBUG === true) netdata.debug(netdata.charts); - return netdata.charts[id]; - }; - - return service; - }, - - runAllServices: function() { - if(netdata.options.DEBUG === true) netdata.debug('runAllServices()'); - - var now = Date.now(); - var len = netdata.services.length; - while(len--) { - var service = netdata.services[len]; - - if(service.enabled === false || service.running === true) continue; - if(now <= service.next_run) continue; - - service.update(); - - now = Date.now(); - service.next_run = now - (now % (service.update_every * 1000)) + (service.update_every * 1000); - } - - // 1/10th of update_every in pause - setTimeout(netdata.runAllServices, netdata.options.update_every * 100); - }, - - start: function() { - if(netdata.options.DEBUG === true) this.debug('started, services: ' + netdata.stringify(this.services)); - - if(this.services.length === 0) { - this.disableNodePlugin(); - - // eslint suggested way to exit - var exit = process.exit; - exit(1); - } - else this.runAllServices(); - }, - - // disable the whole node.js plugin - disableNodePlugin: function() { - this.send('DISABLE'); - - // eslint suggested way to exit - var exit = process.exit; - exit(1); - }, - - requestFromParams: function(protocol, hostname, port, path, method) { - return { - protocol: protocol, - hostname: hostname, - port: port, - path: path, - //family: 4, - method: method, - headers: { - 'Content-Type': 'application/x-www-form-urlencoded', - 'Connection': 'keep-alive' - }, - agent: new http.Agent({ - keepAlive: true, - keepAliveMsecs: netdata.options.update_every * 1000, - maxSockets: 2, // it must be 2 to work - maxFreeSockets: 1 - }) - }; - }, - - requestFromURL: function(a_url) { - var u = url.parse(a_url); - return netdata.requestFromParams(u.protocol, u.hostname, u.port, u.path, 'GET'); - }, - - configure: function(module, config, callback) { - if(netdata.options.DEBUG === true) this.debug(module.name + ': configuring (update_every: ' + this.options.update_every + ')...'); - - module.active = 0; - module.update_every = this.options.update_every; - - if(typeof config.update_every !== 'undefined') - module.update_every = config.update_every; - - module.enable_autodetect = (config.enable_autodetect)?true:false; - - if(typeof(callback) === 'function') - module.configure_callback = callback; - else - module.configure_callback = null; - - var added = module.configure(config); - - if(netdata.options.DEBUG === true) this.debug(module.name + ': configured, reporting ' + added + ' eligible services.'); - - if(module.configure_callback !== null && added === 0) { - if(netdata.options.DEBUG === true) this.debug(module.name + ': configuration finish callback called from configure().'); - var configure_callback = module.configure_callback; - module.configure_callback = null; - configure_callback(); - } - - return added; - } -}; - -if(netdata.options.DEBUG === true) netdata.debug('loaded netdata from:', __filename); -module.exports = netdata; diff --git a/collectors/node.d.plugin/node_modules/pixl-xml.js b/collectors/node.d.plugin/node_modules/pixl-xml.js deleted file mode 100644 index 48de89e77..000000000 --- a/collectors/node.d.plugin/node_modules/pixl-xml.js +++ /dev/null @@ -1,607 +0,0 @@ -// SPDX-License-Identifier: MIT -/* - JavaScript XML Library - Plus a bunch of object utility functions - - Usage: - var XML = require('pixl-xml'); - var myxmlstring = '<?xml version="1.0"?><Document>' + - '<Simple>Hello</Simple>' + - '<Node Key="Value">Content</Node>' + - '</Document>'; - - var tree = XML.parse( myxmlstring, { preserveAttributes: true }); - console.log( tree ); - - tree.Simple = "Hello2"; - tree.Node._Attribs.Key = "Value2"; - tree.Node._Data = "Content2"; - tree.New = "I added this"; - - console.log( XML.stringify( tree, 'Document' ) ); - - Copyright (c) 2004 - 2015 Joseph Huckaby - Released under the MIT License - This version is for Node.JS, converted in 2012. -*/ - -var fs = require('fs'); - -var indent_string = "\t"; -var xml_header = '<?xml version="1.0"?>'; -var sort_args = null; -var re_valid_tag_name = /^\w[\w\-\:]*$/; - -var XML = exports.XML = function XML(args) { - // class constructor for XML parser class - // pass in args hash or text to parse - if (!args) args = ''; - if (isa_hash(args)) { - for (var key in args) this[key] = args[key]; - } - else this.text = args || ''; - - // stringify buffers - if (this.text instanceof Buffer) { - this.text = this.text.toString(); - } - - if (!this.text.match(/^\s*</)) { - // try as file path - var file = this.text; - this.text = fs.readFileSync(file, { encoding: 'utf8' }); - if (!this.text) throw new Error("File not found: " + file); - } - - this.tree = {}; - this.errors = []; - this.piNodeList = []; - this.dtdNodeList = []; - this.documentNodeName = ''; - - if (this.lowerCase) { - this.attribsKey = this.attribsKey.toLowerCase(); - this.dataKey = this.dataKey.toLowerCase(); - } - - this.patTag.lastIndex = 0; - if (this.text) this.parse(); -} - -XML.prototype.preserveAttributes = false; -XML.prototype.lowerCase = false; - -XML.prototype.patTag = /([^<]*?)<([^>]+)>/g; -XML.prototype.patSpecialTag = /^\s*([\!\?])/; -XML.prototype.patPITag = /^\s*\?/; -XML.prototype.patCommentTag = /^\s*\!--/; -XML.prototype.patDTDTag = /^\s*\!DOCTYPE/; -XML.prototype.patCDATATag = /^\s*\!\s*\[\s*CDATA/; -XML.prototype.patStandardTag = /^\s*(\/?)([\w\-\:\.]+)\s*(.*)$/; -XML.prototype.patSelfClosing = /\/\s*$/; -XML.prototype.patAttrib = new RegExp("([\\w\\-\\:\\.]+)\\s*=\\s*([\\\"\\'])([^\\2]*?)\\2", "g"); -XML.prototype.patPINode = /^\s*\?\s*([\w\-\:]+)\s*(.*)$/; -XML.prototype.patEndComment = /--$/; -XML.prototype.patNextClose = /([^>]*?)>/g; -XML.prototype.patExternalDTDNode = new RegExp("^\\s*\\!DOCTYPE\\s+([\\w\\-\\:]+)\\s+(SYSTEM|PUBLIC)\\s+\\\"([^\\\"]+)\\\""); -XML.prototype.patInlineDTDNode = /^\s*\!DOCTYPE\s+([\w\-\:]+)\s+\[/; -XML.prototype.patEndDTD = /\]$/; -XML.prototype.patDTDNode = /^\s*\!DOCTYPE\s+([\w\-\:]+)\s+\[(.*)\]/; -XML.prototype.patEndCDATA = /\]\]$/; -XML.prototype.patCDATANode = /^\s*\!\s*\[\s*CDATA\s*\[([^]*)\]\]/; - -XML.prototype.attribsKey = '_Attribs'; -XML.prototype.dataKey = '_Data'; - -XML.prototype.parse = function(branch, name) { - // parse text into XML tree, recurse for nested nodes - if (!branch) branch = this.tree; - if (!name) name = null; - var foundClosing = false; - var matches = null; - - // match each tag, plus preceding text - while ( matches = this.patTag.exec(this.text) ) { - var before = matches[1]; - var tag = matches[2]; - - // text leading up to tag = content of parent node - if (before.match(/\S/)) { - if (typeof(branch[this.dataKey]) != 'undefined') branch[this.dataKey] += ' '; else branch[this.dataKey] = ''; - branch[this.dataKey] += trim(decode_entities(before)); - } - - // parse based on tag type - if (tag.match(this.patSpecialTag)) { - // special tag - if (tag.match(this.patPITag)) tag = this.parsePINode(tag); - else if (tag.match(this.patCommentTag)) tag = this.parseCommentNode(tag); - else if (tag.match(this.patDTDTag)) tag = this.parseDTDNode(tag); - else if (tag.match(this.patCDATATag)) { - tag = this.parseCDATANode(tag); - if (typeof(branch[this.dataKey]) != 'undefined') branch[this.dataKey] += ' '; else branch[this.dataKey] = ''; - branch[this.dataKey] += trim(decode_entities(tag)); - } // cdata - else { - this.throwParseError( "Malformed special tag", tag ); - break; - } // error - - if (tag == null) break; - continue; - } // special tag - else { - // Tag is standard, so parse name and attributes (if any) - var matches = tag.match(this.patStandardTag); - if (!matches) { - this.throwParseError( "Malformed tag", tag ); - break; - } - - var closing = matches[1]; - var nodeName = this.lowerCase ? matches[2].toLowerCase() : matches[2]; - var attribsRaw = matches[3]; - - // If this is a closing tag, make sure it matches its opening tag - if (closing) { - if (nodeName == (name || '')) { - foundClosing = 1; - break; - } - else { - this.throwParseError( "Mismatched closing tag (expected </" + name + ">)", tag ); - break; - } - } // closing tag - else { - // Not a closing tag, so parse attributes into hash. If tag - // is self-closing, no recursive parsing is needed. - var selfClosing = !!attribsRaw.match(this.patSelfClosing); - var leaf = {}; - var attribs = leaf; - - // preserve attributes means they go into a sub-hash named "_Attribs" - // the XML composer honors this for restoring the tree back into XML - if (this.preserveAttributes) { - leaf[this.attribsKey] = {}; - attribs = leaf[this.attribsKey]; - } - - // parse attributes - this.patAttrib.lastIndex = 0; - while ( matches = this.patAttrib.exec(attribsRaw) ) { - var key = this.lowerCase ? matches[1].toLowerCase() : matches[1]; - attribs[ key ] = decode_entities( matches[3] ); - } // foreach attrib - - // if no attribs found, but we created the _Attribs subhash, clean it up now - if (this.preserveAttributes && !num_keys(attribs)) { - delete leaf[this.attribsKey]; - } - - // Recurse for nested nodes - if (!selfClosing) { - this.parse( leaf, nodeName ); - if (this.error()) break; - } - - // Compress into simple node if text only - var num_leaf_keys = num_keys(leaf); - if ((typeof(leaf[this.dataKey]) != 'undefined') && (num_leaf_keys == 1)) { - leaf = leaf[this.dataKey]; - } - else if (!num_leaf_keys) { - leaf = ''; - } - - // Add leaf to parent branch - if (typeof(branch[nodeName]) != 'undefined') { - if (isa_array(branch[nodeName])) { - branch[nodeName].push( leaf ); - } - else { - var temp = branch[nodeName]; - branch[nodeName] = [ temp, leaf ]; - } - } - else { - branch[nodeName] = leaf; - } - - if (this.error() || (branch == this.tree)) break; - } // not closing - } // standard tag - } // main reg exp - - // Make sure we found the closing tag - if (name && !foundClosing) { - this.throwParseError( "Missing closing tag (expected </" + name + ">)", name ); - } - - // If we are the master node, finish parsing and setup our doc node - if (branch == this.tree) { - if (typeof(this.tree[this.dataKey]) != 'undefined') delete this.tree[this.dataKey]; - - if (num_keys(this.tree) > 1) { - this.throwParseError( 'Only one top-level node is allowed in document', first_key(this.tree) ); - return; - } - - this.documentNodeName = first_key(this.tree); - if (this.documentNodeName) { - this.tree = this.tree[this.documentNodeName]; - } - } -}; - -XML.prototype.throwParseError = function(key, tag) { - // log error and locate current line number in source XML document - var parsedSource = this.text.substring(0, this.patTag.lastIndex); - var eolMatch = parsedSource.match(/\n/g); - var lineNum = (eolMatch ? eolMatch.length : 0) + 1; - lineNum -= tag.match(/\n/) ? tag.match(/\n/g).length : 0; - - this.errors.push({ - type: 'Parse', - key: key, - text: '<' + tag + '>', - line: lineNum - }); - - // Throw actual error (must wrap parse in try/catch) - throw new Error( this.getLastError() ); -}; - -XML.prototype.error = function() { - // return number of errors - return this.errors.length; -}; - -XML.prototype.getError = function(error) { - // get formatted error - var text = ''; - if (!error) return ''; - - text = (error.type || 'General') + ' Error'; - if (error.code) text += ' ' + error.code; - text += ': ' + error.key; - - if (error.line) text += ' on line ' + error.line; - if (error.text) text += ': ' + error.text; - - return text; -}; - -XML.prototype.getLastError = function() { - // Get most recently thrown error in plain text format - if (!this.error()) return ''; - return this.getError( this.errors[this.errors.length - 1] ); -}; - -XML.prototype.parsePINode = function(tag) { - // Parse Processor Instruction Node, e.g. <?xml version="1.0"?> - if (!tag.match(this.patPINode)) { - this.throwParseError( "Malformed processor instruction", tag ); - return null; - } - - this.piNodeList.push( tag ); - return tag; -}; - -XML.prototype.parseCommentNode = function(tag) { - // Parse Comment Node, e.g. <!-- hello --> - var matches = null; - this.patNextClose.lastIndex = this.patTag.lastIndex; - - while (!tag.match(this.patEndComment)) { - if (matches = this.patNextClose.exec(this.text)) { - tag += '>' + matches[1]; - } - else { - this.throwParseError( "Unclosed comment tag", tag ); - return null; - } - } - - this.patTag.lastIndex = this.patNextClose.lastIndex; - return tag; -}; - -XML.prototype.parseDTDNode = function(tag) { - // Parse Document Type Descriptor Node, e.g. <!DOCTYPE ... > - var matches = null; - - if (tag.match(this.patExternalDTDNode)) { - // tag is external, and thus self-closing - this.dtdNodeList.push( tag ); - } - else if (tag.match(this.patInlineDTDNode)) { - // Tag is inline, so check for nested nodes. - this.patNextClose.lastIndex = this.patTag.lastIndex; - - while (!tag.match(this.patEndDTD)) { - if (matches = this.patNextClose.exec(this.text)) { - tag += '>' + matches[1]; - } - else { - this.throwParseError( "Unclosed DTD tag", tag ); - return null; - } - } - - this.patTag.lastIndex = this.patNextClose.lastIndex; - - // Make sure complete tag is well-formed, and push onto DTD stack. - if (tag.match(this.patDTDNode)) { - this.dtdNodeList.push( tag ); - } - else { - this.throwParseError( "Malformed DTD tag", tag ); - return null; - } - } - else { - this.throwParseError( "Malformed DTD tag", tag ); - return null; - } - - return tag; -}; - -XML.prototype.parseCDATANode = function(tag) { - // Parse CDATA Node, e.g. <![CDATA[Brooks & Shields]]> - var matches = null; - this.patNextClose.lastIndex = this.patTag.lastIndex; - - while (!tag.match(this.patEndCDATA)) { - if (matches = this.patNextClose.exec(this.text)) { - tag += '>' + matches[1]; - } - else { - this.throwParseError( "Unclosed CDATA tag", tag ); - return null; - } - } - - this.patTag.lastIndex = this.patNextClose.lastIndex; - - if (matches = tag.match(this.patCDATANode)) { - return matches[1]; - } - else { - this.throwParseError( "Malformed CDATA tag", tag ); - return null; - } -}; - -XML.prototype.getTree = function() { - // get reference to parsed XML tree - return this.tree; -}; - -XML.prototype.compose = function() { - // compose tree back into XML - var raw = compose_xml( this.tree, this.documentNodeName ); - var body = raw.substring( raw.indexOf("\n") + 1, raw.length ); - var xml = ''; - - if (this.piNodeList.length) { - for (var idx = 0, len = this.piNodeList.length; idx < len; idx++) { - xml += '<' + this.piNodeList[idx] + '>' + "\n"; - } - } - else { - xml += xml_header + "\n"; - } - - if (this.dtdNodeList.length) { - for (var idx = 0, len = this.dtdNodeList.length; idx < len; idx++) { - xml += '<' + this.dtdNodeList[idx] + '>' + "\n"; - } - } - - xml += body; - return xml; -}; - -// -// Static Utility Functions: -// - -var parse_xml = exports.parse = function parse_xml(text, opts) { - // turn text into XML tree quickly - if (!opts) opts = {}; - opts.text = text; - var parser = new XML(opts); - return parser.error() ? parser.getLastError() : parser.getTree(); -}; - -var trim = exports.trim = function trim(text) { - // strip whitespace from beginning and end of string - if (text == null) return ''; - - if (text && text.replace) { - text = text.replace(/^\s+/, ""); - text = text.replace(/\s+$/, ""); - } - - return text; -}; - -var encode_entities = exports.encodeEntities = function encode_entities(text) { - // Simple entitize exports.for = function for composing XML - if (text == null) return ''; - - if (text && text.replace) { - text = text.replace(/\&/g, "&"); // MUST BE FIRST - text = text.replace(/</g, "<"); - text = text.replace(/>/g, ">"); - } - - return text; -}; - -var encode_attrib_entities = exports.encodeAttribEntities = function encode_attrib_entities(text) { - // Simple entitize exports.for = function for composing XML attributes - if (text == null) return ''; - - if (text && text.replace) { - text = text.replace(/\&/g, "&"); // MUST BE FIRST - text = text.replace(/</g, "<"); - text = text.replace(/>/g, ">"); - text = text.replace(/\"/g, """); - text = text.replace(/\'/g, "'"); - } - - return text; -}; - -var decode_entities = exports.decodeEntities = function decode_entities(text) { - // Decode XML entities into raw ASCII - if (text == null) return ''; - - if (text && text.replace && text.match(/\&/)) { - text = text.replace(/\<\;/g, "<"); - text = text.replace(/\>\;/g, ">"); - text = text.replace(/\"\;/g, '"'); - text = text.replace(/\&apos\;/g, "'"); - text = text.replace(/\&\;/g, "&"); // MUST BE LAST - } - - return text; -}; - -var compose_xml = exports.stringify = function compose_xml(node, name, indent) { - // Compose node into XML including attributes - // Recurse for child nodes - var xml = ""; - - // If this is the root node, set the indent to 0 - // and setup the XML header (PI node) - if (!indent) { - indent = 0; - xml = xml_header + "\n"; - - if (!name) { - // no name provided, assume content is wrapped in it - name = first_key(node); - node = node[name]; - } - } - - // Setup the indent text - var indent_text = ""; - for (var k = 0; k < indent; k++) indent_text += indent_string; - - if ((typeof(node) == 'object') && (node != null)) { - // node is object -- now see if it is an array or hash - if (!node.length) { // what about zero-length array? - // node is hash - xml += indent_text + "<" + name; - - var num_keys = 0; - var has_attribs = 0; - for (var key in node) num_keys++; // there must be a better way... - - if (node["_Attribs"]) { - has_attribs = 1; - var sorted_keys = hash_keys_to_array(node["_Attribs"]).sort(); - for (var idx = 0, len = sorted_keys.length; idx < len; idx++) { - var key = sorted_keys[idx]; - xml += " " + key + "=\"" + encode_attrib_entities(node["_Attribs"][key]) + "\""; - } - } // has attribs - - if (num_keys > has_attribs) { - // has child elements - xml += ">"; - - if (node["_Data"]) { - // simple text child node - xml += encode_entities(node["_Data"]) + "</" + name + ">\n"; - } // just text - else { - xml += "\n"; - - var sorted_keys = hash_keys_to_array(node).sort(); - for (var idx = 0, len = sorted_keys.length; idx < len; idx++) { - var key = sorted_keys[idx]; - if ((key != "_Attribs") && key.match(re_valid_tag_name)) { - // recurse for node, with incremented indent value - xml += compose_xml( node[key], key, indent + 1 ); - } // not _Attribs key - } // foreach key - - xml += indent_text + "</" + name + ">\n"; - } // real children - } - else { - // no child elements, so self-close - xml += "/>\n"; - } - } // standard node - else { - // node is array - for (var idx = 0; idx < node.length; idx++) { - // recurse for node in array with same indent - xml += compose_xml( node[idx], name, indent ); - } - } // array of nodes - } // complex node - else { - // node is simple string - xml += indent_text + "<" + name + ">" + encode_entities(node) + "</" + name + ">\n"; - } // simple text node - - return xml; -}; - -var always_array = exports.alwaysArray = function always_array(obj, key) { - // if object is not array, return array containing object - // if key is passed, work like XMLalwaysarray() instead - if (key) { - if ((typeof(obj[key]) != 'object') || (typeof(obj[key].length) == 'undefined')) { - var temp = obj[key]; - delete obj[key]; - obj[key] = new Array(); - obj[key][0] = temp; - } - return null; - } - else { - if ((typeof(obj) != 'object') || (typeof(obj.length) == 'undefined')) { return [ obj ]; } - else return obj; - } -}; - -var hash_keys_to_array = exports.hashKeysToArray = function hash_keys_to_array(hash) { - // convert hash keys to array (discard values) - var array = []; - for (var key in hash) array.push(key); - return array; -}; - -var isa_hash = exports.isaHash = function isa_hash(arg) { - // determine if arg is a hash - return( !!arg && (typeof(arg) == 'object') && (typeof(arg.length) == 'undefined') ); -}; - -var isa_array = exports.isaArray = function isa_array(arg) { - // determine if arg is an array or is array-like - if (typeof(arg) == 'array') return true; - return( !!arg && (typeof(arg) == 'object') && (typeof(arg.length) != 'undefined') ); -}; - -var first_key = exports.firstKey = function first_key(hash) { - // return first key from hash (unordered) - for (var key in hash) return key; - return null; // no keys in hash -}; - -var num_keys = exports.numKeys = function num_keys(hash) { - // count the number of keys in a hash - var count = 0; - for (var a in hash) count++; - return count; -}; diff --git a/collectors/node.d.plugin/snmp/Makefile.inc b/collectors/node.d.plugin/snmp/Makefile.inc deleted file mode 100644 index 26448a1ce..000000000 --- a/collectors/node.d.plugin/snmp/Makefile.inc +++ /dev/null @@ -1,13 +0,0 @@ -# SPDX-License-Identifier: GPL-3.0-or-later - -# THIS IS NOT A COMPLETE Makefile -# IT IS INCLUDED BY ITS PARENT'S Makefile.am -# IT IS REQUIRED TO REFERENCE ALL FILES RELATIVE TO THE PARENT - -# install these files -dist_node_DATA += snmp/snmp.node.js -# dist_nodeconfig_DATA += snmp/snmp.conf - -# do not install these files, but include them in the distribution -dist_noinst_DATA += snmp/README.md snmp/Makefile.inc - diff --git a/collectors/node.d.plugin/snmp/README.md b/collectors/node.d.plugin/snmp/README.md deleted file mode 100644 index 2df94c7b5..000000000 --- a/collectors/node.d.plugin/snmp/README.md +++ /dev/null @@ -1,445 +0,0 @@ -<!-- -title: "SNMP device monitoring with Netdata" -custom_edit_url: https://github.com/netdata/netdata/edit/master/collectors/node.d.plugin/snmp/README.md -sidebar_label: "SNMP" ---> - -# SNMP device monitoring with Netdata - -Collects data from any SNMP device and uses the [net-snmp](https://github.com/markabrahams/node-net-snmp) module. - -It supports: - -- all SNMP versions: SNMPv1, SNMPv2c and SNMPv3 -- any number of SNMP devices -- each SNMP device can be used to collect data for any number of charts -- each chart may have any number of dimensions -- each SNMP device may have a different update frequency -- each SNMP device will accept one or more batches to report values (you can set `max_request_size` per SNMP server, to control the size of batches). - -## Requirements - -- `nodejs` minimum required version 4 - -## Configuration - -You will need to create the file `/etc/netdata/node.d/snmp.conf` with data like the following. - -In this example: - -- the SNMP device is `10.11.12.8`. -- the SNMP community is `public`. -- we will update the values every 10 seconds (`update_every: 10` under the server `10.11.12.8`). -- we define 2 charts `snmp_switch.bandwidth_port1` and `snmp_switch.bandwidth_port2`, each having 2 dimensions: `in` and `out`. Note that the charts and dimensions must not contain any white space or special characters, other than `.` and `_`. - -```json -{ - "enable_autodetect": false, - "update_every": 5, - "max_request_size": 100, - "servers": [ - { - "hostname": "10.11.12.8", - "community": "public", - "update_every": 10, - "max_request_size": 50, - "options": { - "timeout": 10000 - }, - "charts": { - "snmp_switch.bandwidth_port1": { - "title": "Switch Bandwidth for port 1", - "units": "kilobits/s", - "type": "area", - "priority": 1, - "family": "ports", - "dimensions": { - "in": { - "oid": "1.3.6.1.2.1.2.2.1.10.1", - "algorithm": "incremental", - "multiplier": 8, - "divisor": 1024, - "offset": 0 - }, - "out": { - "oid": "1.3.6.1.2.1.2.2.1.16.1", - "algorithm": "incremental", - "multiplier": -8, - "divisor": 1024, - "offset": 0 - } - } - }, - "snmp_switch.bandwidth_port2": { - "title": "Switch Bandwidth for port 2", - "units": "kilobits/s", - "type": "area", - "priority": 1, - "family": "ports", - "dimensions": { - "in": { - "oid": "1.3.6.1.2.1.2.2.1.10.2", - "algorithm": "incremental", - "multiplier": 8, - "divisor": 1024, - "offset": 0 - }, - "out": { - "oid": "1.3.6.1.2.1.2.2.1.16.2", - "algorithm": "incremental", - "multiplier": -8, - "divisor": 1024, - "offset": 0 - } - } - } - } - } - ] -} -``` - -`update_every` is the update frequency for each server, in seconds. - -`max_request_size` limits the maximum number of OIDs that will be requested in a single call. The default is 50. Lower this number of you get `TooBig` errors in Netdata's `error.log`. - -`family` sets the name of the submenu of the dashboard each chart will appear under. - -`multiplier` and `divisor` are passed by the plugin to the Netdata daemon and are applied to the metric to convert it properly to `units`. For incremental counters with the exception of Counter64 type metrics, `offset` is added to the metric from within the SNMP plugin. This means that the value you will see in debug mode in the `DEBUG: setting current chart to... SET` line for a metric will not have been multiplied or divided, but it will have had the offset added to it. - -<details markdown="1"><summary><b>Caution: Counter64 metrics do not support `offset` (issue #5028).</b></summary> -The SNMP plugin supports Counter64 metrics with the only limitation that the `offset` parameter should not be defined. Due to the way Javascript handles large numbers and the fact that the offset is applied to metrics inside the plugin, the offset will be ignored silently. -</details> - -If you need to define many charts using incremental OIDs, you can use something like this: - -```json -{ - "enable_autodetect": false, - "update_every": 10, - "servers": [ - { - "hostname": "10.11.12.8", - "community": "public", - "update_every": 10, - "options": { - "timeout": 20000 - }, - "charts": { - "snmp_switch.bandwidth_port": { - "title": "Switch Bandwidth for port ", - "units": "kilobits/s", - "type": "area", - "priority": 1, - "family": "ports", - "multiply_range": [ - 1, - 24 - ], - "dimensions": { - "in": { - "oid": "1.3.6.1.2.1.2.2.1.10.", - "algorithm": "incremental", - "multiplier": 8, - "divisor": 1024, - "offset": 0 - }, - "out": { - "oid": "1.3.6.1.2.1.2.2.1.16.", - "algorithm": "incremental", - "multiplier": -8, - "divisor": 1024, - "offset": 0 - } - } - } - } - } - ] -} -``` - -This is like the previous, but the option `multiply_range` given, will multiply the current chart from `1` to `24` inclusive, producing 24 charts in total for the 24 ports of the switch `10.11.12.8`. - -Each of the 24 new charts will have its id (1-24) appended at: - -1. its chart unique id, i.e. `snmp_switch.bandwidth_port1` to `snmp_switch.bandwidth_port24` -2. its `title`, i.e. `Switch Bandwidth for port 1` to `Switch Bandwidth for port 24` -3. its `oid` (for all dimensions), i.e. dimension `in` will be `1.3.6.1.2.1.2.2.1.10.1` to `1.3.6.1.2.1.2.2.1.10.24` -4. its priority (which will be incremented for each chart so that the charts will appear on the dashboard in this order) - -The `options` given for each server, are: - -- `port` - UDP port to send requests too. Defaults to `161`. -- `retries` - number of times to re-send a request. Defaults to `1`. -- `sourceAddress` - IP address from which SNMP requests should originate, there is no default for this option, the operating system will select an appropriate source address when the SNMP request is sent. -- `sourcePort` - UDP port from which SNMP requests should originate, defaults to an ephemeral port selected by the operation system. -- `timeout` - number of milliseconds to wait for a response before re-trying or failing. Defaults to `5000`. -- `transport` - specify the transport to use, can be either `udp4` or `udp6`. Defaults to `udp4`. -- `version` - either `0` (v1) or `1` (v2) or `3` (v3). Defaults to `0`. -- `idBitsSize` - either `16` or `32`. Defaults to `32`. Used to reduce the size of the generated id for compatibility with some older devices. - -## SNMPv3 - -To use SNMPv3: - -- use `user` instead of `community` -- set `version` to 3 - -User syntax: - -```json -{ - "enable_autodetect": false, - "update_every": 10, - "servers": [ - { - "hostname": "10.11.12.8", - "user": { - "name": "userName", - "level": 3, - "authProtocol": "3", - "authKey": "authKey", - "privProtocol": "2", - "privKey": "privKey" - }, - "update_every": 10, - "options": { - "version": 3 - }, - "charts": { - } - } - ] -} -``` - -Security levels (`level`): - -- 1 is `noAuthNoPriv` -- 2 is `authNoPriv` -- 3 is `authPriv` - -Authentication protocols (`authProtocol`): - -- "1" is `none` -- "2" is `md5` -- "3" is `sha` - -Privacy protocols (`privProtocol`): - -- "1" is `none` -- "2" is `des` - -For additional details please see [net-snmp module readme](https://github.com/markabrahams/node-net-snmp#snmpcreatev3session-target-user-options). - -## Retrieving names from snmp - -You can append a value retrieved from SNMP to the title, by adding `titleoid` to the chart. - -You can set a dimension name to a value retrieved from SNMP, by adding `oidname` to the dimension. - -Both of the above will participate in `multiply_range`. - -## Testing the configuration - -To test it, you can run: - -```sh -/usr/libexec/netdata/plugins.d/node.d.plugin 1 snmp -``` - -The above will run it on your console and you will be able to see what Netdata sees, but also errors. You can get a very detailed output by appending `debug` to the command line. - -If it works, restart Netdata to activate the snmp collector and refresh the dashboard (if your SNMP device responds with a delay, you may need to refresh the dashboard in a few seconds). - -## Data collection speed - -Keep in mind that many SNMP switches and routers are very slow. They may not be able to report values per second. If you run `node.d.plugin` in `debug` mode, it will report the time it took for the SNMP device to respond. My switch, for example, needs 7-8 seconds to respond for the traffic on 24 ports (48 OIDs, in/out). - -Also, if you use many SNMP clients on the same SNMP device at the same time, values may be skipped. This is a problem of the SNMP device, not this collector. - -## Finding OIDs - -Use `snmpwalk`, like this: - -```sh -snmpwalk -t 20 -v 1 -O fn -c public 10.11.12.8 -``` - -- `-t 20` is the timeout in seconds -- `-v 1` is the SNMP version -- `-O fn` will display full OIDs in numeric format (you may want to run it also without this option to see human readable output of OIDs) -- `-c public` is the SNMP community -- `10.11.12.8` is the SNMP device - -Keep in mind that `snmpwalk` outputs the OIDs with a dot in front them. You should remove this dot when adding OIDs to the configuration file of this collector. - -## Example: Linksys SRW2024P - -This is what I use for my Linksys SRW2024P. It creates: - -1. A chart for power consumption (it is a PoE switch) -2. Two charts for packets received (total packets received and packets received with errors) -3. One chart for packets output -4. 24 charts, one for each port of the switch. It also appends the port names, as defined at the switch, to the chart titles. - -This switch also reports various other metrics, like snmp, packets per port, etc. Unfortunately it does not report CPU utilization or backplane utilization. - -This switch has a very slow SNMP processors. To respond, it needs about 8 seconds, so I have set the refresh frequency (`update_every`) to 15 seconds. - -```json -{ - "enable_autodetect": false, - "update_every": 5, - "servers": [ - { - "hostname": "10.11.12.8", - "community": "public", - "update_every": 15, - "options": { - "timeout": 20000, - "version": 1 - }, - "charts": { - "snmp_switch.power": { - "title": "Switch Power Supply", - "units": "watts", - "type": "line", - "priority": 10, - "family": "power", - "dimensions": { - "supply": { - "oid": ".1.3.6.1.2.1.105.1.3.1.1.2.1", - "algorithm": "absolute", - "multiplier": 1, - "divisor": 1, - "offset": 0 - }, - "used": { - "oid": ".1.3.6.1.2.1.105.1.3.1.1.4.1", - "algorithm": "absolute", - "multiplier": 1, - "divisor": 1, - "offset": 0 - } - } - }, - "snmp_switch.input": { - "title": "Switch Packets Input", - "units": "packets/s", - "type": "area", - "priority": 20, - "family": "IP", - "dimensions": { - "receives": { - "oid": ".1.3.6.1.2.1.4.3.0", - "algorithm": "incremental", - "multiplier": 1, - "divisor": 1, - "offset": 0 - }, - "discards": { - "oid": ".1.3.6.1.2.1.4.8.0", - "algorithm": "incremental", - "multiplier": 1, - "divisor": 1, - "offset": 0 - } - } - }, - "snmp_switch.input_errors": { - "title": "Switch Received Packets with Errors", - "units": "packets/s", - "type": "line", - "priority": 30, - "family": "IP", - "dimensions": { - "bad_header": { - "oid": ".1.3.6.1.2.1.4.4.0", - "algorithm": "incremental", - "multiplier": 1, - "divisor": 1, - "offset": 0 - }, - "bad_address": { - "oid": ".1.3.6.1.2.1.4.5.0", - "algorithm": "incremental", - "multiplier": 1, - "divisor": 1, - "offset": 0 - }, - "unknown_protocol": { - "oid": ".1.3.6.1.2.1.4.7.0", - "algorithm": "incremental", - "multiplier": 1, - "divisor": 1, - "offset": 0 - } - } - }, - "snmp_switch.output": { - "title": "Switch Output Packets", - "units": "packets/s", - "type": "line", - "priority": 40, - "family": "IP", - "dimensions": { - "requests": { - "oid": ".1.3.6.1.2.1.4.10.0", - "algorithm": "incremental", - "multiplier": 1, - "divisor": 1, - "offset": 0 - }, - "discards": { - "oid": ".1.3.6.1.2.1.4.11.0", - "algorithm": "incremental", - "multiplier": -1, - "divisor": 1, - "offset": 0 - }, - "no_route": { - "oid": ".1.3.6.1.2.1.4.12.0", - "algorithm": "incremental", - "multiplier": -1, - "divisor": 1, - "offset": 0 - } - } - }, - "snmp_switch.bandwidth_port": { - "title": "Switch Bandwidth for port ", - "titleoid": ".1.3.6.1.2.1.31.1.1.1.18.", - "units": "kilobits/s", - "type": "area", - "priority": 100, - "family": "ports", - "multiply_range": [ - 1, - 24 - ], - "dimensions": { - "in": { - "oid": ".1.3.6.1.2.1.2.2.1.10.", - "algorithm": "incremental", - "multiplier": 8, - "divisor": 1024, - "offset": 0 - }, - "out": { - "oid": ".1.3.6.1.2.1.2.2.1.16.", - "algorithm": "incremental", - "multiplier": -8, - "divisor": 1024, - "offset": 0 - } - } - } - } - } - ] -} -``` - - diff --git a/collectors/node.d.plugin/snmp/snmp.node.js b/collectors/node.d.plugin/snmp/snmp.node.js deleted file mode 100644 index 9e874586e..000000000 --- a/collectors/node.d.plugin/snmp/snmp.node.js +++ /dev/null @@ -1,527 +0,0 @@ -'use strict'; -// SPDX-License-Identifier: GPL-3.0-or-later -// netdata snmp module -// This program will connect to one or more SNMP Agents -// - -// example configuration in /etc/netdata/node.d/snmp.conf -/* -{ - "enable_autodetect": false, - "update_every": 5, - "max_request_size": 50, - "servers": [ - { - "hostname": "10.11.12.8", - "community": "public", - "update_every": 10, - "max_request_size": 50, - "options": { "timeout": 10000 }, - "charts": { - "snmp_switch.bandwidth_port1": { - "title": "Switch Bandwidth for port 1", - "units": "kilobits/s", - "type": "area", - "priority": 1, - "dimensions": { - "in": { - "oid": ".1.3.6.1.2.1.2.2.1.10.1", - "algorithm": "incremental", - "multiplier": 8, - "divisor": 1024, - "offset": 0 - }, - "out": { - "oid": ".1.3.6.1.2.1.2.2.1.16.1", - "algorithm": "incremental", - "multiplier": -8, - "divisor": 1024, - "offset": 0 - } - } - }, - "snmp_switch.bandwidth_port2": { - "title": "Switch Bandwidth for port 2", - "units": "kilobits/s", - "type": "area", - "priority": 1, - "dimensions": { - "in": { - "oid": ".1.3.6.1.2.1.2.2.1.10.2", - "algorithm": "incremental", - "multiplier": 8, - "divisor": 1024, - "offset": 0 - }, - "out": { - "oid": ".1.3.6.1.2.1.2.2.1.16.2", - "algorithm": "incremental", - "multiplier": -8, - "divisor": 1024, - "offset": 0 - } - } - } - } - } - ] -} -*/ - -// You can also give ranges of charts like the following. -// This will append 1-24 to id, title, oid (on each dimension) -// so that 24 charts will be created. -/* -{ - "enable_autodetect": false, - "update_every": 10, - "max_request_size": 50, - "servers": [ - { - "hostname": "10.11.12.8", - "community": "public", - "update_every": 10, - "max_request_size": 50, - "options": { "timeout": 20000 }, - "charts": { - "snmp_switch.bandwidth_port": { - "title": "Switch Bandwidth for port ", - "units": "kilobits/s", - "type": "area", - "priority": 1, - "multiply_range": [ 1, 24 ], - "dimensions": { - "in": { - "oid": ".1.3.6.1.2.1.2.2.1.10.", - "algorithm": "incremental", - "multiplier": 8, - "divisor": 1024, - "offset": 0 - }, - "out": { - "oid": ".1.3.6.1.2.1.2.2.1.16.", - "algorithm": "incremental", - "multiplier": -8, - "divisor": 1024, - "offset": 0 - } - } - } - } - } - ] -} -*/ - -var net_snmp = require('net-snmp'); -var extend = require('extend'); -var netdata = require('netdata'); - -if (netdata.options.DEBUG === true) netdata.debug('loaded', __filename, ' plugin'); - -netdata.processors.snmp = { - name: 'snmp', - - fixoid: function (oid) { - if (typeof oid !== 'string') - return oid; - - if (oid.charAt(0) === '.') - return oid.substring(1, oid.length); - - return oid; - }, - - prepare: function (service) { - var __DEBUG = netdata.options.DEBUG; - - if (typeof service.snmp_oids === 'undefined' || service.snmp_oids === null || service.snmp_oids.length === 0) { - // this is the first time we see this service - - if (__DEBUG === true) - netdata.debug(service.module.name + ': ' + service.name + ': preparing ' + this.name + ' OIDs'); - - // build an index of all OIDs - service.snmp_oids_index = {}; - var chart_keys = Object.keys(service.request.charts); - var chart_keys_len = chart_keys.length; - while (chart_keys_len--) { - var c = chart_keys[chart_keys_len]; - var chart = service.request.charts[c]; - - // for each chart - - if (__DEBUG === true) - netdata.debug(service.module.name + ': ' + service.name + ': indexing ' + this.name + ' chart: ' + c); - - if (typeof chart.titleoid !== 'undefined') { - service.snmp_oids_index[this.fixoid(chart.titleoid)] = { - type: 'title', - link: chart - }; - } - - var dim_keys = Object.keys(chart.dimensions); - var dim_keys_len = dim_keys.length; - while (dim_keys_len--) { - var d = dim_keys[dim_keys_len]; - var dim = chart.dimensions[d]; - - // for each dimension in the chart - - var oid = this.fixoid(dim.oid); - var oidname = this.fixoid(dim.oidname); - - if (__DEBUG === true) - netdata.debug(service.module.name + ': ' + service.name + ': indexing ' + this.name + ' chart: ' + c + ', dimension: ' + d + ', OID: ' + oid + ", OID name: " + oidname); - - // link it to the point we need to set the value to - service.snmp_oids_index[oid] = { - type: 'value', - link: dim - }; - - if (typeof oidname !== 'undefined') - service.snmp_oids_index[oidname] = { - type: 'name', - link: dim - }; - - // and set the value to null - dim.value = null; - } - } - - if (__DEBUG === true) - netdata.debug(service.module.name + ': ' + service.name + ': indexed ' + this.name + ' OIDs: ' + netdata.stringify(service.snmp_oids_index)); - - // now create the array of OIDs needed by net-snmp - service.snmp_oids = Object.keys(service.snmp_oids_index); - - if (__DEBUG === true) - netdata.debug(service.module.name + ': ' + service.name + ': final list of ' + this.name + ' OIDs: ' + netdata.stringify(service.snmp_oids)); - - service.snmp_oids_cleaned = 0; - } else if (service.snmp_oids_cleaned === 0) { - service.snmp_oids_cleaned = 1; - - // the second time, keep only values - - service.snmp_oids = new Array(); - var oid_keys = Object.keys(service.snmp_oids_index); - var oid_keys_len = oid_keys.length; - while (oid_keys_len--) { - if (service.snmp_oids_index[oid_keys[oid_keys_len]].type === 'value') - service.snmp_oids.push(oid_keys[oid_keys_len]); - } - } - }, - - getdata: function (service, index, ok, failed, callback) { - var __DEBUG = netdata.options.DEBUG; - var that = this; - - if (index >= service.snmp_oids.length) { - callback((ok > 0) ? {ok: ok, failed: failed} : null); - return; - } - - var slice; - if (service.snmp_oids.length <= service.request.max_request_size) { - slice = service.snmp_oids; - index = service.snmp_oids.length; - } else if (service.snmp_oids.length - index <= service.request.max_request_size) { - slice = service.snmp_oids.slice(index, service.snmp_oids.length); - index = service.snmp_oids.length; - } else { - slice = service.snmp_oids.slice(index, index + service.request.max_request_size); - index += service.request.max_request_size; - } - - if (__DEBUG === true) - netdata.debug(service.module.name + ': ' + service.name + ': making ' + slice.length + ' entries request, max is: ' + service.request.max_request_size); - - service.snmp_session.get(slice, function (error, varbinds) { - if (error) { - service.error('Received error = ' + netdata.stringify(error) + ' varbinds = ' + netdata.stringify(varbinds)); - - // make all values null - var len = slice.length; - while (len--) - service.snmp_oids_index[slice[len]].value = null; - } else { - if (__DEBUG === true) - netdata.debug(service.module.name + ': ' + service.name + ': got valid ' + service.module.name + ' response: ' + netdata.stringify(varbinds)); - - var varbinds_len = varbinds.length; - for (var i = 0; i < varbinds_len; i++) { - var value = null; - - if (net_snmp.isVarbindError(varbinds[i])) { - if (__DEBUG === true) - netdata.debug(service.module.name + ': ' + service.name + ': failed ' + service.module.name + ' get for OIDs ' + varbinds[i].oid); - - service.error('OID ' + varbinds[i].oid + ' gave error: ' + net_snmp.varbindError(varbinds[i])); - value = null; - failed++; - } else { - // test fom Counter64 - // varbinds[i].type = net_snmp.ObjectType.Counter64; - // varbinds[i].value = new Buffer([0x34, 0x49, 0x2e, 0xdc, 0xd1]); - - switch (varbinds[i].type) { - case net_snmp.ObjectType.OctetString: - if (service.snmp_oids_index[varbinds[i].oid].type !== 'title' && service.snmp_oids_index[varbinds[i].oid].type !== 'name') { - // parse floating point values, exposed as strings - value = parseFloat(varbinds[i].value) * 1000; - if (__DEBUG === true) netdata.debug(service.module.name + ': ' + service.name + ': found ' + service.module.name + ' value of OIDs ' + varbinds[i].oid + ", ObjectType " + net_snmp.ObjectType[varbinds[i].type] + " (" + netdata.stringify(varbinds[i].type) + "), typeof(" + typeof (varbinds[i].value) + "), in JSON: " + netdata.stringify(varbinds[i].value) + ", value = " + value.toString() + " (parsed as float in string)"); - } else { - // just use the string - value = varbinds[i].value; - if (__DEBUG === true) netdata.debug(service.module.name + ': ' + service.name + ': found ' + service.module.name + ' value of OIDs ' + varbinds[i].oid + ", ObjectType " + net_snmp.ObjectType[varbinds[i].type] + " (" + netdata.stringify(varbinds[i].type) + "), typeof(" + typeof (varbinds[i].value) + "), in JSON: " + netdata.stringify(varbinds[i].value) + ", value = " + value.toString() + " (parsed as string)"); - } - break; - - case net_snmp.ObjectType.Counter64: - // copy the buffer - value = '0x' + varbinds[i].value.toString('hex'); - if (__DEBUG === true) netdata.debug(service.module.name + ': ' + service.name + ': found ' + service.module.name + ' value of OIDs ' + varbinds[i].oid + ", ObjectType " + net_snmp.ObjectType[varbinds[i].type] + " (" + netdata.stringify(varbinds[i].type) + "), typeof(" + typeof (varbinds[i].value) + "), in JSON: " + netdata.stringify(varbinds[i].value) + ", value = " + value.toString() + " (parsed as buffer)"); - break; - - case net_snmp.ObjectType.Integer: - case net_snmp.ObjectType.Counter: - case net_snmp.ObjectType.Gauge: - default: - value = varbinds[i].value; - if (__DEBUG === true) netdata.debug(service.module.name + ': ' + service.name + ': found ' + service.module.name + ' value of OIDs ' + varbinds[i].oid + ", ObjectType " + net_snmp.ObjectType[varbinds[i].type] + " (" + netdata.stringify(varbinds[i].type) + "), typeof(" + typeof (varbinds[i].value) + "), in JSON: " + netdata.stringify(varbinds[i].value) + ", value = " + value.toString() + " (parsed as number)"); - break; - } - - ok++; - } - - if (value !== null) { - switch (service.snmp_oids_index[varbinds[i].oid].type) { - case 'title': - service.snmp_oids_index[varbinds[i].oid].link.title += ' ' + value; - break; - case 'name' : - service.snmp_oids_index[varbinds[i].oid].link.name = value.toString().replace(/\W/g, '_'); - break; - case 'value': - service.snmp_oids_index[varbinds[i].oid].link.value = value; - break; - } - } - } - - if (__DEBUG === true) - netdata.debug(service.module.name + ': ' + service.name + ': finished ' + service.module.name + ' with ' + ok + ' successful and ' + failed + ' failed values'); - } - that.getdata(service, index, ok, failed, callback); - }); - }, - - process: function (service, callback) { - var __DEBUG = netdata.options.DEBUG; - - this.prepare(service); - - if (service.snmp_oids.length === 0) { - // no OIDs found for this service - - if (__DEBUG === true) - service.error('no OIDs to process.'); - - callback(null); - return; - } - - if (typeof service.snmp_session === 'undefined' || service.snmp_session === null) { - // no SNMP session has been created for this service - // the SNMP session is just the initialization of NET-SNMP - - var snmp_version = (service.request.options && service.request.options.version) - ? service.request.options.version - : net_snmp.Version1; - - if (snmp_version === net_snmp.Version3) { - if (__DEBUG === true) - netdata.debug(service.module.name + ': ' + service.name + ': opening ' + this.name + ' session on ' + service.request.hostname + ' user ' + service.request.user + ' options ' + netdata.stringify(service.request.options)); - - // create the SNMP session - service.snmp_session = net_snmp.createV3Session(service.request.hostname, service.request.user, service.request.options); - } else { - if (__DEBUG === true) - netdata.debug(service.module.name + ': ' + service.name + ': opening ' + this.name + ' session on ' + service.request.hostname + ' community ' + service.request.community + ' options ' + netdata.stringify(service.request.options)); - - // create the SNMP session - service.snmp_session = net_snmp.createSession(service.request.hostname, service.request.community, service.request.options); - } - - if (__DEBUG === true) - netdata.debug(service.module.name + ': ' + service.name + ': got ' + this.name + ' session: ' + netdata.stringify(service.snmp_session)); - - // if we later need traps, this is how to do it: - //service.snmp_session.trap(net_snmp.TrapType.LinkDown, function(error) { - // if(error) console.error('trap error: ' + netdata.stringify(error)); - //}); - } - - // do it, get the SNMP values for the sessions we need - this.getdata(service, 0, 0, 0, callback); - } -}; - -var snmp = { - name: __filename, - enable_autodetect: true, - update_every: 1, - base_priority: 50000, - - charts: {}, - - processResponse: function (service, data) { - if (data !== null) { - if (service.added !== true) - service.commit(); - - var chart_keys = Object.keys(service.request.charts); - var chart_keys_len = chart_keys.length; - for (var i = 0; i < chart_keys_len; i++) { - var c = chart_keys[i]; - - var chart = snmp.charts[c]; - if (typeof chart === 'undefined') { - chart = service.chart(c, service.request.charts[c]); - snmp.charts[c] = chart; - } - - service.begin(chart); - - var dimensions = service.request.charts[c].dimensions; - var dim_keys = Object.keys(dimensions); - var dim_keys_len = dim_keys.length; - for (var j = 0; j < dim_keys_len; j++) { - var d = dim_keys[j]; - - if (dimensions[d].value !== null) { - if (typeof dimensions[d].offset === 'number' && typeof dimensions[d].value === 'number') - service.set(d, dimensions[d].value + dimensions[d].offset); - else - service.set(d, dimensions[d].value); - } - } - - service.end(); - } - } - }, - - // module.serviceExecute() - // this function is called only from this module - // its purpose is to prepare the request and call - // netdata.serviceExecute() - serviceExecute: function (conf) { - var __DEBUG = netdata.options.DEBUG; - - if (__DEBUG === true) - netdata.debug(this.name + ': snmp hostname: ' + conf.hostname + ', update_every: ' + conf.update_every); - - var service = netdata.service({ - name: conf.hostname, - request: conf, - update_every: conf.update_every, - module: this, - processor: netdata.processors.snmp - }); - - // multiply the charts, if required - var chart_keys = Object.keys(service.request.charts); - var chart_keys_len = chart_keys.length; - for (var i = 0; i < chart_keys_len; i++) { - var c = chart_keys[i]; - var service_request_chart = service.request.charts[c]; - - if (__DEBUG === true) - netdata.debug(this.name + ': snmp hostname: ' + conf.hostname + ', examining chart: ' + c); - - if (typeof service_request_chart.update_every === 'undefined') - service_request_chart.update_every = service.update_every; - - if (typeof service_request_chart.multiply_range !== 'undefined') { - var from = service_request_chart.multiply_range[0]; - var to = service_request_chart.multiply_range[1]; - var prio = service_request_chart.priority || 1; - - if (prio < snmp.base_priority) prio += snmp.base_priority; - - while (from <= to) { - var id = c + from.toString(); - var chart = extend(true, {}, service_request_chart); - chart.title += from.toString(); - - if (typeof chart.titleoid !== 'undefined') - chart.titleoid += from.toString(); - - chart.priority = prio++; - - var dim_keys = Object.keys(chart.dimensions); - var dim_keys_len = dim_keys.length; - for (var j = 0; j < dim_keys_len; j++) { - var d = dim_keys[j]; - - chart.dimensions[d].oid += from.toString(); - - if (typeof chart.dimensions[d].oidname !== 'undefined') - chart.dimensions[d].oidname += from.toString(); - } - service.request.charts[id] = chart; - from++; - } - - delete service.request.charts[c]; - } else { - if (service.request.charts[c].priority < snmp.base_priority) - service.request.charts[c].priority += snmp.base_priority; - } - } - - service.execute(this.processResponse); - }, - - configure: function (config) { - var added = 0; - - if (typeof config.max_request_size === 'undefined') - config.max_request_size = 50; - - if (typeof (config.servers) !== 'undefined') { - var len = config.servers.length; - while (len--) { - if (typeof config.servers[len].update_every === 'undefined') - config.servers[len].update_every = this.update_every; - - if (typeof config.servers[len].max_request_size === 'undefined') - config.servers[len].max_request_size = config.max_request_size; - - this.serviceExecute(config.servers[len]); - added++; - } - } - - return added; - }, - - // module.update() - // this is called repeatedly to collect data, by calling - // service.execute() - update: function (service, callback) { - service.execute(function (serv, data) { - service.module.processResponse(serv, data); - callback(); - }); - } -}; - -module.exports = snmp; diff --git a/collectors/perf.plugin/perf_plugin.c b/collectors/perf.plugin/perf_plugin.c index 4020cf066..80e042edc 100644 --- a/collectors/perf.plugin/perf_plugin.c +++ b/collectors/perf.plugin/perf_plugin.c @@ -1283,6 +1283,7 @@ void parse_command_line(int argc, char **argv) { } int main(int argc, char **argv) { + clocks_init(); // ------------------------------------------------------------------------ // initialization of netdata plugin diff --git a/collectors/plugins.d/README.md b/collectors/plugins.d/README.md index ac838d21d..c84384215 100644 --- a/collectors/plugins.d/README.md +++ b/collectors/plugins.d/README.md @@ -21,7 +21,6 @@ from external processes, thus allowing Netdata to use **external plugins**. |[nfacct.plugin](/collectors/nfacct.plugin/README.md)|`C`|linux|collects netfilter firewall, connection tracker and accounting metrics using `libmnl` and `libnetfilter_acct`.| |[xenstat.plugin](/collectors/xenstat.plugin/README.md)|`C`|linux|collects XenServer and XCP-ng metrics using `lxenstat`.| |[perf.plugin](/collectors/perf.plugin/README.md)|`C`|linux|collects CPU performance metrics using performance monitoring units (PMU).| -|[node.d.plugin](/collectors/node.d.plugin/README.md)|`node.js`|all|a **plugin orchestrator** for data collection modules written in `node.js`.| |[python.d.plugin](/collectors/python.d.plugin/README.md)|`python`|all|a **plugin orchestrator** for data collection modules written in `python` v2 or v3 (both are supported).| |[slabinfo.plugin](/collectors/slabinfo.plugin/README.md)|`C`|linux|collects kernel internal cache objects (SLAB) metrics.| @@ -74,7 +73,6 @@ Example: # charts.d = yes # fping = yes # ioping = yes - # node.d = yes # python.d = yes ``` @@ -187,7 +185,10 @@ the template is: - `name` - is the name that will be presented to the user instead of `id` in `type.id`. This means that only the `id` part of `type.id` is changed. When a name has been given, the chart is index (and can be referred) as both `type.id` and `type.name`. You can set name to `''`, or `null`, or `(null)` to disable it. + is the name that will be presented to the user instead of `id` in `type.id`. This means that only the `id` part of + `type.id` is changed. When a name has been given, the chart is indexed (and can be referred) as both `type.id` and + `type.name`. You can set name to `''`, or `null`, or `(null)` to disable it. If a chart with the same name already + exists, a serial number is automatically attached to the name to avoid naming collisions. - `title` @@ -388,17 +389,12 @@ or do not output the line at all. python is ideal for Netdata plugins. It is a simple, yet powerful way to collect data, it has a very small memory footprint, although it is not the most CPU efficient way to do it. -2. **node.js**, use `node.d.plugin`, there are a few examples in the [node.d - directory](/collectors/node.d.plugin/README.md) - - node.js is the fastest scripting language for collecting data. If your plugin needs to do a lot of work, compute values, etc, node.js is probably the best choice before moving to compiled code. Keep in mind though that node.js is not memory efficient; it will probably need more RAM compared to python. - -3. **BASH**, use `charts.d.plugin`, there are many examples in the [charts.d +2. **BASH**, use `charts.d.plugin`, there are many examples in the [charts.d directory](/collectors/charts.d.plugin/README.md) BASH is the simplest scripting language for collecting values. It is the less efficient though in terms of CPU resources. You can use it to collect data quickly, but extensive use of it might use a lot of system resources. -4. **C** +3. **C** Of course, C is the most efficient way of collecting data. This is why Netdata itself is written in C. diff --git a/collectors/plugins.d/plugins_d.c b/collectors/plugins.d/plugins_d.c index 614e43d58..2916f1c13 100644 --- a/collectors/plugins.d/plugins_d.c +++ b/collectors/plugins.d/plugins_d.c @@ -127,7 +127,7 @@ inline int pluginsd_initialize_plugin_directories() // Get the configuration entry if (likely(!plugins_dir_list)) { snprintfz(plugins_dirs, FILENAME_MAX * 2, "\"%s\" \"%s/custom-plugins.d\"", PLUGINS_DIR, CONFIG_DIR); - plugins_dir_list = strdupz(config_get(CONFIG_SECTION_GLOBAL, "plugins directory", plugins_dirs)); + plugins_dir_list = strdupz(config_get(CONFIG_SECTION_DIRECTORIES, "plugins", plugins_dirs)); } // Parse it and store it to plugin directories @@ -230,6 +230,8 @@ static void pluginsd_worker_thread_handle_error(struct plugind *cd, int worker_r void *pluginsd_worker_thread(void *arg) { + worker_register("PLUGINSD"); + netdata_thread_cleanup_push(pluginsd_worker_thread_cleanup, arg); struct plugind *cd = (struct plugind *)arg; @@ -260,6 +262,7 @@ void *pluginsd_worker_thread(void *arg) if (unlikely(!cd->enabled)) break; } + worker_unregister(); netdata_thread_cleanup_pop(1); return NULL; @@ -281,6 +284,8 @@ static void pluginsd_main_cleanup(void *data) info("cleanup completed."); static_thread->enabled = NETDATA_MAIN_THREAD_EXITED; + + worker_unregister(); } void *pluginsd_main(void *ptr) diff --git a/collectors/plugins.d/pluginsd_parser.c b/collectors/plugins.d/pluginsd_parser.c index 22b77362f..f014a29d0 100644 --- a/collectors/plugins.d/pluginsd_parser.c +++ b/collectors/plugins.d/pluginsd_parser.c @@ -125,26 +125,36 @@ PARSER_RC pluginsd_dimension_action(void *user, RRDSET *st, char *id, char *name UNUSED(algorithm); RRDDIM *rd = rrddim_add(st, id, name, multiplier, divisor, algorithm_type); - rrddim_flag_clear(rd, RRDDIM_FLAG_HIDDEN); + int unhide_dimension = 1; + rrddim_flag_clear(rd, RRDDIM_FLAG_DONT_DETECT_RESETS_OR_OVERFLOWS); if (options && *options) { if (strstr(options, "obsolete") != NULL) rrddim_is_obsolete(st, rd); else rrddim_isnot_obsolete(st, rd); - if (strstr(options, "hidden") != NULL) { - rrddim_flag_set(rd, RRDDIM_FLAG_HIDDEN); - (void) sql_set_dimension_option(&rd->state->metric_uuid, "hidden"); - } - else - (void) sql_set_dimension_option(&rd->state->metric_uuid, NULL); + + unhide_dimension = !strstr(options, "hidden"); + if (strstr(options, "noreset") != NULL) rrddim_flag_set(rd, RRDDIM_FLAG_DONT_DETECT_RESETS_OR_OVERFLOWS); if (strstr(options, "nooverflow") != NULL) rrddim_flag_set(rd, RRDDIM_FLAG_DONT_DETECT_RESETS_OR_OVERFLOWS); - } else { - (void) sql_set_dimension_option(&rd->state->metric_uuid, NULL); + } else rrddim_isnot_obsolete(st, rd); + + if (likely(unhide_dimension)) { + rrddim_flag_clear(rd, RRDDIM_FLAG_HIDDEN); + if (rrddim_flag_check(rd, RRDDIM_FLAG_META_HIDDEN)) { + (void)sql_set_dimension_option(&rd->state->metric_uuid, NULL); + rrddim_flag_clear(rd, RRDDIM_FLAG_META_HIDDEN); + } + } else { + rrddim_flag_set(rd, RRDDIM_FLAG_HIDDEN); + if (!rrddim_flag_check(rd, RRDDIM_FLAG_META_HIDDEN)) { + (void)sql_set_dimension_option(&rd->state->metric_uuid, "hidden"); + rrddim_flag_set(rd, RRDDIM_FLAG_META_HIDDEN); + } } return PARSER_RC_OK; } @@ -725,6 +735,11 @@ PARSER_RC metalog_pluginsd_host(char **words, void *user, PLUGINSD_ACTION *plug return PARSER_RC_OK; } +static void pluginsd_process_thread_cleanup(void *ptr) { + PARSER *parser = (PARSER *)ptr; + parser_destroy(parser); +} + // New plugins.d parser inline size_t pluginsd_process(RRDHOST *host, struct plugind *cd, FILE *fp, int trust_durations) @@ -743,50 +758,50 @@ inline size_t pluginsd_process(RRDHOST *host, struct plugind *cd, FILE *fp, int } clearerr(fp); - PARSER_USER_OBJECT *user = callocz(1, sizeof(*user)); - ((PARSER_USER_OBJECT *) user)->enabled = cd->enabled; - ((PARSER_USER_OBJECT *) user)->host = host; - ((PARSER_USER_OBJECT *) user)->cd = cd; - ((PARSER_USER_OBJECT *) user)->trust_durations = trust_durations; - - PARSER *parser = parser_init(host, user, fp, PARSER_INPUT_SPLIT); - - if (unlikely(!parser)) { - error("Failed to initialize parser"); - cd->serial_failures++; - return 0; - } - - parser->plugins_action->begin_action = &pluginsd_begin_action; - parser->plugins_action->flush_action = &pluginsd_flush_action; - parser->plugins_action->end_action = &pluginsd_end_action; - parser->plugins_action->disable_action = &pluginsd_disable_action; - parser->plugins_action->variable_action = &pluginsd_variable_action; - parser->plugins_action->dimension_action = &pluginsd_dimension_action; - parser->plugins_action->label_action = &pluginsd_label_action; - parser->plugins_action->overwrite_action = &pluginsd_overwrite_action; - parser->plugins_action->chart_action = &pluginsd_chart_action; - parser->plugins_action->set_action = &pluginsd_set_action; - - user->parser = parser; + PARSER_USER_OBJECT user = { + .enabled = cd->enabled, + .host = host, + .cd = cd, + .trust_durations = trust_durations + }; + + PARSER *parser = parser_init(host, &user, fp, PARSER_INPUT_SPLIT); + + // this keeps the parser with its current value + // so, parser needs to be allocated before pushing it + netdata_thread_cleanup_push(pluginsd_process_thread_cleanup, parser); + + parser->plugins_action->begin_action = &pluginsd_begin_action; + parser->plugins_action->flush_action = &pluginsd_flush_action; + parser->plugins_action->end_action = &pluginsd_end_action; + parser->plugins_action->disable_action = &pluginsd_disable_action; + parser->plugins_action->variable_action = &pluginsd_variable_action; + parser->plugins_action->dimension_action = &pluginsd_dimension_action; + parser->plugins_action->label_action = &pluginsd_label_action; + parser->plugins_action->overwrite_action = &pluginsd_overwrite_action; + parser->plugins_action->chart_action = &pluginsd_chart_action; + parser->plugins_action->set_action = &pluginsd_set_action; + parser->plugins_action->clabel_commit_action = &pluginsd_clabel_commit_action; + parser->plugins_action->clabel_action = &pluginsd_clabel_action; + + user.parser = parser; while (likely(!parser_next(parser))) { if (unlikely(netdata_exit || parser_action(parser, NULL))) break; } - info("PARSER ended"); - - parser_destroy(parser); - cd->enabled = ((PARSER_USER_OBJECT *) user)->enabled; - size_t count = ((PARSER_USER_OBJECT *) user)->count; + // free parser with the pop function + netdata_thread_cleanup_pop(1); - freez(user); + cd->enabled = user.enabled; + size_t count = user.count; if (likely(count)) { cd->successful_collections += count; cd->serial_failures = 0; - } else + } + else cd->serial_failures++; return count; diff --git a/collectors/proc.plugin/plugin_proc.c b/collectors/proc.plugin/plugin_proc.c index 190811e24..5033aa5e2 100644 --- a/collectors/proc.plugin/plugin_proc.c +++ b/collectors/proc.plugin/plugin_proc.c @@ -9,7 +9,6 @@ static struct proc_module { int enabled; int (*func)(int update_every, usec_t dt); - usec_t duration; RRDDIM *rd; @@ -38,7 +37,6 @@ static struct proc_module { {.name = "/proc/pagetypeinfo", .dim = "pagetypeinfo", .func = do_proc_pagetypeinfo}, // network metrics - {.name = "/proc/net/dev", .dim = "netdev", .func = do_proc_net_dev}, {.name = "/proc/net/wireless", .dim = "netwireless", .func = do_proc_net_wireless}, {.name = "/proc/net/sockstat", .dim = "sockstat", .func = do_proc_net_sockstat}, {.name = "/proc/net/sockstat6", .dim = "sockstat6", .func = do_proc_net_sockstat6}, @@ -66,9 +64,7 @@ static struct proc_module { // ZFS metrics {.name = "/proc/spl/kstat/zfs/arcstats", .dim = "zfs_arcstats", .func = do_proc_spl_kstat_zfs_arcstats}, - {.name = "/proc/spl/kstat/zfs/pool/state", - .dim = "zfs_pool_state", - .func = do_proc_spl_kstat_zfs_pool_state}, + {.name = "/proc/spl/kstat/zfs/pool/state",.dim = "zfs_pool_state",.func = do_proc_spl_kstat_zfs_pool_state}, // BTRFS metrics {.name = "/sys/fs/btrfs", .dim = "btrfs", .func = do_sys_fs_btrfs}, @@ -83,6 +79,12 @@ static struct proc_module { {.name = NULL, .dim = NULL, .func = NULL} }; +#if WORKER_UTILIZATION_MAX_JOB_TYPES < 36 +#error WORKER_UTILIZATION_MAX_JOB_TYPES has to be at least 36 +#endif + +static netdata_thread_t *netdev_thread = NULL; + static void proc_main_cleanup(void *ptr) { struct netdata_static_thread *static_thread = (struct netdata_static_thread *)ptr; @@ -90,14 +92,28 @@ static void proc_main_cleanup(void *ptr) info("cleaning up..."); + if (netdev_thread) { + netdata_thread_join(*netdev_thread, NULL); + freez(netdev_thread); + } + static_thread->enabled = NETDATA_MAIN_THREAD_EXITED; + + worker_unregister(); } void *proc_main(void *ptr) { - netdata_thread_cleanup_push(proc_main_cleanup, ptr); + worker_register("PROC"); - int vdo_cpu_netdata = config_get_boolean("plugin:proc", "netdata server resources", CONFIG_BOOLEAN_YES); + if (config_get_boolean("plugin:proc", "/proc/net/dev", CONFIG_BOOLEAN_YES)) { + netdev_thread = mallocz(sizeof(netdata_thread_t)); + debug(D_SYSTEM, "Starting thread %s.", THREAD_NETDEV_NAME); + netdata_thread_create( + netdev_thread, THREAD_NETDEV_NAME, NETDATA_THREAD_OPTION_JOINABLE, netdev_main, netdev_thread); + } + + netdata_thread_cleanup_push(proc_main_cleanup, ptr); config_get_boolean("plugin:proc", "/proc/pagetypeinfo", CONFIG_BOOLEAN_NO); @@ -107,128 +123,34 @@ void *proc_main(void *ptr) struct proc_module *pm = &proc_modules[i]; pm->enabled = config_get_boolean("plugin:proc", pm->name, CONFIG_BOOLEAN_YES); - pm->duration = 0ULL; pm->rd = NULL; + + worker_register_job_name(i, proc_modules[i].dim); } usec_t step = localhost->rrd_update_every * USEC_PER_SEC; heartbeat_t hb; heartbeat_init(&hb); - size_t iterations = 0; while (!netdata_exit) { - iterations++; - (void)iterations; - + worker_is_idle(); usec_t hb_dt = heartbeat_next(&hb, step); - usec_t duration = 0ULL; if (unlikely(netdata_exit)) break; - // BEGIN -- the job to be done - for (i = 0; proc_modules[i].name; i++) { + if (unlikely(netdata_exit)) + break; + struct proc_module *pm = &proc_modules[i]; if (unlikely(!pm->enabled)) continue; debug(D_PROCNETDEV_LOOP, "PROC calling %s.", pm->name); -//#ifdef NETDATA_LOG_ALLOCATIONS -// if(pm->func == do_proc_interrupts) -// log_thread_memory_allocations = iterations; -//#endif + worker_is_busy(i); pm->enabled = !pm->func(localhost->rrd_update_every, hb_dt); - pm->duration = heartbeat_monotonic_dt_to_now_usec(&hb) - duration; - duration += pm->duration; - -//#ifdef NETDATA_LOG_ALLOCATIONS -// if(pm->func == do_proc_interrupts) -// log_thread_memory_allocations = 0; -//#endif - - if (unlikely(netdata_exit)) - break; - } - - // END -- the job is done - - if (vdo_cpu_netdata) { - static RRDSET *st_cpu_thread = NULL, *st_duration = NULL; - static RRDDIM *rd_user = NULL, *rd_system = NULL; - - // ---------------------------------------------------------------- - - struct rusage thread; - getrusage(RUSAGE_THREAD, &thread); - - if (unlikely(!st_cpu_thread)) { - st_cpu_thread = rrdset_create_localhost( - "netdata", - "plugin_proc_cpu", - NULL, - "proc", - NULL, - "Netdata proc plugin CPU usage", - "milliseconds/s", - "proc", - "stats", - 132000, - localhost->rrd_update_every, - RRDSET_TYPE_STACKED); - - rd_user = rrddim_add(st_cpu_thread, "user", NULL, 1, USEC_PER_MS, RRD_ALGORITHM_INCREMENTAL); - rd_system = rrddim_add(st_cpu_thread, "system", NULL, 1, USEC_PER_MS, RRD_ALGORITHM_INCREMENTAL); - } else { - rrdset_next(st_cpu_thread); - } - - rrddim_set_by_pointer( - st_cpu_thread, rd_user, thread.ru_utime.tv_sec * USEC_PER_SEC + thread.ru_utime.tv_usec); - rrddim_set_by_pointer( - st_cpu_thread, rd_system, thread.ru_stime.tv_sec * USEC_PER_SEC + thread.ru_stime.tv_usec); - rrdset_done(st_cpu_thread); - - // ---------------------------------------------------------------- - - if (unlikely(!st_duration)) { - st_duration = rrdset_find_active_bytype_localhost("netdata", "plugin_proc_modules"); - - if (!st_duration) { - st_duration = rrdset_create_localhost( - "netdata", - "plugin_proc_modules", - NULL, - "proc", - NULL, - "Netdata proc plugin modules durations", - "milliseconds/run", - "proc", - "stats", - 132001, - localhost->rrd_update_every, - RRDSET_TYPE_STACKED); - - for (i = 0; proc_modules[i].name; i++) { - struct proc_module *pm = &proc_modules[i]; - if (unlikely(!pm->enabled)) - continue; - - pm->rd = rrddim_add(st_duration, pm->dim, NULL, 1, USEC_PER_MS, RRD_ALGORITHM_ABSOLUTE); - } - } - } else - rrdset_next(st_duration); - - for (i = 0; proc_modules[i].name; i++) { - struct proc_module *pm = &proc_modules[i]; - if (unlikely(!pm->enabled)) - continue; - - rrddim_set_by_pointer(st_duration, pm->rd, pm->duration); - } - rrdset_done(st_duration); } } diff --git a/collectors/proc.plugin/plugin_proc.h b/collectors/proc.plugin/plugin_proc.h index 60a5a78a2..1e3b82965 100644 --- a/collectors/proc.plugin/plugin_proc.h +++ b/collectors/proc.plugin/plugin_proc.h @@ -8,7 +8,9 @@ #define PLUGIN_PROC_CONFIG_NAME "proc" #define PLUGIN_PROC_NAME PLUGIN_PROC_CONFIG_NAME ".plugin" -extern int do_proc_net_dev(int update_every, usec_t dt); +#define THREAD_NETDEV_NAME "PLUGIN[proc netdev]" +extern void *netdev_main(void *ptr); + extern int do_proc_net_wireless(int update_every, usec_t dt); extern int do_proc_diskstats(int update_every, usec_t dt); extern int do_proc_mdstat(int update_every, usec_t dt); @@ -48,6 +50,7 @@ extern int get_numa_node_count(void); // metrics that need to be shared among data collectors extern unsigned long long tcpext_TCPSynRetrans; +extern unsigned long long zfs_arcstats_shrinkable_cache_size_bytes; // netdev renames extern void netdev_rename_device_add( diff --git a/collectors/proc.plugin/proc_meminfo.c b/collectors/proc.plugin/proc_meminfo.c index 5b402caaf..f89ddd8d4 100644 --- a/collectors/proc.plugin/proc_meminfo.c +++ b/collectors/proc.plugin/proc_meminfo.c @@ -159,6 +159,10 @@ int do_proc_meminfo(int update_every, usec_t dt) { // http://calimeroteknik.free.fr/blag/?article20/really-used-memory-on-gnu-linux unsigned long long MemCached = Cached + SReclaimable - Shmem; unsigned long long MemUsed = MemTotal - MemFree - MemCached - Buffers; + // The Linux kernel doesn't report ZFS ARC usage as cache memory (the ARC is included in the total used system memory) + MemCached += (zfs_arcstats_shrinkable_cache_size_bytes / 1024); + MemUsed -= (zfs_arcstats_shrinkable_cache_size_bytes / 1024); + MemAvailable += (zfs_arcstats_shrinkable_cache_size_bytes / 1024); if(do_ram) { { diff --git a/collectors/proc.plugin/proc_net_dev.c b/collectors/proc.plugin/proc_net_dev.c index 2d1ae93ae..74076ff76 100644 --- a/collectors/proc.plugin/proc_net_dev.c +++ b/collectors/proc.plugin/proc_net_dev.c @@ -655,7 +655,7 @@ int do_proc_net_dev(int update_every, usec_t dt) { do_carrier = config_get_boolean_ondemand(CONFIG_SECTION_PLUGIN_PROC_NETDEV, "carrier for all interfaces", CONFIG_BOOLEAN_AUTO); do_mtu = config_get_boolean_ondemand(CONFIG_SECTION_PLUGIN_PROC_NETDEV, "mtu for all interfaces", CONFIG_BOOLEAN_AUTO); - disabled_list = simple_pattern_create(config_get(CONFIG_SECTION_PLUGIN_PROC_NETDEV, "disable by default interfaces matching", "lo fireqos* *-ifb"), NULL, SIMPLE_PATTERN_EXACT); + disabled_list = simple_pattern_create(config_get(CONFIG_SECTION_PLUGIN_PROC_NETDEV, "disable by default interfaces matching", "lo fireqos* *-ifb fwpr* fwbr* fwln*"), NULL, SIMPLE_PATTERN_EXACT); } if(unlikely(!ff)) { @@ -792,7 +792,18 @@ int do_proc_net_dev(int update_every, usec_t dt) { d->tcarrier = str2kernel_uint_t(procfile_lineword(ff, l, 15)); } - if (d->do_duplex != CONFIG_BOOLEAN_NO && d->filename_duplex) { + if ((d->do_carrier != CONFIG_BOOLEAN_NO || + d->do_duplex != CONFIG_BOOLEAN_NO || + d->do_speed != CONFIG_BOOLEAN_NO) && + d->filename_carrier) { + if (read_single_number_file(d->filename_carrier, &d->carrier)) { + error("Cannot refresh interface %s carrier state by reading '%s'. Stop updating it.", d->name, d->filename_carrier); + freez(d->filename_carrier); + d->filename_carrier = NULL; + } + } + + if (d->do_duplex != CONFIG_BOOLEAN_NO && d->filename_duplex && (d->carrier || !d->filename_carrier)) { char buffer[STATE_LENGTH_MAX + 1]; if (read_file(d->filename_duplex, buffer, STATE_LENGTH_MAX)) { @@ -808,6 +819,8 @@ int do_proc_net_dev(int update_every, usec_t dt) { else d->duplex = 0; } + } else { + d->duplex = 0; } if(d->do_operstate != CONFIG_BOOLEAN_NO && d->filename_operstate) { @@ -825,19 +838,11 @@ int do_proc_net_dev(int update_every, usec_t dt) { } } - if (d->do_carrier != CONFIG_BOOLEAN_NO && d->filename_carrier) { - if (read_single_number_file(d->filename_carrier, &d->carrier)) { - error("Cannot refresh interface %s carrier state by reading '%s'. Stop updating it.", d->name, d->filename_carrier); - freez(d->filename_carrier); - d->filename_carrier = NULL; - } - } - if (d->do_mtu != CONFIG_BOOLEAN_NO && d->filename_mtu) { if (read_single_number_file(d->filename_mtu, &d->mtu)) { - error("Cannot refresh mtu for interface %s by reading '%s'. Stop updating it.", d->name, d->filename_carrier); - freez(d->filename_carrier); - d->filename_carrier = NULL; + error("Cannot refresh mtu for interface %s by reading '%s'. Stop updating it.", d->name, d->filename_mtu); + freez(d->filename_mtu); + d->filename_mtu = NULL; } } @@ -907,7 +912,15 @@ int do_proc_net_dev(int update_every, usec_t dt) { } if(d->filename_speed && d->chart_var_speed) { - if(read_single_number_file(d->filename_speed, (unsigned long long *) &d->speed)) { + int ret = 0; + + if (d->carrier || !d->filename_carrier) { + ret = read_single_number_file(d->filename_speed, (unsigned long long *) &d->speed); + } else { + d->speed = 0; + } + + if(ret) { error("Cannot refresh interface %s speed by reading '%s'. Will not update its speed anymore.", d->name, d->filename_speed); freez(d->filename_speed); d->filename_speed = NULL; @@ -1384,3 +1397,39 @@ int do_proc_net_dev(int update_every, usec_t dt) { return 0; } + +static void netdev_main_cleanup(void *ptr) +{ + UNUSED(ptr); + + info("cleaning up..."); + + worker_unregister(); +} + +void *netdev_main(void *ptr) +{ + worker_register("NETDEV"); + worker_register_job_name(0, "netdev"); + + netdata_thread_cleanup_push(netdev_main_cleanup, ptr); + + usec_t step = localhost->rrd_update_every * USEC_PER_SEC; + heartbeat_t hb; + heartbeat_init(&hb); + + while (!netdata_exit) { + worker_is_idle(); + usec_t hb_dt = heartbeat_next(&hb, step); + + if (unlikely(netdata_exit)) + break; + + worker_is_busy(0); + if(do_proc_net_dev(localhost->rrd_update_every, hb_dt)) + break; + } + + netdata_thread_cleanup_pop(1); + return NULL; +} diff --git a/collectors/proc.plugin/proc_pressure.c b/collectors/proc.plugin/proc_pressure.c index 4a40b4aaf..66884dbcb 100644 --- a/collectors/proc.plugin/proc_pressure.c +++ b/collectors/proc.plugin/proc_pressure.c @@ -8,22 +8,36 @@ // linux calculates this every 2 seconds, see kernel/sched/psi.c PSI_FREQ #define MIN_PRESSURE_UPDATE_EVERY 2 +static int pressure_update_every = 0; static struct pressure resources[PRESSURE_NUM_RESOURCES] = { - { - .some = { .id = "cpu_pressure", .title = "CPU Pressure" }, - }, - { - .some = { .id = "memory_some_pressure", .title = "Memory Pressure" }, - .full = { .id = "memory_full_pressure", .title = "Memory Full Pressure" }, - }, - { - .some = { .id = "io_some_pressure", .title = "I/O Pressure" }, - .full = { .id = "io_full_pressure", .title = "I/O Full Pressure" }, - }, + { + .some = + {.share_time = {.id = "cpu_some_pressure", .title = "CPU some pressure"}, + .total_time = {.id = "cpu_some_pressure_stall_time", .title = "CPU some pressure stall time"}}, + .full = + {.share_time = {.id = "cpu_full_pressure", .title = "CPU full pressure"}, + .total_time = {.id = "cpu_full_pressure_stall_time", .title = "CPU full pressure stall time"}}, + }, + { + .some = + {.share_time = {.id = "memory_some_pressure", .title = "Memory some pressure"}, + .total_time = {.id = "memory_some_pressure_stall_time", .title = "Memory some pressure stall time"}}, + .full = + {.share_time = {.id = "memory_full_pressure", .title = "Memory full pressure"}, + .total_time = {.id = "memory_full_pressure_stall_time", .title = "Memory full pressure stall time"}}, + }, + { + .some = + {.share_time = {.id = "io_some_pressure", .title = "I/O some pressure"}, + .total_time = {.id = "io_some_pressure_stall_time", .title = "I/O some pressure stall time"}}, + .full = + {.share_time = {.id = "io_full_pressure", .title = "I/O full pressure"}, + .total_time = {.id = "io_full_pressure_stall_time", .title = "I/O full pressure stall time"}}, + }, }; -static struct { +static struct resource_info { procfile *pf; const char *name; // metric file name const char *family; // webui section name @@ -34,12 +48,83 @@ static struct { { .name = "io", .family = "disk", .section_priority = NETDATA_CHART_PRIO_SYSTEM_IO }, }; -void update_pressure_chart(struct pressure_chart *chart) { - rrddim_set_by_pointer(chart->st, chart->rd10, (collected_number)(chart->value10 * 100)); - rrddim_set_by_pointer(chart->st, chart->rd60, (collected_number) (chart->value60 * 100)); - rrddim_set_by_pointer(chart->st, chart->rd300, (collected_number) (chart->value300 * 100)); +void update_pressure_charts(struct pressure_charts *pcs) { + if (pcs->share_time.st) { + rrddim_set_by_pointer( + pcs->share_time.st, pcs->share_time.rd10, (collected_number)(pcs->share_time.value10 * 100)); + rrddim_set_by_pointer( + pcs->share_time.st, pcs->share_time.rd60, (collected_number)(pcs->share_time.value60 * 100)); + rrddim_set_by_pointer( + pcs->share_time.st, pcs->share_time.rd300, (collected_number)(pcs->share_time.value300 * 100)); + rrdset_done(pcs->share_time.st); + } + if (pcs->total_time.st) { + rrddim_set_by_pointer( + pcs->total_time.st, pcs->total_time.rdtotal, (collected_number)(pcs->total_time.value_total)); + rrdset_done(pcs->total_time.st); + } +} + +static void proc_pressure_do_resource(procfile *ff, int res_idx, int some) { + struct pressure_charts *pcs; + struct resource_info ri; + pcs = some ? &resources[res_idx].some : &resources[res_idx].full; + ri = resource_info[res_idx]; + + if (unlikely(!pcs->share_time.st)) { + pcs->share_time.st = rrdset_create_localhost( + "system", + pcs->share_time.id, + NULL, + ri.family, + NULL, + pcs->share_time.title, + "percentage", + PLUGIN_PROC_NAME, + PLUGIN_PROC_MODULE_PRESSURE_NAME, + ri.section_priority + (some ? 40 : 50), + pressure_update_every, + RRDSET_TYPE_LINE); + pcs->share_time.rd10 = + rrddim_add(pcs->share_time.st, some ? "some 10" : "full 10", NULL, 1, 100, RRD_ALGORITHM_ABSOLUTE); + pcs->share_time.rd60 = + rrddim_add(pcs->share_time.st, some ? "some 60" : "full 60", NULL, 1, 100, RRD_ALGORITHM_ABSOLUTE); + pcs->share_time.rd300 = + rrddim_add(pcs->share_time.st, some ? "some 300" : "full 300", NULL, 1, 100, RRD_ALGORITHM_ABSOLUTE); + } else { + rrdset_next(pcs->share_time.st); + } + pcs->share_time.value10 = strtod(procfile_lineword(ff, some ? 0 : 1, 2), NULL); + pcs->share_time.value60 = strtod(procfile_lineword(ff, some ? 0 : 1, 4), NULL); + pcs->share_time.value300 = strtod(procfile_lineword(ff, some ? 0 : 1, 6), NULL); + + if (unlikely(!pcs->total_time.st)) { + pcs->total_time.st = rrdset_create_localhost( + "system", + pcs->total_time.id, + NULL, + ri.family, + NULL, + pcs->total_time.title, + "ms", + PLUGIN_PROC_NAME, + PLUGIN_PROC_MODULE_PRESSURE_NAME, + ri.section_priority + (some ? 45 : 55), + pressure_update_every, + RRDSET_TYPE_LINE); + pcs->total_time.rdtotal = rrddim_add(pcs->total_time.st, "time", NULL, 1, 1, RRD_ALGORITHM_INCREMENTAL); + } else { + rrdset_next(pcs->total_time.st); + } + pcs->total_time.value_total = str2ull(procfile_lineword(ff, some ? 0 : 1, 8)) / 1000; +} - rrdset_done(chart->st); +static void proc_pressure_do_resource_some(procfile *ff, int res_idx) { + proc_pressure_do_resource(ff, res_idx, 1); +} + +static void proc_pressure_do_resource_full(procfile *ff, int res_idx) { + proc_pressure_do_resource(ff, res_idx, 0); } int do_proc_pressure(int update_every, usec_t dt) { @@ -50,6 +135,7 @@ int do_proc_pressure(int update_every, usec_t dt) { static char *base_path = NULL; update_every = (update_every < MIN_PRESSURE_UPDATE_EVERY) ? MIN_PRESSURE_UPDATE_EVERY : update_every; + pressure_update_every = update_every; if (next_pressure_dt <= dt) { next_pressure_dt = update_every * USEC_PER_SEC; @@ -80,11 +166,10 @@ int do_proc_pressure(int update_every, usec_t dt) { snprintfz(config_key, CONFIG_MAX_NAME, "enable %s some pressure", resource_info[i].name); do_some = config_get_boolean(CONFIG_SECTION_PLUGIN_PROC_PRESSURE, config_key, CONFIG_BOOLEAN_YES); resources[i].some.enabled = do_some; - if (resources[i].full.id) { - snprintfz(config_key, CONFIG_MAX_NAME, "enable %s full pressure", resource_info[i].name); - do_full = config_get_boolean(CONFIG_SECTION_PLUGIN_PROC_PRESSURE, config_key, CONFIG_BOOLEAN_YES); - resources[i].full.enabled = do_full; - } + + snprintfz(config_key, CONFIG_MAX_NAME, "enable %s full pressure", resource_info[i].name); + do_full = config_get_boolean(CONFIG_SECTION_PLUGIN_PROC_PRESSURE, config_key, CONFIG_BOOLEAN_YES); + resources[i].full.enabled = do_full; ff = procfile_open(filename, " =", PROCFILE_FLAG_DEFAULT); if (unlikely(!ff)) { @@ -108,65 +193,13 @@ int do_proc_pressure(int update_every, usec_t dt) { continue; } - struct pressure_chart *chart; if (do_some) { - chart = &resources[i].some; - if (unlikely(!chart->st)) { - chart->st = rrdset_create_localhost( - "system" - , chart->id - , NULL - , resource_info[i].family - , NULL - , chart->title - , "percentage" - , PLUGIN_PROC_NAME - , PLUGIN_PROC_MODULE_PRESSURE_NAME - , resource_info[i].section_priority + 40 - , update_every - , RRDSET_TYPE_LINE - ); - chart->rd10 = rrddim_add(chart->st, "some 10", NULL, 1, 100, RRD_ALGORITHM_ABSOLUTE); - chart->rd60 = rrddim_add(chart->st, "some 60", NULL, 1, 100, RRD_ALGORITHM_ABSOLUTE); - chart->rd300 = rrddim_add(chart->st, "some 300", NULL, 1, 100, RRD_ALGORITHM_ABSOLUTE); - } else { - rrdset_next(chart->st); - } - - chart->value10 = strtod(procfile_lineword(ff, 0, 2), NULL); - chart->value60 = strtod(procfile_lineword(ff, 0, 4), NULL); - chart->value300 = strtod(procfile_lineword(ff, 0, 6), NULL); - update_pressure_chart(chart); + proc_pressure_do_resource_some(ff, i); + update_pressure_charts(&resources[i].some); } - if (do_full && lines > 2) { - chart = &resources[i].full; - if (unlikely(!chart->st)) { - chart->st = rrdset_create_localhost( - "system" - , chart->id - , NULL - , resource_info[i].family - , NULL - , chart->title - , "percentage" - , PLUGIN_PROC_NAME - , PLUGIN_PROC_MODULE_PRESSURE_NAME - , resource_info[i].section_priority + 45 - , update_every - , RRDSET_TYPE_LINE - ); - chart->rd10 = rrddim_add(chart->st, "full 10", NULL, 1, 100, RRD_ALGORITHM_ABSOLUTE); - chart->rd60 = rrddim_add(chart->st, "full 60", NULL, 1, 100, RRD_ALGORITHM_ABSOLUTE); - chart->rd300 = rrddim_add(chart->st, "full 300", NULL, 1, 100, RRD_ALGORITHM_ABSOLUTE); - } else { - rrdset_next(chart->st); - } - - chart->value10 = strtod(procfile_lineword(ff, 1, 2), NULL); - chart->value60 = strtod(procfile_lineword(ff, 1, 4), NULL); - chart->value300 = strtod(procfile_lineword(ff, 1, 6), NULL); - update_pressure_chart(chart); + proc_pressure_do_resource_full(ff, i); + update_pressure_charts(&resources[i].full); } } diff --git a/collectors/proc.plugin/proc_pressure.h b/collectors/proc.plugin/proc_pressure.h index 333021866..a421cf8a4 100644 --- a/collectors/proc.plugin/proc_pressure.h +++ b/collectors/proc.plugin/proc_pressure.h @@ -9,23 +9,35 @@ struct pressure { int updated; char *filename; - struct pressure_chart { + struct pressure_charts { int enabled; - const char *id; - const char *title; + struct pressure_share_time_chart { + const char *id; + const char *title; - double value10; - double value60; - double value300; + double value10; + double value60; + double value300; - RRDSET *st; - RRDDIM *rd10; - RRDDIM *rd60; - RRDDIM *rd300; + RRDSET *st; + RRDDIM *rd10; + RRDDIM *rd60; + RRDDIM *rd300; + } share_time; + + struct pressure_total_time_chart { + const char *id; + const char *title; + + unsigned long long value_total; + + RRDSET *st; + RRDDIM *rdtotal; + } total_time; } some, full; }; -extern void update_pressure_chart(struct pressure_chart *chart); +extern void update_pressure_charts(struct pressure_charts *charts); #endif //NETDATA_PROC_PRESSURE_H diff --git a/collectors/proc.plugin/proc_spl_kstat_zfs.c b/collectors/proc.plugin/proc_spl_kstat_zfs.c index fedc03436..fae112249 100644 --- a/collectors/proc.plugin/proc_spl_kstat_zfs.c +++ b/collectors/proc.plugin/proc_spl_kstat_zfs.c @@ -11,6 +11,8 @@ extern struct arcstats arcstats; +unsigned long long zfs_arcstats_shrinkable_cache_size_bytes = 0; + int do_proc_spl_kstat_zfs_arcstats(int update_every, usec_t dt) { (void)dt; @@ -190,6 +192,12 @@ int do_proc_spl_kstat_zfs_arcstats(int update_every, usec_t dt) { if(unlikely(arl_check(arl_base, key, value))) break; } + if (arcstats.size > arcstats.c_min) { + zfs_arcstats_shrinkable_cache_size_bytes = arcstats.size - arcstats.c_min; + } else { + zfs_arcstats_shrinkable_cache_size_bytes = 0; + } + if(unlikely(arcstats.l2exist == -1)) arcstats.l2exist = 0; @@ -244,7 +252,7 @@ void disable_zfs_pool_state(struct zfs_pool *pool) pool->disabled = 1; } -int update_zfs_pool_state_chart(char *name, void *pool_p, void *update_every_p) +int update_zfs_pool_state_chart(const char *name, void *pool_p, void *update_every_p) { struct zfs_pool *pool = (struct zfs_pool *)pool_p; int update_every = *(int *)update_every_p; @@ -290,7 +298,7 @@ int update_zfs_pool_state_chart(char *name, void *pool_p, void *update_every_p) } } else { disable_zfs_pool_state(pool); - struct deleted_zfs_pool *new = calloc(1, sizeof(struct deleted_zfs_pool)); + struct deleted_zfs_pool *new = callocz(1, sizeof(struct deleted_zfs_pool)); new->name = strdupz(name); new->next = deleted_zfs_pools; deleted_zfs_pools = new; @@ -400,7 +408,7 @@ int do_proc_spl_kstat_zfs_pool_state(int update_every, usec_t dt) } if (do_zfs_pool_state) - dictionary_get_all_name_value(zfs_pools, update_zfs_pool_state_chart, &update_every); + dictionary_walkthrough_read(zfs_pools, update_zfs_pool_state_chart, &update_every); while (deleted_zfs_pools) { struct deleted_zfs_pool *current_pool = deleted_zfs_pools; diff --git a/collectors/proc.plugin/proc_stat.c b/collectors/proc.plugin/proc_stat.c index 373a06770..c889f0736 100644 --- a/collectors/proc.plugin/proc_stat.c +++ b/collectors/proc.plugin/proc_stat.c @@ -1029,7 +1029,7 @@ int do_proc_stat(int update_every, usec_t dt) { , cpuidle_chart_id , NULL , "cpuidle" - , "cpuidle.cpuidle" + , "cpuidle.cpu_cstate_residency_time" , "C-state residency time" , "percentage" , PLUGIN_PROC_NAME @@ -1040,10 +1040,11 @@ int do_proc_stat(int update_every, usec_t dt) { ); char cpuidle_dim_id[RRD_ID_LENGTH_MAX + 1]; - snprintfz(cpuidle_dim_id, RRD_ID_LENGTH_MAX, "cpu%zu_active_time", core); - cpuidle_charts[core].active_time_rd = rrddim_add(cpuidle_charts[core].st, cpuidle_dim_id, "C0 (active)", 1, 1, RRD_ALGORITHM_PCENT_OVER_DIFF_TOTAL); + cpuidle_charts[core].active_time_rd = rrddim_add(cpuidle_charts[core].st, "active", "C0 (active)", 1, 1, RRD_ALGORITHM_PCENT_OVER_DIFF_TOTAL); for(state = 0; state < cpuidle_charts[core].cpuidle_state_len; state++) { - snprintfz(cpuidle_dim_id, RRD_ID_LENGTH_MAX, "cpu%zu_cpuidle_state%zu_time", core, state); + strncpyz(cpuidle_dim_id, cpuidle_charts[core].cpuidle_state[state].name, RRD_ID_LENGTH_MAX); + for(int i = 0; cpuidle_dim_id[i]; i++) + cpuidle_dim_id[i] = tolower(cpuidle_dim_id[i]); cpuidle_charts[core].cpuidle_state[state].rd = rrddim_add(cpuidle_charts[core].st, cpuidle_dim_id, cpuidle_charts[core].cpuidle_state[state].name, 1, 1, RRD_ALGORITHM_PCENT_OVER_DIFF_TOTAL); diff --git a/collectors/proc.plugin/sys_block_zram.c b/collectors/proc.plugin/sys_block_zram.c index 170c72062..3a39b3b66 100644 --- a/collectors/proc.plugin/sys_block_zram.c +++ b/collectors/proc.plugin/sys_block_zram.c @@ -165,7 +165,7 @@ static int init_devices(DICTIONARY *devices, unsigned int zram_id, int update_ev return count; } -static void free_device(DICTIONARY *dict, char *name) +static void free_device(DICTIONARY *dict, const char *name) { ZRAM_DEVICE *d = (ZRAM_DEVICE*)dictionary_get(dict, name); info("ZRAM : Disabling monitoring of device %s", name); @@ -173,7 +173,7 @@ static void free_device(DICTIONARY *dict, char *name) rrdset_obsolete_and_pointer_null(d->st_savings); rrdset_obsolete_and_pointer_null(d->st_alloc_efficiency); rrdset_obsolete_and_pointer_null(d->st_comp_ratio); - dictionary_del(dict, name); + dictionary_del_having_write_lock(dict, name); } // -------------------------------------------------------------------- @@ -200,7 +200,7 @@ static inline int read_mm_stat(procfile *ff, MM_STAT *stats) { return 0; } -static inline int _collect_zram_metrics(char* name, ZRAM_DEVICE *d, int advance, DICTIONARY* dict) { +static inline int _collect_zram_metrics(const char* name, ZRAM_DEVICE *d, int advance, DICTIONARY* dict) { MM_STAT mm; int value; if (unlikely(read_mm_stat(d->file, &mm) < 0)) @@ -235,12 +235,12 @@ static inline int _collect_zram_metrics(char* name, ZRAM_DEVICE *d, int advance, return 0; } -static int collect_first_zram_metrics(char *name, void *entry, void *data) { +static int collect_first_zram_metrics(const char *name, void *entry, void *data) { // collect without calling rrdset_next (init only) return _collect_zram_metrics(name, (ZRAM_DEVICE *)entry, 0, (DICTIONARY *)data); } -static int collect_zram_metrics(char *name, void *entry, void *data) { +static int collect_zram_metrics(const char *name, void *entry, void *data) { (void)name; // collect with calling rrdset_next return _collect_zram_metrics(name, (ZRAM_DEVICE *)entry, 1, (DICTIONARY *)data); @@ -280,13 +280,13 @@ int do_sys_block_zram(int update_every, usec_t dt) { device_count = init_devices(devices, (unsigned int)zram_id, update_every); if (device_count < 1) return 1; - dictionary_get_all_name_value(devices, collect_first_zram_metrics, devices); + dictionary_walkthrough_write(devices, collect_first_zram_metrics, devices); } else { if (unlikely(device_count < 1)) return 1; - dictionary_get_all_name_value(devices, collect_zram_metrics, devices); + dictionary_walkthrough_write(devices, collect_zram_metrics, devices); } return 0; }
\ No newline at end of file diff --git a/collectors/python.d.plugin/Makefile.am b/collectors/python.d.plugin/Makefile.am index 38eb90f79..667f1627c 100644 --- a/collectors/python.d.plugin/Makefile.am +++ b/collectors/python.d.plugin/Makefile.am @@ -43,41 +43,30 @@ include adaptec_raid/Makefile.inc include alarms/Makefile.inc include am2320/Makefile.inc include anomalies/Makefile.inc -include apache/Makefile.inc include beanstalk/Makefile.inc include bind_rndc/Makefile.inc include boinc/Makefile.inc include ceph/Makefile.inc include changefinder/Makefile.inc include chrony/Makefile.inc -include couchdb/Makefile.inc -include dnsdist/Makefile.inc -include dns_query_time/Makefile.inc include dockerd/Makefile.inc include dovecot/Makefile.inc -include elasticsearch/Makefile.inc -include energid/Makefile.inc include example/Makefile.inc include exim/Makefile.inc include fail2ban/Makefile.inc -include freeradius/Makefile.inc include gearman/Makefile.inc include go_expvar/Makefile.inc include haproxy/Makefile.inc include hddtemp/Makefile.inc -include httpcheck/Makefile.inc include hpssa/Makefile.inc include icecast/Makefile.inc include ipfs/Makefile.inc -include isc_dhcpd/Makefile.inc include litespeed/Makefile.inc include logind/Makefile.inc include megacli/Makefile.inc include memcached/Makefile.inc include mongodb/Makefile.inc include monit/Makefile.inc -include mysql/Makefile.inc -include nginx/Makefile.inc include nginx_plus/Makefile.inc include nvidia_smi/Makefile.inc include nsd/Makefile.inc @@ -85,15 +74,11 @@ include ntpd/Makefile.inc include ovpn_status_log/Makefile.inc include openldap/Makefile.inc include oracledb/Makefile.inc -include phpfpm/Makefile.inc -include portcheck/Makefile.inc include postfix/Makefile.inc include postgres/Makefile.inc -include powerdns/Makefile.inc include proxysql/Makefile.inc include puppet/Makefile.inc include rabbitmq/Makefile.inc -include redis/Makefile.inc include rethinkdbs/Makefile.inc include retroshare/Makefile.inc include riakkv/Makefile.inc @@ -109,7 +94,6 @@ include traefik/Makefile.inc include uwsgi/Makefile.inc include varnish/Makefile.inc include w1sensor/Makefile.inc -include web_log/Makefile.inc include zscores/Makefile.inc pythonmodulesdir=$(pythondir)/python_modules diff --git a/collectors/python.d.plugin/README.md b/collectors/python.d.plugin/README.md index 7c060f811..2f5ebfcb1 100644 --- a/collectors/python.d.plugin/README.md +++ b/collectors/python.d.plugin/README.md @@ -227,8 +227,7 @@ For additional security it uses python `subprocess.Popen` (without `shell=True` _Examples: `apache`, `nginx`, `tomcat`_ -_Multiple Endpoints (urls) Examples: [`rabbitmq`](/collectors/python.d.plugin/rabbitmq/README.md) (simpler) , -[`elasticsearch`](/collectors/python.d.plugin/elasticsearch/README.md) (threaded)_ +_Multiple Endpoints (urls) Examples: [`rabbitmq`](/collectors/python.d.plugin/rabbitmq/README.md) (simpler). _Variables from config file_: `url`, `user`, `pass`. diff --git a/collectors/python.d.plugin/alarms/README.md b/collectors/python.d.plugin/alarms/README.md index cd5e1b817..ee1e59971 100644 --- a/collectors/python.d.plugin/alarms/README.md +++ b/collectors/python.d.plugin/alarms/README.md @@ -53,6 +53,11 @@ local: CRITICAL: 2 # set to true to include a chart with calculated alarm values over time collect_alarm_values: false + # define the type of chart for plotting status over time e.g. 'line' or 'stacked' + alarm_status_chart_type: 'line' + # a "," separated list of words you want to filter alarm names for. For example 'cpu,load' would filter for only + # alarms with "cpu" or "load" in alarm name. Default includes all. + alarm_contains_words: '' ``` It will default to pulling all alarms at each time step from the Netdata rest api at `http://127.0.0.1:19999/api/v1/alarms?all` diff --git a/collectors/python.d.plugin/alarms/alarms.chart.py b/collectors/python.d.plugin/alarms/alarms.chart.py index 1eec40450..314b0e7a8 100644 --- a/collectors/python.d.plugin/alarms/alarms.chart.py +++ b/collectors/python.d.plugin/alarms/alarms.chart.py @@ -38,7 +38,7 @@ DEFAULT_STATUS_MAP = {'CLEAR': 0, 'WARNING': 1, 'CRITICAL': 2} DEFAULT_URL = 'http://127.0.0.1:19999/api/v1/alarms?all' DEFAULT_COLLECT_ALARM_VALUES = False DEFAULT_ALARM_STATUS_CHART_TYPE = 'line' - +DEFAULT_ALARM_CONTAINS_WORDS = '' class Service(UrlService): def __init__(self, configuration=None, name=None): @@ -49,6 +49,8 @@ class Service(UrlService): self.url = self.configuration.get('url', DEFAULT_URL) self.collect_alarm_values = bool(self.configuration.get('collect_alarm_values', DEFAULT_COLLECT_ALARM_VALUES)) self.collected_dims = {'alarms': set(), 'values': set()} + self.alarm_contains_words = self.configuration.get('alarm_contains_words', DEFAULT_ALARM_CONTAINS_WORDS) + self.alarm_contains_words_list = [alarm_contains_word.lstrip(' ').rstrip(' ') for alarm_contains_word in self.alarm_contains_words.split(',')] def _get_data(self): raw_data = self._get_raw_data() @@ -57,6 +59,9 @@ class Service(UrlService): raw_data = loads(raw_data) alarms = raw_data.get('alarms', {}) + if self.alarm_contains_words != '': + alarms = {alarm_name: alarms[alarm_name] for alarm_name in alarms for alarm_contains_word in + self.alarm_contains_words_list if alarm_contains_word in alarm_name} data = {a: self.sm[alarms[a]['status']] for a in alarms if alarms[a]['status'] in self.sm} self.update_charts('alarms', data) diff --git a/collectors/python.d.plugin/alarms/alarms.conf b/collectors/python.d.plugin/alarms/alarms.conf index 5e83d8f56..cd48d4411 100644 --- a/collectors/python.d.plugin/alarms/alarms.conf +++ b/collectors/python.d.plugin/alarms/alarms.conf @@ -52,3 +52,6 @@ local: collect_alarm_values: false # define the type of chart for plotting status over time e.g. 'line' or 'stacked' alarm_status_chart_type: 'line' + # a "," separated list of words you want to filter alarm names for. For example 'cpu,load' would filter for only + # alarms with "cpu" or "load" in alarm name. Default includes all. + alarm_contains_words: '' diff --git a/collectors/python.d.plugin/anomalies/README.md b/collectors/python.d.plugin/anomalies/README.md index 32e79a82f..aaf39ab92 100644 --- a/collectors/python.d.plugin/anomalies/README.md +++ b/collectors/python.d.plugin/anomalies/README.md @@ -7,6 +7,8 @@ sidebar_url: Anomalies # Anomaly detection with Netdata +**Note**: Check out the [Netdata Anomaly Advisor](https://learn.netdata.cloud/docs/cloud/insights/anomaly-advisor) for a more native anomaly detection experience within Netdata. + This collector uses the Python [PyOD](https://pyod.readthedocs.io/en/latest/index.html) library to perform unsupervised [anomaly detection](https://en.wikipedia.org/wiki/Anomaly_detection) on your Netdata charts and/or dimensions. Instead of this collector just _collecting_ data, it also does some computation on the data it collects to return an anomaly probability and anomaly flag for each chart or custom model you define. This computation consists of a **train** function that runs every `train_n_secs` to train the ML models to learn what 'normal' typically looks like on your node. At each iteration there is also a **predict** function that uses the latest trained models and most recent metrics to produce an anomaly probability and anomaly flag for each chart or custom model you define. diff --git a/collectors/python.d.plugin/apache/Makefile.inc b/collectors/python.d.plugin/apache/Makefile.inc deleted file mode 100644 index 70a421550..000000000 --- a/collectors/python.d.plugin/apache/Makefile.inc +++ /dev/null @@ -1,13 +0,0 @@ -# SPDX-License-Identifier: GPL-3.0-or-later - -# THIS IS NOT A COMPLETE Makefile -# IT IS INCLUDED BY ITS PARENT'S Makefile.am -# IT IS REQUIRED TO REFERENCE ALL FILES RELATIVE TO THE PARENT - -# install these files -dist_python_DATA += apache/apache.chart.py -dist_pythonconfig_DATA += apache/apache.conf - -# do not install these files, but include them in the distribution -dist_noinst_DATA += apache/README.md apache/Makefile.inc - diff --git a/collectors/python.d.plugin/apache/README.md b/collectors/python.d.plugin/apache/README.md deleted file mode 100644 index c6086835f..000000000 --- a/collectors/python.d.plugin/apache/README.md +++ /dev/null @@ -1,82 +0,0 @@ -<!-- -title: "Apache monitoring with Netdata" -custom_edit_url: https://github.com/netdata/netdata/edit/master/collectors/python.d.plugin/apache/README.md -sidebar_label: "Apache" ---> - -# Apache monitoring with Netdata - -Monitors one or more Apache servers depending on configuration. - -## Requirements - -- apache with enabled `mod_status` - -It produces the following charts: - -1. **Requests** in requests/s - - - requests - -2. **Connections** - - - connections - -3. **Async Connections** - - - keepalive - - closing - - writing - -4. **Bandwidth** in kilobytes/s - - - sent - -5. **Workers** - - - idle - - busy - -6. **Lifetime Avg. Requests/s** in requests/s - - - requests_sec - -7. **Lifetime Avg. Bandwidth/s** in kilobytes/s - - - size_sec - -8. **Lifetime Avg. Response Size** in bytes/request - - - size_req - -## Configuration - -Edit the `python.d/apache.conf` configuration file using `edit-config` from the Netdata [config -directory](/docs/configure/nodes.md), which is typically at `/etc/netdata`. - -```bash -cd /etc/netdata # Replace this path with your Netdata config directory, if different -sudo ./edit-config python.d/apache.conf -``` - -Needs only `url` to server's `server-status?auto` - -Example for two servers: - -```yaml -update_every : 10 -priority : 90100 - -local: - url : 'http://localhost/server-status?auto' - -remote: - url : 'http://www.apache.org/server-status?auto' - update_every : 5 -``` - -Without configuration, module attempts to connect to `http://localhost/server-status?auto` - ---- - - diff --git a/collectors/python.d.plugin/apache/apache.chart.py b/collectors/python.d.plugin/apache/apache.chart.py deleted file mode 100644 index ceac9ecd5..000000000 --- a/collectors/python.d.plugin/apache/apache.chart.py +++ /dev/null @@ -1,159 +0,0 @@ -# -*- coding: utf-8 -*- -# Description: apache netdata python.d module -# Author: Pawel Krupa (paulfantom) -# SPDX-License-Identifier: GPL-3.0-or-later - -from bases.FrameworkServices.UrlService import UrlService - -ORDER = [ - 'requests', - 'connections', - 'conns_async', - 'net', - 'workers', - 'reqpersec', - 'bytespersec', - 'bytesperreq', -] - -CHARTS = { - 'bytesperreq': { - 'options': [None, 'Lifetime Avg. Request Size', 'KiB', - 'statistics', 'apache.bytesperreq', 'area'], - 'lines': [ - ['size_req', 'size', 'absolute', 1, 1024 * 100000] - ]}, - 'workers': { - 'options': [None, 'Workers', 'workers', 'workers', 'apache.workers', 'stacked'], - 'lines': [ - ['idle'], - ['busy'], - ]}, - 'reqpersec': { - 'options': [None, 'Lifetime Avg. Requests/s', 'requests/s', 'statistics', - 'apache.reqpersec', 'area'], - 'lines': [ - ['requests_sec', 'requests', 'absolute', 1, 100000] - ]}, - 'bytespersec': { - 'options': [None, 'Lifetime Avg. Bandwidth/s', 'kilobits/s', 'statistics', - 'apache.bytespersec', 'area'], - 'lines': [ - ['size_sec', None, 'absolute', 8, 1000 * 100000] - ]}, - 'requests': { - 'options': [None, 'Requests', 'requests/s', 'requests', 'apache.requests', 'line'], - 'lines': [ - ['requests', None, 'incremental'] - ]}, - 'net': { - 'options': [None, 'Bandwidth', 'kilobits/s', 'bandwidth', 'apache.net', 'area'], - 'lines': [ - ['sent', None, 'incremental', 8, 1] - ]}, - 'connections': { - 'options': [None, 'Connections', 'connections', 'connections', 'apache.connections', 'line'], - 'lines': [ - ['connections'] - ]}, - 'conns_async': { - 'options': [None, 'Async Connections', 'connections', 'connections', 'apache.conns_async', 'stacked'], - 'lines': [ - ['keepalive'], - ['closing'], - ['writing'] - ]} -} - -ASSIGNMENT = { - 'BytesPerReq': 'size_req', - 'IdleWorkers': 'idle', - 'IdleServers': 'idle_servers', - 'BusyWorkers': 'busy', - 'BusyServers': 'busy_servers', - 'ReqPerSec': 'requests_sec', - 'BytesPerSec': 'size_sec', - 'Total Accesses': 'requests', - 'Total kBytes': 'sent', - 'ConnsTotal': 'connections', - 'ConnsAsyncKeepAlive': 'keepalive', - 'ConnsAsyncClosing': 'closing', - 'ConnsAsyncWriting': 'writing' -} - -FLOAT_VALUES = [ - 'BytesPerReq', - 'ReqPerSec', - 'BytesPerSec', -] - -LIGHTTPD_MARKER = 'idle_servers' - - -class Service(UrlService): - def __init__(self, configuration=None, name=None): - UrlService.__init__(self, configuration=configuration, name=name) - self.order = ORDER - self.definitions = CHARTS - self.url = self.configuration.get('url', 'http://localhost/server-status?auto') - - def check(self): - self._manager = self._build_manager() - - data = self._get_data() - - if not data: - return None - - if LIGHTTPD_MARKER in data: - self.turn_into_lighttpd() - - return True - - def _get_data(self): - """ - Format data received from http request - :return: dict - """ - raw_data = self._get_raw_data() - - if not raw_data: - return None - - data = dict() - - for line in raw_data.split('\n'): - try: - parse_line(line, data) - except ValueError: - continue - - return data or None - - def turn_into_lighttpd(self): - self.module_name = 'lighttpd' - for chart in self.definitions: - if chart == 'workers': - lines = self.definitions[chart]['lines'] - lines[0] = ['idle_servers', 'idle'] - lines[1] = ['busy_servers', 'busy'] - opts = self.definitions[chart]['options'] - opts[1] = opts[1].replace('apache', 'lighttpd') - opts[4] = opts[4].replace('apache', 'lighttpd') - - -def parse_line(line, data): - parts = line.split(':') - - if len(parts) != 2: - return - - key, value = parts[0], parts[1] - - if key not in ASSIGNMENT: - return - - if key in FLOAT_VALUES: - data[ASSIGNMENT[key]] = int((float(value) * 100000)) - else: - data[ASSIGNMENT[key]] = int(value) diff --git a/collectors/python.d.plugin/apache/apache.conf b/collectors/python.d.plugin/apache/apache.conf deleted file mode 100644 index 84e12a57c..000000000 --- a/collectors/python.d.plugin/apache/apache.conf +++ /dev/null @@ -1,85 +0,0 @@ -# netdata python.d.plugin configuration for apache -# -# This file is in YaML format. Generally the format is: -# -# name: value -# -# There are 2 sections: -# - global variables -# - one or more JOBS -# -# JOBS allow you to collect values from multiple sources. -# Each source will have its own set of charts. -# -# JOB parameters have to be indented (using spaces only, example below). - -# ---------------------------------------------------------------------- -# Global Variables -# These variables set the defaults for all JOBs, however each JOB -# may define its own, overriding the defaults. - -# update_every sets the default data collection frequency. -# If unset, the python.d.plugin default is used. -# update_every: 1 - -# priority controls the order of charts at the netdata dashboard. -# Lower numbers move the charts towards the top of the page. -# If unset, the default for python.d.plugin is used. -# priority: 60000 - -# penalty indicates whether to apply penalty to update_every in case of failures. -# Penalty will increase every 5 failed updates in a row. Maximum penalty is 10 minutes. -# penalty: yes - -# autodetection_retry sets the job re-check interval in seconds. -# The job is not deleted if check fails. -# Attempts to start the job are made once every autodetection_retry. -# This feature is disabled by default. -# autodetection_retry: 0 - -# ---------------------------------------------------------------------- -# JOBS (data collection sources) -# -# The default JOBS share the same *name*. JOBS with the same name -# are mutually exclusive. Only one of them will be allowed running at -# any time. This allows autodetection to try several alternatives and -# pick the one that works. -# -# Any number of jobs is supported. -# -# All python.d.plugin JOBS (for all its modules) support a set of -# predefined parameters. These are: -# -# job_name: -# name: myname # the JOB's name as it will appear at the -# # dashboard (by default is the job_name) -# # JOBs sharing a name are mutually exclusive -# update_every: 1 # the JOB's data collection frequency -# priority: 60000 # the JOB's order on the dashboard -# penalty: yes # the JOB's penalty -# autodetection_retry: 0 # the JOB's re-check interval in seconds -# -# Additionally to the above, apache also supports the following: -# -# url: 'URL' # the URL to fetch apache's mod_status stats -# -# if the URL is password protected, the following are supported: -# -# user: 'username' -# pass: 'password' - -# ---------------------------------------------------------------------- -# AUTO-DETECTION JOBS -# only one of them will run (they have the same name) - -localhost: - name : 'local' - url : 'http://localhost/server-status?auto' - -localipv4: - name : 'local' - url : 'http://127.0.0.1/server-status?auto' - -localipv6: - name : 'local' - url : 'http://[::1]/server-status?auto' diff --git a/collectors/python.d.plugin/couchdb/Makefile.inc b/collectors/python.d.plugin/couchdb/Makefile.inc deleted file mode 100644 index 89dfb51c7..000000000 --- a/collectors/python.d.plugin/couchdb/Makefile.inc +++ /dev/null @@ -1,13 +0,0 @@ -# SPDX-License-Identifier: GPL-3.0-or-later - -# THIS IS NOT A COMPLETE Makefile -# IT IS INCLUDED BY ITS PARENT'S Makefile.am -# IT IS REQUIRED TO REFERENCE ALL FILES RELATIVE TO THE PARENT - -# install these files -dist_python_DATA += couchdb/couchdb.chart.py -dist_pythonconfig_DATA += couchdb/couchdb.conf - -# do not install these files, but include them in the distribution -dist_noinst_DATA += couchdb/README.md couchdb/Makefile.inc - diff --git a/collectors/python.d.plugin/couchdb/README.md b/collectors/python.d.plugin/couchdb/README.md deleted file mode 100644 index d359c8f7c..000000000 --- a/collectors/python.d.plugin/couchdb/README.md +++ /dev/null @@ -1,53 +0,0 @@ -<!-- -title: "Apache CouchDB monitoring with Netdata" -custom_edit_url: https://github.com/netdata/netdata/edit/master/collectors/python.d.plugin/couchdb/README.md -sidebar_label: "CouchDB" ---> - -# Apache CouchDB monitoring with Netdata - -Monitors vital statistics of a local Apache CouchDB 2.x server, including: - -- Overall server reads/writes -- HTTP traffic breakdown - - Request methods (`GET`, `PUT`, `POST`, etc.) - - Response status codes (`200`, `201`, `4xx`, etc.) -- Active server tasks -- Replication status (CouchDB 2.1 and up only) -- Erlang VM stats -- Optional per-database statistics: sizes, # of docs, # of deleted docs - -## Configuration - -Edit the `python.d/couchdb.conf` configuration file using `edit-config` from the Netdata [config -directory](/docs/configure/nodes.md), which is typically at `/etc/netdata`. - -```bash -cd /etc/netdata # Replace this path with your Netdata config directory, if different -sudo ./edit-config python.d/couchdb.conf -``` - -Sample for a local server running on port 5984: - -```yaml -local: - user: 'admin' - pass: 'password' - node: 'couchdb@127.0.0.1' -``` - -Be sure to specify a correct admin-level username and password. - -You may also need to change the `node` name; this should match the value of `-name NODENAME` in your CouchDB's `etc/vm.args` file. Typically this is of the form `couchdb@fully.qualified.domain.name` in a cluster, or `couchdb@127.0.0.1` / `couchdb@localhost` for a single-node server. - -If you want per-database statistics, these need to be added to the configuration, separated by spaces: - -```yaml -local: - ... - databases: 'db1 db2 db3 ...' -``` - ---- - - diff --git a/collectors/python.d.plugin/couchdb/couchdb.chart.py b/collectors/python.d.plugin/couchdb/couchdb.chart.py deleted file mode 100644 index a395f356c..000000000 --- a/collectors/python.d.plugin/couchdb/couchdb.chart.py +++ /dev/null @@ -1,398 +0,0 @@ -# -*- coding: utf-8 -*- -# Description: couchdb netdata python.d module -# Author: wohali <wohali@apache.org> -# Thanks to ilyam8 for good examples :) -# SPDX-License-Identifier: GPL-3.0-or-later - -from collections import namedtuple, defaultdict -from json import loads -from socket import gethostbyname, gaierror -from threading import Thread - -try: - from queue import Queue -except ImportError: - from Queue import Queue - -from bases.FrameworkServices.UrlService import UrlService - -update_every = 1 - -METHODS = namedtuple('METHODS', ['get_data', 'url', 'stats']) - -OVERVIEW_STATS = [ - 'couchdb.database_reads.value', - 'couchdb.database_writes.value', - 'couchdb.httpd.view_reads.value', - 'couchdb.httpd_request_methods.COPY.value', - 'couchdb.httpd_request_methods.DELETE.value', - 'couchdb.httpd_request_methods.GET.value', - 'couchdb.httpd_request_methods.HEAD.value', - 'couchdb.httpd_request_methods.OPTIONS.value', - 'couchdb.httpd_request_methods.POST.value', - 'couchdb.httpd_request_methods.PUT.value', - 'couchdb.httpd_status_codes.200.value', - 'couchdb.httpd_status_codes.201.value', - 'couchdb.httpd_status_codes.202.value', - 'couchdb.httpd_status_codes.204.value', - 'couchdb.httpd_status_codes.206.value', - 'couchdb.httpd_status_codes.301.value', - 'couchdb.httpd_status_codes.302.value', - 'couchdb.httpd_status_codes.304.value', - 'couchdb.httpd_status_codes.400.value', - 'couchdb.httpd_status_codes.401.value', - 'couchdb.httpd_status_codes.403.value', - 'couchdb.httpd_status_codes.404.value', - 'couchdb.httpd_status_codes.405.value', - 'couchdb.httpd_status_codes.406.value', - 'couchdb.httpd_status_codes.409.value', - 'couchdb.httpd_status_codes.412.value', - 'couchdb.httpd_status_codes.413.value', - 'couchdb.httpd_status_codes.414.value', - 'couchdb.httpd_status_codes.415.value', - 'couchdb.httpd_status_codes.416.value', - 'couchdb.httpd_status_codes.417.value', - 'couchdb.httpd_status_codes.500.value', - 'couchdb.httpd_status_codes.501.value', - 'couchdb.open_os_files.value', - 'couch_replicator.jobs.running.value', - 'couch_replicator.jobs.pending.value', - 'couch_replicator.jobs.crashed.value', -] - -SYSTEM_STATS = [ - 'context_switches', - 'run_queue', - 'ets_table_count', - 'reductions', - 'memory.atom', - 'memory.atom_used', - 'memory.binary', - 'memory.code', - 'memory.ets', - 'memory.other', - 'memory.processes', - 'io_input', - 'io_output', - 'os_proc_count', - 'process_count', - 'internal_replication_jobs' -] - -DB_STATS = [ - 'doc_count', - 'doc_del_count', - 'sizes.file', - 'sizes.external', - 'sizes.active' -] - -ORDER = [ - 'activity', - 'request_methods', - 'response_codes', - 'active_tasks', - 'replicator_jobs', - 'open_files', - 'db_sizes_file', - 'db_sizes_external', - 'db_sizes_active', - 'db_doc_counts', - 'db_doc_del_counts', - 'erlang_memory', - 'erlang_proc_counts', - 'erlang_peak_msg_queue', - 'erlang_reductions' -] - -CHARTS = { - 'activity': { - 'options': [None, 'Overall Activity', 'requests/s', - 'dbactivity', 'couchdb.activity', 'stacked'], - 'lines': [ - ['couchdb_database_reads', 'DB reads', 'incremental'], - ['couchdb_database_writes', 'DB writes', 'incremental'], - ['couchdb_httpd_view_reads', 'View reads', 'incremental'] - ] - }, - 'request_methods': { - 'options': [None, 'HTTP request methods', 'requests/s', - 'httptraffic', 'couchdb.request_methods', - 'stacked'], - 'lines': [ - ['couchdb_httpd_request_methods_COPY', 'COPY', 'incremental'], - ['couchdb_httpd_request_methods_DELETE', 'DELETE', 'incremental'], - ['couchdb_httpd_request_methods_GET', 'GET', 'incremental'], - ['couchdb_httpd_request_methods_HEAD', 'HEAD', 'incremental'], - ['couchdb_httpd_request_methods_OPTIONS', 'OPTIONS', - 'incremental'], - ['couchdb_httpd_request_methods_POST', 'POST', 'incremental'], - ['couchdb_httpd_request_methods_PUT', 'PUT', 'incremental'] - ] - }, - 'response_codes': { - 'options': [None, 'HTTP response status codes', 'responses/s', - 'httptraffic', 'couchdb.response_codes', - 'stacked'], - 'lines': [ - ['couchdb_httpd_status_codes_200', '200 OK', 'incremental'], - ['couchdb_httpd_status_codes_201', '201 Created', 'incremental'], - ['couchdb_httpd_status_codes_202', '202 Accepted', 'incremental'], - ['couchdb_httpd_status_codes_2xx', 'Other 2xx Success', - 'incremental'], - ['couchdb_httpd_status_codes_3xx', '3xx Redirection', - 'incremental'], - ['couchdb_httpd_status_codes_4xx', '4xx Client error', - 'incremental'], - ['couchdb_httpd_status_codes_5xx', '5xx Server error', - 'incremental'] - ] - }, - 'open_files': { - 'options': [None, 'Open files', 'files', 'ops', 'couchdb.open_files', 'line'], - 'lines': [ - ['couchdb_open_os_files', '# files', 'absolute'] - ] - }, - 'active_tasks': { - 'options': [None, 'Active task breakdown', 'tasks', 'ops', 'couchdb.active_tasks', 'stacked'], - 'lines': [ - ['activetasks_indexer', 'Indexer', 'absolute'], - ['activetasks_database_compaction', 'DB Compaction', 'absolute'], - ['activetasks_replication', 'Replication', 'absolute'], - ['activetasks_view_compaction', 'View Compaction', 'absolute'] - ] - }, - 'replicator_jobs': { - 'options': [None, 'Replicator job breakdown', 'jobs', 'ops', 'couchdb.replicator_jobs', 'stacked'], - 'lines': [ - ['couch_replicator_jobs_running', 'Running', 'absolute'], - ['couch_replicator_jobs_pending', 'Pending', 'absolute'], - ['couch_replicator_jobs_crashed', 'Crashed', 'absolute'], - ['internal_replication_jobs', 'Internal replication jobs', - 'absolute'] - ] - }, - 'erlang_memory': { - 'options': [None, 'Erlang VM memory usage', 'B', 'erlang', 'couchdb.erlang_vm_memory', 'stacked'], - 'lines': [ - ['memory_atom', 'atom', 'absolute'], - ['memory_binary', 'binaries', 'absolute'], - ['memory_code', 'code', 'absolute'], - ['memory_ets', 'ets', 'absolute'], - ['memory_processes', 'procs', 'absolute'], - ['memory_other', 'other', 'absolute'] - ] - }, - 'erlang_reductions': { - 'options': [None, 'Erlang reductions', 'count', 'erlang', 'couchdb.reductions', 'line'], - 'lines': [ - ['reductions', 'reductions', 'incremental'] - ] - }, - 'erlang_proc_counts': { - 'options': [None, 'Process counts', 'count', 'erlang', 'couchdb.proccounts', 'line'], - 'lines': [ - ['os_proc_count', 'OS procs', 'absolute'], - ['process_count', 'erl procs', 'absolute'] - ] - }, - 'erlang_peak_msg_queue': { - 'options': [None, 'Peak message queue size', 'count', 'erlang', 'couchdb.peakmsgqueue', - 'line'], - 'lines': [ - ['peak_msg_queue', 'peak size', 'absolute'] - ] - }, - # Lines for the following are added as part of check() - 'db_sizes_file': { - 'options': [None, 'Database sizes (file)', 'KiB', 'perdbstats', 'couchdb.db_sizes_file', 'line'], - 'lines': [] - }, - 'db_sizes_external': { - 'options': [None, 'Database sizes (external)', 'KiB', 'perdbstats', 'couchdb.db_sizes_external', 'line'], - 'lines': [] - }, - 'db_sizes_active': { - 'options': [None, 'Database sizes (active)', 'KiB', 'perdbstats', 'couchdb.db_sizes_active', 'line'], - 'lines': [] - }, - 'db_doc_counts': { - 'options': [None, 'Database # of docs', 'docs', - 'perdbstats', 'couchdb_db_doc_count', 'line'], - 'lines': [] - }, - 'db_doc_del_counts': { - 'options': [None, 'Database # of deleted docs', 'docs', 'perdbstats', 'couchdb_db_doc_del_count', 'line'], - 'lines': [] - } -} - - -class Service(UrlService): - def __init__(self, configuration=None, name=None): - UrlService.__init__(self, configuration=configuration, name=name) - self.order = ORDER - self.definitions = CHARTS - self.host = self.configuration.get('host', '127.0.0.1') - self.port = self.configuration.get('port', 5984) - self.node = self.configuration.get('node', 'couchdb@127.0.0.1') - self.scheme = self.configuration.get('scheme', 'http') - self.user = self.configuration.get('user') - self.password = self.configuration.get('pass') - try: - self.dbs = self.configuration.get('databases').split(' ') - except (KeyError, AttributeError): - self.dbs = list() - - def check(self): - if not (self.host and self.port): - self.error('Host is not defined in the module configuration file') - return False - try: - self.host = gethostbyname(self.host) - except gaierror as error: - self.error(str(error)) - return False - self.url = '{scheme}://{host}:{port}'.format(scheme=self.scheme, - host=self.host, - port=self.port) - stats = self.url + '/_node/{node}/_stats'.format(node=self.node) - active_tasks = self.url + '/_active_tasks' - system = self.url + '/_node/{node}/_system'.format(node=self.node) - self.methods = [METHODS(get_data=self._get_overview_stats, - url=stats, - stats=OVERVIEW_STATS), - METHODS(get_data=self._get_active_tasks_stats, - url=active_tasks, - stats=None), - METHODS(get_data=self._get_overview_stats, - url=system, - stats=SYSTEM_STATS), - METHODS(get_data=self._get_dbs_stats, - url=self.url, - stats=DB_STATS)] - # must initialise manager before using _get_raw_data - self._manager = self._build_manager() - self.dbs = [db for db in self.dbs - if self._get_raw_data(self.url + '/' + db)] - for db in self.dbs: - self.definitions['db_sizes_file']['lines'].append( - ['db_' + db + '_sizes_file', db, 'absolute', 1, 1000] - ) - self.definitions['db_sizes_external']['lines'].append( - ['db_' + db + '_sizes_external', db, 'absolute', 1, 1000] - ) - self.definitions['db_sizes_active']['lines'].append( - ['db_' + db + '_sizes_active', db, 'absolute', 1, 1000] - ) - self.definitions['db_doc_counts']['lines'].append( - ['db_' + db + '_doc_count', db, 'absolute'] - ) - self.definitions['db_doc_del_counts']['lines'].append( - ['db_' + db + '_doc_del_count', db, 'absolute'] - ) - return UrlService.check(self) - - def _get_data(self): - threads = list() - queue = Queue() - result = dict() - - for method in self.methods: - th = Thread(target=method.get_data, - args=(queue, method.url, method.stats)) - th.start() - threads.append(th) - - for thread in threads: - thread.join() - result.update(queue.get()) - - # self.info('couchdb result = ' + str(result)) - return result or None - - def _get_overview_stats(self, queue, url, stats): - raw_data = self._get_raw_data(url) - if not raw_data: - return queue.put(dict()) - data = loads(raw_data) - to_netdata = self._fetch_data(raw_data=data, metrics=stats) - if 'message_queues' in data: - to_netdata['peak_msg_queue'] = get_peak_msg_queue(data) - return queue.put(to_netdata) - - def _get_active_tasks_stats(self, queue, url, _): - taskdict = defaultdict(int) - taskdict["activetasks_indexer"] = 0 - taskdict["activetasks_database_compaction"] = 0 - taskdict["activetasks_replication"] = 0 - taskdict["activetasks_view_compaction"] = 0 - raw_data = self._get_raw_data(url) - if not raw_data: - return queue.put(dict()) - data = loads(raw_data) - for task in data: - taskdict["activetasks_" + task["type"]] += 1 - return queue.put(dict(taskdict)) - - def _get_dbs_stats(self, queue, url, stats): - to_netdata = {} - for db in self.dbs: - raw_data = self._get_raw_data(url + '/' + db) - if not raw_data: - continue - data = loads(raw_data) - for metric in stats: - value = data - metrics_list = metric.split('.') - try: - for m in metrics_list: - value = value[m] - except (KeyError, TypeError) as e: - self.debug('cannot process ' + metric + ' for ' + db - + ": " + str(e)) - continue - metric_name = 'db_{0}_{1}'.format(db, '_'.join(metrics_list)) - to_netdata[metric_name] = value - return queue.put(to_netdata) - - def _fetch_data(self, raw_data, metrics): - data = dict() - for metric in metrics: - value = raw_data - metrics_list = metric.split('.') - try: - for m in metrics_list: - value = value[m] - except (KeyError, TypeError) as e: - self.debug('cannot process ' + metric + ': ' + str(e)) - continue - # strip off .value from end of stat - if metrics_list[-1] == 'value': - metrics_list = metrics_list[:-1] - # sum up 3xx/4xx/5xx - if metrics_list[0:2] == ['couchdb', 'httpd_status_codes'] and \ - int(metrics_list[2]) > 202: - metrics_list[2] = '{0}xx'.format(int(metrics_list[2]) // 100) - if '_'.join(metrics_list) in data: - data['_'.join(metrics_list)] += value - else: - data['_'.join(metrics_list)] = value - else: - data['_'.join(metrics_list)] = value - return data - - -def get_peak_msg_queue(data): - maxsize = 0 - queues = data['message_queues'] - for queue in iter(queues.values()): - if isinstance(queue, dict) and 'count' in queue: - value = queue['count'] - elif isinstance(queue, int): - value = queue - else: - continue - maxsize = max(maxsize, value) - return maxsize diff --git a/collectors/python.d.plugin/couchdb/couchdb.conf b/collectors/python.d.plugin/couchdb/couchdb.conf deleted file mode 100644 index 9c68be777..000000000 --- a/collectors/python.d.plugin/couchdb/couchdb.conf +++ /dev/null @@ -1,89 +0,0 @@ -# netdata python.d.plugin configuration for couchdb -# -# This file is in YaML format. Generally the format is: -# -# name: value -# -# There are 2 sections: -# - global variables -# - one or more JOBS -# -# JOBS allow you to collect values from multiple sources. -# Each source will have its own set of charts. -# -# JOB parameters have to be indented (using spaces only, example below). - -# ---------------------------------------------------------------------- -# Global Variables -# These variables set the defaults for all JOBs, however each JOB -# may define its own, overriding the defaults. - -# update_every sets the default data collection frequency. -# If unset, the python.d.plugin default is used. -# By default, CouchDB only updates its stats every 10 seconds. -update_every: 10 - -# priority controls the order of charts at the netdata dashboard. -# Lower numbers move the charts towards the top of the page. -# If unset, the default for python.d.plugin is used. -# priority: 60000 - -# penalty indicates whether to apply penalty to update_every in case of failures. -# Penalty will increase every 5 failed updates in a row. Maximum penalty is 10 minutes. -# penalty: yes - -# autodetection_retry sets the job re-check interval in seconds. -# The job is not deleted if check fails. -# Attempts to start the job are made once every autodetection_retry. -# This feature is disabled by default. -# autodetection_retry: 0 - -# ---------------------------------------------------------------------- -# JOBS (data collection sources) -# -# The default JOBS share the same *name*. JOBS with the same name -# are mutually exclusive. Only one of them will be allowed running at -# any time. This allows autodetection to try several alternatives and -# pick the one that works. -# -# Any number of jobs is supported. -# -# All python.d.plugin JOBS (for all its modules) support a set of -# predefined parameters. These are: -# -# job_name: -# name: myname # the JOB's name as it will appear at the -# # dashboard (by default is the job_name) -# # JOBs sharing a name are mutually exclusive -# update_every: 1 # the JOB's data collection frequency -# priority: 60000 # the JOB's order on the dashboard -# penalty: yes # the JOB's penalty -# autodetection_retry: 0 # the JOB's re-check interval in seconds -# -# Additionally to the above, the couchdb plugin also supports the following: -# -# host: 'ipaddress' # Server ip address or hostname. Default: 127.0.0.1 -# port: 'port' # CouchDB port. Default: 15672 -# scheme: 'scheme' # http or https. Default: http -# node: 'couchdb@127.0.0.1' # CouchDB node name. Same as -name vm.args argument. -# -# if the URL is password protected, the following are supported: -# -# user: 'username' -# pass: 'password' -# -# if db-specific stats are desired, place their names in databases: -# databases: 'npm-registry animaldb' -# -# ---------------------------------------------------------------------- -# AUTO-DETECTION JOBS -# only one of them will run (they have the same name) -# -localhost: - name: 'local' - host: '127.0.0.1' - port: '5984' - node: 'couchdb@127.0.0.1' - scheme: 'http' -# user: 'admin' -# pass: 'password' diff --git a/collectors/python.d.plugin/dns_query_time/Makefile.inc b/collectors/python.d.plugin/dns_query_time/Makefile.inc deleted file mode 100644 index 7eca3e0b6..000000000 --- a/collectors/python.d.plugin/dns_query_time/Makefile.inc +++ /dev/null @@ -1,13 +0,0 @@ -# SPDX-License-Identifier: GPL-3.0-or-later - -# THIS IS NOT A COMPLETE Makefile -# IT IS INCLUDED BY ITS PARENT'S Makefile.am -# IT IS REQUIRED TO REFERENCE ALL FILES RELATIVE TO THE PARENT - -# install these files -dist_python_DATA += dns_query_time/dns_query_time.chart.py -dist_pythonconfig_DATA += dns_query_time/dns_query_time.conf - -# do not install these files, but include them in the distribution -dist_noinst_DATA += dns_query_time/README.md dns_query_time/Makefile.inc - diff --git a/collectors/python.d.plugin/dns_query_time/README.md b/collectors/python.d.plugin/dns_query_time/README.md deleted file mode 100644 index 365e22560..000000000 --- a/collectors/python.d.plugin/dns_query_time/README.md +++ /dev/null @@ -1,29 +0,0 @@ -<!-- -title: "DNS query RTT monitoring with Netdata" -custom_edit_url: https://github.com/netdata/netdata/edit/master/collectors/python.d.plugin/dns_query_time/README.md -sidebar_label: "DNS query RTT" ---> - -# DNS query RTT monitoring with Netdata - -Measures DNS query round trip time. - -**Requirement:** - -- `python-dnspython` package - -It produces one aggregate chart or one chart per DNS server, showing the query time. - -## Configuration - -Edit the `python.d/dns_query_time.conf` configuration file using `edit-config` from the Netdata [config -directory](/docs/configure/nodes.md), which is typically at `/etc/netdata`. - -```bash -cd /etc/netdata # Replace this path with your Netdata config directory, if different -sudo ./edit-config python.d/dns_query_time.conf -``` - ---- - - diff --git a/collectors/python.d.plugin/dns_query_time/dns_query_time.chart.py b/collectors/python.d.plugin/dns_query_time/dns_query_time.chart.py deleted file mode 100644 index 7e1cb32b3..000000000 --- a/collectors/python.d.plugin/dns_query_time/dns_query_time.chart.py +++ /dev/null @@ -1,149 +0,0 @@ -# -*- coding: utf-8 -*- -# Description: dns_query_time netdata python.d module -# Author: ilyam8 -# SPDX-License-Identifier: GPL-3.0-or-later - -from random import choice -from socket import getaddrinfo, gaierror -from threading import Thread - -try: - import dns.message - import dns.query - import dns.name - - DNS_PYTHON = True -except ImportError: - DNS_PYTHON = False - -try: - from queue import Queue -except ImportError: - from Queue import Queue - -from bases.FrameworkServices.SimpleService import SimpleService - -update_every = 5 - - -class Service(SimpleService): - def __init__(self, configuration=None, name=None): - SimpleService.__init__(self, configuration=configuration, name=name) - self.order = list() - self.definitions = dict() - self.timeout = self.configuration.get('response_timeout', 4) - self.aggregate = self.configuration.get('aggregate', True) - self.domains = self.configuration.get('domains') - self.server_list = self.configuration.get('dns_servers') - - def check(self): - if not DNS_PYTHON: - self.error("'python-dnspython' package is needed to use dns_query_time.chart.py") - return False - - self.timeout = self.timeout if isinstance(self.timeout, int) else 4 - - if not all([self.domains, self.server_list, - isinstance(self.server_list, str), isinstance(self.domains, str)]): - self.error("server_list and domain_list can't be empty") - return False - else: - self.domains, self.server_list = self.domains.split(), self.server_list.split() - - for ns in self.server_list: - if not check_ns(ns): - self.info('Bad NS: %s' % ns) - self.server_list.remove(ns) - if not self.server_list: - return False - - data = self._get_data(timeout=1) - - down_servers = [s for s in data if data[s] == -100] - for down in down_servers: - down = down[3:].replace('_', '.') - self.info('Removed due to non response %s' % down) - self.server_list.remove(down) - if not self.server_list: - return False - - self.order, self.definitions = create_charts(aggregate=self.aggregate, server_list=self.server_list) - return True - - def _get_data(self, timeout=None): - return dns_request(self.server_list, timeout or self.timeout, self.domains) - - -def dns_request(server_list, timeout, domains): - threads = list() - que = Queue() - result = dict() - - def dns_req(ns, t, q): - domain = dns.name.from_text(choice(domains)) - request = dns.message.make_query(domain, dns.rdatatype.A) - - try: - resp = dns.query.udp(request, ns, timeout=t) - if (resp.rcode() == dns.rcode.NOERROR and resp.answer): - query_time = resp.time * 1000 - else: - query_time = -100 - except dns.exception.Timeout: - query_time = -100 - finally: - q.put({'_'.join(['ns', ns.replace('.', '_')]): query_time}) - - for server in server_list: - th = Thread(target=dns_req, args=(server, timeout, que)) - th.start() - threads.append(th) - - for th in threads: - th.join() - result.update(que.get()) - - return result - - -def check_ns(ns): - try: - return getaddrinfo(ns, 'domain')[0][4][0] - except gaierror: - return False - - -def create_charts(aggregate, server_list): - if aggregate: - order = ['dns_group'] - definitions = { - 'dns_group': { - 'options': [None, 'DNS Response Time', 'ms', 'name servers', 'dns_query_time.response_time', 'line'], - 'lines': [] - } - } - for ns in server_list: - dim = [ - '_'.join(['ns', ns.replace('.', '_')]), - ns, - 'absolute', - ] - definitions['dns_group']['lines'].append(dim) - - return order, definitions - else: - order = [''.join(['dns_', ns.replace('.', '_')]) for ns in server_list] - definitions = dict() - - for ns in server_list: - definitions[''.join(['dns_', ns.replace('.', '_')])] = { - 'options': [None, 'DNS Response Time', 'ms', ns, 'dns_query_time.response_time', 'area'], - 'lines': [ - [ - '_'.join(['ns', ns.replace('.', '_')]), - ns, - 'absolute', - ] - ] - } - return order, definitions diff --git a/collectors/python.d.plugin/dns_query_time/dns_query_time.conf b/collectors/python.d.plugin/dns_query_time/dns_query_time.conf deleted file mode 100644 index 9c0838ee2..000000000 --- a/collectors/python.d.plugin/dns_query_time/dns_query_time.conf +++ /dev/null @@ -1,69 +0,0 @@ -# netdata python.d.plugin configuration for dns_query_time -# -# This file is in YaML format. Generally the format is: -# -# name: value -# -# There are 2 sections: -# - global variables -# - one or more JOBS -# -# JOBS allow you to collect values from multiple sources. -# Each source will have its own set of charts. -# -# JOB parameters have to be indented (using spaces only, example below). - -# ---------------------------------------------------------------------- -# Global Variables -# These variables set the defaults for all JOBs, however each JOB -# may define its own, overriding the defaults. - -# update_every sets the default data collection frequency. -# If unset, the python.d.plugin default is used. -# update_every: 1 - -# priority controls the order of charts at the netdata dashboard. -# Lower numbers move the charts towards the top of the page. -# If unset, the default for python.d.plugin is used. -# priority: 60000 - -# penalty indicates whether to apply penalty to update_every in case of failures. -# Penalty will increase every 5 failed updates in a row. Maximum penalty is 10 minutes. -# penalty: yes - -# autodetection_retry sets the job re-check interval in seconds. -# The job is not deleted if check fails. -# Attempts to start the job are made once every autodetection_retry. -# This feature is disabled by default. -# autodetection_retry: 0 - -# ---------------------------------------------------------------------- -# JOBS (data collection sources) -# -# The default JOBS share the same *name*. JOBS with the same name -# are mutually exclusive. Only one of them will be allowed running at -# any time. This allows autodetection to try several alternatives and -# pick the one that works. -# -# Any number of jobs is supported. -# -# All python.d.plugin JOBS (for all its modules) support a set of -# predefined parameters. These are: -# -# job_name: -# name: myname # the JOB's name as it will appear at the -# # dashboard (by default is the job_name) -# # JOBs sharing a name are mutually exclusive -# update_every: 1 # the JOB's data collection frequency -# priority: 60000 # the JOB's order on the dashboard -# penalty: yes # the JOB's penalty -# autodetection_retry: 0 # the JOB's re-check interval in seconds -# -# Additionally to the above, dns_query_time also supports the following: -# -# dns_servers: 'dns servers' # List of dns servers to query -# domains: 'domains' # List of domains -# aggregate: yes/no # Aggregate all servers in one chart or not -# response_timeout: 4 # Dns query response timeout (query = -100 if response time > response_time) -# -# ----------------------------------------------------------------------
\ No newline at end of file diff --git a/collectors/python.d.plugin/dnsdist/Makefile.inc b/collectors/python.d.plugin/dnsdist/Makefile.inc deleted file mode 100644 index a53f518f0..000000000 --- a/collectors/python.d.plugin/dnsdist/Makefile.inc +++ /dev/null @@ -1,13 +0,0 @@ -# SPDX-License-Identifier: GPL-3.0-or-later - -# THIS IS NOT A COMPLETE Makefile -# IT IS INCLUDED BY ITS PARENT'S Makefile.am -# IT IS REQUIRED TO REFERENCE ALL FILES RELATIVE TO THE PARENT - -# install these files -dist_python_DATA += dnsdist/dnsdist.chart.py -dist_pythonconfig_DATA += dnsdist/dnsdist.conf - -# do not install these files, but include them in the distribution -dist_noinst_DATA += dnsdist/README.md dnsdist/Makefile.inc - diff --git a/collectors/python.d.plugin/dnsdist/README.md b/collectors/python.d.plugin/dnsdist/README.md deleted file mode 100644 index 95b2efae0..000000000 --- a/collectors/python.d.plugin/dnsdist/README.md +++ /dev/null @@ -1,72 +0,0 @@ -<!-- -title: "PowerDNS dnsdist monitoring with Netdata" -custom_edit_url: https://github.com/netdata/netdata/edit/master/collectors/python.d.plugin/dnsdist/README.md -sidebar_label: "PowerDNS dnsdist" ---> - -# PowerDNS dnsdist monitoring with Netdata - -Collects load-balancer performance and health metrics, and draws the following charts: - -1. **Response latency** - - - latency-slow - - latency100-1000 - - latency50-100 - - latency10-50 - - latency1-10 - - latency0-1 - -2. **Cache performance** - - - cache-hits - - cache-misses - -3. **ACL events** - - - acl-drops - - rule-drop - - rule-nxdomain - - rule-refused - -4. **Noncompliant data** - - - empty-queries - - no-policy - - noncompliant-queries - - noncompliant-responses - -5. **Queries** - - - queries - - rdqueries - - rdqueries - -6. **Health** - - - downstream-send-errors - - downstream-timeouts - - servfail-responses - - trunc-failures - -## Configuration - -Edit the `python.d/dnsdist.conf` configuration file using `edit-config` from the Netdata [config -directory](/docs/configure/nodes.md), which is typically at `/etc/netdata`. - -```bash -cd /etc/netdata # Replace this path with your Netdata config directory, if different -sudo ./edit-config python.d/dnsdist.conf -``` - -```yaml -localhost: - name : 'local' - url : 'http://127.0.0.1:5053/jsonstat?command=stats' - user : 'username' - pass : 'password' - header: - X-API-Key: 'dnsdist-api-key' -``` - - diff --git a/collectors/python.d.plugin/dnsdist/dnsdist.chart.py b/collectors/python.d.plugin/dnsdist/dnsdist.chart.py deleted file mode 100644 index 7e947923f..000000000 --- a/collectors/python.d.plugin/dnsdist/dnsdist.chart.py +++ /dev/null @@ -1,131 +0,0 @@ -# -*- coding: utf-8 -*- -# SPDX-License-Identifier: GPL-3.0-or-later - -from json import loads - -from bases.FrameworkServices.UrlService import UrlService - -ORDER = [ - 'queries', - 'queries_dropped', - 'packets_dropped', - 'answers', - 'backend_responses', - 'backend_commerrors', - 'backend_errors', - 'cache', - 'servercpu', - 'servermem', - 'query_latency', - 'query_latency_avg' -] - -CHARTS = { - 'queries': { - 'options': [None, 'Client queries received', 'queries/s', 'queries', 'dnsdist.queries', 'line'], - 'lines': [ - ['queries', 'all', 'incremental'], - ['rdqueries', 'recursive', 'incremental'], - ['empty-queries', 'empty', 'incremental'] - ] - }, - 'queries_dropped': { - 'options': [None, 'Client queries dropped', 'queries/s', 'queries', 'dnsdist.queries_dropped', 'line'], - 'lines': [ - ['rule-drop', 'rule drop', 'incremental'], - ['dyn-blocked', 'dynamic block', 'incremental'], - ['no-policy', 'no policy', 'incremental'], - ['noncompliant-queries', 'non compliant', 'incremental'] - ] - }, - 'packets_dropped': { - 'options': [None, 'Packets dropped', 'packets/s', 'packets', 'dnsdist.packets_dropped', 'line'], - 'lines': [ - ['acl-drops', 'acl', 'incremental'] - ] - }, - 'answers': { - 'options': [None, 'Answers statistics', 'answers/s', 'answers', 'dnsdist.answers', 'line'], - 'lines': [ - ['self-answered', 'self answered', 'incremental'], - ['rule-nxdomain', 'nxdomain', 'incremental', -1], - ['rule-refused', 'refused', 'incremental', -1], - ['trunc-failures', 'trunc failures', 'incremental', -1] - ] - }, - 'backend_responses': { - 'options': [None, 'Backend responses', 'responses/s', 'backends', 'dnsdist.backend_responses', 'line'], - 'lines': [ - ['responses', 'responses', 'incremental'] - ] - }, - 'backend_commerrors': { - 'options': [None, 'Backend Communication Errors', 'errors/s', 'backends', 'dnsdist.backend_commerrors', 'line'], - 'lines': [ - ['downstream-send-errors', 'send errors', 'incremental'] - ] - }, - 'backend_errors': { - 'options': [None, 'Backend error responses', 'responses/s', 'backends', 'dnsdist.backend_errors', 'line'], - 'lines': [ - ['downstream-timeouts', 'timeout', 'incremental'], - ['servfail-responses', 'servfail', 'incremental'], - ['noncompliant-responses', 'non compliant', 'incremental'] - ] - }, - 'cache': { - 'options': [None, 'Cache performance', 'answers/s', 'cache', 'dnsdist.cache', 'area'], - 'lines': [ - ['cache-hits', 'hits', 'incremental'], - ['cache-misses', 'misses', 'incremental', -1] - ] - }, - 'servercpu': { - 'options': [None, 'DNSDIST server CPU utilization', 'ms/s', 'server', 'dnsdist.servercpu', 'stacked'], - 'lines': [ - ['cpu-sys-msec', 'system state', 'incremental'], - ['cpu-user-msec', 'user state', 'incremental'] - ] - }, - 'servermem': { - 'options': [None, 'DNSDIST server memory utilization', 'MiB', 'server', 'dnsdist.servermem', 'area'], - 'lines': [ - ['real-memory-usage', 'memory usage', 'absolute', 1, 1 << 20] - ] - }, - 'query_latency': { - 'options': [None, 'Query latency', 'queries/s', 'latency', 'dnsdist.query_latency', 'stacked'], - 'lines': [ - ['latency0-1', '1ms', 'incremental'], - ['latency1-10', '10ms', 'incremental'], - ['latency10-50', '50ms', 'incremental'], - ['latency50-100', '100ms', 'incremental'], - ['latency100-1000', '1sec', 'incremental'], - ['latency-slow', 'slow', 'incremental'] - ] - }, - 'query_latency_avg': { - 'options': [None, 'Average latency for the last N queries', 'microseconds', 'latency', - 'dnsdist.query_latency_avg', 'line'], - 'lines': [ - ['latency-avg100', '100', 'absolute'], - ['latency-avg1000', '1k', 'absolute'], - ['latency-avg10000', '10k', 'absolute'], - ['latency-avg1000000', '1000k', 'absolute'] - ] - } -} - - -class Service(UrlService): - def __init__(self, configuration=None, name=None): - UrlService.__init__(self, configuration=configuration, name=name) - self.order = ORDER - self.definitions = CHARTS - - def _get_data(self): - data = self._get_raw_data() - if not data: - return None - - return loads(data) diff --git a/collectors/python.d.plugin/dnsdist/dnsdist.conf b/collectors/python.d.plugin/dnsdist/dnsdist.conf deleted file mode 100644 index 324d65aaf..000000000 --- a/collectors/python.d.plugin/dnsdist/dnsdist.conf +++ /dev/null @@ -1,83 +0,0 @@ -# netdata python.d.plugin configuration for dnsdist -# -# This file is in YaML format. Generally the format is: -# -# name: value -# -# There are 2 sections: -# - global variables -# - one or more JOBS -# -# JOBS allow you to collect values from multiple sources. -# Each source will have its own set of charts. -# -# JOB parameters have to be indented (using spaces only, example below). - -# ---------------------------------------------------------------------- -# Global Variables -# These variables set the defaults for all JOBs, however each JOB -# may define its own, overriding the defaults. - -# update_every sets the default data collection frequency. -# If unset, the python.d.plugin default is used. -#update_every: 1 - -# priority controls the order of charts at the netdata dashboard. -# Lower numbers move the charts towards the top of the page. -# If unset, the default for python.d.plugin is used. -# priority: 60000 - -# penalty indicates whether to apply penalty to update_every in case of failures. -# Penalty will increase every 5 failed updates in a row. Maximum penalty is 10 minutes. -# penalty: yes - -# autodetection_retry sets the job re-check interval in seconds. -# The job is not deleted if check fails. -# Attempts to start the job are made once every autodetection_retry. -# This feature is disabled by default. -#autodetection_retry: 1 - -# ---------------------------------------------------------------------- -# JOBS (data collection sources) -# -# The default JOBS share the same *name*. JOBS with the same name -# are mutually exclusive. Only one of them will be allowed running at -# any time. This allows autodetection to try several alternatives and -# pick the one that works. -# -# Any number of jobs is supported. -# -# All python.d.plugin JOBS (for all its modules) support a set of -# predefined parameters. These are: -# -# job_name: -# name: myname # the JOB's name as it will appear at the -# # dashboard (by default is the job_name) -# # JOBs sharing a name are mutually exclusive -# update_every: 1 # the JOB's data collection frequency -# priority: 60000 # the JOB's order on the dashboard -# penalty: yes # the JOB's penalty -# autodetection_retry: 0 # the JOB's re-check interval in seconds -# -# -# Additionally to the above, dnsdist also supports the following: -# -# url: 'URL' # the URL to fetch dnsdist performance statistics -# user: 'username' # username for basic auth -# pass: 'password' # password for basic auth -# header: -# X-API-Key: 'Key' # API key -# -# ---------------------------------------------------------------------- -# AUTO-DETECTION JOBS -# only one of them will run (they have the same name) - -# localhost: -# name : 'local' -# url : 'http://127.0.0.1:5053/jsonstat?command=stats' -# user : 'username' -# pass : 'password' -# header: -# X-API-Key: 'dnsdist-api-key' - - diff --git a/collectors/python.d.plugin/elasticsearch/Makefile.inc b/collectors/python.d.plugin/elasticsearch/Makefile.inc deleted file mode 100644 index 15c63c2fa..000000000 --- a/collectors/python.d.plugin/elasticsearch/Makefile.inc +++ /dev/null @@ -1,13 +0,0 @@ -# SPDX-License-Identifier: GPL-3.0-or-later - -# THIS IS NOT A COMPLETE Makefile -# IT IS INCLUDED BY ITS PARENT'S Makefile.am -# IT IS REQUIRED TO REFERENCE ALL FILES RELATIVE TO THE PARENT - -# install these files -dist_python_DATA += elasticsearch/elasticsearch.chart.py -dist_pythonconfig_DATA += elasticsearch/elasticsearch.conf - -# do not install these files, but include them in the distribution -dist_noinst_DATA += elasticsearch/README.md elasticsearch/Makefile.inc - diff --git a/collectors/python.d.plugin/elasticsearch/README.md b/collectors/python.d.plugin/elasticsearch/README.md deleted file mode 100644 index a98eddf51..000000000 --- a/collectors/python.d.plugin/elasticsearch/README.md +++ /dev/null @@ -1,94 +0,0 @@ -<!-- -title: "Elasticsearch monitoring with Netdata" -custom_edit_url: https://github.com/netdata/netdata/edit/master/collectors/python.d.plugin/elasticsearch/README.md -sidebar_label: "Elasticsearch" ---> - -# Elasticsearch monitoring with Netdata - -Monitors [Elasticsearch](https://www.elastic.co/products/elasticsearch) performance and health metrics. - -It produces: - -1. **Search performance** charts: - - - Number of queries, fetches - - Time spent on queries, fetches - - Query and fetch latency - -2. **Indexing performance** charts: - - - Number of documents indexed, index refreshes, flushes - - Time spent on indexing, refreshing, flushing - - Indexing and flushing latency - -3. **Memory usage and garbage collection** charts: - - - JVM heap currently in use, committed - - Count of garbage collections - - Time spent on garbage collections - -4. **Host metrics** charts: - - - Available file descriptors in percent - - Opened HTTP connections - - Cluster communication transport metrics - -5. **Queues and rejections** charts: - - - Number of queued/rejected threads in thread pool - -6. **Fielddata cache** charts: - - - Fielddata cache size - - Fielddata evictions and circuit breaker tripped count - -7. **Cluster health API** charts: - - - Cluster status - - Nodes and tasks statistics - - Shards statistics - -8. **Cluster stats API** charts: - - - Nodes statistics - - Query cache statistics - - Docs statistics - - Store statistics - - Indices and shards statistics - -9. **Indices** charts (per index statistics, disabled by default): - - - Docs count - - Store size - - Num of replicas - - Health status - -## Configuration - -Edit the `python.d/elasticsearch.conf` configuration file using `edit-config` from the Netdata [config -directory](/docs/configure/nodes.md), which is typically at `/etc/netdata`. - -```bash -cd /etc/netdata # Replace this path with your Netdata config directory, if different -sudo ./edit-config python.d/elasticsearch.conf -``` - -Sample: - -```yaml -local: - host : 'ipaddress' # Elasticsearch server ip address or hostname. - port : 'port' # Port on which elasticsearch listens. - scheme : 'http' # URL scheme. Use 'https' if your elasticsearch uses TLS. - node_status : yes/no # Get metrics from "/_nodes/_local/stats". Enabled by default. - cluster_health : yes/no # Get metrics from "/_cluster/health". Enabled by default. - cluster_stats : yes/no # Get metrics from "'/_cluster/stats". Enabled by default. - indices_stats : yes/no # Get metrics from "/_cat/indices". Disabled by default. -``` - -If no configuration is given, module will try to connect to `http://127.0.0.1:9200`. - ---- - - diff --git a/collectors/python.d.plugin/elasticsearch/elasticsearch.chart.py b/collectors/python.d.plugin/elasticsearch/elasticsearch.chart.py deleted file mode 100644 index 93614b08c..000000000 --- a/collectors/python.d.plugin/elasticsearch/elasticsearch.chart.py +++ /dev/null @@ -1,808 +0,0 @@ -# -*- coding: utf-8 -*- -# Description: elastic search node stats netdata python.d module -# Author: ilyam8 -# SPDX-License-Identifier: GPL-3.0-or-later - -import json -import threading - -from collections import namedtuple -from socket import gethostbyname, gaierror - -try: - from queue import Queue -except ImportError: - from Queue import Queue - -from bases.FrameworkServices.UrlService import UrlService - -# default module values (can be overridden per job in `config`) -update_every = 5 - -METHODS = namedtuple('METHODS', ['get_data', 'url', 'run']) - -NODE_STATS = [ - 'indices.search.fetch_current', - 'indices.search.fetch_total', - 'indices.search.query_current', - 'indices.search.query_total', - 'indices.search.query_time_in_millis', - 'indices.search.fetch_time_in_millis', - 'indices.indexing.index_total', - 'indices.indexing.index_current', - 'indices.indexing.index_time_in_millis', - 'indices.refresh.total', - 'indices.refresh.total_time_in_millis', - 'indices.flush.total', - 'indices.flush.total_time_in_millis', - 'indices.translog.operations', - 'indices.translog.size_in_bytes', - 'indices.translog.uncommitted_operations', - 'indices.translog.uncommitted_size_in_bytes', - 'indices.segments.count', - 'indices.segments.terms_memory_in_bytes', - 'indices.segments.stored_fields_memory_in_bytes', - 'indices.segments.term_vectors_memory_in_bytes', - 'indices.segments.norms_memory_in_bytes', - 'indices.segments.points_memory_in_bytes', - 'indices.segments.doc_values_memory_in_bytes', - 'indices.segments.index_writer_memory_in_bytes', - 'indices.segments.version_map_memory_in_bytes', - 'indices.segments.fixed_bit_set_memory_in_bytes', - 'jvm.gc.collectors.young.collection_count', - 'jvm.gc.collectors.old.collection_count', - 'jvm.gc.collectors.young.collection_time_in_millis', - 'jvm.gc.collectors.old.collection_time_in_millis', - 'jvm.mem.heap_used_percent', - 'jvm.mem.heap_used_in_bytes', - 'jvm.mem.heap_committed_in_bytes', - 'jvm.buffer_pools.direct.count', - 'jvm.buffer_pools.direct.used_in_bytes', - 'jvm.buffer_pools.direct.total_capacity_in_bytes', - 'jvm.buffer_pools.mapped.count', - 'jvm.buffer_pools.mapped.used_in_bytes', - 'jvm.buffer_pools.mapped.total_capacity_in_bytes', - 'thread_pool.bulk.queue', - 'thread_pool.bulk.rejected', - 'thread_pool.write.queue', - 'thread_pool.write.rejected', - 'thread_pool.index.queue', - 'thread_pool.index.rejected', - 'thread_pool.search.queue', - 'thread_pool.search.rejected', - 'thread_pool.merge.queue', - 'thread_pool.merge.rejected', - 'indices.fielddata.memory_size_in_bytes', - 'indices.fielddata.evictions', - 'breakers.fielddata.tripped', - 'http.current_open', - 'transport.rx_size_in_bytes', - 'transport.tx_size_in_bytes', - 'process.max_file_descriptors', - 'process.open_file_descriptors' -] - -CLUSTER_STATS = [ - 'nodes.count.data', - 'nodes.count.master', - 'nodes.count.total', - 'nodes.count.coordinating_only', - 'nodes.count.ingest', - 'indices.docs.count', - 'indices.query_cache.hit_count', - 'indices.query_cache.miss_count', - 'indices.store.size_in_bytes', - 'indices.count', - 'indices.shards.total' -] - -HEALTH_STATS = [ - 'number_of_nodes', - 'number_of_data_nodes', - 'number_of_pending_tasks', - 'number_of_in_flight_fetch', - 'active_shards', - 'relocating_shards', - 'unassigned_shards', - 'delayed_unassigned_shards', - 'initializing_shards', - 'active_shards_percent_as_number' -] - -LATENCY = { - 'query_latency': { - 'total': 'indices_search_query_total', - 'spent_time': 'indices_search_query_time_in_millis' - }, - 'fetch_latency': { - 'total': 'indices_search_fetch_total', - 'spent_time': 'indices_search_fetch_time_in_millis' - }, - 'indexing_latency': { - 'total': 'indices_indexing_index_total', - 'spent_time': 'indices_indexing_index_time_in_millis' - }, - 'flushing_latency': { - 'total': 'indices_flush_total', - 'spent_time': 'indices_flush_total_time_in_millis' - } -} - -# charts order (can be overridden if you want less charts, or different order) -ORDER = [ - 'search_performance_total', - 'search_performance_current', - 'search_performance_time', - 'search_latency', - 'index_performance_total', - 'index_performance_current', - 'index_performance_time', - 'index_latency', - 'index_translog_operations', - 'index_translog_size', - 'index_segments_count', - 'index_segments_memory_writer', - 'index_segments_memory', - 'jvm_mem_heap', - 'jvm_mem_heap_bytes', - 'jvm_buffer_pool_count', - 'jvm_direct_buffers_memory', - 'jvm_mapped_buffers_memory', - 'jvm_gc_count', - 'jvm_gc_time', - 'host_metrics_file_descriptors', - 'host_metrics_http', - 'host_metrics_transport', - 'thread_pool_queued', - 'thread_pool_rejected', - 'fielddata_cache', - 'fielddata_evictions_tripped', - 'cluster_health_status', - 'cluster_health_nodes', - 'cluster_health_pending_tasks', - 'cluster_health_flight_fetch', - 'cluster_health_shards', - 'cluster_stats_nodes', - 'cluster_stats_query_cache', - 'cluster_stats_docs', - 'cluster_stats_store', - 'cluster_stats_indices', - 'cluster_stats_shards_total', - 'index_docs_count', - 'index_store_size', - 'index_replica', - 'index_health', -] - -CHARTS = { - 'search_performance_total': { - 'options': [None, 'Queries And Fetches', 'events/s', 'search performance', - 'elastic.search_performance_total', 'stacked'], - 'lines': [ - ['indices_search_query_total', 'queries', 'incremental'], - ['indices_search_fetch_total', 'fetches', 'incremental'] - ] - }, - 'search_performance_current': { - 'options': [None, 'Queries and Fetches In Progress', 'events', 'search performance', - 'elastic.search_performance_current', 'stacked'], - 'lines': [ - ['indices_search_query_current', 'queries', 'absolute'], - ['indices_search_fetch_current', 'fetches', 'absolute'] - ] - }, - 'search_performance_time': { - 'options': [None, 'Time Spent On Queries And Fetches', 'seconds', 'search performance', - 'elastic.search_performance_time', 'stacked'], - 'lines': [ - ['indices_search_query_time_in_millis', 'query', 'incremental', 1, 1000], - ['indices_search_fetch_time_in_millis', 'fetch', 'incremental', 1, 1000] - ] - }, - 'search_latency': { - 'options': [None, 'Query And Fetch Latency', 'milliseconds', 'search performance', 'elastic.search_latency', - 'stacked'], - 'lines': [ - ['query_latency', 'query', 'absolute', 1, 1000], - ['fetch_latency', 'fetch', 'absolute', 1, 1000] - ] - }, - 'index_performance_total': { - 'options': [None, 'Indexed Documents, Index Refreshes, Index Flushes To Disk', 'events/s', - 'indexing performance', 'elastic.index_performance_total', 'stacked'], - 'lines': [ - ['indices_indexing_index_total', 'indexed', 'incremental'], - ['indices_refresh_total', 'refreshes', 'incremental'], - ['indices_flush_total', 'flushes', 'incremental'] - ] - }, - 'index_performance_current': { - 'options': [None, 'Number Of Documents Currently Being Indexed', 'currently indexed', - 'indexing performance', 'elastic.index_performance_current', 'stacked'], - 'lines': [ - ['indices_indexing_index_current', 'documents', 'absolute'] - ] - }, - 'index_performance_time': { - 'options': [None, 'Time Spent On Indexing, Refreshing, Flushing', 'seconds', 'indexing performance', - 'elastic.index_performance_time', 'stacked'], - 'lines': [ - ['indices_indexing_index_time_in_millis', 'indexing', 'incremental', 1, 1000], - ['indices_refresh_total_time_in_millis', 'refreshing', 'incremental', 1, 1000], - ['indices_flush_total_time_in_millis', 'flushing', 'incremental', 1, 1000] - ] - }, - 'index_latency': { - 'options': [None, 'Indexing And Flushing Latency', 'milliseconds', 'indexing performance', - 'elastic.index_latency', 'stacked'], - 'lines': [ - ['indexing_latency', 'indexing', 'absolute', 1, 1000], - ['flushing_latency', 'flushing', 'absolute', 1, 1000] - ] - }, - 'index_translog_operations': { - 'options': [None, 'Translog Operations', 'operations', 'translog', - 'elastic.index_translog_operations', 'area'], - 'lines': [ - ['indices_translog_operations', 'total', 'absolute'], - ['indices_translog_uncommitted_operations', 'uncommitted', 'absolute'] - ] - }, - 'index_translog_size': { - 'options': [None, 'Translog Size', 'MiB', 'translog', - 'elastic.index_translog_size', 'area'], - 'lines': [ - ['indices_translog_size_in_bytes', 'total', 'absolute', 1, 1048567], - ['indices_translog_uncommitted_size_in_bytes', 'uncommitted', 'absolute', 1, 1048567] - ] - }, - 'index_segments_count': { - 'options': [None, 'Total Number Of Indices Segments', 'segments', 'indices segments', - 'elastic.index_segments_count', 'line'], - 'lines': [ - ['indices_segments_count', 'segments', 'absolute'] - ] - }, - 'index_segments_memory_writer': { - 'options': [None, 'Index Writer Memory Usage', 'MiB', 'indices segments', - 'elastic.index_segments_memory_writer', 'area'], - 'lines': [ - ['indices_segments_index_writer_memory_in_bytes', 'total', 'absolute', 1, 1048567] - ] - }, - 'index_segments_memory': { - 'options': [None, 'Indices Segments Memory Usage', 'MiB', 'indices segments', - 'elastic.index_segments_memory', 'stacked'], - 'lines': [ - ['indices_segments_terms_memory_in_bytes', 'terms', 'absolute', 1, 1048567], - ['indices_segments_stored_fields_memory_in_bytes', 'stored fields', 'absolute', 1, 1048567], - ['indices_segments_term_vectors_memory_in_bytes', 'term vectors', 'absolute', 1, 1048567], - ['indices_segments_norms_memory_in_bytes', 'norms', 'absolute', 1, 1048567], - ['indices_segments_points_memory_in_bytes', 'points', 'absolute', 1, 1048567], - ['indices_segments_doc_values_memory_in_bytes', 'doc values', 'absolute', 1, 1048567], - ['indices_segments_version_map_memory_in_bytes', 'version map', 'absolute', 1, 1048567], - ['indices_segments_fixed_bit_set_memory_in_bytes', 'fixed bit set', 'absolute', 1, 1048567] - ] - }, - 'jvm_mem_heap': { - 'options': [None, 'JVM Heap Percentage Currently in Use', 'percentage', 'memory usage and gc', - 'elastic.jvm_heap', 'area'], - 'lines': [ - ['jvm_mem_heap_used_percent', 'inuse', 'absolute'] - ] - }, - 'jvm_mem_heap_bytes': { - 'options': [None, 'JVM Heap Commit And Usage', 'MiB', 'memory usage and gc', - 'elastic.jvm_heap_bytes', 'area'], - 'lines': [ - ['jvm_mem_heap_committed_in_bytes', 'committed', 'absolute', 1, 1048576], - ['jvm_mem_heap_used_in_bytes', 'used', 'absolute', 1, 1048576] - ] - }, - 'jvm_buffer_pool_count': { - 'options': [None, 'JVM Buffers', 'pools', 'memory usage and gc', - 'elastic.jvm_buffer_pool_count', 'line'], - 'lines': [ - ['jvm_buffer_pools_direct_count', 'direct', 'absolute'], - ['jvm_buffer_pools_mapped_count', 'mapped', 'absolute'] - ] - }, - 'jvm_direct_buffers_memory': { - 'options': [None, 'JVM Direct Buffers Memory', 'MiB', 'memory usage and gc', - 'elastic.jvm_direct_buffers_memory', 'area'], - 'lines': [ - ['jvm_buffer_pools_direct_used_in_bytes', 'used', 'absolute', 1, 1048567], - ['jvm_buffer_pools_direct_total_capacity_in_bytes', 'total capacity', 'absolute', 1, 1048567] - ] - }, - 'jvm_mapped_buffers_memory': { - 'options': [None, 'JVM Mapped Buffers Memory', 'MiB', 'memory usage and gc', - 'elastic.jvm_mapped_buffers_memory', 'area'], - 'lines': [ - ['jvm_buffer_pools_mapped_used_in_bytes', 'used', 'absolute', 1, 1048567], - ['jvm_buffer_pools_mapped_total_capacity_in_bytes', 'total capacity', 'absolute', 1, 1048567] - ] - }, - 'jvm_gc_count': { - 'options': [None, 'Garbage Collections', 'events/s', 'memory usage and gc', 'elastic.gc_count', 'stacked'], - 'lines': [ - ['jvm_gc_collectors_young_collection_count', 'young', 'incremental'], - ['jvm_gc_collectors_old_collection_count', 'old', 'incremental'] - ] - }, - 'jvm_gc_time': { - 'options': [None, 'Time Spent On Garbage Collections', 'milliseconds', 'memory usage and gc', - 'elastic.gc_time', 'stacked'], - 'lines': [ - ['jvm_gc_collectors_young_collection_time_in_millis', 'young', 'incremental'], - ['jvm_gc_collectors_old_collection_time_in_millis', 'old', 'incremental'] - ] - }, - 'thread_pool_queued': { - 'options': [None, 'Number Of Queued Threads In Thread Pool', 'queued threads', 'queues and rejections', - 'elastic.thread_pool_queued', 'stacked'], - 'lines': [ - ['thread_pool_bulk_queue', 'bulk', 'absolute'], - ['thread_pool_write_queue', 'write', 'absolute'], - ['thread_pool_index_queue', 'index', 'absolute'], - ['thread_pool_search_queue', 'search', 'absolute'], - ['thread_pool_merge_queue', 'merge', 'absolute'] - ] - }, - 'thread_pool_rejected': { - 'options': [None, 'Rejected Threads In Thread Pool', 'rejected threads', 'queues and rejections', - 'elastic.thread_pool_rejected', 'stacked'], - 'lines': [ - ['thread_pool_bulk_rejected', 'bulk', 'absolute'], - ['thread_pool_write_rejected', 'write', 'absolute'], - ['thread_pool_index_rejected', 'index', 'absolute'], - ['thread_pool_search_rejected', 'search', 'absolute'], - ['thread_pool_merge_rejected', 'merge', 'absolute'] - ] - }, - 'fielddata_cache': { - 'options': [None, 'Fielddata Cache', 'MiB', 'fielddata cache', 'elastic.fielddata_cache', 'line'], - 'lines': [ - ['indices_fielddata_memory_size_in_bytes', 'cache', 'absolute', 1, 1048576] - ] - }, - 'fielddata_evictions_tripped': { - 'options': [None, 'Fielddata Evictions And Circuit Breaker Tripped Count', 'events/s', - 'fielddata cache', 'elastic.fielddata_evictions_tripped', 'line'], - 'lines': [ - ['indices_fielddata_evictions', 'evictions', 'incremental'], - ['indices_fielddata_tripped', 'tripped', 'incremental'] - ] - }, - 'cluster_health_nodes': { - 'options': [None, 'Nodes Statistics', 'nodes', 'cluster health API', - 'elastic.cluster_health_nodes', 'area'], - 'lines': [ - ['number_of_nodes', 'nodes', 'absolute'], - ['number_of_data_nodes', 'data_nodes', 'absolute'], - ] - }, - 'cluster_health_pending_tasks': { - 'options': [None, 'Tasks Statistics', 'tasks', 'cluster health API', - 'elastic.cluster_health_pending_tasks', 'line'], - 'lines': [ - ['number_of_pending_tasks', 'pending_tasks', 'absolute'], - ] - }, - 'cluster_health_flight_fetch': { - 'options': [None, 'In Flight Fetches Statistics', 'fetches', 'cluster health API', - 'elastic.cluster_health_flight_fetch', 'line'], - 'lines': [ - ['number_of_in_flight_fetch', 'in_flight_fetch', 'absolute'] - ] - }, - 'cluster_health_status': { - 'options': [None, 'Cluster Status', 'status', 'cluster health API', - 'elastic.cluster_health_status', 'area'], - 'lines': [ - ['status_green', 'green', 'absolute'], - ['status_red', 'red', 'absolute'], - ['status_yellow', 'yellow', 'absolute'] - ] - }, - 'cluster_health_shards': { - 'options': [None, 'Shards Statistics', 'shards', 'cluster health API', - 'elastic.cluster_health_shards', 'stacked'], - 'lines': [ - ['active_shards', 'active_shards', 'absolute'], - ['relocating_shards', 'relocating_shards', 'absolute'], - ['unassigned_shards', 'unassigned', 'absolute'], - ['delayed_unassigned_shards', 'delayed_unassigned', 'absolute'], - ['initializing_shards', 'initializing', 'absolute'], - ['active_shards_percent_as_number', 'active_percent', 'absolute'] - ] - }, - 'cluster_stats_nodes': { - 'options': [None, 'Nodes Statistics', 'nodes', 'cluster stats API', - 'elastic.cluster_nodes', 'area'], - 'lines': [ - ['nodes_count_data', 'data', 'absolute'], - ['nodes_count_master', 'master', 'absolute'], - ['nodes_count_total', 'total', 'absolute'], - ['nodes_count_ingest', 'ingest', 'absolute'], - ['nodes_count_coordinating_only', 'coordinating_only', 'absolute'] - ] - }, - 'cluster_stats_query_cache': { - 'options': [None, 'Query Cache Statistics', 'queries', 'cluster stats API', - 'elastic.cluster_query_cache', 'stacked'], - 'lines': [ - ['indices_query_cache_hit_count', 'hit', 'incremental'], - ['indices_query_cache_miss_count', 'miss', 'incremental'] - ] - }, - 'cluster_stats_docs': { - 'options': [None, 'Docs Statistics', 'docs', 'cluster stats API', - 'elastic.cluster_docs', 'line'], - 'lines': [ - ['indices_docs_count', 'docs', 'absolute'] - ] - }, - 'cluster_stats_store': { - 'options': [None, 'Store Statistics', 'MiB', 'cluster stats API', - 'elastic.cluster_store', 'line'], - 'lines': [ - ['indices_store_size_in_bytes', 'size', 'absolute', 1, 1048567] - ] - }, - 'cluster_stats_indices': { - 'options': [None, 'Indices Statistics', 'indices', 'cluster stats API', - 'elastic.cluster_indices', 'line'], - 'lines': [ - ['indices_count', 'indices', 'absolute'], - ] - }, - 'cluster_stats_shards_total': { - 'options': [None, 'Total Shards Statistics', 'shards', 'cluster stats API', - 'elastic.cluster_shards_total', 'line'], - 'lines': [ - ['indices_shards_total', 'shards', 'absolute'] - ] - }, - 'host_metrics_transport': { - 'options': [None, 'Cluster Communication Transport Metrics', 'kilobit/s', 'host metrics', - 'elastic.host_transport', 'area'], - 'lines': [ - ['transport_rx_size_in_bytes', 'in', 'incremental', 8, 1000], - ['transport_tx_size_in_bytes', 'out', 'incremental', -8, 1000] - ] - }, - 'host_metrics_file_descriptors': { - 'options': [None, 'Available File Descriptors In Percent', 'percentage', 'host metrics', - 'elastic.host_descriptors', 'area'], - 'lines': [ - ['file_descriptors_used', 'used', 'absolute', 1, 10] - ] - }, - 'host_metrics_http': { - 'options': [None, 'Opened HTTP Connections', 'connections', 'host metrics', - 'elastic.host_http_connections', 'line'], - 'lines': [ - ['http_current_open', 'opened', 'absolute', 1, 1] - ] - }, - 'index_docs_count': { - 'options': [None, 'Docs Count', 'count', 'indices', 'elastic.index_docs', 'line'], - 'lines': [] - }, - 'index_store_size': { - 'options': [None, 'Store Size', 'bytes', 'indices', 'elastic.index_store_size', 'line'], - 'lines': [] - }, - 'index_replica': { - 'options': [None, 'Replica', 'count', 'indices', 'elastic.index_replica', 'line'], - 'lines': [] - }, - 'index_health': { - 'options': [None, 'Health', 'status', 'indices', 'elastic.index_health', 'line'], - 'lines': [] - }, -} - - -def convert_index_store_size_to_bytes(size): - # can be b, kb, mb, gb or None - if size is None: - return -1 - if size.endswith('kb'): - return round(float(size[:-2]) * 1024) - elif size.endswith('mb'): - return round(float(size[:-2]) * 1024 * 1024) - elif size.endswith('gb'): - return round(float(size[:-2]) * 1024 * 1024 * 1024) - elif size.endswith('tb'): - return round(float(size[:-2]) * 1024 * 1024 * 1024 * 1024) - elif size.endswith('b'): - return round(float(size[:-1])) - return -1 - - -def convert_index_null_value(value): - if value is None: - return -1 - return value - - -def convert_index_health(health): - if health == 'green': - return 0 - elif health == 'yellow': - return 1 - elif health == 'read': - return 2 - return -1 - - -def get_survive_any(method): - def w(*args): - try: - method(*args) - except Exception as error: - self, queue, url = args[0], args[1], args[2] - self.error("error during '{0}' : {1}".format(url, error)) - queue.put(dict()) - - return w - - -class Service(UrlService): - def __init__(self, configuration=None, name=None): - UrlService.__init__(self, configuration=configuration, name=name) - self.order = ORDER - self.definitions = CHARTS - self.host = self.configuration.get('host') - self.port = self.configuration.get('port', 9200) - self.url = '{scheme}://{host}:{port}'.format( - scheme=self.configuration.get('scheme', 'http'), - host=self.host, - port=self.port, - ) - self.latency = dict() - self.methods = list() - self.collected_indices = set() - - def check(self): - if not self.host: - self.error('Host is not defined in the module configuration file') - return False - - try: - self.host = gethostbyname(self.host) - except gaierror as error: - self.error(repr(error)) - return False - - self.methods = [ - METHODS( - get_data=self._get_node_stats, - url=self.url + '/_nodes/_local/stats', - run=self.configuration.get('node_stats', True), - ), - METHODS( - get_data=self._get_cluster_health, - url=self.url + '/_cluster/health', - run=self.configuration.get('cluster_health', True) - ), - METHODS( - get_data=self._get_cluster_stats, - url=self.url + '/_cluster/stats', - run=self.configuration.get('cluster_stats', True), - ), - METHODS( - get_data=self._get_indices, - url=self.url + '/_cat/indices?format=json', - run=self.configuration.get('indices_stats', False), - ), - ] - return UrlService.check(self) - - def _get_data(self): - threads = list() - queue = Queue() - result = dict() - - for method in self.methods: - if not method.run: - continue - th = threading.Thread( - target=method.get_data, - args=(queue, method.url), - ) - th.daemon = True - th.start() - threads.append(th) - - for thread in threads: - thread.join() - result.update(queue.get()) - - return result or None - - def add_index_to_charts(self, idx_name): - for name in ('index_docs_count', 'index_store_size', 'index_replica', 'index_health'): - chart = self.charts[name] - dim = ['{0}_{1}'.format(idx_name, name), idx_name] - chart.add_dimension(dim) - - @get_survive_any - def _get_indices(self, queue, url): - # [ - # { - # "pri.store.size": "650b", - # "health": "yellow", - # "status": "open", - # "index": "twitter", - # "pri": "5", - # "rep": "1", - # "docs.count": "10", - # "docs.deleted": "3", - # "store.size": "650b" - # }, - # { - # "status":"open", - # "index":".kibana_3", - # "health":"red", - # "uuid":"umAdNrq6QaOXrmZjAowTNw", - # "store.size":null, - # "pri.store.size":null, - # "docs.count":null, - # "rep":"0", - # "pri":"1", - # "docs.deleted":null - # }, - # { - # "health" : "green", - # "status" : "close", - # "index" : "siem-events-2021.09.12", - # "uuid" : "mTQ-Yl5TS7S3lGoRORE-Pg", - # "pri" : "4", - # "rep" : "0", - # "docs.count" : null, - # "docs.deleted" : null, - # "store.size" : null, - # "pri.store.size" : null - # } - # ] - raw_data = self._get_raw_data(url) - if not raw_data: - return queue.put(dict()) - - indices = self.json_parse(raw_data) - if not indices: - return queue.put(dict()) - - charts_initialized = len(self.charts) != 0 - data = dict() - for idx in indices: - try: - name = idx['index'] - is_system_index = name.startswith('.') - if is_system_index: - continue - - v = { - '{0}_index_replica'.format(name): idx['rep'], - '{0}_index_health'.format(name): convert_index_health(idx['health']), - } - docs_count = convert_index_null_value(idx['docs.count']) - if docs_count != -1: - v['{0}_index_docs_count'.format(name)] = idx['docs.count'] - size = convert_index_store_size_to_bytes(idx['store.size']) - if size != -1: - v['{0}_index_store_size'.format(name)] = size - except KeyError as error: - self.debug("error on parsing index : {0}".format(repr(error))) - continue - - data.update(v) - if name not in self.collected_indices and charts_initialized: - self.collected_indices.add(name) - self.add_index_to_charts(name) - - return queue.put(data) - - @get_survive_any - def _get_cluster_health(self, queue, url): - raw = self._get_raw_data(url) - if not raw: - return queue.put(dict()) - - parsed = self.json_parse(raw) - if not parsed: - return queue.put(dict()) - - data = fetch_data(raw_data=parsed, metrics=HEALTH_STATS) - dummy = { - 'status_green': 0, - 'status_red': 0, - 'status_yellow': 0, - } - data.update(dummy) - current_status = 'status_' + parsed['status'] - data[current_status] = 1 - - return queue.put(data) - - @get_survive_any - def _get_cluster_stats(self, queue, url): - raw = self._get_raw_data(url) - if not raw: - return queue.put(dict()) - - parsed = self.json_parse(raw) - if not parsed: - return queue.put(dict()) - - data = fetch_data(raw_data=parsed, metrics=CLUSTER_STATS) - - return queue.put(data) - - @get_survive_any - def _get_node_stats(self, queue, url): - raw = self._get_raw_data(url) - if not raw: - return queue.put(dict()) - - parsed = self.json_parse(raw) - if not parsed: - return queue.put(dict()) - - node = list(parsed['nodes'].keys())[0] - data = fetch_data(raw_data=parsed['nodes'][node], metrics=NODE_STATS) - - # Search, index, flush, fetch performance latency - for key in LATENCY: - try: - data[key] = self.find_avg( - total=data[LATENCY[key]['total']], - spent_time=data[LATENCY[key]['spent_time']], - key=key) - except KeyError: - continue - if 'process_open_file_descriptors' in data and 'process_max_file_descriptors' in data: - v = float(data['process_open_file_descriptors']) / data['process_max_file_descriptors'] * 1000 - data['file_descriptors_used'] = round(v) - - return queue.put(data) - - def json_parse(self, reply): - try: - return json.loads(reply) - except ValueError as err: - self.error(err) - return None - - def find_avg(self, total, spent_time, key): - if key not in self.latency: - self.latency[key] = dict(total=total, spent_time=spent_time) - return 0 - - if self.latency[key]['total'] != total: - spent_diff = spent_time - self.latency[key]['spent_time'] - total_diff = total - self.latency[key]['total'] - latency = float(spent_diff) / float(total_diff) * 1000 - self.latency[key]['total'] = total - self.latency[key]['spent_time'] = spent_time - return latency - - self.latency[key]['spent_time'] = spent_time - return 0 - - -def fetch_data(raw_data, metrics): - data = dict() - for metric in metrics: - value = raw_data - metrics_list = metric.split('.') - try: - for m in metrics_list: - value = value[m] - except (KeyError, TypeError): - continue - data['_'.join(metrics_list)] = value - return data diff --git a/collectors/python.d.plugin/elasticsearch/elasticsearch.conf b/collectors/python.d.plugin/elasticsearch/elasticsearch.conf deleted file mode 100644 index 4058debac..000000000 --- a/collectors/python.d.plugin/elasticsearch/elasticsearch.conf +++ /dev/null @@ -1,83 +0,0 @@ -# netdata python.d.plugin configuration for elasticsearch stats -# -# This file is in YaML format. Generally the format is: -# -# name: value -# -# There are 2 sections: -# - global variables -# - one or more JOBS -# -# JOBS allow you to collect values from multiple sources. -# Each source will have its own set of charts. -# -# JOB parameters have to be indented (using spaces only, example below). - -# ---------------------------------------------------------------------- -# Global Variables -# These variables set the defaults for all JOBs, however each JOB -# may define its own, overriding the defaults. - -# update_every sets the default data collection frequency. -# If unset, the python.d.plugin default is used. -# update_every: 1 - -# priority controls the order of charts at the netdata dashboard. -# Lower numbers move the charts towards the top of the page. -# If unset, the default for python.d.plugin is used. -# priority: 60000 - -# penalty indicates whether to apply penalty to update_every in case of failures. -# Penalty will increase every 5 failed updates in a row. Maximum penalty is 10 minutes. -# penalty: yes - -# autodetection_retry sets the job re-check interval in seconds. -# The job is not deleted if check fails. -# Attempts to start the job are made once every autodetection_retry. -# This feature is disabled by default. -# autodetection_retry: 0 - -# ---------------------------------------------------------------------- -# JOBS (data collection sources) -# -# The default JOBS share the same *name*. JOBS with the same name -# are mutually exclusive. Only one of them will be allowed running at -# any time. This allows autodetection to try several alternatives and -# pick the one that works. -# -# Any number of jobs is supported. -# -# All python.d.plugin JOBS (for all its modules) support a set of -# predefined parameters. These are: -# -# job_name: -# name: myname # the JOB's name as it will appear at the -# # dashboard (by default is the job_name) -# # JOBs sharing a name are mutually exclusive -# update_every: 1 # the JOB's data collection frequency -# priority: 60000 # the JOB's order on the dashboard -# penalty: yes # the JOB's penalty -# autodetection_retry: 0 # the JOB's re-check interval in seconds -# -# Additionally to the above, elasticsearch plugin also supports the following: -# -# host : 'ipaddress' # Elasticsearch server ip address or hostname. -# port : 'port' # Port on which elasticsearch listens. -# node_status : yes/no # Get metrics from "/_nodes/_local/stats". Enabled by default. -# cluster_health : yes/no # Get metrics from "/_cluster/health". Enabled by default. -# cluster_stats : yes/no # Get metrics from "'/_cluster/stats". Enabled by default. -# indices_stats : yes/no # Get metrics from "/_cat/indices". Disabled by default. -# -# -# if the URL is password protected, the following are supported: -# -# user: 'username' -# pass: 'password' -# -# ---------------------------------------------------------------------- -# AUTO-DETECTION JOBS -# only one of them will run (they have the same name) -# -local: - host: '127.0.0.1' - port: '9200' diff --git a/collectors/python.d.plugin/energid/Makefile.inc b/collectors/python.d.plugin/energid/Makefile.inc deleted file mode 100644 index 44a209d01..000000000 --- a/collectors/python.d.plugin/energid/Makefile.inc +++ /dev/null @@ -1,13 +0,0 @@ -# SPDX-License-Identifier: GPL-3.0-or-later - -# THIS IS NOT A COMPLETE Makefile -# IT IS INCLUDED BY ITS PARENT'S Makefile.am -# IT IS REQUIRED TO REFERENCE ALL FILES RELATIVE TO THE PARENT - -# install these files -dist_python_DATA += energid/energid.chart.py -dist_pythonconfig_DATA += energid/energid.conf - -# do not install these files, but include them in the distribution -dist_noinst_DATA += energid/README.md energid/Makefile.inc - diff --git a/collectors/python.d.plugin/energid/README.md b/collectors/python.d.plugin/energid/README.md deleted file mode 100644 index 73e39ae14..000000000 --- a/collectors/python.d.plugin/energid/README.md +++ /dev/null @@ -1,77 +0,0 @@ -<!-- -title: "Energi Core node monitoring with Netdata" -custom_edit_url: https://github.com/netdata/netdata/edit/master/collectors/python.d.plugin/energid/README.md -sidebar_label: "Energi Core" ---> - -# Energi Core node monitoring with Netdata - -Monitors blockchain, memory, network and unspent transactions statistics. - - -As [Energi Core](https://github.com/energicryptocurrency/energi) Gen 1 & 2 are based on the original Bitcoin code and -supports very similar JSON RPC, there is quite high chance the module works -with many others forks including bitcoind itself. - -Introduces several new charts: - -1. **Blockchain Index** - - blocks - - headers - -2. **Blockchain Difficulty** - - diff - -3. **MemPool** in MiB - - Max - - Usage - - TX Size - -4. **Secure Memory** in KiB - - Total - - Locked - - Used - -5. **Network** - - Connections - -6. **UTXO** (Unspent Transaction Output) - - UTXO - - Xfers (related transactions) - -Configuration is needed in most cases of secure deployment to specify RPC -credentials. However, Energi, Bitcoin and Dash daemons are checked on -startup by default. - -It may be desired to increase retry count for production use due to possibly -long daemon startup. - -## Configuration - -Edit the `python.d/energid.conf` configuration file using `edit-config` from the Netdata [config -directory](/docs/configure/nodes.md), which is typically at `/etc/netdata`. - -```bash -cd /etc/netdata # Replace this path with your Netdata config directory, if different -sudo ./edit-config python.d/energid.conf -``` - -Sample: - -```yaml -energi: - host: '127.0.0.1' - port: 9796 - user: energi - pass: energi - -bitcoin: - host: '127.0.0.1' - port: 8332 - user: bitcoin - pass: bitcoin -``` - ---- - - diff --git a/collectors/python.d.plugin/energid/energid.chart.py b/collectors/python.d.plugin/energid/energid.chart.py deleted file mode 100644 index 079c32dc8..000000000 --- a/collectors/python.d.plugin/energid/energid.chart.py +++ /dev/null @@ -1,163 +0,0 @@ -# -*- coding: utf-8 -*- -# Description: Energi Core / Bitcoin netdata python.d module -# Author: Andrey Galkin <andrey@futoin.org> (andvgal) -# SPDX-License-Identifier: GPL-3.0-or-later -# -# This module is designed for energid, but it should work with many other Bitcoin forks -# which support more or less standard JSON-RPC. -# - -import json - -from bases.FrameworkServices.UrlService import UrlService - -update_every = 5 - -ORDER = [ - 'blockindex', - 'difficulty', - 'mempool', - 'secmem', - 'network', - 'timeoffset', - 'utxo', - 'xfers', -] - -CHARTS = { - 'blockindex': { - 'options': [None, 'Blockchain Index', 'count', 'blockchain', 'energi.blockindex', 'area'], - 'lines': [ - ['blockchain_blocks', 'blocks', 'absolute'], - ['blockchain_headers', 'headers', 'absolute'], - ] - }, - 'difficulty': { - 'options': [None, 'Blockchain Difficulty', 'difficulty', 'blockchain', 'energi.difficulty', 'line'], - 'lines': [ - ['blockchain_difficulty', 'Diff', 'absolute'], - ], - }, - 'mempool': { - 'options': [None, 'MemPool', 'MiB', 'memory', 'energid.mempool', 'area'], - 'lines': [ - ['mempool_max', 'Max', 'absolute', None, 1024 * 1024], - ['mempool_current', 'Usage', 'absolute', None, 1024 * 1024], - ['mempool_txsize', 'TX Size', 'absolute', None, 1024 * 1024], - ], - }, - 'secmem': { - 'options': [None, 'Secure Memory', 'KiB', 'memory', 'energid.secmem', 'area'], - 'lines': [ - ['secmem_total', 'Total', 'absolute', None, 1024], - ['secmem_locked', 'Locked', 'absolute', None, 1024], - ['secmem_used', 'Used', 'absolute', None, 1024], - ], - }, - 'network': { - 'options': [None, 'Network', 'count', 'network', 'energid.network', 'line'], - 'lines': [ - ['network_connections', 'Connections', 'absolute'], - ], - }, - 'timeoffset': { - 'options': [None, 'Network', 'seconds', 'network', 'energid.timeoffset', 'line'], - 'lines': [ - ['network_timeoffset', 'offseet', 'absolute'], - ], - }, - 'utxo': { - 'options': [None, 'UTXO', 'count', 'UTXO', 'energid.utxo', 'line'], - 'lines': [ - ['utxo_count', 'UTXO', 'absolute'], - ], - }, - 'xfers': { - 'options': [None, 'UTXO', 'count', 'UTXO', 'energid.xfers', 'line'], - 'lines': [ - ['utxo_xfers', 'Xfers', 'absolute'], - ], - }, -} - -METHODS = { - 'getblockchaininfo': lambda r: { - 'blockchain_blocks': r['blocks'], - 'blockchain_headers': r['headers'], - 'blockchain_difficulty': r['difficulty'], - }, - 'getmempoolinfo': lambda r: { - 'mempool_txcount': r['size'], - 'mempool_txsize': r['bytes'], - 'mempool_current': r['usage'], - 'mempool_max': r['maxmempool'], - }, - 'getmemoryinfo': lambda r: dict([ - ('secmem_' + k, v) for (k, v) in r['locked'].items() - ]), - 'getnetworkinfo': lambda r: { - 'network_timeoffset': r['timeoffset'], - 'network_connections': r['connections'], - }, - 'gettxoutsetinfo': lambda r: { - 'utxo_count': r['txouts'], - 'utxo_xfers': r['transactions'], - 'utxo_size': r['disk_size'], - 'utxo_amount': r['total_amount'], - }, -} - -JSON_RPC_VERSION = '1.1' - - -class Service(UrlService): - def __init__(self, configuration=None, name=None): - UrlService.__init__(self, configuration=configuration, name=name) - self.order = ORDER - self.definitions = CHARTS - self.host = self.configuration.get('host', '127.0.0.1') - self.port = self.configuration.get('port', 9796) - self.url = '{scheme}://{host}:{port}'.format( - scheme=self.configuration.get('scheme', 'http'), - host=self.host, - port=self.port, - ) - self.method = 'POST' - self.header = { - 'Content-Type': 'application/json', - } - - def _get_data(self): - # - # Bitcoin family speak JSON-RPC version 1.0 for maximum compatibility, - # but uses JSON-RPC 1.1/2.0 standards for parts of the 1.0 standard that were - # unspecified (HTTP errors and contents of 'error'). - # - # 1.0 spec: https://www.jsonrpc.org/specification_v1 - # 2.0 spec: https://www.jsonrpc.org/specification - # - # The call documentation: https://github.com/energicryptocurrency/core-api-documentation - # - batch = [] - - for i, method in enumerate(METHODS): - batch.append({ - 'version': JSON_RPC_VERSION, - 'id': i, - 'method': method, - 'params': [], - }) - - result = self._get_raw_data(body=json.dumps(batch)) - - if not result: - return None - - result = json.loads(result.decode('utf-8')) - data = dict() - - for i, (_, handler) in enumerate(METHODS.items()): - r = result[i] - data.update(handler(r['result'])) - - return data diff --git a/collectors/python.d.plugin/energid/energid.conf b/collectors/python.d.plugin/energid/energid.conf deleted file mode 100644 index 3b13841fb..000000000 --- a/collectors/python.d.plugin/energid/energid.conf +++ /dev/null @@ -1,90 +0,0 @@ -# netdata python.d.plugin configuration for energid -# -# This file is in YaML format. Generally the format is: -# -# name: value -# -# There are 2 sections: -# - global variables -# - one or more JOBS -# -# JOBS allow you to collect values from multiple sources. -# Each source will have its own set of charts. -# -# JOB parameters have to be indented (using spaces only, example below). - -# ---------------------------------------------------------------------- -# Global Variables -# These variables set the defaults for all JOBs, however each JOB -# may define its own, overriding the defaults. - -# update_every sets the default data collection frequency. -# If unset, the python.d.plugin default is used. -# update_every: 1 - -# priority controls the order of charts at the netdata dashboard. -# Lower numbers move the charts towards the top of the page. -# If unset, the default for python.d.plugin is used. -# priority: 60000 - -# penalty indicates whether to apply penalty to update_every in case of failures. -# Penalty will increase every 5 failed updates in a row. Maximum penalty is 10 minutes. -# penalty: yes - -# autodetection_retry sets the job re-check interval in seconds. -# The job is not deleted if check fails. -# Attempts to start the job are made once every autodetection_retry. -# This feature is disabled by default. -# autodetection_retry: 0 - -# ---------------------------------------------------------------------- -# JOBS (data collection sources) -# -# The default JOBS share the same *name*. JOBS with the same name -# are mutually exclusive. Only one of them will be allowed running at -# any time. This allows autodetection to try several alternatives and -# pick the one that works. -# -# Any number of jobs is supported. -# -# All python.d.plugin JOBS (for all its modules) support a set of -# predefined parameters. These are: -# -# job_name: -# name: myname # the JOB's name as it will appear at the -# # dashboard (by default is the job_name) -# # JOBs sharing a name are mutually exclusive -# update_every: 1 # the JOB's data collection frequency -# priority: 60000 # the JOB's order on the dashboard -# penalty: yes # the JOB's penalty -# autodetection_retry: 0 # the JOB's re-check interval in seconds -# -# Additionally to the above, energid also supports the following: -# -# host: 'IP or HOSTNAME' # type <str> the RPC host to connect to -# port: PORT # type <int> the RPC port to connect to -# user: 'RPC username' # type <str> the RPC username to use -# pass: 'RPC password' # type <str> the RPC password to use -# -# ---------------------------------------------------------------------- -# AUTO-DETECTION JOBS -# only one of them will run (they have the same name) -# - -# Defaults: -# host: '127.0.0.1' -# user: -# pass: -# - -# Energi mainnet -energi: - port: 9796 - -# Most likely supported Bitcoin mainnet -bitcoin: - port: 8332 - -# Most likely supported Dash mainnet -dash: - port: 9998 diff --git a/collectors/python.d.plugin/freeradius/Makefile.inc b/collectors/python.d.plugin/freeradius/Makefile.inc deleted file mode 100644 index 54aa6492f..000000000 --- a/collectors/python.d.plugin/freeradius/Makefile.inc +++ /dev/null @@ -1,13 +0,0 @@ -# SPDX-License-Identifier: GPL-3.0-or-later - -# THIS IS NOT A COMPLETE Makefile -# IT IS INCLUDED BY ITS PARENT'S Makefile.am -# IT IS REQUIRED TO REFERENCE ALL FILES RELATIVE TO THE PARENT - -# install these files -dist_python_DATA += freeradius/freeradius.chart.py -dist_pythonconfig_DATA += freeradius/freeradius.conf - -# do not install these files, but include them in the distribution -dist_noinst_DATA += freeradius/README.md freeradius/Makefile.inc - diff --git a/collectors/python.d.plugin/freeradius/README.md b/collectors/python.d.plugin/freeradius/README.md deleted file mode 100644 index d5ec464b5..000000000 --- a/collectors/python.d.plugin/freeradius/README.md +++ /dev/null @@ -1,90 +0,0 @@ -<!-- -title: "FreeRADIUS monitoring with Netdata" -custom_edit_url: https://github.com/netdata/netdata/edit/master/collectors/python.d.plugin/freeradius/README.md -sidebar_label: "FreeRADIUS" ---> - -# FreeRADIUS monitoring with Netdata - -Uses the `radclient` command to provide freeradius statistics. It is not recommended to run it every second. - -It produces: - -1. **Authentication counters:** - - - access-accepts - - access-rejects - - auth-dropped-requests - - auth-duplicate-requests - - auth-invalid-requests - - auth-malformed-requests - - auth-unknown-types - -2. **Accounting counters:** [optional] - - - accounting-requests - - accounting-responses - - acct-dropped-requests - - acct-duplicate-requests - - acct-invalid-requests - - acct-malformed-requests - - acct-unknown-types - -3. **Proxy authentication counters:** [optional] - - - proxy-access-accepts - - proxy-access-rejects - - proxy-auth-dropped-requests - - proxy-auth-duplicate-requests - - proxy-auth-invalid-requests - - proxy-auth-malformed-requests - - proxy-auth-unknown-types - -4. **Proxy accounting counters:** [optional] - - - proxy-accounting-requests - - proxy-accounting-responses - - proxy-acct-dropped-requests - - proxy-acct-duplicate-requests - - proxy-acct-invalid-requests - - proxy-acct-malformed-requests - - proxy-acct-unknown-typesa - -## Configuration - -Edit the `python.d/freeradius.conf` configuration file using `edit-config` from the Netdata [config -directory](/docs/configure/nodes.md), which is typically at `/etc/netdata`. - -```bash -cd /etc/netdata # Replace this path with your Netdata config directory, if different -sudo ./edit-config python.d/freeradius.conf -``` - -Sample: - -```yaml -local: - host : 'localhost' - port : '18121' - secret : 'adminsecret' - acct : False # Freeradius accounting statistics. - proxy_auth : False # Freeradius proxy authentication statistics. - proxy_acct : False # Freeradius proxy accounting statistics. -``` - -**Freeradius server configuration:** - -The configuration for the status server is automatically created in the sites-available directory. -By default, server is enabled and can be queried from every client. -FreeRADIUS will only respond to status-server messages, if the status-server virtual server has been enabled. - -To do this, create a link from the sites-enabled directory to the status file in the sites-available directory: - -- cd sites-enabled -- ln -s ../sites-available/status status - -and restart/reload your FREERADIUS server. - ---- - - diff --git a/collectors/python.d.plugin/freeradius/freeradius.chart.py b/collectors/python.d.plugin/freeradius/freeradius.chart.py deleted file mode 100644 index 161d57e07..000000000 --- a/collectors/python.d.plugin/freeradius/freeradius.chart.py +++ /dev/null @@ -1,177 +0,0 @@ -# -*- coding: utf-8 -*- -# Description: freeradius netdata python.d module -# Author: ilyam8 -# SPDX-License-Identifier: GPL-3.0-or-later - -import re -from subprocess import Popen, PIPE - -from bases.FrameworkServices.SimpleService import SimpleService -from bases.collection import find_binary - -update_every = 15 - -PARSER = re.compile(r'((?<=-)[AP][a-zA-Z-]+) = (\d+)') - -RADIUS_MSG = 'Message-Authenticator = 0x00, FreeRADIUS-Statistics-Type = 15, Response-Packet-Type = Access-Accept' - -RADCLIENT_RETRIES = 1 -RADCLIENT_TIMEOUT = 1 - -DEFAULT_HOST = 'localhost' -DEFAULT_PORT = 18121 -DEFAULT_DO_ACCT = False -DEFAULT_DO_PROXY_AUTH = False -DEFAULT_DO_PROXY_ACCT = False - -ORDER = [ - 'authentication', - 'accounting', - 'proxy-auth', - 'proxy-acct', -] - -CHARTS = { - 'authentication': { - 'options': [None, 'Authentication', 'packets/s', 'authentication', 'freerad.auth', 'line'], - 'lines': [ - ['access-accepts', None, 'incremental'], - ['access-rejects', None, 'incremental'], - ['auth-dropped-requests', 'dropped-requests', 'incremental'], - ['auth-duplicate-requests', 'duplicate-requests', 'incremental'], - ['auth-invalid-requests', 'invalid-requests', 'incremental'], - ['auth-malformed-requests', 'malformed-requests', 'incremental'], - ['auth-unknown-types', 'unknown-types', 'incremental'] - ] - }, - 'accounting': { - 'options': [None, 'Accounting', 'packets/s', 'accounting', 'freerad.acct', 'line'], - 'lines': [ - ['accounting-requests', 'requests', 'incremental'], - ['accounting-responses', 'responses', 'incremental'], - ['acct-dropped-requests', 'dropped-requests', 'incremental'], - ['acct-duplicate-requests', 'duplicate-requests', 'incremental'], - ['acct-invalid-requests', 'invalid-requests', 'incremental'], - ['acct-malformed-requests', 'malformed-requests', 'incremental'], - ['acct-unknown-types', 'unknown-types', 'incremental'] - ] - }, - 'proxy-auth': { - 'options': [None, 'Proxy Authentication', 'packets/s', 'authentication', 'freerad.proxy.auth', 'line'], - 'lines': [ - ['proxy-access-accepts', 'access-accepts', 'incremental'], - ['proxy-access-rejects', 'access-rejects', 'incremental'], - ['proxy-auth-dropped-requests', 'dropped-requests', 'incremental'], - ['proxy-auth-duplicate-requests', 'duplicate-requests', 'incremental'], - ['proxy-auth-invalid-requests', 'invalid-requests', 'incremental'], - ['proxy-auth-malformed-requests', 'malformed-requests', 'incremental'], - ['proxy-auth-unknown-types', 'unknown-types', 'incremental'] - ] - }, - 'proxy-acct': { - 'options': [None, 'Proxy Accounting', 'packets/s', 'accounting', 'freerad.proxy.acct', 'line'], - 'lines': [ - ['proxy-accounting-requests', 'requests', 'incremental'], - ['proxy-accounting-responses', 'responses', 'incremental'], - ['proxy-acct-dropped-requests', 'dropped-requests', 'incremental'], - ['proxy-acct-duplicate-requests', 'duplicate-requests', 'incremental'], - ['proxy-acct-invalid-requests', 'invalid-requests', 'incremental'], - ['proxy-acct-malformed-requests', 'malformed-requests', 'incremental'], - ['proxy-acct-unknown-types', 'unknown-types', 'incremental'] - ] - } -} - - -def radclient_status(radclient, retries, timeout, host, port, secret): - # radclient -r 1 -t 1 -x 127.0.0.1:18121 status secret - - return '{radclient} -r {num_retries} -t {timeout} -x {host}:{port} status {secret}'.format( - radclient=radclient, - num_retries=retries, - timeout=timeout, - host=host, - port=port, - secret=secret, - ).split() - - -class Service(SimpleService): - def __init__(self, configuration=None, name=None): - SimpleService.__init__(self, configuration=configuration, name=name) - self.order = ORDER - self.definitions = CHARTS - self.host = self.configuration.get('host', DEFAULT_HOST) - self.port = self.configuration.get('port', DEFAULT_PORT) - self.secret = self.configuration.get('secret') - self.do_acct = self.configuration.get('acct', DEFAULT_DO_ACCT) - self.do_proxy_auth = self.configuration.get('proxy_auth', DEFAULT_DO_PROXY_AUTH) - self.do_proxy_acct = self.configuration.get('proxy_acct', DEFAULT_DO_PROXY_ACCT) - self.echo = find_binary('echo') - self.radclient = find_binary('radclient') - self.sub_echo = [self.echo, RADIUS_MSG] - self.sub_radclient = radclient_status( - self.radclient, RADCLIENT_RETRIES, RADCLIENT_TIMEOUT, self.host, self.port, self.secret, - ) - - def check(self): - if not self.radclient: - self.error("Can't locate 'radclient' binary or binary is not executable by netdata user") - return False - - if not self.echo: - self.error("Can't locate 'echo' binary or binary is not executable by netdata user") - return None - - if not self.secret: - self.error("'secret' isn't set") - return None - - if not self.get_raw_data(): - self.error('Request returned no data. Is server alive?') - return False - - if not self.do_acct: - self.order.remove('accounting') - - if not self.do_proxy_auth: - self.order.remove('proxy-auth') - - if not self.do_proxy_acct: - self.order.remove('proxy-acct') - - return True - - def get_data(self): - """ - Format data received from shell command - :return: dict - """ - result = self.get_raw_data() - - if not result: - return None - - return dict( - (key.lower(), value) for key, value in PARSER.findall(result) - ) - - def get_raw_data(self): - """ - The following code is equivalent to - 'echo "Message-Authenticator = 0x00, FreeRADIUS-Statistics-Type = 15, Response-Packet-Type = Access-Accept" - | radclient -t 1 -r 1 host:port status secret' - :return: str - """ - try: - process_echo = Popen(self.sub_echo, stdout=PIPE, stderr=PIPE, shell=False) - process_rad = Popen(self.sub_radclient, stdin=process_echo.stdout, stdout=PIPE, stderr=PIPE, shell=False) - process_echo.stdout.close() - raw_result = process_rad.communicate()[0] - except OSError: - return None - - if process_rad.returncode is 0: - return raw_result.decode() - - return None diff --git a/collectors/python.d.plugin/freeradius/freeradius.conf b/collectors/python.d.plugin/freeradius/freeradius.conf deleted file mode 100644 index 74b273776..000000000 --- a/collectors/python.d.plugin/freeradius/freeradius.conf +++ /dev/null @@ -1,80 +0,0 @@ -# netdata python.d.plugin configuration for freeradius -# -# This file is in YaML format. Generally the format is: -# -# name: value -# -# There are 2 sections: -# - global variables -# - one or more JOBS -# -# JOBS allow you to collect values from multiple sources. -# Each source will have its own set of charts. -# -# JOB parameters have to be indented (using spaces only, example below). - -# ---------------------------------------------------------------------- -# Global Variables -# These variables set the defaults for all JOBs, however each JOB -# may define its own, overriding the defaults. - -# update_every sets the default data collection frequency. -# If unset, the python.d.plugin default is used. -# update_every: 1 - -# priority controls the order of charts at the netdata dashboard. -# Lower numbers move the charts towards the top of the page. -# If unset, the default for python.d.plugin is used. -# priority: 60000 - -# penalty indicates whether to apply penalty to update_every in case of failures. -# Penalty will increase every 5 failed updates in a row. Maximum penalty is 10 minutes. -# penalty: yes - -# autodetection_retry sets the job re-check interval in seconds. -# The job is not deleted if check fails. -# Attempts to start the job are made once every autodetection_retry. -# This feature is disabled by default. -# autodetection_retry: 0 - -# ---------------------------------------------------------------------- -# JOBS (data collection sources) -# -# The default JOBS share the same *name*. JOBS with the same name -# are mutually exclusive. Only one of them will be allowed running at -# any time. This allows autodetection to try several alternatives and -# pick the one that works. -# -# Any number of jobs is supported. -# -# All python.d.plugin JOBS (for all its modules) support a set of -# predefined parameters. These are: -# -# job_name: -# name: myname # the JOB's name as it will appear at the -# # dashboard (by default is the job_name) -# # JOBs sharing a name are mutually exclusive -# update_every: 1 # the JOB's data collection frequency -# priority: 60000 # the JOB's order on the dashboard -# penalty: yes # the JOB's penalty -# autodetection_retry: 0 # the JOB's re-check interval in seconds -# -# Additionally to the above, freeradius also supports the following: -# -# host: 'host' # Default: 'localhost'. Server ip address or hostname. -# port: 'port' # Default: '18121'. Port on which freeradius server listen (type = status). -# secret: 'secret' # Default: 'adminsecret'. -# acct: yes/no # Default: no. Freeradius accounting statistics. -# proxy_auth: yes/no # Default: no. Freeradius proxy authentication statistics. -# proxy_acct: yes/no # Default: no. Freeradius proxy accounting statistics. -# -# ------------------------------------------------------------------------------------------------------------------ -# Freeradius server configuration: -# The configuration for the status server is automatically created in the sites-available directory. -# By default, server is enabled and can be queried from every client. -# FreeRADIUS will only respond to status-server messages, if the status-server virtual server has been enabled. -# To do this, create a link from the sites-enabled directory to the status file in the sites-available directory: -# cd sites-enabled -# ln -s ../sites-available/status status -# and restart/reload your FREERADIUS server. -# ------------------------------------------------------------------------------------------------------------------ diff --git a/collectors/python.d.plugin/httpcheck/Makefile.inc b/collectors/python.d.plugin/httpcheck/Makefile.inc deleted file mode 100644 index 4a5bd856d..000000000 --- a/collectors/python.d.plugin/httpcheck/Makefile.inc +++ /dev/null @@ -1,13 +0,0 @@ -# SPDX-License-Identifier: GPL-3.0-or-later - -# THIS IS NOT A COMPLETE Makefile -# IT IS INCLUDED BY ITS PARENT'S Makefile.am -# IT IS REQUIRED TO REFERENCE ALL FILES RELATIVE TO THE PARENT - -# install these files -dist_python_DATA += httpcheck/httpcheck.chart.py -dist_pythonconfig_DATA += httpcheck/httpcheck.conf - -# do not install these files, but include them in the distribution -dist_noinst_DATA += httpcheck/README.md httpcheck/Makefile.inc - diff --git a/collectors/python.d.plugin/httpcheck/README.md b/collectors/python.d.plugin/httpcheck/README.md deleted file mode 100644 index 101b96e3e..000000000 --- a/collectors/python.d.plugin/httpcheck/README.md +++ /dev/null @@ -1,59 +0,0 @@ -<!-- -title: "HTTP endpoint monitoring with Netdata" -custom_edit_url: https://github.com/netdata/netdata/edit/master/collectors/python.d.plugin/httpcheck/README.md -sidebar_label: "HTTP endpoints" ---> - -# HTTP endpoint monitoring with Netdata - -Monitors remote http server for availability and response time. - -Following charts are drawn per job: - -1. **Response time** ms - - - Time in 0.1 ms resolution in which the server responds. - If the connection failed, the value is missing. - -2. **Status** boolean - - - Connection successful - - Unexpected content: No Regex match found in the response - - Unexpected status code: Do we get 500 errors? - - Connection failed: port not listening or blocked - - Connection timed out: host or port unreachable - -## Configuration - -Edit the [`python.d/httpcheck.conf`](https://github.com/netdata/netdata/blob/master/collectors/python.d.plugin/httpcheck/httpcheck.conf) configuration file using `edit-config` from the Netdata [config -directory](/docs/configure/nodes.md), which is typically at `/etc/netdata`. - -```bash -cd /etc/netdata # Replace this path with your Netdata config directory, if different -sudo ./edit-config python.d/httpcheck.conf -``` - -Sample configuration and their default values. - -```yaml -server: - url: 'http://host:port/path' # required - status_accepted: # optional - - 200 - timeout: 1 # optional, supports decimals (e.g. 0.2) - update_every: 3 # optional - regex: 'REGULAR_EXPRESSION' # optional, see https://docs.python.org/3/howto/regex.html - redirect: yes # optional -``` - -### Notes - -- The status chart is primarily intended for alarms, badges or for access via API. -- A system/service/firewall might block Netdata's access if a portscan or - similar is detected. -- This plugin is meant for simple use cases. Currently, the accuracy of the - response time is low and should be used as reference only. - ---- - - diff --git a/collectors/python.d.plugin/httpcheck/httpcheck.chart.py b/collectors/python.d.plugin/httpcheck/httpcheck.chart.py deleted file mode 100644 index 75718bb60..000000000 --- a/collectors/python.d.plugin/httpcheck/httpcheck.chart.py +++ /dev/null @@ -1,125 +0,0 @@ -# -*- coding: utf-8 -*- -# Description: http check netdata python.d module -# Original Author: ccremer (github.com/ccremer) -# SPDX-License-Identifier: GPL-3.0-or-later - -import re - -import urllib3 - -try: - from time import monotonic as time -except ImportError: - from time import time - -from bases.FrameworkServices.UrlService import UrlService - -# default module values (can be overridden per job in `config`) -update_every = 3 -priority = 60000 - -# Response -HTTP_RESPONSE_TIME = 'time' -HTTP_RESPONSE_LENGTH = 'length' - -# Status dimensions -HTTP_SUCCESS = 'success' -HTTP_BAD_CONTENT = 'bad_content' -HTTP_BAD_STATUS = 'bad_status' -HTTP_TIMEOUT = 'timeout' -HTTP_NO_CONNECTION = 'no_connection' - -ORDER = [ - 'response_time', - 'response_length', - 'status', -] - -CHARTS = { - 'response_time': { - 'options': [None, 'HTTP response time', 'milliseconds', 'response', 'httpcheck.responsetime', 'line'], - 'lines': [ - [HTTP_RESPONSE_TIME, 'time', 'absolute', 100, 1000] - ] - }, - 'response_length': { - 'options': [None, 'HTTP response body length', 'characters', 'response', 'httpcheck.responselength', 'line'], - 'lines': [ - [HTTP_RESPONSE_LENGTH, 'length', 'absolute'] - ] - }, - 'status': { - 'options': [None, 'HTTP status', 'boolean', 'status', 'httpcheck.status', 'line'], - 'lines': [ - [HTTP_SUCCESS, 'success', 'absolute'], - [HTTP_BAD_CONTENT, 'bad content', 'absolute'], - [HTTP_BAD_STATUS, 'bad status', 'absolute'], - [HTTP_TIMEOUT, 'timeout', 'absolute'], - [HTTP_NO_CONNECTION, 'no connection', 'absolute'] - ] - } -} - - -class Service(UrlService): - def __init__(self, configuration=None, name=None): - UrlService.__init__(self, configuration=configuration, name=name) - self.order = ORDER - self.definitions = CHARTS - pattern = self.configuration.get('regex') - self.regex = re.compile(pattern) if pattern else None - self.status_codes_accepted = self.configuration.get('status_accepted', [200]) - self.follow_redirect = self.configuration.get('redirect', True) - - def _get_data(self): - """ - Format data received from http request - :return: dict - """ - data = dict() - data[HTTP_SUCCESS] = 0 - data[HTTP_BAD_CONTENT] = 0 - data[HTTP_BAD_STATUS] = 0 - data[HTTP_TIMEOUT] = 0 - data[HTTP_NO_CONNECTION] = 0 - url = self.url - try: - start = time() - status, content = self._get_raw_data_with_status(retries=1 if self.follow_redirect else False, - redirect=self.follow_redirect) - diff = time() - start - data[HTTP_RESPONSE_TIME] = max(round(diff * 10000), 0) - self.debug('Url: {url}. Host responded with status code {code} in {diff} s'.format( - url=url, code=status, diff=diff - )) - self.process_response(content, data, status) - - except urllib3.exceptions.NewConnectionError as error: - self.debug('Connection failed: {url}. Error: {error}'.format(url=url, error=error)) - data[HTTP_NO_CONNECTION] = 1 - - except (urllib3.exceptions.TimeoutError, urllib3.exceptions.PoolError) as error: - self.debug('Connection timed out: {url}. Error: {error}'.format(url=url, error=error)) - data[HTTP_TIMEOUT] = 1 - - except urllib3.exceptions.HTTPError as error: - self.debug('Connection failed: {url}. Error: {error}'.format(url=url, error=error)) - data[HTTP_NO_CONNECTION] = 1 - - except (TypeError, AttributeError) as error: - self.error('Url: {url}. Error: {error}'.format(url=url, error=error)) - return None - - return data - - def process_response(self, content, data, status): - data[HTTP_RESPONSE_LENGTH] = len(content) - self.debug('Content: \n\n{content}\n'.format(content=content)) - if status in self.status_codes_accepted: - if self.regex and self.regex.search(content) is None: - self.debug('No match for regex "{regex}" found'.format(regex=self.regex.pattern)) - data[HTTP_BAD_CONTENT] = 1 - else: - data[HTTP_SUCCESS] = 1 - else: - data[HTTP_BAD_STATUS] = 1 diff --git a/collectors/python.d.plugin/httpcheck/httpcheck.conf b/collectors/python.d.plugin/httpcheck/httpcheck.conf deleted file mode 100644 index 3f33bf65c..000000000 --- a/collectors/python.d.plugin/httpcheck/httpcheck.conf +++ /dev/null @@ -1,107 +0,0 @@ -# netdata python.d.plugin configuration for httpcheck -# -# This file is in YaML format. Generally the format is: -# -# name: value -# -# There are 2 sections: -# - global variables -# - one or more JOBS -# -# JOBS allow you to collect values from multiple sources. -# Each source will have its own set of charts. -# -# JOB parameters have to be indented (using spaces only, example below). - -# ---------------------------------------------------------------------- -# Global Variables -# These variables set the defaults for all JOBs, however each JOB -# may define its own, overriding the defaults. - -# update_every sets the default data collection frequency. -# If unset, the httpcheck default is used, which is at 3 seconds. -# update_every: 1 - -# priority controls the order of charts at the netdata dashboard. -# Lower numbers move the charts towards the top of the page. -# If unset, the default for python.d.plugin is used. -# priority: 60000 - -# penalty indicates whether to apply penalty to update_every in case of failures. -# Penalty will increase every 5 failed updates in a row. Maximum penalty is 10 minutes. -# penalty: yes - -# chart_cleanup sets the default chart cleanup interval in iterations. -# A chart is marked as obsolete if it has not been updated -# 'chart_cleanup' iterations in a row. -# They will be hidden immediately (not offered to dashboard viewer, -# streamed upstream and archived to external databases) and deleted one hour -# later (configurable from netdata.conf). -# -- For this plugin, cleanup MUST be disabled, otherwise we lose response -# time charts -chart_cleanup: 0 - -# Autodetection and retries do not work for this plugin - -# ---------------------------------------------------------------------- -# JOBS (data collection sources) -# -# The default JOBS share the same *name*. JOBS with the same name -# are mutually exclusive. Only one of them will be allowed running at -# any time. This allows autodetection to try several alternatives and -# pick the one that works. -# -# Any number of jobs is supported. -# -# ------------------------------- -# ATTENTION: Any valid configuration will be accepted, even if initial connection fails! -# ------------------------------- -# -# There is intentionally no default config, e.g. for 'localhost' - -# job_name: -# name: myname # [optional] the JOB's name as it will appear at the -# # dashboard (by default is the job_name) -# # JOBs sharing a name are mutually exclusive -# update_every: 3 # [optional] the JOB's data collection frequency -# priority: 60000 # [optional] the JOB's order on the dashboard -# penalty: yes # the JOB's penalty -# timeout: 1 # [optional] the timeout when connecting, supports decimals (e.g. 0.5s) -# url: 'http[s]://host-ip-or-dns[:port][path]' -# # [required] the remote host url to connect to. If [:port] is missing, it defaults to 80 -# # for HTTP and 443 for HTTPS. [path] is optional too, defaults to / -# header: {'Content-Type': 'application/json'} -# # [optional] the HTTP header sent with the request. -# method: GET # [optional] the HTTP request method (POST, PUT, DELETE, HEAD etc.) -# redirect: yes # [optional] If the remote host returns 3xx status codes, the redirection url will be -# # followed (default). -# body: {'key': 'value'} # [optional] the body sent with the request (e.g. POST, PUT, PATCH). -# status_accepted: # [optional] By default, 200 is accepted. Anything else will result in 'bad status' in the -# # status chart, however: The response time will still be > 0, since the -# # host responded with something. -# # If redirect is enabled, the accepted status will be checked against the redirected page. -# - 200 # Multiple status codes are possible. If you specify 'status_accepted', you would still -# # need to add '200'. E.g. 'status_accepted: [301]' will trigger an error in 'bad status' -# # if code is 200. Do specify numerical entries such as 200, not 'OK'. -# regex: None # [optional] If the status code is accepted, the content of the response will be searched for this -# # regex (if defined). Be aware that you may need to escape the regex string. If redirect is enabled, -# # the regex will be matched to the redirected page, not the initial 3xx response. - -# Simple example: -# -# jira: -# url: 'https://jira.localdomain/' - - -# Complex example: -# -# cool_website: -# url: 'http://cool.website:8080/home' -# status_accepted: -# - 200 -# - 204 -# regex: <title>My cool website!<\/title> -# timeout: 2 - -# This plugin is intended for simple cases. Currently, the accuracy of the response time is low and should be used as reference only. - diff --git a/collectors/python.d.plugin/isc_dhcpd/Makefile.inc b/collectors/python.d.plugin/isc_dhcpd/Makefile.inc deleted file mode 100644 index 44343fc9d..000000000 --- a/collectors/python.d.plugin/isc_dhcpd/Makefile.inc +++ /dev/null @@ -1,13 +0,0 @@ -# SPDX-License-Identifier: GPL-3.0-or-later - -# THIS IS NOT A COMPLETE Makefile -# IT IS INCLUDED BY ITS PARENT'S Makefile.am -# IT IS REQUIRED TO REFERENCE ALL FILES RELATIVE TO THE PARENT - -# install these files -dist_python_DATA += isc_dhcpd/isc_dhcpd.chart.py -dist_pythonconfig_DATA += isc_dhcpd/isc_dhcpd.conf - -# do not install these files, but include them in the distribution -dist_noinst_DATA += isc_dhcpd/README.md isc_dhcpd/Makefile.inc - diff --git a/collectors/python.d.plugin/isc_dhcpd/README.md b/collectors/python.d.plugin/isc_dhcpd/README.md deleted file mode 100644 index 712943d99..000000000 --- a/collectors/python.d.plugin/isc_dhcpd/README.md +++ /dev/null @@ -1,57 +0,0 @@ -<!-- -title: "ISC DHCP monitoring with Netdata" -custom_edit_url: https://github.com/netdata/netdata/edit/master/collectors/python.d.plugin/isc_dhcpd/README.md -sidebar_label: "ISC DHCP" ---> - -# ISC DHCP monitoring with Netdata - -Monitors the leases database to show all active leases for given pools. - -## Requirements - -- dhcpd leases file MUST BE readable by Netdata -- pools MUST BE in CIDR format -- `python-ipaddress` package is needed in Python2 - -It produces: - -1. **Pools utilization** Aggregate chart for all pools. - - - utilization in percent - -2. **Total leases** - - - leases (overall number of leases for all pools) - -3. **Active leases** for every pools - - - leases (number of active leases in pool) - -## Configuration - -Edit the `python.d/isc_dhcpd.conf` configuration file using `edit-config` from the Netdata [config -directory](/docs/configure/nodes.md), which is typically at `/etc/netdata`. - -```bash -cd /etc/netdata # Replace this path with your Netdata config directory, if different -sudo ./edit-config python.d/isc_dhcpd.conf -``` - -Sample: - -```yaml -local: - leases_path: '/var/lib/dhcp/dhcpd.leases' - pools: - office: '192.168.2.0/24' # name(dimension): pool in CIDR format - wifi: '192.168.3.10-192.168.3.20' # name(dimension): pool in IP Range format - 192.168.4.0/24: '192.168.4.0/24' # name(dimension): pool in CIDR format - wifi-guest: '192.168.5.0/24 192.168.6.10-192.168.6.20' # name(dimension): pool in CIDR + IP Range format -``` - -The module will not work If no configuration is given. - ---- - - diff --git a/collectors/python.d.plugin/isc_dhcpd/isc_dhcpd.chart.py b/collectors/python.d.plugin/isc_dhcpd/isc_dhcpd.chart.py deleted file mode 100644 index 099c7d4e9..000000000 --- a/collectors/python.d.plugin/isc_dhcpd/isc_dhcpd.chart.py +++ /dev/null @@ -1,269 +0,0 @@ -# -*- coding: utf-8 -*- -# Description: isc dhcpd lease netdata python.d module -# Author: ilyam8 -# SPDX-License-Identifier: GPL-3.0-or-later - -import os -import re -import time - -try: - import ipaddress - - HAVE_IP_ADDRESS = True -except ImportError: - HAVE_IP_ADDRESS = False - -from collections import defaultdict -from copy import deepcopy - -from bases.FrameworkServices.SimpleService import SimpleService - -ORDER = [ - 'pools_utilization', - 'pools_active_leases', - 'leases_total', -] - -CHARTS = { - 'pools_utilization': { - 'options': [None, 'Pools Utilization', 'percentage', 'utilization', 'isc_dhcpd.utilization', 'line'], - 'lines': [] - }, - 'pools_active_leases': { - 'options': [None, 'Active Leases Per Pool', 'leases', 'active leases', 'isc_dhcpd.active_leases', 'line'], - 'lines': [] - }, - 'leases_total': { - 'options': [None, 'All Active Leases', 'leases', 'active leases', 'isc_dhcpd.leases_total', 'line'], - 'lines': [ - ['leases_total', 'leases', 'absolute'] - ], - 'variables': [ - ['leases_size'] - ] - } -} - -POOL_CIDR = "CIDR" -POOL_IP_RANGE = "IP_RANGE" -POOL_UNKNOWN = "UNKNOWN" - -def detect_ip_type(ip): - ip_type = ip.split("-") - if len(ip_type) == 1: - return POOL_CIDR - elif len(ip_type) == 2: - return POOL_IP_RANGE - else: - return POOL_UNKNOWN - - -class DhcpdLeasesFile: - def __init__(self, path): - self.path = path - self.mod_time = 0 - self.size = 0 - - def is_valid(self): - return os.path.isfile(self.path) and os.access(self.path, os.R_OK) - - def is_changed(self): - mod_time = os.path.getmtime(self.path) - if mod_time != self.mod_time: - self.mod_time = mod_time - self.size = int(os.path.getsize(self.path) / 1024) - return True - return False - - def get_data(self): - try: - with open(self.path) as leases: - result = defaultdict(dict) - for row in leases: - row = row.strip() - if row.startswith('lease'): - address = row[6:-2] - elif row.startswith('iaaddr'): - address = row[7:-2] - elif row.startswith('ends'): - result[address]['ends'] = row[5:-1] - elif row.startswith('binding state'): - result[address]['state'] = row[14:-1] - return dict((k, v) for k, v in result.items() if len(v) == 2) - except (OSError, IOError): - return None - - -class Pool: - def __init__(self, name, network): - self.id = re.sub(r'[:/.-]+', '_', name) - self.name = name - - self.networks = list() - for network in network.split(" "): - if not network: - continue - - ip_type = detect_ip_type(ip=network) - if ip_type == POOL_CIDR: - self.networks.append(PoolCIDR(network=network)) - elif ip_type == POOL_IP_RANGE: - self.networks.append(PoolIPRange(ip_range=network)) - else: - raise ValueError('Network ({0}) incorrect syntax, expect CIDR or IPRange format.'.format(network)) - - def num_hosts(self): - return sum([network.num_hosts() for network in self.networks]) - - def __contains__(self, item): - for network in self.networks: - if item in network: - return True - return False - - -class PoolCIDR: - def __init__(self, network): - self.network = ipaddress.ip_network(address=u'%s' % network) - - def num_hosts(self): - return self.network.num_addresses - 2 - - def __contains__(self, item): - return item.address in self.network - - -class PoolIPRange: - def __init__(self, ip_range): - ip_range = ip_range.split("-") - self.networks = list(self._summarize_address_range(ip_range[0], ip_range[1])) - - @staticmethod - def ip_address(ip): - return ipaddress.ip_address(u'%s' % ip) - - def _summarize_address_range(self, first, last): - address_first = self.ip_address(first) - address_last = self.ip_address(last) - return ipaddress.summarize_address_range(address_first, address_last) - - def num_hosts(self): - return sum([network.num_addresses for network in self.networks]) - - def __contains__(self, item): - for network in self.networks: - if item.address in network: - return True - return False - - -class Lease: - def __init__(self, address, ends, state): - self.address = ipaddress.ip_address(address=u'%s' % address) - self.ends = ends - self.state = state - - def is_active(self, current_time): - # lease_end_time might be epoch - if self.ends.startswith('epoch'): - epoch = int(self.ends.split()[1].replace(';', '')) - return epoch - current_time > 0 - # max. int for lease-time causes lease to expire in year 2038. - # dhcpd puts 'never' in the ends section of active lease - elif self.ends == 'never': - return True - return time.mktime(time.strptime(self.ends, '%w %Y/%m/%d %H:%M:%S')) - current_time > 0 - - def is_valid(self): - return self.state == 'active' - - -class Service(SimpleService): - def __init__(self, configuration=None, name=None): - SimpleService.__init__(self, configuration=configuration, name=name) - self.order = ORDER - self.definitions = deepcopy(CHARTS) - lease_path = self.configuration.get('leases_path', '/var/lib/dhcp/dhcpd.leases') - self.dhcpd_leases = DhcpdLeasesFile(path=lease_path) - self.pools = list() - self.data = dict() - - # Will work only with 'default' db-time-format (weekday year/month/day hour:minute:second) - # TODO: update algorithm to parse correctly 'local' db-time-format - - def check(self): - if not HAVE_IP_ADDRESS: - self.error("'python-ipaddress' package is needed") - return False - - if not self.dhcpd_leases.is_valid(): - self.error("Make sure '{path}' is exist and readable by netdata".format(path=self.dhcpd_leases.path)) - return False - - pools = self.configuration.get('pools') - if not pools: - self.error('Pools are not defined') - return False - - for pool in pools: - try: - new_pool = Pool(name=pool, network=pools[pool]) - except ValueError as error: - self.error("'{pool}' was removed, error: {error}".format(pool=pools[pool], error=error)) - else: - self.pools.append(new_pool) - - self.create_charts() - return bool(self.pools) - - def get_data(self): - """ - :return: dict - """ - if not self.dhcpd_leases.is_changed(): - return self.data - - raw_leases = self.dhcpd_leases.get_data() - if not raw_leases: - self.data = dict() - return None - - active_leases = list() - current_time = time.mktime(time.gmtime()) - - for address in raw_leases: - try: - new_lease = Lease(address, **raw_leases[address]) - except ValueError: - continue - else: - if new_lease.is_active(current_time) and new_lease.is_valid(): - active_leases.append(new_lease) - - for pool in self.pools: - count = len([ip for ip in active_leases if ip in pool]) - self.data[pool.id + '_active_leases'] = count - self.data[pool.id + '_utilization'] = float(count) / pool.num_hosts() * 10000 - - self.data['leases_size'] = self.dhcpd_leases.size - self.data['leases_total'] = len(active_leases) - - return self.data - - def create_charts(self): - for pool in self.pools: - dim = [ - pool.id + '_utilization', - pool.name, - 'absolute', - 1, - 100, - ] - self.definitions['pools_utilization']['lines'].append(dim) - - dim = [ - pool.id + '_active_leases', - pool.name, - ] - self.definitions['pools_active_leases']['lines'].append(dim) diff --git a/collectors/python.d.plugin/isc_dhcpd/isc_dhcpd.conf b/collectors/python.d.plugin/isc_dhcpd/isc_dhcpd.conf deleted file mode 100644 index c700947b4..000000000 --- a/collectors/python.d.plugin/isc_dhcpd/isc_dhcpd.conf +++ /dev/null @@ -1,80 +0,0 @@ -# netdata python.d.plugin configuration for isc dhcpd leases -# -# This file is in YaML format. Generally the format is: -# -# name: value -# -# There are 2 sections: -# - global variables -# - one or more JOBS -# -# JOBS allow you to collect values from multiple sources. -# Each source will have its own set of charts. -# -# JOB parameters have to be indented (using spaces only, example below). - -# ---------------------------------------------------------------------- -# Global Variables -# These variables set the defaults for all JOBs, however each JOB -# may define its own, overriding the defaults. - -# update_every sets the default data collection frequency. -# If unset, the python.d.plugin default is used. -# update_every: 1 - -# priority controls the order of charts at the netdata dashboard. -# Lower numbers move the charts towards the top of the page. -# If unset, the default for python.d.plugin is used. -# priority: 60000 - -# penalty indicates whether to apply penalty to update_every in case of failures. -# Penalty will increase every 5 failed updates in a row. Maximum penalty is 10 minutes. -# penalty: yes - -# autodetection_retry sets the job re-check interval in seconds. -# The job is not deleted if check fails. -# Attempts to start the job are made once every autodetection_retry. -# This feature is disabled by default. -# autodetection_retry: 0 - -# ---------------------------------------------------------------------- -# JOBS (data collection sources) -# -# The default JOBS share the same *name*. JOBS with the same name -# are mutually exclusive. Only one of them will be allowed running at -# any time. This allows autodetection to try several alternatives and -# pick the one that works. -# -# Any number of jobs is supported. -# -# All python.d.plugin JOBS (for all its modules) support a set of -# predefined parameters. These are: -# -# job_name: -# name: myname # the JOB's name as it will appear at the -# # dashboard (by default is the job_name) -# # JOBs sharing a name are mutually exclusive -# update_every: 1 # the JOB's data collection frequency -# priority: 60000 # the JOB's order on the dashboard -# penalty: yes # the JOB's penalty -# autodetection_retry: 0 # the JOB's re-check interval in seconds -# -# Additionally to the above, isc_dhcpd supports the following: -# -# leases_path: 'PATH' # the path to dhcpd.leases file -# pools: -# office: '192.168.2.0/24' # name(dimension): pool in CIDR format -# wifi: '192.168.3.10-192.168.3.20' # name(dimension): pool in IP Range format -# 192.168.4.0/24: '192.168.4.0/24' # name(dimension): pool in CIDR format -# wifi-guest: '192.168.5.0/24 192.168.6.10-192.168.6.20' # name(dimension): pool in CIDR + IP Range format -# -#----------------------------------------------------------------------- -# IMPORTANT notes -# -# 1. Make sure leases file is readable by netdata. -# 2. Current implementation works only with 'default' db-time-format -# (weekday year/month/day hour:minute:second). -# This is the default, so it will work in most cases. -# 3. Pools MUST BE in CIDR format. -# -# ---------------------------------------------------------------------- diff --git a/collectors/python.d.plugin/mysql/Makefile.inc b/collectors/python.d.plugin/mysql/Makefile.inc deleted file mode 100644 index 03e8b65eb..000000000 --- a/collectors/python.d.plugin/mysql/Makefile.inc +++ /dev/null @@ -1,13 +0,0 @@ -# SPDX-License-Identifier: GPL-3.0-or-later - -# THIS IS NOT A COMPLETE Makefile -# IT IS INCLUDED BY ITS PARENT'S Makefile.am -# IT IS REQUIRED TO REFERENCE ALL FILES RELATIVE TO THE PARENT - -# install these files -dist_python_DATA += mysql/mysql.chart.py -dist_pythonconfig_DATA += mysql/mysql.conf - -# do not install these files, but include them in the distribution -dist_noinst_DATA += mysql/README.md mysql/Makefile.inc - diff --git a/collectors/python.d.plugin/mysql/README.md b/collectors/python.d.plugin/mysql/README.md deleted file mode 100644 index 1ba794adf..000000000 --- a/collectors/python.d.plugin/mysql/README.md +++ /dev/null @@ -1,396 +0,0 @@ -<!-- -title: "MySQL monitoring with Netdata" -custom_edit_url: https://github.com/netdata/netdata/edit/master/collectors/python.d.plugin/mysql/README.md -sidebar_label: "MySQL" ---> - -# MySQL monitoring with Netdata - -Monitors one or more MySQL servers. - -## Requirements - -- python library [MySQLdb](https://github.com/PyMySQL/mysqlclient-python) (faster) or [PyMySQL](https://github.com/PyMySQL/PyMySQL) (slower) -- `netdata` local user to connect to the MySQL server. - -To create the `netdata` user, execute the following in the MySQL shell: - -```sh -create user 'netdata'@'localhost'; -grant usage, replication client on *.* to 'netdata'@'localhost'; -flush privileges; -``` -The `netdata` user will have the ability to connect to the MySQL server on `localhost` without a password. -It will only be able to gather MySQL statistics without being able to alter or affect MySQL operations in any way. - -This module will produce following charts (if data is available): - -1. **Bandwidth** in kilobits/s - - - in - - out - -2. **Queries** in queries/sec - - - queries - - questions - - slow queries - -3. **Queries By Type** in queries/s - - - select - - delete - - update - - insert - - cache hits - - replace - -4. **Handlers** in handlers/s - - - commit - - delete - - prepare - - read first - - read key - - read next - - read prev - - read rnd - - read rnd next - - rollback - - savepoint - - savepoint rollback - - update - - write - -5. **Table Locks** in locks/s - - - immediate - - waited - -6. **Table Select Join Issues** in joins/s - - - full join - - full range join - - range - - range check - - scan - -7. **Table Sort Issues** in joins/s - - - merge passes - - range - - scan - -8. **Tmp Operations** in created/s - - - disk tables - - files - - tables - -9. **Connections** in connections/s - - - all - - aborted - -10. **Connections Active** in connections/s - - - active - - limit - - max active - -11. **Binlog Cache** in threads - - - disk - - all - -12. **Threads** in transactions/s - - - connected - - cached - - running - -13. **Threads Creation Rate** in threads/s - - - created - -14. **Threads Cache Misses** in misses - - - misses - -15. **InnoDB I/O Bandwidth** in KiB/s - - - read - - write - -16. **InnoDB I/O Operations** in operations/s - - - reads - - writes - - fsyncs - -17. **InnoDB Pending I/O Operations** in operations/s - - - reads - - writes - - fsyncs - -18. **InnoDB Log Operations** in operations/s - - - waits - - write requests - - writes - -19. **InnoDB OS Log Pending Operations** in operations - - - fsyncs - - writes - -20. **InnoDB OS Log Operations** in operations/s - - - fsyncs - -21. **InnoDB OS Log Bandwidth** in KiB/s - - - write - -22. **InnoDB Current Row Locks** in operations - - - current waits - -23. **InnoDB Row Operations** in operations/s - - - inserted - - read - - updated - - deleted - -24. **InnoDB Buffer Pool Pages** in pages - - - data - - dirty - - free - - misc - - total - -25. **InnoDB Buffer Pool Flush Pages Requests** in requests/s - - - flush pages - -26. **InnoDB Buffer Pool Bytes** in MiB - - - data - - dirty - -27. **InnoDB Buffer Pool Operations** in operations/s - - - disk reads - - wait free - -28. **QCache Operations** in queries/s - - - hits - - lowmem prunes - - inserts - - no caches - -29. **QCache Queries in Cache** in queries - - - queries - -30. **QCache Free Memory** in MiB - - - free - -31. **QCache Memory Blocks** in blocks - - - free - - total - -32. **MyISAM Key Cache Blocks** in blocks - - - unused - - used - - not flushed - -33. **MyISAM Key Cache Requests** in requests/s - - - reads - - writes - -34. **MyISAM Key Cache Requests** in requests/s - - - reads - - writes - -35. **MyISAM Key Cache Disk Operations** in operations/s - - - reads - - writes - -36. **Open Files** in files - - - files - -37. **Opened Files Rate** in files/s - - - files - -38. **Binlog Statement Cache** in statements/s - - - disk - - all - -39. **Connection Errors** in errors/s - - - accept - - internal - - max - - peer addr - - select - - tcpwrap - -40. **Slave Behind Seconds** in seconds - - - time - -41. **I/O / SQL Thread Running State** in bool - - - sql - - io - -42. **Galera Replicated Writesets** in writesets/s - - - rx - - tx - -43. **Galera Replicated Bytes** in KiB/s - - - rx - - tx - -44. **Galera Queue** in writesets - - - rx - - tx - -45. **Galera Replication Conflicts** in transactions - - - bf aborts - - cert fails - -46. **Galera Flow Control** in ms - - - paused - -47. **Galera Cluster Status** in status - - - status - -48. **Galera Cluster State** in state - - - state - -49. **Galera Number of Nodes in the Cluster** in num - - - nodes - -50. **Galera Total Weight of the Current Members in the Cluster** in weight - - - weight - -51. **Galera Whether the Node is Connected to the Cluster** in boolean - - - connected - -52. **Galera Whether the Node is Ready to Accept Queries** in boolean - - - ready - -53. **Galera Open Transactions** in num - - - open transactions - -54. **Galera Total Number of WSRep (applier/rollbacker) Threads** in num - - - threads - -55. **Users CPU time** in percentage - - - users - -**Per user statistics:** - -1. **Rows Operations** in operations/s - - - read - - send - - updated - - inserted - - deleted - -2. **Commands** in commands/s - - - select - - update - - other - -## Configuration - -Edit the `python.d/mysql.conf` configuration file using `edit-config` from the Netdata [config -directory](/docs/configure/nodes.md), which is typically at `/etc/netdata`. - -```bash -cd /etc/netdata # Replace this path with your Netdata config directory, if different -sudo ./edit-config python.d/mysql.conf -``` - -You can provide, per server, the following: - -1. username which have access to database (defaults to 'root') -2. password (defaults to none) -3. mysql my.cnf configuration file -4. mysql socket (optional) -5. mysql host (ip or hostname) -6. mysql port (defaults to 3306) -7. ssl connection parameters - - - key: the path name of the client private key file. - - cert: the path name of the client public key certificate file. - - ca: the path name of the Certificate Authority (CA) certificate file. This option, if used, must specify the - same certificate used by the server. - - capath: the path name of the directory that contains trusted SSL CA certificate files. - - cipher: the list of permitted ciphers for SSL encryption. - -Here is an example for 3 servers: - -```yaml -update_every : 10 -priority : 90100 - -local: - 'my.cnf' : '/etc/mysql/my.cnf' - priority : 90000 - -local_2: - user : 'root' - pass : 'blablablabla' - socket : '/var/run/mysqld/mysqld.sock' - update_every : 1 - -remote: - user : 'admin' - pass : 'bla' - host : 'example.org' - port : 9000 -``` - -If no configuration is given, the module will attempt to connect to MySQL server via a unix socket at -`/var/run/mysqld/mysqld.sock` without password and with username `root` or `netdata` (you granted permissions for `netdata` user in the Requirements section of this document). - -`userstats` graph works only if you enable the plugin in MariaDB server and set proper MySQL privileges (SUPER or -PROCESS). For more details, please check the [MariaDB User Statistics -page](https://mariadb.com/kb/en/library/user-statistics/) - ---- - - diff --git a/collectors/python.d.plugin/mysql/mysql.chart.py b/collectors/python.d.plugin/mysql/mysql.chart.py deleted file mode 100644 index e8c03cb00..000000000 --- a/collectors/python.d.plugin/mysql/mysql.chart.py +++ /dev/null @@ -1,976 +0,0 @@ -# -*- coding: utf-8 -*- -# Description: MySQL netdata python.d module -# Author: Pawel Krupa (paulfantom) -# Author: Ilya Mashchenko (ilyam8) -# SPDX-License-Identifier: GPL-3.0-or-later - -from bases.FrameworkServices.MySQLService import MySQLService - -# query executed on MySQL server -QUERY_GLOBAL = 'SHOW GLOBAL STATUS;' -QUERY_SLAVE = 'SHOW SLAVE STATUS;' -QUERY_VARIABLES = 'SHOW GLOBAL VARIABLES LIKE \'max_connections\';' -QUERY_USER_STATISTICS = 'SHOW USER_STATISTICS;' - -GLOBAL_STATS = [ - 'Bytes_received', - 'Bytes_sent', - 'Queries', - 'Questions', - 'Slow_queries', - 'Handler_commit', - 'Handler_delete', - 'Handler_prepare', - 'Handler_read_first', - 'Handler_read_key', - 'Handler_read_next', - 'Handler_read_prev', - 'Handler_read_rnd', - 'Handler_read_rnd_next', - 'Handler_rollback', - 'Handler_savepoint', - 'Handler_savepoint_rollback', - 'Handler_update', - 'Handler_write', - 'Table_locks_immediate', - 'Table_locks_waited', - 'Select_full_join', - 'Select_full_range_join', - 'Select_range', - 'Select_range_check', - 'Select_scan', - 'Sort_merge_passes', - 'Sort_range', - 'Sort_scan', - 'Created_tmp_disk_tables', - 'Created_tmp_files', - 'Created_tmp_tables', - 'Connections', - 'Aborted_connects', - 'Max_used_connections', - 'Binlog_cache_disk_use', - 'Binlog_cache_use', - 'Threads_connected', - 'Threads_created', - 'Threads_cached', - 'Threads_running', - 'Thread_cache_misses', - 'Innodb_data_read', - 'Innodb_data_written', - 'Innodb_data_reads', - 'Innodb_data_writes', - 'Innodb_data_fsyncs', - 'Innodb_data_pending_reads', - 'Innodb_data_pending_writes', - 'Innodb_data_pending_fsyncs', - 'Innodb_log_waits', - 'Innodb_log_write_requests', - 'Innodb_log_writes', - 'Innodb_os_log_fsyncs', - 'Innodb_os_log_pending_fsyncs', - 'Innodb_os_log_pending_writes', - 'Innodb_os_log_written', - 'Innodb_row_lock_current_waits', - 'Innodb_rows_inserted', - 'Innodb_rows_read', - 'Innodb_rows_updated', - 'Innodb_rows_deleted', - 'Innodb_buffer_pool_pages_data', - 'Innodb_buffer_pool_pages_dirty', - 'Innodb_buffer_pool_pages_free', - 'Innodb_buffer_pool_pages_flushed', - 'Innodb_buffer_pool_pages_misc', - 'Innodb_buffer_pool_pages_total', - 'Innodb_buffer_pool_bytes_data', - 'Innodb_buffer_pool_bytes_dirty', - 'Innodb_buffer_pool_read_ahead', - 'Innodb_buffer_pool_read_ahead_evicted', - 'Innodb_buffer_pool_read_ahead_rnd', - 'Innodb_buffer_pool_read_requests', - 'Innodb_buffer_pool_write_requests', - 'Innodb_buffer_pool_reads', - 'Innodb_buffer_pool_wait_free', - 'Innodb_deadlocks', - 'Qcache_hits', - 'Qcache_lowmem_prunes', - 'Qcache_inserts', - 'Qcache_not_cached', - 'Qcache_queries_in_cache', - 'Qcache_free_memory', - 'Qcache_free_blocks', - 'Qcache_total_blocks', - 'Key_blocks_unused', - 'Key_blocks_used', - 'Key_blocks_not_flushed', - 'Key_read_requests', - 'Key_write_requests', - 'Key_reads', - 'Key_writes', - 'Open_files', - 'Opened_files', - 'Binlog_stmt_cache_disk_use', - 'Binlog_stmt_cache_use', - 'Connection_errors_accept', - 'Connection_errors_internal', - 'Connection_errors_max_connections', - 'Connection_errors_peer_address', - 'Connection_errors_select', - 'Connection_errors_tcpwrap', - 'Com_delete', - 'Com_insert', - 'Com_select', - 'Com_update', - 'Com_replace' -] - -GALERA_STATS = [ - 'wsrep_local_recv_queue', - 'wsrep_local_send_queue', - 'wsrep_received', - 'wsrep_replicated', - 'wsrep_received_bytes', - 'wsrep_replicated_bytes', - 'wsrep_local_bf_aborts', - 'wsrep_local_cert_failures', - 'wsrep_flow_control_paused_ns', - 'wsrep_cluster_weight', - 'wsrep_cluster_size', - 'wsrep_cluster_status', - 'wsrep_local_state', - 'wsrep_open_transactions', - 'wsrep_connected', - 'wsrep_ready', - 'wsrep_thread_count' -] - - -def slave_seconds(value): - try: - return int(value) - except (TypeError, ValueError): - return -1 - - -def slave_running(value): - return 1 if value == 'Yes' else -1 - - -SLAVE_STATS = [ - ('Seconds_Behind_Master', slave_seconds), - ('Slave_SQL_Running', slave_running), - ('Slave_IO_Running', slave_running) -] - -USER_STATISTICS = [ - 'Select_commands', - 'Update_commands', - 'Other_commands', - 'Cpu_time', - 'Rows_read', - 'Rows_sent', - 'Rows_deleted', - 'Rows_inserted', - 'Rows_updated' -] - -VARIABLES = [ - 'max_connections' -] - -ORDER = [ - 'net', - 'queries', - 'queries_type', - 'handlers', - 'table_locks', - 'join_issues', - 'sort_issues', - 'tmp', - 'connections', - 'connections_active', - 'connection_errors', - 'binlog_cache', - 'binlog_stmt_cache', - 'threads', - 'threads_creation_rate', - 'thread_cache_misses', - 'innodb_io', - 'innodb_io_ops', - 'innodb_io_pending_ops', - 'innodb_log', - 'innodb_os_log', - 'innodb_os_log_fsync_writes', - 'innodb_os_log_io', - 'innodb_cur_row_lock', - 'innodb_deadlocks', - 'innodb_rows', - 'innodb_buffer_pool_pages', - 'innodb_buffer_pool_flush_pages_requests', - 'innodb_buffer_pool_bytes', - 'innodb_buffer_pool_read_ahead', - 'innodb_buffer_pool_reqs', - 'innodb_buffer_pool_ops', - 'qcache_ops', - 'qcache', - 'qcache_freemem', - 'qcache_memblocks', - 'key_blocks', - 'key_requests', - 'key_disk_ops', - 'files', - 'files_rate', - 'slave_behind', - 'slave_status', - 'galera_writesets', - 'galera_bytes', - 'galera_queue', - 'galera_conflicts', - 'galera_flow_control', - 'galera_cluster_status', - 'galera_cluster_state', - 'galera_cluster_size', - 'galera_cluster_weight', - 'galera_connected', - 'galera_ready', - 'galera_open_transactions', - 'galera_thread_count', - 'userstats_cpu', -] - -CHARTS = { - 'net': { - 'options': [None, 'Bandwidth', 'kilobits/s', 'bandwidth', 'mysql.net', 'area'], - 'lines': [ - ['Bytes_received', 'in', 'incremental', 8, 1000], - ['Bytes_sent', 'out', 'incremental', -8, 1000] - ] - }, - 'queries': { - 'options': [None, 'Queries', 'queries/s', 'queries', 'mysql.queries', 'line'], - 'lines': [ - ['Queries', 'queries', 'incremental'], - ['Questions', 'questions', 'incremental'], - ['Slow_queries', 'slow_queries', 'incremental'] - ] - }, - 'queries_type': { - 'options': [None, 'Query Type', 'queries/s', 'query_types', 'mysql.queries_type', 'stacked'], - 'lines': [ - ['Com_select', 'select', 'incremental'], - ['Com_delete', 'delete', 'incremental'], - ['Com_update', 'update', 'incremental'], - ['Com_insert', 'insert', 'incremental'], - ['Qcache_hits', 'cache_hits', 'incremental'], - ['Com_replace', 'replace', 'incremental'] - ] - }, - 'handlers': { - 'options': [None, 'Handlers', 'handlers/s', 'handlers', 'mysql.handlers', 'line'], - 'lines': [ - ['Handler_commit', 'commit', 'incremental'], - ['Handler_delete', 'delete', 'incremental'], - ['Handler_prepare', 'prepare', 'incremental'], - ['Handler_read_first', 'read_first', 'incremental'], - ['Handler_read_key', 'read_key', 'incremental'], - ['Handler_read_next', 'read_next', 'incremental'], - ['Handler_read_prev', 'read_prev', 'incremental'], - ['Handler_read_rnd', 'read_rnd', 'incremental'], - ['Handler_read_rnd_next', 'read_rnd_next', 'incremental'], - ['Handler_rollback', 'rollback', 'incremental'], - ['Handler_savepoint', 'savepoint', 'incremental'], - ['Handler_savepoint_rollback', 'savepoint_rollback', 'incremental'], - ['Handler_update', 'update', 'incremental'], - ['Handler_write', 'write', 'incremental'] - ] - }, - 'table_locks': { - 'options': [None, 'Tables Locks', 'locks/s', 'locks', 'mysql.table_locks', 'line'], - 'lines': [ - ['Table_locks_immediate', 'immediate', 'incremental'], - ['Table_locks_waited', 'waited', 'incremental', -1, 1] - ] - }, - 'join_issues': { - 'options': [None, 'Select Join Issues', 'joins/s', 'issues', 'mysql.join_issues', 'line'], - 'lines': [ - ['Select_full_join', 'full_join', 'incremental'], - ['Select_full_range_join', 'full_range_join', 'incremental'], - ['Select_range', 'range', 'incremental'], - ['Select_range_check', 'range_check', 'incremental'], - ['Select_scan', 'scan', 'incremental'] - ] - }, - 'sort_issues': { - 'options': [None, 'Sort Issues', 'issues/s', 'issues', 'mysql.sort_issues', 'line'], - 'lines': [ - ['Sort_merge_passes', 'merge_passes', 'incremental'], - ['Sort_range', 'range', 'incremental'], - ['Sort_scan', 'scan', 'incremental'] - ] - }, - 'tmp': { - 'options': [None, 'Tmp Operations', 'counter', 'temporaries', 'mysql.tmp', 'line'], - 'lines': [ - ['Created_tmp_disk_tables', 'disk_tables', 'incremental'], - ['Created_tmp_files', 'files', 'incremental'], - ['Created_tmp_tables', 'tables', 'incremental'] - ] - }, - 'connections': { - 'options': [None, 'Connections', 'connections/s', 'connections', 'mysql.connections', 'line'], - 'lines': [ - ['Connections', 'all', 'incremental'], - ['Aborted_connects', 'aborted', 'incremental'] - ] - }, - 'connections_active': { - 'options': [None, 'Connections Active', 'connections', 'connections', 'mysql.connections_active', 'line'], - 'lines': [ - ['Threads_connected', 'active', 'absolute'], - ['max_connections', 'limit', 'absolute'], - ['Max_used_connections', 'max_active', 'absolute'] - ] - }, - 'binlog_cache': { - 'options': [None, 'Binlog Cache', 'transactions/s', 'binlog', 'mysql.binlog_cache', 'line'], - 'lines': [ - ['Binlog_cache_disk_use', 'disk', 'incremental'], - ['Binlog_cache_use', 'all', 'incremental'] - ] - }, - 'threads': { - 'options': [None, 'Threads', 'threads', 'threads', 'mysql.threads', 'line'], - 'lines': [ - ['Threads_connected', 'connected', 'absolute'], - ['Threads_cached', 'cached', 'absolute', -1, 1], - ['Threads_running', 'running', 'absolute'], - ] - }, - 'threads_creation_rate': { - 'options': [None, 'Threads Creation Rate', 'threads/s', 'threads', 'mysql.threads_creation_rate', 'line'], - 'lines': [ - ['Threads_created', 'created', 'incremental'], - ] - }, - 'thread_cache_misses': { - 'options': [None, 'mysql Threads Cache Misses', 'misses', 'threads', 'mysql.thread_cache_misses', 'area'], - 'lines': [ - ['Thread_cache_misses', 'misses', 'absolute', 1, 100] - ] - }, - 'innodb_io': { - 'options': [None, 'InnoDB I/O Bandwidth', 'KiB/s', 'innodb', 'mysql.innodb_io', 'area'], - 'lines': [ - ['Innodb_data_read', 'read', 'incremental', 1, 1024], - ['Innodb_data_written', 'write', 'incremental', -1, 1024] - ] - }, - 'innodb_io_ops': { - 'options': [None, 'InnoDB I/O Operations', 'operations/s', 'innodb', 'mysql.innodb_io_ops', 'line'], - 'lines': [ - ['Innodb_data_reads', 'reads', 'incremental'], - ['Innodb_data_writes', 'writes', 'incremental', -1, 1], - ['Innodb_data_fsyncs', 'fsyncs', 'incremental'] - ] - }, - 'innodb_io_pending_ops': { - 'options': [None, 'InnoDB Pending I/O Operations', 'operations', 'innodb', - 'mysql.innodb_io_pending_ops', 'line'], - 'lines': [ - ['Innodb_data_pending_reads', 'reads', 'absolute'], - ['Innodb_data_pending_writes', 'writes', 'absolute', -1, 1], - ['Innodb_data_pending_fsyncs', 'fsyncs', 'absolute'] - ] - }, - 'innodb_log': { - 'options': [None, 'InnoDB Log Operations', 'operations/s', 'innodb', 'mysql.innodb_log', 'line'], - 'lines': [ - ['Innodb_log_waits', 'waits', 'incremental'], - ['Innodb_log_write_requests', 'write_requests', 'incremental', -1, 1], - ['Innodb_log_writes', 'writes', 'incremental', -1, 1], - ] - }, - 'innodb_os_log': { - 'options': [None, 'InnoDB OS Log Pending Operations', 'operations', 'innodb', 'mysql.innodb_os_log', 'line'], - 'lines': [ - ['Innodb_os_log_pending_fsyncs', 'fsyncs', 'absolute'], - ['Innodb_os_log_pending_writes', 'writes', 'absolute', -1, 1], - ] - }, - 'innodb_os_log_fsync_writes': { - 'options': [None, 'InnoDB OS Log Operations', 'operations/s', 'innodb', 'mysql.innodb_os_log_fsyncs', 'line'], - 'lines': [ - ['Innodb_os_log_fsyncs', 'fsyncs', 'incremental'], - ] - }, - 'innodb_os_log_io': { - 'options': [None, 'InnoDB OS Log Bandwidth', 'KiB/s', 'innodb', 'mysql.innodb_os_log_io', 'area'], - 'lines': [ - ['Innodb_os_log_written', 'write', 'incremental', -1, 1024], - ] - }, - 'innodb_cur_row_lock': { - 'options': [None, 'InnoDB Current Row Locks', 'operations', 'innodb', - 'mysql.innodb_cur_row_lock', 'area'], - 'lines': [ - ['Innodb_row_lock_current_waits', 'current_waits', 'absolute'] - ] - }, - 'innodb_deadlocks': { - 'options': [None, 'InnoDB Deadlocks', 'operations/s', 'innodb', - 'mysql.innodb_deadlocks', 'area'], - 'lines': [ - ['Innodb_deadlocks', 'deadlocks', 'incremental'] - ] - }, - 'innodb_rows': { - 'options': [None, 'InnoDB Row Operations', 'operations/s', 'innodb', 'mysql.innodb_rows', 'area'], - 'lines': [ - ['Innodb_rows_inserted', 'inserted', 'incremental'], - ['Innodb_rows_read', 'read', 'incremental', 1, 1], - ['Innodb_rows_updated', 'updated', 'incremental', 1, 1], - ['Innodb_rows_deleted', 'deleted', 'incremental', -1, 1], - ] - }, - 'innodb_buffer_pool_pages': { - 'options': [None, 'InnoDB Buffer Pool Pages', 'pages', 'innodb', - 'mysql.innodb_buffer_pool_pages', 'line'], - 'lines': [ - ['Innodb_buffer_pool_pages_data', 'data', 'absolute'], - ['Innodb_buffer_pool_pages_dirty', 'dirty', 'absolute', -1, 1], - ['Innodb_buffer_pool_pages_free', 'free', 'absolute'], - ['Innodb_buffer_pool_pages_misc', 'misc', 'absolute', -1, 1], - ['Innodb_buffer_pool_pages_total', 'total', 'absolute'] - ] - }, - 'innodb_buffer_pool_flush_pages_requests': { - 'options': [None, 'InnoDB Buffer Pool Flush Pages Requests', 'requests/s', 'innodb', - 'mysql.innodb_buffer_pool_pages_flushed', 'line'], - 'lines': [ - ['Innodb_buffer_pool_pages_flushed', 'flush pages', 'incremental'], - ] - }, - 'innodb_buffer_pool_bytes': { - 'options': [None, 'InnoDB Buffer Pool Bytes', 'MiB', 'innodb', 'mysql.innodb_buffer_pool_bytes', 'area'], - 'lines': [ - ['Innodb_buffer_pool_bytes_data', 'data', 'absolute', 1, 1024 * 1024], - ['Innodb_buffer_pool_bytes_dirty', 'dirty', 'absolute', -1, 1024 * 1024] - ] - }, - 'innodb_buffer_pool_read_ahead': { - 'options': [None, 'mysql InnoDB Buffer Pool Read Ahead', 'operations/s', 'innodb', - 'mysql.innodb_buffer_pool_read_ahead', 'area'], - 'lines': [ - ['Innodb_buffer_pool_read_ahead', 'all', 'incremental'], - ['Innodb_buffer_pool_read_ahead_evicted', 'evicted', 'incremental', -1, 1], - ['Innodb_buffer_pool_read_ahead_rnd', 'random', 'incremental'] - ] - }, - 'innodb_buffer_pool_reqs': { - 'options': [None, 'InnoDB Buffer Pool Requests', 'requests/s', 'innodb', - 'mysql.innodb_buffer_pool_reqs', 'area'], - 'lines': [ - ['Innodb_buffer_pool_read_requests', 'reads', 'incremental'], - ['Innodb_buffer_pool_write_requests', 'writes', 'incremental', -1, 1] - ] - }, - 'innodb_buffer_pool_ops': { - 'options': [None, 'InnoDB Buffer Pool Operations', 'operations/s', 'innodb', - 'mysql.innodb_buffer_pool_ops', 'area'], - 'lines': [ - ['Innodb_buffer_pool_reads', 'disk reads', 'incremental'], - ['Innodb_buffer_pool_wait_free', 'wait free', 'incremental', -1, 1] - ] - }, - 'qcache_ops': { - 'options': [None, 'QCache Operations', 'queries/s', 'qcache', 'mysql.qcache_ops', 'line'], - 'lines': [ - ['Qcache_hits', 'hits', 'incremental'], - ['Qcache_lowmem_prunes', 'lowmem prunes', 'incremental', -1, 1], - ['Qcache_inserts', 'inserts', 'incremental'], - ['Qcache_not_cached', 'not cached', 'incremental', -1, 1] - ] - }, - 'qcache': { - 'options': [None, 'QCache Queries in Cache', 'queries', 'qcache', 'mysql.qcache', 'line'], - 'lines': [ - ['Qcache_queries_in_cache', 'queries', 'absolute'] - ] - }, - 'qcache_freemem': { - 'options': [None, 'QCache Free Memory', 'MiB', 'qcache', 'mysql.qcache_freemem', 'area'], - 'lines': [ - ['Qcache_free_memory', 'free', 'absolute', 1, 1024 * 1024] - ] - }, - 'qcache_memblocks': { - 'options': [None, 'QCache Memory Blocks', 'blocks', 'qcache', 'mysql.qcache_memblocks', 'line'], - 'lines': [ - ['Qcache_free_blocks', 'free', 'absolute'], - ['Qcache_total_blocks', 'total', 'absolute'] - ] - }, - 'key_blocks': { - 'options': [None, 'MyISAM Key Cache Blocks', 'blocks', 'myisam', 'mysql.key_blocks', 'line'], - 'lines': [ - ['Key_blocks_unused', 'unused', 'absolute'], - ['Key_blocks_used', 'used', 'absolute', -1, 1], - ['Key_blocks_not_flushed', 'not flushed', 'absolute'] - ] - }, - 'key_requests': { - 'options': [None, 'MyISAM Key Cache Requests', 'requests/s', 'myisam', 'mysql.key_requests', 'area'], - 'lines': [ - ['Key_read_requests', 'reads', 'incremental'], - ['Key_write_requests', 'writes', 'incremental', -1, 1] - ] - }, - 'key_disk_ops': { - 'options': [None, 'MyISAM Key Cache Disk Operations', 'operations/s', - 'myisam', 'mysql.key_disk_ops', 'area'], - 'lines': [ - ['Key_reads', 'reads', 'incremental'], - ['Key_writes', 'writes', 'incremental', -1, 1] - ] - }, - 'files': { - 'options': [None, 'Open Files', 'files', 'files', 'mysql.files', 'line'], - 'lines': [ - ['Open_files', 'files', 'absolute'] - ] - }, - 'files_rate': { - 'options': [None, 'Opened Files Rate', 'files/s', 'files', 'mysql.files_rate', 'line'], - 'lines': [ - ['Opened_files', 'files', 'incremental'] - ] - }, - 'binlog_stmt_cache': { - 'options': [None, 'Binlog Statement Cache', 'statements/s', 'binlog', - 'mysql.binlog_stmt_cache', 'line'], - 'lines': [ - ['Binlog_stmt_cache_disk_use', 'disk', 'incremental'], - ['Binlog_stmt_cache_use', 'all', 'incremental'] - ] - }, - 'connection_errors': { - 'options': [None, 'Connection Errors', 'connections/s', 'connections', - 'mysql.connection_errors', 'line'], - 'lines': [ - ['Connection_errors_accept', 'accept', 'incremental'], - ['Connection_errors_internal', 'internal', 'incremental'], - ['Connection_errors_max_connections', 'max', 'incremental'], - ['Connection_errors_peer_address', 'peer_addr', 'incremental'], - ['Connection_errors_select', 'select', 'incremental'], - ['Connection_errors_tcpwrap', 'tcpwrap', 'incremental'] - ] - }, - 'slave_behind': { - 'options': [None, 'Slave Behind Seconds', 'seconds', 'slave', 'mysql.slave_behind', 'line'], - 'lines': [ - ['Seconds_Behind_Master', 'seconds', 'absolute'] - ] - }, - 'slave_status': { - 'options': [None, 'Slave Status', 'status', 'slave', 'mysql.slave_status', 'line'], - 'lines': [ - ['Slave_SQL_Running', 'sql_running', 'absolute'], - ['Slave_IO_Running', 'io_running', 'absolute'] - ] - }, - 'galera_writesets': { - 'options': [None, 'Replicated Writesets', 'writesets/s', 'galera', 'mysql.galera_writesets', 'line'], - 'lines': [ - ['wsrep_received', 'rx', 'incremental'], - ['wsrep_replicated', 'tx', 'incremental', -1, 1], - ] - }, - 'galera_bytes': { - 'options': [None, 'Replicated Bytes', 'KiB/s', 'galera', 'mysql.galera_bytes', 'area'], - 'lines': [ - ['wsrep_received_bytes', 'rx', 'incremental', 1, 1024], - ['wsrep_replicated_bytes', 'tx', 'incremental', -1, 1024], - ] - }, - 'galera_queue': { - 'options': [None, 'Galera Queue', 'writesets', 'galera', 'mysql.galera_queue', 'line'], - 'lines': [ - ['wsrep_local_recv_queue', 'rx', 'absolute'], - ['wsrep_local_send_queue', 'tx', 'absolute', -1, 1], - ] - }, - 'galera_conflicts': { - 'options': [None, 'Replication Conflicts', 'transactions', 'galera', 'mysql.galera_conflicts', 'area'], - 'lines': [ - ['wsrep_local_bf_aborts', 'bf_aborts', 'incremental'], - ['wsrep_local_cert_failures', 'cert_fails', 'incremental', -1, 1], - ] - }, - 'galera_flow_control': { - 'options': [None, 'Flow Control', 'millisec', 'galera', 'mysql.galera_flow_control', 'area'], - 'lines': [ - ['wsrep_flow_control_paused_ns', 'paused', 'incremental', 1, 1000000], - ] - }, - 'galera_cluster_status': { - 'options': [None, 'Cluster Component Status', 'status', 'galera', 'mysql.galera_cluster_status', 'line'], - 'lines': [ - ['wsrep_cluster_status', 'status', 'absolute'], - ] - }, - 'galera_cluster_state': { - 'options': [None, 'Cluster Component State', 'state', 'galera', 'mysql.galera_cluster_state', 'line'], - 'lines': [ - ['wsrep_local_state', 'state', 'absolute'], - ] - }, - 'galera_cluster_size': { - 'options': [None, 'Number of Nodes in the Cluster', 'num', 'galera', 'mysql.galera_cluster_size', 'line'], - 'lines': [ - ['wsrep_cluster_size', 'nodes', 'absolute'], - ] - }, - 'galera_cluster_weight': { - 'options': [None, 'The Total Weight of the Current Members in the Cluster', 'weight', 'galera', - 'mysql.galera_cluster_weight', 'line'], - 'lines': [ - ['wsrep_cluster_weight', 'weight', 'absolute'], - ] - }, - 'galera_connected': { - 'options': [None, 'Whether the Node is Connected to the Cluster', 'boolean', 'galera', - 'mysql.galera_connected', 'line'], - 'lines': [ - ['wsrep_connected', 'connected', 'absolute'], - ] - }, - 'galera_ready': { - 'options': [None, 'Whether the Node is Ready to Accept Queries', 'boolean', 'galera', - 'mysql.galera_ready', 'line'], - 'lines': [ - ['wsrep_ready', 'ready', 'absolute'], - ] - }, - 'galera_open_transactions': { - 'options': [None, 'Open Transactions', 'num', 'galera', 'mysql.galera_open_transactions', 'line'], - 'lines': [ - ['wsrep_open_transactions', 'open transactions', 'absolute'], - ] - }, - 'galera_thread_count': { - 'options': [None, 'Total Number of WSRep (applier/rollbacker) Threads', 'num', 'galera', - 'mysql.galera_thread_count', 'line'], - 'lines': [ - ['wsrep_thread_count', 'threads', 'absolute'], - ] - }, - 'userstats_cpu': { - 'options': [None, 'Users CPU time', 'percentage', 'userstats', 'mysql.userstats_cpu', 'stacked'], - 'lines': [] - } -} - - -def slave_status_chart_template(channel_name): - order = [ - 'slave_behind_{0}'.format(channel_name), - 'slave_status_{0}'.format(channel_name) - ] - - charts = { - order[0]: { - 'options': [None, 'Slave Behind Seconds Channel {0}'.format(channel_name), - 'seconds', 'slave', 'mysql.slave_behind', 'line'], - 'lines': [ - ['Seconds_Behind_Master_{0}'.format(channel_name), 'seconds', 'absolute'] - ] - }, - order[1]: { - 'options': [None, 'Slave Status Channel {0}'.format(channel_name), - 'status', 'slave', 'mysql.slave_status', 'line'], - 'lines': [ - ['Slave_SQL_Running_{0}'.format(channel_name), 'sql_running', 'absolute'], - ['Slave_IO_Running_{0}'.format(channel_name), 'io_running', 'absolute'] - ] - }, - } - - return order, charts - - -def userstats_chart_template(name): - order = [ - 'userstats_rows_{0}'.format(name), - 'userstats_commands_{0}'.format(name) - ] - family = 'userstats {0}'.format(name) - - charts = { - order[0]: { - 'options': [None, 'Rows Operations', 'operations/s', family, 'mysql.userstats_rows', 'stacked'], - 'lines': [ - ['userstats_{0}_Rows_read'.format(name), 'read', 'incremental'], - ['userstats_{0}_Rows_send'.format(name), 'send', 'incremental'], - ['userstats_{0}_Rows_updated'.format(name), 'updated', 'incremental'], - ['userstats_{0}_Rows_inserted'.format(name), 'inserted', 'incremental'], - ['userstats_{0}_Rows_deleted'.format(name), 'deleted', 'incremental'] - ] - }, - order[1]: { - 'options': [None, 'Commands', 'commands/s', family, 'mysql.userstats_commands', 'stacked'], - 'lines': [ - ['userstats_{0}_Select_commands'.format(name), 'select', 'incremental'], - ['userstats_{0}_Update_commands'.format(name), 'update', 'incremental'], - ['userstats_{0}_Other_commands'.format(name), 'other', 'incremental'] - ] - } - } - - return order, charts - - -# https://dev.mysql.com/doc/refman/8.0/en/replication-channels.html -DEFAULT_REPL_CHANNEL = '' - - -# Write Set REPlication -# https://galeracluster.com/library/documentation/galera-status-variables.html -# https://www.percona.com/doc/percona-xtradb-cluster/LATEST/wsrep-status-index.html -class WSRepDataConverter: - unknown_value = -1 - - def convert(self, key, value): - if key == 'wsrep_connected': - return self.convert_connected(value) - elif key == 'wsrep_ready': - return self.convert_ready(value) - elif key == 'wsrep_cluster_status': - return self.convert_cluster_status(value) - return value - - def convert_connected(self, value): - # https://www.percona.com/doc/percona-xtradb-cluster/LATEST/wsrep-status-index.html#wsrep_connected - if value == 'OFF': - return 0 - if value == 'ON': - return 1 - return self.unknown_value - - def convert_ready(self, value): - # https://www.percona.com/doc/percona-xtradb-cluster/LATEST/wsrep-status-index.html#wsrep_ready - if value == 'OFF': - return 0 - if value == 'ON': - return 1 - return self.unknown_value - - def convert_cluster_status(self, value): - # https://www.percona.com/doc/percona-xtradb-cluster/LATEST/wsrep-status-index.html#wsrep_cluster_status - # https://github.com/codership/wsrep-API/blob/eab2d5d5a31672c0b7d116ef1629ff18392fd7d0/wsrep_api.h - # typedef enum wsrep_view_status { - # WSREP_VIEW_PRIMARY, //!< primary group configuration (quorum present) - # WSREP_VIEW_NON_PRIMARY, //!< non-primary group configuration (quorum lost) - # WSREP_VIEW_DISCONNECTED, //!< not connected to group, retrying. - # WSREP_VIEW_MAX - # } wsrep_view_status_t; - value = value.lower() - if value == 'primary': - return 0 - elif value == 'non-primary': - return 1 - elif value == 'disconnected': - return 2 - return self.unknown_value - - -wsrep_converter = WSRepDataConverter() - - -class Service(MySQLService): - def __init__(self, configuration=None, name=None): - MySQLService.__init__(self, configuration=configuration, name=name) - self.order = ORDER - self.definitions = CHARTS - self.queries = dict( - global_status=QUERY_GLOBAL, - slave_status=QUERY_SLAVE, - variables=QUERY_VARIABLES, - user_statistics=QUERY_USER_STATISTICS, - ) - self.repl_channels = [DEFAULT_REPL_CHANNEL] - - def _get_data(self): - - raw_data = self._get_raw_data(description=True) - - if not raw_data: - return None - - data = dict() - - if 'global_status' in raw_data: - global_status = self.get_global_status(raw_data['global_status']) - if global_status: - data.update(global_status) - - if 'slave_status' in raw_data: - status = self.get_slave_status(raw_data['slave_status']) - if status: - data.update(status) - - if 'user_statistics' in raw_data: - if raw_data['user_statistics'][0]: - data.update(self.get_userstats(raw_data)) - else: - self.queries.pop('user_statistics') - - if 'variables' in raw_data: - variables = dict(raw_data['variables'][0]) - for key in VARIABLES: - if key in variables: - data[key] = variables[key] - - return data or None - - @staticmethod - def convert_wsrep(key, value): - return wsrep_converter.convert(key, value) - - def get_global_status(self, raw_global_status): - # ( - # ( - # ('Aborted_clients', '18'), - # ('Aborted_connects', '33'), - # ('Access_denied_errors', '80'), - # ('Acl_column_grants', '0'), - # ('Acl_database_grants', '0'), - # ('Acl_function_grants', '0'), - # ('wsrep_ready', 'OFF'), - # ('wsrep_rollbacker_thread_count', '0'), - # ('wsrep_thread_count', '0') - # ), - # ( - # ('Variable_name', 253, 60, 64, 64, 0, 0), - # ('Value', 253, 48, 2048, 2048, 0, 0), - # ) - # ) - rows = raw_global_status[0] - if not rows: - return - - global_status = dict(rows) - data = dict() - - for key in GLOBAL_STATS: - if key not in global_status: - continue - value = global_status[key] - data[key] = value - - for key in GALERA_STATS: - if key not in global_status: - continue - value = global_status[key] - value = self.convert_wsrep(key, value) - data[key] = value - - if 'Threads_created' in data and 'Connections' in data: - data['Thread_cache_misses'] = round(int(data['Threads_created']) / float(data['Connections']) * 10000) - return data - - def get_slave_status(self, slave_status_data): - rows, description = slave_status_data[0], slave_status_data[1] - description_keys = [v[0] for v in description] - if not rows: - return - - data = dict() - for row in rows: - slave_data = dict(zip(description_keys, row)) - channel_name = slave_data.get('Channel_Name', DEFAULT_REPL_CHANNEL) - - if channel_name not in self.repl_channels and len(self.charts) > 0: - self.add_repl_channel_charts(channel_name) - self.repl_channels.append(channel_name) - - for key, func in SLAVE_STATS: - if key not in slave_data: - continue - - value = slave_data[key] - if channel_name: - key = '{0}_{1}'.format(key, channel_name) - data[key] = func(value) - - return data - - def add_repl_channel_charts(self, name): - self.add_new_charts(slave_status_chart_template, name) - - def get_userstats(self, raw_data): - # ( - # ( - # ('netdata', 1L, 0L, 60L, 0.15842499999999984, 0.15767439999999996, 5206L, 963957L, 0L, 0L, - # 61L, 0L, 0L, 0L, 0L, 0L, 62L, 0L, 0L, 0L, 0L, 0L, 0L, 0L, 0L), - # ), - # ( - # ('User', 253, 7, 128, 128, 0, 0), - # ('Total_connections', 3, 2, 11, 11, 0, 0), - # ('Concurrent_connections', 3, 1, 11, 11, 0, 0), - # ('Connected_time', 3, 2, 11, 11, 0, 0), - # ('Busy_time', 5, 20, 21, 21, 31, 0), - # ('Cpu_time', 5, 20, 21, 21, 31, 0), - # ('Bytes_received', 8, 4, 21, 21, 0, 0), - # ('Bytes_sent', 8, 6, 21, 21, 0, 0), - # ('Binlog_bytes_written', 8, 1, 21, 21, 0, 0), - # ('Rows_read', 8, 1, 21, 21, 0, 0), - # ('Rows_sent', 8, 2, 21, 21, 0, 0), - # ('Rows_deleted', 8, 1, 21, 21, 0, 0), - # ('Rows_inserted', 8, 1, 21, 21, 0, 0), - # ('Rows_updated', 8, 1, 21, 21, 0, 0), - # ('Select_commands', 8, 2, 21, 21, 0, 0), - # ('Update_commands', 8, 1, 21, 21, 0, 0), - # ('Other_commands', 8, 2, 21, 21, 0, 0), - # ('Commit_transactions', 8, 1, 21, 21, 0, 0), - # ('Rollback_transactions', 8, 1, 21, 21, 0, 0), - # ('Denied_connections', 8, 1, 21, 21, 0, 0), - # ('Lost_connections', 8, 1, 21, 21, 0, 0), - # ('Access_denied', 8, 1, 21, 21, 0, 0), - # ('Empty_queries', 8, 2, 21, 21, 0, 0), - # ('Total_ssl_connections', 8, 1, 21, 21, 0, 0), - # ('Max_statement_time_exceeded', 8, 1, 21, 21, 0, 0) - # ) - # ) - data = dict() - userstats_vars = [e[0] for e in raw_data['user_statistics'][1]] - for i, _ in enumerate(raw_data['user_statistics'][0]): - user_name = raw_data['user_statistics'][0][i][0] - userstats = dict(zip(userstats_vars, raw_data['user_statistics'][0][i])) - - if len(self.charts) > 0: - if ('userstats_{0}_Cpu_time'.format(user_name)) not in self.charts['userstats_cpu']: - self.add_userstats_dimensions(user_name) - self.create_new_userstats_charts(user_name) - - for key in USER_STATISTICS: - if key in userstats: - data['userstats_{0}_{1}'.format(user_name, key)] = userstats[key] - - return data - - def add_userstats_dimensions(self, name): - self.charts['userstats_cpu'].add_dimension(['userstats_{0}_Cpu_time'.format(name), name, 'incremental', 100, 1]) - - def create_new_userstats_charts(self, tube): - self.add_new_charts(userstats_chart_template, tube) - - def add_new_charts(self, template, *params): - order, charts = template(*params) - - for chart_name in order: - params = [chart_name] + charts[chart_name]['options'] - dimensions = charts[chart_name]['lines'] - - new_chart = self.charts.add_chart(params) - for dimension in dimensions: - new_chart.add_dimension(dimension) diff --git a/collectors/python.d.plugin/mysql/mysql.conf b/collectors/python.d.plugin/mysql/mysql.conf deleted file mode 100644 index 31bfe9c02..000000000 --- a/collectors/python.d.plugin/mysql/mysql.conf +++ /dev/null @@ -1,293 +0,0 @@ -# netdata python.d.plugin configuration for mysql -# -# This file is in YaML format. Generally the format is: -# -# name: value -# -# There are 2 sections: -# - global variables -# - one or more JOBS -# -# JOBS allow you to collect values from multiple sources. -# Each source will have its own set of charts. -# -# JOB parameters have to be indented (using spaces only, example below). - -# ---------------------------------------------------------------------- -# Global Variables -# These variables set the defaults for all JOBs, however each JOB -# may define its own, overriding the defaults. - -# update_every sets the default data collection frequency. -# If unset, the python.d.plugin default is used. -# update_every: 1 - -# priority controls the order of charts at the netdata dashboard. -# Lower numbers move the charts towards the top of the page. -# If unset, the default for python.d.plugin is used. -# priority: 60000 - -# penalty indicates whether to apply penalty to update_every in case of failures. -# Penalty will increase every 5 failed updates in a row. Maximum penalty is 10 minutes. -# penalty: yes - - -# autodetection_retry sets the job re-check interval in seconds. -# The job is not deleted if check fails. -# Attempts to start the job are made once every autodetection_retry. -# This feature is disabled by default. -# autodetection_retry: 0 - -# ---------------------------------------------------------------------- -# JOBS (data collection sources) -# -# The default JOBS share the same *name*. JOBS with the same name -# are mutually exclusive. Only one of them will be allowed running at -# any time. This allows autodetection to try several alternatives and -# pick the one that works. -# -# Any number of jobs is supported. -# -# All python.d.plugin JOBS (for all its modules) support a set of -# predefined parameters. These are: -# -# job_name: -# name: myname # the JOB's name as it will appear at the -# # dashboard (by default is the job_name) -# # JOBs sharing a name are mutually exclusive -# update_every: 1 # the JOB's data collection frequency -# priority: 60000 # the JOB's order on the dashboard -# penalty: yes # the JOB's penalty -# autodetection_retry: 0 # the JOB's re-check interval in seconds -# -# Additionally to the above, mysql also supports the following: -# -# socket: 'path/to/mysql.sock' -# -# or -# host: 'IP or HOSTNAME' # the host to connect to -# port: PORT # the port to connect to -# -# in all cases, the following can also be set: -# -# user: 'username' # the mysql username to use -# pass: 'password' # the mysql password to use -# -# ssl connection parameters -# -# ssl: -# key: 'key' # the path name of the client private key file. -# cert: 'cert' # the path name of the client public key certificate file. -# ca: 'ca' # the path name of the Certificate Authority (CA) certificate file. This option, if used, must specify the same certificate used by the server. -# capath: 'capath' # the path name of the directory that contains trusted SSL CA certificate files. -# cipher: [ciphers] # the list of permitted ciphers for SSL encryption. - -# ---------------------------------------------------------------------- -# mySQL CONFIGURATION -# -# netdata does not need any privilege - only the ability to connect -# to the mysql server (netdata will not be able to see any data). -# -# Execute these commands to give the local user 'netdata' the ability -# to connect to the mysql server on localhost, without a password: -# -# > create user 'netdata'@'localhost'; -# > grant usage on *.* to 'netdata'@'localhost'; -# > flush privileges; -# -# with the above statements, netdata will be able to gather mysql -# statistics, without the ability to see or alter any data or affect -# mysql operation in any way. No change is required below. -# -# If you need to monitor mysql replication too, use this instead: -# -# > create user 'netdata'@'localhost'; -# > grant replication client on *.* to 'netdata'@'localhost'; -# > flush privileges; -# - -# ---------------------------------------------------------------------- -# AUTO-DETECTION JOBS -# only one of them will run (they have the same name) - -mycnf1: - name : 'local' - 'my.cnf' : '/etc/my.cnf' - -mycnf2: - name : 'local' - 'my.cnf' : '/etc/mysql/my.cnf' - -debiancnf: - name : 'local' - 'my.cnf' : '/etc/mysql/debian.cnf' - -socket1: - name : 'local' - # user : '' - # pass : '' - socket : '/var/run/mysqld/mysqld.sock' - -socket2: - name : 'local' - # user : '' - # pass : '' - socket : '/var/run/mysqld/mysql.sock' - -socket3: - name : 'local' - # user : '' - # pass : '' - socket : '/var/lib/mysql/mysql.sock' - -socket4: - name : 'local' - # user : '' - # pass : '' - socket : '/tmp/mysql.sock' - -tcp: - name : 'local' - # user : '' - # pass : '' - host : 'localhost' - port : '3306' - # keep in mind port might be ignored by mysql, if host = 'localhost' - # http://serverfault.com/questions/337818/how-to-force-mysql-to-connect-by-tcp-instead-of-a-unix-socket/337844#337844 - -tcpipv4: - name : 'local' - # user : '' - # pass : '' - host : '127.0.0.1' - port : '3306' - -tcpipv6: - name : 'local' - # user : '' - # pass : '' - host : '::1' - port : '3306' - - -# Now we try the same as above with user: root -# A few systems configure mysql to accept passwordless -# root access. - -mycnf1_root: - name : 'local' - user : 'root' - 'my.cnf' : '/etc/my.cnf' - -mycnf2_root: - name : 'local' - user : 'root' - 'my.cnf' : '/etc/mysql/my.cnf' - -socket1_root: - name : 'local' - user : 'root' - # pass : '' - socket : '/var/run/mysqld/mysqld.sock' - -socket2_root: - name : 'local' - user : 'root' - # pass : '' - socket : '/var/run/mysqld/mysql.sock' - -socket3_root: - name : 'local' - user : 'root' - # pass : '' - socket : '/var/lib/mysql/mysql.sock' - -socket4_root: - name : 'local' - user : 'root' - # pass : '' - socket : '/tmp/mysql.sock' - -tcp_root: - name : 'local' - user : 'root' - # pass : '' - host : 'localhost' - port : '3306' - # keep in mind port might be ignored by mysql, if host = 'localhost' - # http://serverfault.com/questions/337818/how-to-force-mysql-to-connect-by-tcp-instead-of-a-unix-socket/337844#337844 - -tcpipv4_root: - name : 'local' - user : 'root' - # pass : '' - host : '127.0.0.1' - port : '3306' - -tcpipv6_root: - name : 'local' - user : 'root' - # pass : '' - host : '::1' - port : '3306' - - -# Now we try the same as above with user: netdata - -mycnf1_netdata: - name : 'local' - user : 'netdata' - 'my.cnf' : '/etc/my.cnf' - -mycnf2_netdata: - name : 'local' - user : 'netdata' - 'my.cnf' : '/etc/mysql/my.cnf' - -socket1_netdata: - name : 'local' - user : 'netdata' - # pass : '' - socket : '/var/run/mysqld/mysqld.sock' - -socket2_netdata: - name : 'local' - user : 'netdata' - # pass : '' - socket : '/var/run/mysqld/mysql.sock' - -socket3_netdata: - name : 'local' - user : 'netdata' - # pass : '' - socket : '/var/lib/mysql/mysql.sock' - -socket4_netdata: - name : 'local' - user : 'netdata' - # pass : '' - socket : '/tmp/mysql.sock' - -tcp_netdata: - name : 'local' - user : 'netdata' - # pass : '' - host : 'localhost' - port : '3306' - # keep in mind port might be ignored by mysql, if host = 'localhost' - # http://serverfault.com/questions/337818/how-to-force-mysql-to-connect-by-tcp-instead-of-a-unix-socket/337844#337844 - -tcpipv4_netdata: - name : 'local' - user : 'netdata' - # pass : '' - host : '127.0.0.1' - port : '3306' - -tcpipv6_netdata: - name : 'local' - user : 'netdata' - # pass : '' - host : '::1' - port : '3306' - diff --git a/collectors/python.d.plugin/nginx/Makefile.inc b/collectors/python.d.plugin/nginx/Makefile.inc deleted file mode 100644 index 4636aa830..000000000 --- a/collectors/python.d.plugin/nginx/Makefile.inc +++ /dev/null @@ -1,13 +0,0 @@ -# SPDX-License-Identifier: GPL-3.0-or-later - -# THIS IS NOT A COMPLETE Makefile -# IT IS INCLUDED BY ITS PARENT'S Makefile.am -# IT IS REQUIRED TO REFERENCE ALL FILES RELATIVE TO THE PARENT - -# install these files -dist_python_DATA += nginx/nginx.chart.py -dist_pythonconfig_DATA += nginx/nginx.conf - -# do not install these files, but include them in the distribution -dist_noinst_DATA += nginx/README.md nginx/Makefile.inc - diff --git a/collectors/python.d.plugin/nginx/README.md b/collectors/python.d.plugin/nginx/README.md deleted file mode 100644 index 34f63cc52..000000000 --- a/collectors/python.d.plugin/nginx/README.md +++ /dev/null @@ -1,65 +0,0 @@ -<!-- -title: "NGINX monitoring with Netdata" -custom_edit_url: https://github.com/netdata/netdata/edit/master/collectors/python.d.plugin/nginx/README.md -sidebar_label: "NGINX" ---> - -# NGINX monitoring with Netdata - -Monitors one or more NGINX servers depending on configuration. Servers can be either local or remote. - -## Requirements - -- nginx with configured 'ngx_http_stub_status_module' -- 'location /stub_status' - -Example nginx configuration can be found in 'python.d/nginx.conf' - -It produces following charts: - -1. **Active Connections** - - - active - -2. **Requests** in requests/s - - - requests - -3. **Active Connections by Status** - - - reading - - writing - - waiting - -4. **Connections Rate** in connections/s - - - accepts - - handled - -## Configuration - -Edit the `python.d/nginx.conf` configuration file using `edit-config` from the Netdata [config -directory](/docs/configure/nodes.md), which is typically at `/etc/netdata`. - -```bash -cd /etc/netdata # Replace this path with your Netdata config directory, if different -sudo ./edit-config python.d/nginx.conf -``` - -Needs only `url` to server's `stub_status`. - -Here is an example for local server: - -```yaml -update_every : 10 -priority : 90100 - -local: - url : 'http://localhost/stub_status' -``` - -Without configuration, module attempts to connect to `http://localhost/stub_status` - ---- - - diff --git a/collectors/python.d.plugin/nginx/nginx.chart.py b/collectors/python.d.plugin/nginx/nginx.chart.py deleted file mode 100644 index 7548d6a42..000000000 --- a/collectors/python.d.plugin/nginx/nginx.chart.py +++ /dev/null @@ -1,71 +0,0 @@ -# -*- coding: utf-8 -*- -# Description: nginx netdata python.d module -# Author: Pawel Krupa (paulfantom) -# SPDX-License-Identifier: GPL-3.0-or-later - -from bases.FrameworkServices.UrlService import UrlService - -ORDER = [ - 'connections', - 'requests', - 'connection_status', - 'connect_rate', -] - -CHARTS = { - 'connections': { - 'options': [None, 'Active Connections', 'connections', 'active connections', - 'nginx.connections', 'line'], - 'lines': [ - ['active'] - ] - }, - 'requests': { - 'options': [None, 'Requests', 'requests/s', 'requests', 'nginx.requests', 'line'], - 'lines': [ - ['requests', None, 'incremental'] - ] - }, - 'connection_status': { - 'options': [None, 'Active Connections by Status', 'connections', 'status', - 'nginx.connection_status', 'line'], - 'lines': [ - ['reading'], - ['writing'], - ['waiting', 'idle'] - ] - }, - 'connect_rate': { - 'options': [None, 'Connections Rate', 'connections/s', 'connections rate', - 'nginx.connect_rate', 'line'], - 'lines': [ - ['accepts', 'accepted', 'incremental'], - ['handled', None, 'incremental'] - ] - } -} - - -class Service(UrlService): - def __init__(self, configuration=None, name=None): - UrlService.__init__(self, configuration=configuration, name=name) - self.order = ORDER - self.definitions = CHARTS - self.url = self.configuration.get('url', 'http://localhost/stub_status') - - def _get_data(self): - """ - Format data received from http request - :return: dict - """ - try: - raw = self._get_raw_data().split(" ") - return {'active': int(raw[2]), - 'requests': int(raw[9]), - 'reading': int(raw[11]), - 'writing': int(raw[13]), - 'waiting': int(raw[15]), - 'accepts': int(raw[7]), - 'handled': int(raw[8])} - except (ValueError, AttributeError): - return None diff --git a/collectors/python.d.plugin/nginx/nginx.conf b/collectors/python.d.plugin/nginx/nginx.conf deleted file mode 100644 index 4001b4bbe..000000000 --- a/collectors/python.d.plugin/nginx/nginx.conf +++ /dev/null @@ -1,107 +0,0 @@ -# netdata python.d.plugin configuration for nginx -# -# You must have ngx_http_stub_status_module configured on your nginx server for this -# plugin to work. The following is an example config. -# It must be located inside a server { } block. -# -# location /stub_status { -# stub_status; -# # Security: Only allow access from the IP below. -# allow 192.168.1.200; -# # Deny anyone else -# deny all; -# } -# -# This file is in YaML format. Generally the format is: -# -# name: value -# -# There are 2 sections: -# - global variables -# - one or more JOBS -# -# JOBS allow you to collect values from multiple sources. -# Each source will have its own set of charts. -# -# JOB parameters have to be indented (using spaces only, example below). - -# ---------------------------------------------------------------------- -# Global Variables -# These variables set the defaults for all JOBs, however each JOB -# may define its own, overriding the defaults. - -# update_every sets the default data collection frequency. -# If unset, the python.d.plugin default is used. -# update_every: 1 - -# priority controls the order of charts at the netdata dashboard. -# Lower numbers move the charts towards the top of the page. -# If unset, the default for python.d.plugin is used. -# priority: 60000 - -# penalty indicates whether to apply penalty to update_every in case of failures. -# Penalty will increase every 5 failed updates in a row. Maximum penalty is 10 minutes. -# penalty: yes - -# autodetection_retry sets the job re-check interval in seconds. -# The job is not deleted if check fails. -# Attempts to start the job are made once every autodetection_retry. -# This feature is disabled by default. -# autodetection_retry: 0 - -# ---------------------------------------------------------------------- -# JOBS (data collection sources) -# -# The default JOBS share the same *name*. JOBS with the same name -# are mutually exclusive. Only one of them will be allowed running at -# any time. This allows autodetection to try several alternatives and -# pick the one that works. -# -# Any number of jobs is supported. -# -# All python.d.plugin JOBS (for all its modules) support a set of -# predefined parameters. These are: -# -# job_name: -# name: myname # the JOB's name as it will appear at the -# # dashboard (by default is the job_name) -# # JOBs sharing a name are mutually exclusive -# update_every: 1 # the JOB's data collection frequency -# priority: 60000 # the JOB's order on the dashboard -# penalty: yes # the JOB's penalty -# autodetection_retry: 0 # the JOB's re-check interval in seconds -# -# Additionally to the above, this plugin also supports the following: -# -# url: 'URL' # the URL to fetch nginx's status stats -# -# if the URL is password protected, the following are supported: -# -# user: 'username' -# pass: 'password' -# -# Example -# -# RemoteNginx: -# name : 'Reverse_Proxy' -# url : 'http://yourdomain.com/stub_status' -# -# "RemoteNginx" will show up in Netdata logs. "Reverse Proxy" will show up in the menu -# in the nginx section. - -# ---------------------------------------------------------------------- -# AUTO-DETECTION JOBS -# only one of them will run (they have the same name) - -localhost: - name : 'local' - url : 'http://localhost/stub_status' - -localipv4: - name : 'local' - url : 'http://127.0.0.1/stub_status' - -localipv6: - name : 'local' - url : 'http://[::1]/stub_status' - diff --git a/collectors/python.d.plugin/phpfpm/Makefile.inc b/collectors/python.d.plugin/phpfpm/Makefile.inc deleted file mode 100644 index ff312fe18..000000000 --- a/collectors/python.d.plugin/phpfpm/Makefile.inc +++ /dev/null @@ -1,13 +0,0 @@ -# SPDX-License-Identifier: GPL-3.0-or-later - -# THIS IS NOT A COMPLETE Makefile -# IT IS INCLUDED BY ITS PARENT'S Makefile.am -# IT IS REQUIRED TO REFERENCE ALL FILES RELATIVE TO THE PARENT - -# install these files -dist_python_DATA += phpfpm/phpfpm.chart.py -dist_pythonconfig_DATA += phpfpm/phpfpm.conf - -# do not install these files, but include them in the distribution -dist_noinst_DATA += phpfpm/README.md phpfpm/Makefile.inc - diff --git a/collectors/python.d.plugin/phpfpm/README.md b/collectors/python.d.plugin/phpfpm/README.md deleted file mode 100644 index fe81971b2..000000000 --- a/collectors/python.d.plugin/phpfpm/README.md +++ /dev/null @@ -1,51 +0,0 @@ -<!-- -title: "PHP-FPM monitoring with Netdata" -custom_edit_url: https://github.com/netdata/netdata/edit/master/collectors/python.d.plugin/phpfpm/README.md -sidebar_label: "PHP-FPM" ---> - -# PHP-FPM monitoring with Netdata - -Monitors one or more PHP-FPM instances depending on configuration. - -## Requirements - -- `PHP-FPM` with [enabled `status` page](https://easyengine.io/tutorials/php/fpm-status-page/) -- access to `status` page via web server - -## Charts - -It produces following charts: - -- Active Connections in `connections` -- Requests in `requests/s` -- Performance in `status` -- Requests Duration Among All Idle Processes in `milliseconds` -- Last Request CPU Usage Among All Idle Processes in `percentage` -- Last Request Memory Usage Among All Idle Processes in `KB` - -## Configuration - -Edit the `python.d/phpfpm.conf` configuration file using `edit-config` from the Netdata [config -directory](/docs/configure/nodes.md), which is typically at `/etc/netdata`. - -```bash -cd /etc/netdata # Replace this path with your Netdata config directory, if different -sudo ./edit-config python.d/phpfpm.conf -``` - -Needs only `url` to server's `status`. Here is an example for local and remote instances: - -```yaml -local: - url : 'http://localhost/status?full&json' - -remote: - url : 'http://203.0.113.10/status?full&json' -``` - -Without configuration, module attempts to connect to `http://localhost/status` - ---- - - diff --git a/collectors/python.d.plugin/phpfpm/phpfpm.chart.py b/collectors/python.d.plugin/phpfpm/phpfpm.chart.py deleted file mode 100644 index 226df99c6..000000000 --- a/collectors/python.d.plugin/phpfpm/phpfpm.chart.py +++ /dev/null @@ -1,174 +0,0 @@ -# -*- coding: utf-8 -*- -# Description: PHP-FPM netdata python.d module -# Author: Pawel Krupa (paulfantom) -# Author: Ilya Mashchenko (ilyam8) -# SPDX-License-Identifier: GPL-3.0-or-later - -import json -import re - -from bases.FrameworkServices.UrlService import UrlService - -REGEX = re.compile(r'([a-z][a-z ]+): ([\d.]+)') - -POOL_INFO = [ - ('active processes', 'active'), - ('max active processes', 'maxActive'), - ('idle processes', 'idle'), - ('accepted conn', 'requests'), - ('max children reached', 'reached'), - ('slow requests', 'slow') -] - -PER_PROCESS_INFO = [ - ('request duration', 'ReqDur'), - ('last request cpu', 'ReqCpu'), - ('last request memory', 'ReqMem') -] - - -def average(collection): - return sum(collection, 0.0) / max(len(collection), 1) - - -CALC = [ - ('min', min), - ('max', max), - ('avg', average) -] - -ORDER = [ - 'connections', - 'requests', - 'performance', - 'request_duration', - 'request_cpu', - 'request_mem', -] - -CHARTS = { - 'connections': { - 'options': [None, 'PHP-FPM Active Connections', 'connections', 'active connections', 'phpfpm.connections', - 'line'], - 'lines': [ - ['active'], - ['maxActive', 'max active'], - ['idle'] - ] - }, - 'requests': { - 'options': [None, 'PHP-FPM Requests', 'requests/s', 'requests', 'phpfpm.requests', 'line'], - 'lines': [ - ['requests', None, 'incremental'] - ] - }, - 'performance': { - 'options': [None, 'PHP-FPM Performance', 'status', 'performance', 'phpfpm.performance', 'line'], - 'lines': [ - ['reached', 'max children reached'], - ['slow', 'slow requests'] - ] - }, - 'request_duration': { - 'options': [None, 'PHP-FPM Requests Duration Among All Idle Processes', 'milliseconds', 'request duration', - 'phpfpm.request_duration', - 'line'], - 'lines': [ - ['minReqDur', 'min', 'absolute', 1, 1000], - ['maxReqDur', 'max', 'absolute', 1, 1000], - ['avgReqDur', 'avg', 'absolute', 1, 1000] - ] - }, - 'request_cpu': { - 'options': [None, 'PHP-FPM Last Request CPU Usage Among All Idle Processes', 'percentage', 'request CPU', - 'phpfpm.request_cpu', 'line'], - 'lines': [ - ['minReqCpu', 'min'], - ['maxReqCpu', 'max'], - ['avgReqCpu', 'avg'] - ] - }, - 'request_mem': { - 'options': [None, 'PHP-FPM Last Request Memory Usage Among All Idle Processes', 'KB', 'request memory', - 'phpfpm.request_mem', 'line'], - 'lines': [ - ['minReqMem', 'min', 'absolute', 1, 1024], - ['maxReqMem', 'max', 'absolute', 1, 1024], - ['avgReqMem', 'avg', 'absolute', 1, 1024] - ] - } -} - - -class Service(UrlService): - def __init__(self, configuration=None, name=None): - UrlService.__init__(self, configuration=configuration, name=name) - self.order = ORDER - self.definitions = CHARTS - self.url = self.configuration.get('url', 'http://localhost/status?full&json') - self.json = '&json' in self.url or '?json' in self.url - self.json_full = self.url.endswith(('?full&json', '?json&full')) - self.if_all_processes_running = dict( - [(c_name + p_name, 0) for c_name, func in CALC for metric, p_name in PER_PROCESS_INFO] - ) - - def _get_data(self): - """ - Format data received from http request - :return: dict - """ - raw = self._get_raw_data() - if not raw: - return None - - raw_json = parse_raw_data_(is_json=self.json, raw_data=raw) - - # Per Pool info: active connections, requests and performance charts - to_netdata = fetch_data_(raw_data=raw_json, metrics_list=POOL_INFO) - - # Per Process Info: duration, cpu and memory charts (min, max, avg) - if self.json_full: - p_info = dict() - to_netdata.update(self.if_all_processes_running) # If all processes are in running state - # Metrics are always 0 if the process is not in Idle state because calculation is done - # when the request processing has terminated - for process in [p for p in raw_json['processes'] if p['state'] == 'Idle']: - p_info.update(fetch_data_(raw_data=process, metrics_list=PER_PROCESS_INFO, pid=str(process['pid']))) - - if p_info: - for new_name in PER_PROCESS_INFO: - for name, func in CALC: - to_netdata[name + new_name[1]] = func([p_info[k] for k in p_info if new_name[1] in k]) - - return to_netdata or None - - -def fetch_data_(raw_data, metrics_list, pid=''): - """ - :param raw_data: dict - :param metrics_list: list - :param pid: str - :return: dict - """ - result = dict() - for metric, new_name in metrics_list: - if metric in raw_data: - result[new_name + pid] = float(raw_data[metric]) - return result - - -def parse_raw_data_(is_json, raw_data): - """ - :param is_json: bool - :param regex: compiled regular expr - :param raw_data: dict - :return: dict - """ - if is_json: - try: - return json.loads(raw_data) - except ValueError: - return dict() - else: - raw_data = ' '.join(raw_data.split()) - return dict(REGEX.findall(raw_data)) diff --git a/collectors/python.d.plugin/phpfpm/phpfpm.conf b/collectors/python.d.plugin/phpfpm/phpfpm.conf deleted file mode 100644 index d31853903..000000000 --- a/collectors/python.d.plugin/phpfpm/phpfpm.conf +++ /dev/null @@ -1,88 +0,0 @@ -# netdata python.d.plugin configuration for PHP-FPM -# -# This file is in YaML format. Generally the format is: -# -# name: value -# -# There are 2 sections: -# - global variables -# - one or more JOBS -# -# JOBS allow you to collect values from multiple sources. -# Each source will have its own set of charts. -# -# JOB parameters have to be indented (using spaces only, example below). - -# ---------------------------------------------------------------------- -# Global Variables -# These variables set the defaults for all JOBs, however each JOB -# may define its own, overriding the defaults. - -# update_every sets the default data collection frequency. -# If unset, the python.d.plugin default is used. -# update_every: 1 - -# priority controls the order of charts at the netdata dashboard. -# Lower numbers move the charts towards the top of the page. -# If unset, the default for python.d.plugin is used. -# priority: 60000 - -# penalty indicates whether to apply penalty to update_every in case of failures. -# Penalty will increase every 5 failed updates in a row. Maximum penalty is 10 minutes. -# penalty: yes - -# autodetection_retry sets the job re-check interval in seconds. -# The job is not deleted if check fails. -# Attempts to start the job are made once every autodetection_retry. -# This feature is disabled by default. -# autodetection_retry: 0 - -# ---------------------------------------------------------------------- -# JOBS (data collection sources) -# -# The default JOBS share the same *name*. JOBS with the same name -# are mutually exclusive. Only one of them will be allowed running at -# any time. This allows autodetection to try several alternatives and -# pick the one that works. -# -# Any number of jobs is supported. -# -# All python.d.plugin JOBS (for all its modules) support a set of -# predefined parameters. These are: -# -# job_name: -# name: myname # the JOB's name as it will appear at the -# # dashboard (by default is the job_name) -# # JOBs sharing a name are mutually exclusive -# update_every: 1 # the JOB's data collection frequency -# priority: 60000 # the JOB's order on the dashboard -# penalty: yes # the JOB's penalty -# autodetection_retry: 0 # the JOB's re-check interval in seconds -# -# Additionally to the above, PHP-FPM also supports the following: -# -# url: 'URL' # the URL to fetch nginx's status stats -# # Be sure and include ?full&status at the end of the url -# -# if the URL is password protected, the following are supported: -# -# user: 'username' -# pass: 'password' -# - -# ---------------------------------------------------------------------- -# AUTO-DETECTION JOBS -# only one of them will run (they have the same name) - -localhost: - name : 'local' - url : "http://localhost/status?full&json" - -localipv4: - name : 'local' - url : "http://127.0.0.1/status?full&json" - -localipv6: - name : 'local' - url : "http://[::1]/status?full&json" - diff --git a/collectors/python.d.plugin/portcheck/Makefile.inc b/collectors/python.d.plugin/portcheck/Makefile.inc deleted file mode 100644 index 76763f02f..000000000 --- a/collectors/python.d.plugin/portcheck/Makefile.inc +++ /dev/null @@ -1,13 +0,0 @@ -# SPDX-License-Identifier: GPL-3.0-or-later - -# THIS IS NOT A COMPLETE Makefile -# IT IS INCLUDED BY ITS PARENT'S Makefile.am -# IT IS REQUIRED TO REFERENCE ALL FILES RELATIVE TO THE PARENT - -# install these files -dist_python_DATA += portcheck/portcheck.chart.py -dist_pythonconfig_DATA += portcheck/portcheck.conf - -# do not install these files, but include them in the distribution -dist_noinst_DATA += portcheck/README.md portcheck/Makefile.inc - diff --git a/collectors/python.d.plugin/portcheck/README.md b/collectors/python.d.plugin/portcheck/README.md deleted file mode 100644 index 845fa5b90..000000000 --- a/collectors/python.d.plugin/portcheck/README.md +++ /dev/null @@ -1,52 +0,0 @@ -<!-- -title: "TCP endpoint monitoring with Netdata" -custom_edit_url: https://github.com/netdata/netdata/edit/master/collectors/python.d.plugin/portcheck/README.md -sidebar_label: "TCP endpoints" ---> - -# TCP endpoint monitoring with Netdata - -Monitors TCP endpoint availability and response time. - -Following charts are drawn per host: - -1. **Latency** ms - - - Time required to connect to a TCP port. - Displays latency in 0.1 ms resolution. If the connection failed, the value is missing. - -2. **Status** boolean - - - Connection successful - - Could not create socket: possible DNS problems - - Connection refused: port not listening or blocked - - Connection timed out: host or port unreachable - -## Configuration - -Edit the `python.d/portcheck.conf` configuration file using `edit-config` from the Netdata [config -directory](/docs/configure/nodes.md), which is typically at `/etc/netdata`. - -```bash -cd /etc/netdata # Replace this path with your Netdata config directory, if different -sudo ./edit-config python.d/portcheck.conf -``` - -```yaml -server: - host: 'dns or ip' # required - port: 22 # required - timeout: 1 # optional - update_every: 1 # optional -``` - -### notes - -- The error chart is intended for alarms, badges or for access via API. -- A system/service/firewall might block Netdata's access if a portscan or - similar is detected. -- Currently, the accuracy of the latency is low and should be used as reference only. - ---- - - diff --git a/collectors/python.d.plugin/portcheck/portcheck.chart.py b/collectors/python.d.plugin/portcheck/portcheck.chart.py deleted file mode 100644 index 818ac765d..000000000 --- a/collectors/python.d.plugin/portcheck/portcheck.chart.py +++ /dev/null @@ -1,157 +0,0 @@ -# -*- coding: utf-8 -*- -# Description: simple port check netdata python.d module -# Original Author: ccremer (github.com/ccremer) -# SPDX-License-Identifier: GPL-3.0-or-later - -import socket - -try: - from time import monotonic as time -except ImportError: - from time import time - -from bases.FrameworkServices.SimpleService import SimpleService - -PORT_LATENCY = 'connect' - -PORT_SUCCESS = 'success' -PORT_TIMEOUT = 'timeout' -PORT_FAILED = 'no_connection' - -ORDER = ['latency', 'status'] - -CHARTS = { - 'latency': { - 'options': [None, 'TCP connect latency', 'milliseconds', 'latency', 'portcheck.latency', 'line'], - 'lines': [ - [PORT_LATENCY, 'connect', 'absolute', 100, 1000] - ] - }, - 'status': { - 'options': [None, 'Portcheck status', 'boolean', 'status', 'portcheck.status', 'line'], - 'lines': [ - [PORT_SUCCESS, 'success', 'absolute'], - [PORT_TIMEOUT, 'timeout', 'absolute'], - [PORT_FAILED, 'no connection', 'absolute'] - ] - } -} - - -# Not deriving from SocketService, too much is different -class Service(SimpleService): - def __init__(self, configuration=None, name=None): - SimpleService.__init__(self, configuration=configuration, name=name) - self.order = ORDER - self.definitions = CHARTS - self.host = self.configuration.get('host') - self.port = self.configuration.get('port') - self.timeout = self.configuration.get('timeout', 1) - - def check(self): - """ - Parse configuration, check if configuration is available, and dynamically create chart lines data - :return: boolean - """ - if self.host is None or self.port is None: - self.error('Host or port missing') - return False - if not isinstance(self.port, int): - self.error('"port" is not an integer. Specify a numerical value, not service name.') - return False - - self.debug('Enabled portcheck: {host}:{port}, update every {update}s, timeout: {timeout}s'.format( - host=self.host, port=self.port, update=self.update_every, timeout=self.timeout - )) - # We will accept any (valid-ish) configuration, even if initial connection fails (a service might be down from - # the beginning) - return True - - def _get_data(self): - """ - Get data from socket - :return: dict - """ - data = dict() - data[PORT_SUCCESS] = 0 - data[PORT_TIMEOUT] = 0 - data[PORT_FAILED] = 0 - - success = False - try: - for socket_config in socket.getaddrinfo(self.host, self.port, socket.AF_UNSPEC, socket.SOCK_STREAM): - # use first working socket - sock = self._create_socket(socket_config) - if sock is not None: - self._connect2socket(data, socket_config, sock) - self._disconnect(sock) - success = True - break - except socket.gaierror as error: - self.debug('Failed to connect to "{host}:{port}", error: {error}'.format( - host=self.host, port=self.port, error=error - )) - - # We could not connect - if not success: - data[PORT_FAILED] = 1 - - return data - - def _create_socket(self, socket_config): - af, sock_type, proto, _, sa = socket_config - try: - self.debug('Creating socket to "{address}", port {port}'.format(address=sa[0], port=sa[1])) - sock = socket.socket(af, sock_type, proto) - sock.settimeout(self.timeout) - return sock - except socket.error as error: - self.debug('Failed to create socket "{address}", port {port}, error: {error}'.format( - address=sa[0], port=sa[1], error=error - )) - return None - - def _connect2socket(self, data, socket_config, sock): - """ - Connect to a socket, passing the result of getaddrinfo() - :return: dict - """ - - _, _, _, _, sa = socket_config - port = str(sa[1]) - try: - self.debug('Connecting socket to "{address}", port {port}'.format(address=sa[0], port=port)) - start = time() - sock.connect(sa) - diff = time() - start - self.debug('Connected to "{address}", port {port}, latency {latency}'.format( - address=sa[0], port=port, latency=diff - )) - # we will set it at least 0.1 ms. 0.0 would mean failed connection (handy for 3rd-party-APIs) - data[PORT_LATENCY] = max(round(diff * 10000), 0) - data[PORT_SUCCESS] = 1 - - except socket.timeout as error: - self.debug('Socket timed out on "{address}", port {port}, error: {error}'.format( - address=sa[0], port=port, error=error - )) - data[PORT_TIMEOUT] = 1 - - except socket.error as error: - self.debug('Failed to connect to "{address}", port {port}, error: {error}'.format( - address=sa[0], port=port, error=error - )) - data[PORT_FAILED] = 1 - - def _disconnect(self, sock): - """ - Close socket connection - :return: - """ - if sock is not None: - try: - self.debug('Closing socket') - sock.shutdown(2) # 0 - read, 1 - write, 2 - all - sock.close() - except socket.error: - pass diff --git a/collectors/python.d.plugin/portcheck/portcheck.conf b/collectors/python.d.plugin/portcheck/portcheck.conf deleted file mode 100644 index 2b32c0031..000000000 --- a/collectors/python.d.plugin/portcheck/portcheck.conf +++ /dev/null @@ -1,74 +0,0 @@ -# netdata python.d.plugin configuration for portcheck -# -# This file is in YaML format. Generally the format is: -# -# name: value -# -# There are 2 sections: -# - global variables -# - one or more JOBS -# -# JOBS allow you to collect values from multiple sources. -# Each source will have its own set of charts. -# -# JOB parameters have to be indented (using spaces only, example below). - -# ---------------------------------------------------------------------- -# Global Variables -# These variables set the defaults for all JOBs, however each JOB -# may define its own, overriding the defaults. - -# update_every sets the default data collection frequency. -# If unset, the python.d.plugin default is used. -# update_every: 1 - -# priority controls the order of charts at the netdata dashboard. -# Lower numbers move the charts towards the top of the page. -# If unset, the default for python.d.plugin is used. -# priority: 60000 - -# penalty indicates whether to apply penalty to update_every in case of failures. -# Penalty will increase every 5 failed updates in a row. Maximum penalty is 10 minutes. -# penalty: yes - -# chart_cleanup sets the default chart cleanup interval in iterations. -# A chart is marked as obsolete if it has not been updated -# 'chart_cleanup' iterations in a row. -# They will be hidden immediately (not offered to dashboard viewer, -# streamed upstream and archived to external databases) and deleted one hour -# later (configurable from netdata.conf). -# -- For this plugin, cleanup MUST be disabled, otherwise we lose latency chart -chart_cleanup: 0 - -# Autodetection and retries do not work for this plugin - -# ---------------------------------------------------------------------- -# JOBS (data collection sources) -# -# The default JOBS share the same *name*. JOBS with the same name -# are mutually exclusive. Only one of them will be allowed running at -# any time. This allows autodetection to try several alternatives and -# pick the one that works. -# -# Any number of jobs is supported. -# -# ------------------------------- -# ATTENTION: Any valid configuration will be accepted, even if initial connection fails! -# ------------------------------- -# -# There is intentionally no default config for 'localhost' - -# job_name: -# name: myname # [optional] the JOB's name as it will appear at the -# # dashboard (by default is the job_name) -# # JOBs sharing a name are mutually exclusive -# update_every: 1 # [optional] the JOB's data collection frequency -# priority: 60000 # [optional] the JOB's order on the dashboard -# penalty: yes # the JOB's penalty -# timeout: 1 # [optional] the socket timeout when connecting -# host: 'dns or ip' # [required] the remote host address in either IPv4, IPv6 or as DNS name. -# port: 22 # [required] the port number to check. Specify an integer, not service name. - -# You just have been warned about possible portscan blocking. The portcheck plugin is meant for simple use cases. -# Currently, the accuracy of the latency is low and should be used as reference only. - diff --git a/collectors/python.d.plugin/powerdns/Makefile.inc b/collectors/python.d.plugin/powerdns/Makefile.inc deleted file mode 100644 index 256d32a40..000000000 --- a/collectors/python.d.plugin/powerdns/Makefile.inc +++ /dev/null @@ -1,13 +0,0 @@ -# SPDX-License-Identifier: GPL-3.0-or-later - -# THIS IS NOT A COMPLETE Makefile -# IT IS INCLUDED BY ITS PARENT'S Makefile.am -# IT IS REQUIRED TO REFERENCE ALL FILES RELATIVE TO THE PARENT - -# install these files -dist_python_DATA += powerdns/powerdns.chart.py -dist_pythonconfig_DATA += powerdns/powerdns.conf - -# do not install these files, but include them in the distribution -dist_noinst_DATA += powerdns/README.md powerdns/Makefile.inc - diff --git a/collectors/python.d.plugin/powerdns/README.md b/collectors/python.d.plugin/powerdns/README.md deleted file mode 100644 index 02449e68e..000000000 --- a/collectors/python.d.plugin/powerdns/README.md +++ /dev/null @@ -1,104 +0,0 @@ -<!-- -title: "PowerDNS monitoring with Netdata" -custom_edit_url: https://github.com/netdata/netdata/edit/master/collectors/python.d.plugin/powerdns/README.md -sidebar_label: "PowerDNS" ---> - -# PowerDNS monitoring with Netdata - -Monitors authoritative server and recursor statistics. - -Powerdns charts: - -1. **Queries and Answers** - - - udp-queries - - udp-answers - - tcp-queries - - tcp-answers - -2. **Cache Usage** - - - query-cache-hit - - query-cache-miss - - packetcache-hit - - packetcache-miss - -3. **Cache Size** - - - query-cache-size - - packetcache-size - - key-cache-size - - meta-cache-size - -4. **Latency** - - - latency - - Powerdns Recursor charts: - -1. **Questions In** - - - questions - - ipv6-questions - - tcp-queries - -2. **Questions Out** - - - all-outqueries - - ipv6-outqueries - - tcp-outqueries - - throttled-outqueries - -3. **Answer Times** - - - answers-slow - - answers0-1 - - answers1-10 - - answers10-100 - - answers100-1000 - -4. **Timeouts** - - - outgoing-timeouts - - outgoing4-timeouts - - outgoing6-timeouts - -5. **Drops** - - - over-capacity-drops - -6. **Cache Usage** - - - cache-hits - - cache-misses - - packetcache-hits - - packetcache-misses - -7. **Cache Size** - - - cache-entries - - packetcache-entries - - negcache-entries - -## Configuration - -Edit the `python.d/powerdns.conf` configuration file using `edit-config` from the Netdata [config -directory](/docs/configure/nodes.md), which is typically at `/etc/netdata`. - -```bash -cd /etc/netdata # Replace this path with your Netdata config directory, if different -sudo ./edit-config python.d/powerdns.conf -``` - -```yaml -local: - name : 'local' - url : 'http://127.0.0.1:8081/api/v1/servers/localhost/statistics' - header : - X-API-Key: 'change_me' -``` - ---- - - diff --git a/collectors/python.d.plugin/powerdns/powerdns.chart.py b/collectors/python.d.plugin/powerdns/powerdns.chart.py deleted file mode 100644 index b951e0c1a..000000000 --- a/collectors/python.d.plugin/powerdns/powerdns.chart.py +++ /dev/null @@ -1,153 +0,0 @@ -# -*- coding: utf-8 -*- -# Description: powerdns netdata python.d module -# Author: Ilya Mashchenko (ilyam8) -# Author: Luke Whitworth -# SPDX-License-Identifier: GPL-3.0-or-later - -from json import loads - -from bases.FrameworkServices.UrlService import UrlService - -ORDER = [ - 'questions', - 'cache_usage', - 'cache_size', - 'latency', -] - -CHARTS = { - 'questions': { - 'options': [None, 'PowerDNS Queries and Answers', 'count', 'questions', 'powerdns.questions', 'line'], - 'lines': [ - ['udp-queries', None, 'incremental'], - ['udp-answers', None, 'incremental'], - ['tcp-queries', None, 'incremental'], - ['tcp-answers', None, 'incremental'] - ] - }, - 'cache_usage': { - 'options': [None, 'PowerDNS Cache Usage', 'count', 'cache', 'powerdns.cache_usage', 'line'], - 'lines': [ - ['query-cache-hit', None, 'incremental'], - ['query-cache-miss', None, 'incremental'], - ['packetcache-hit', 'packet-cache-hit', 'incremental'], - ['packetcache-miss', 'packet-cache-miss', 'incremental'] - ] - }, - 'cache_size': { - 'options': [None, 'PowerDNS Cache Size', 'count', 'cache', 'powerdns.cache_size', 'line'], - 'lines': [ - ['query-cache-size', None, 'absolute'], - ['packetcache-size', 'packet-cache-size', 'absolute'], - ['key-cache-size', None, 'absolute'], - ['meta-cache-size', None, 'absolute'] - ] - }, - 'latency': { - 'options': [None, 'PowerDNS Latency', 'microseconds', 'latency', 'powerdns.latency', 'line'], - 'lines': [ - ['latency', None, 'absolute'] - ] - } -} - -RECURSOR_ORDER = ['questions-in', 'questions-out', 'answer-times', 'timeouts', 'drops', 'cache_usage', 'cache_size'] - -RECURSOR_CHARTS = { - 'questions-in': { - 'options': [None, 'PowerDNS Recursor Questions In', 'count', 'questions', 'powerdns_recursor.questions-in', - 'line'], - 'lines': [ - ['questions', None, 'incremental'], - ['ipv6-questions', None, 'incremental'], - ['tcp-questions', None, 'incremental'] - ] - }, - 'questions-out': { - 'options': [None, 'PowerDNS Recursor Questions Out', 'count', 'questions', 'powerdns_recursor.questions-out', - 'line'], - 'lines': [ - ['all-outqueries', None, 'incremental'], - ['ipv6-outqueries', None, 'incremental'], - ['tcp-outqueries', None, 'incremental'], - ['throttled-outqueries', None, 'incremental'] - ] - }, - 'answer-times': { - 'options': [None, 'PowerDNS Recursor Answer Times', 'count', 'performance', 'powerdns_recursor.answer-times', - 'line'], - 'lines': [ - ['answers-slow', None, 'incremental'], - ['answers0-1', None, 'incremental'], - ['answers1-10', None, 'incremental'], - ['answers10-100', None, 'incremental'], - ['answers100-1000', None, 'incremental'] - ] - }, - 'timeouts': { - 'options': [None, 'PowerDNS Recursor Questions Time', 'count', 'performance', 'powerdns_recursor.timeouts', - 'line'], - 'lines': [ - ['outgoing-timeouts', None, 'incremental'], - ['outgoing4-timeouts', None, 'incremental'], - ['outgoing6-timeouts', None, 'incremental'] - ] - }, - 'drops': { - 'options': [None, 'PowerDNS Recursor Drops', 'count', 'performance', 'powerdns_recursor.drops', 'line'], - 'lines': [ - ['over-capacity-drops', None, 'incremental'] - ] - }, - 'cache_usage': { - 'options': [None, 'PowerDNS Recursor Cache Usage', 'count', 'cache', 'powerdns_recursor.cache_usage', 'line'], - 'lines': [ - ['cache-hits', None, 'incremental'], - ['cache-misses', None, 'incremental'], - ['packetcache-hits', 'packet-cache-hit', 'incremental'], - ['packetcache-misses', 'packet-cache-miss', 'incremental'] - ] - }, - 'cache_size': { - 'options': [None, 'PowerDNS Recursor Cache Size', 'count', 'cache', 'powerdns_recursor.cache_size', 'line'], - 'lines': [ - ['cache-entries', None, 'absolute'], - ['packetcache-entries', None, 'absolute'], - ['negcache-entries', None, 'absolute'] - ] - } -} - - -class Service(UrlService): - def __init__(self, configuration=None, name=None): - UrlService.__init__(self, configuration=configuration, name=name) - self.order = ORDER - self.definitions = CHARTS - self.url = configuration.get('url', 'http://127.0.0.1:8081/api/v1/servers/localhost/statistics') - - def check(self): - self._manager = self._build_manager() - if not self._manager: - return None - - d = self._get_data() - if not d: - return False - - if is_recursor(d): - self.order = RECURSOR_ORDER - self.definitions = RECURSOR_CHARTS - self.module_name = 'powerdns_recursor' - - return True - - def _get_data(self): - data = self._get_raw_data() - if not data: - return None - return dict((d['name'], d['value']) for d in loads(data)) - - -def is_recursor(d): - return 'over-capacity-drops' in d and 'tcp-questions' in d diff --git a/collectors/python.d.plugin/powerdns/powerdns.conf b/collectors/python.d.plugin/powerdns/powerdns.conf deleted file mode 100644 index 559bf175e..000000000 --- a/collectors/python.d.plugin/powerdns/powerdns.conf +++ /dev/null @@ -1,76 +0,0 @@ -# netdata python.d.plugin configuration for powerdns -# -# This file is in YaML format. Generally the format is: -# -# name: value -# -# There are 2 sections: -# - global variables -# - one or more JOBS -# -# JOBS allow you to collect values from multiple sources. -# Each source will have its own set of charts. -# -# JOB parameters have to be indented (using spaces only, example below). - -# ---------------------------------------------------------------------- -# Global Variables -# These variables set the defaults for all JOBs, however each JOB -# may define its own, overriding the defaults. - -# update_every sets the default data collection frequency. -# If unset, the python.d.plugin default is used. -# update_every: 1 - -# priority controls the order of charts at the netdata dashboard. -# Lower numbers move the charts towards the top of the page. -# If unset, the default for python.d.plugin is used. -# priority: 60000 - -# penalty indicates whether to apply penalty to update_every in case of failures. -# Penalty will increase every 5 failed updates in a row. Maximum penalty is 10 minutes. -# penalty: yes - -# autodetection_retry sets the job re-check interval in seconds. -# The job is not deleted if check fails. -# Attempts to start the job are made once every autodetection_retry. -# This feature is disabled by default. -# autodetection_retry: 0 - -# ---------------------------------------------------------------------- -# JOBS (data collection sources) -# -# The default JOBS share the same *name*. JOBS with the same name -# are mutually exclusive. Only one of them will be allowed running at -# any time. This allows autodetection to try several alternatives and -# pick the one that works. -# -# Any number of jobs is supported. -# -# All python.d.plugin JOBS (for all its modules) support a set of -# predefined parameters. These are: -# -# job_name: -# name: myname # the JOB's name as it will appear at the -# # dashboard (by default is the job_name) -# # JOBs sharing a name are mutually exclusive -# update_every: 1 # the JOB's data collection frequency -# priority: 60000 # the JOB's order on the dashboard -# penalty: yes # the JOB's penalty -# autodetection_retry: 0 # the JOB's re-check interval in seconds -# -# Additionally to the above, apache also supports the following: -# -# url: 'URL' # the URL to fetch powerdns performance statistics -# header: -# X-API-Key: 'Key' # API key -# -# ---------------------------------------------------------------------- -# AUTO-DETECTION JOBS -# only one of them will run (they have the same name) - -# localhost: -# name : 'local' -# url : 'http://127.0.0.1:8081/api/v1/servers/localhost/statistics' -# header: -# X-API-Key: 'change_me' diff --git a/collectors/python.d.plugin/redis/Makefile.inc b/collectors/python.d.plugin/redis/Makefile.inc deleted file mode 100644 index 6aab08977..000000000 --- a/collectors/python.d.plugin/redis/Makefile.inc +++ /dev/null @@ -1,13 +0,0 @@ -# SPDX-License-Identifier: GPL-3.0-or-later - -# THIS IS NOT A COMPLETE Makefile -# IT IS INCLUDED BY ITS PARENT'S Makefile.am -# IT IS REQUIRED TO REFERENCE ALL FILES RELATIVE TO THE PARENT - -# install these files -dist_python_DATA += redis/redis.chart.py -dist_pythonconfig_DATA += redis/redis.conf - -# do not install these files, but include them in the distribution -dist_noinst_DATA += redis/README.md redis/Makefile.inc - diff --git a/collectors/python.d.plugin/redis/README.md b/collectors/python.d.plugin/redis/README.md deleted file mode 100644 index 319827100..000000000 --- a/collectors/python.d.plugin/redis/README.md +++ /dev/null @@ -1,64 +0,0 @@ -<!-- -title: "Redis monitoring with Netdata" -custom_edit_url: https://github.com/netdata/netdata/edit/master/collectors/python.d.plugin/redis/README.md -sidebar_label: "Redis" ---> - -# Redis monitoring with Netdata - -Monitors database status. It reads server response to `INFO` command. - -Following charts are drawn: - -1. **Operations** per second - - - operations - -2. **Hit rate** in percent - - - rate - -3. **Memory utilization** in kilobytes - - - total - - lua - -4. **Database keys** - - - lines are creates dynamically based on how many databases are there - -5. **Clients** - - - connected - - blocked - -6. **Slaves** - - - connected - -## Configuration - -Edit the `python.d/redis.conf` configuration file using `edit-config` from the Netdata [config -directory](/docs/configure/nodes.md), which is typically at `/etc/netdata`. - -```bash -cd /etc/netdata # Replace this path with your Netdata config directory, if different -sudo ./edit-config python.d/redis.conf -``` - -```yaml -socket: - name : 'local' - socket : '/var/lib/redis/redis.sock' - -localhost: - name : 'local' - host : 'localhost' - port : 6379 -``` - -When no configuration file is found, module tries to connect to TCP/IP socket: `localhost:6379`. - ---- - - diff --git a/collectors/python.d.plugin/redis/redis.chart.py b/collectors/python.d.plugin/redis/redis.chart.py deleted file mode 100644 index e09916d86..000000000 --- a/collectors/python.d.plugin/redis/redis.chart.py +++ /dev/null @@ -1,268 +0,0 @@ -# -*- coding: utf-8 -*- -# Description: redis netdata python.d module -# Author: Pawel Krupa (paulfantom) -# Author: Ilya Mashchenko (ilyam8) -# SPDX-License-Identifier: GPL-3.0-or-later - -import re -from copy import deepcopy - -from bases.FrameworkServices.SocketService import SocketService - -REDIS_ORDER = [ - 'operations', - 'hit_rate', - 'memory', - 'keys_redis', - 'eviction', - 'net', - 'connections', - 'clients', - 'slaves', - 'persistence', - 'bgsave_now', - 'bgsave_health', - 'uptime', -] - -PIKA_ORDER = [ - 'operations', - 'hit_rate', - 'memory', - 'keys_pika', - 'connections', - 'clients', - 'slaves', - 'uptime', -] - -CHARTS = { - 'operations': { - 'options': [None, 'Operations', 'operations/s', 'operations', 'redis.operations', 'line'], - 'lines': [ - ['total_commands_processed', 'commands', 'incremental'], - ['instantaneous_ops_per_sec', 'operations', 'absolute'] - ] - }, - 'hit_rate': { - 'options': [None, 'Hit rate', 'percentage', 'hits', 'redis.hit_rate', 'line'], - 'lines': [ - ['hit_rate', 'rate', 'absolute'] - ] - }, - 'memory': { - 'options': [None, 'Memory utilization', 'KiB', 'memory', 'redis.memory', 'area'], - 'lines': [ - ['maxmemory', 'max', 'absolute', 1, 1024], - ['used_memory', 'total', 'absolute', 1, 1024], - ['used_memory_lua', 'lua', 'absolute', 1, 1024] - ] - }, - 'net': { - 'options': [None, 'Bandwidth', 'kilobits/s', 'network', 'redis.net', 'area'], - 'lines': [ - ['total_net_input_bytes', 'in', 'incremental', 8, 1000], - ['total_net_output_bytes', 'out', 'incremental', -8, 1000] - ] - }, - 'keys_redis': { - 'options': [None, 'Keys per Database', 'keys', 'keys', 'redis.keys', 'line'], - 'lines': [] - }, - 'keys_pika': { - 'options': [None, 'Keys', 'keys', 'keys', 'redis.keys', 'line'], - 'lines': [ - ['kv_keys', 'kv', 'absolute'], - ['hash_keys', 'hash', 'absolute'], - ['list_keys', 'list', 'absolute'], - ['zset_keys', 'zset', 'absolute'], - ['set_keys', 'set', 'absolute'] - ] - }, - 'eviction': { - 'options': [None, 'Evicted Keys', 'keys', 'keys', 'redis.eviction', 'line'], - 'lines': [ - ['evicted_keys', 'evicted', 'absolute'] - ] - }, - 'connections': { - 'options': [None, 'Connections', 'connections/s', 'connections', 'redis.connections', 'line'], - 'lines': [ - ['total_connections_received', 'received', 'incremental', 1], - ['rejected_connections', 'rejected', 'incremental', -1] - ] - }, - 'clients': { - 'options': [None, 'Clients', 'clients', 'connections', 'redis.clients', 'line'], - 'lines': [ - ['connected_clients', 'connected', 'absolute', 1], - ['blocked_clients', 'blocked', 'absolute', -1] - ] - }, - 'slaves': { - 'options': [None, 'Slaves', 'slaves', 'replication', 'redis.slaves', 'line'], - 'lines': [ - ['connected_slaves', 'connected', 'absolute'] - ] - }, - 'persistence': { - 'options': [None, 'Persistence Changes Since Last Save', 'changes', 'persistence', - 'redis.rdb_changes', 'line'], - 'lines': [ - ['rdb_changes_since_last_save', 'changes', 'absolute'] - ] - }, - 'bgsave_now': { - 'options': [None, 'Duration of the RDB Save Operation', 'seconds', 'persistence', - 'redis.bgsave_now', 'absolute'], - 'lines': [ - ['rdb_bgsave_in_progress', 'rdb save', 'absolute'] - ] - }, - 'bgsave_health': { - 'options': [None, 'Status of the Last RDB Save Operation', 'status', 'persistence', - 'redis.bgsave_health', 'line'], - 'lines': [ - ['rdb_last_bgsave_status', 'rdb save', 'absolute'] - ] - }, - 'uptime': { - 'options': [None, 'Uptime', 'seconds', 'uptime', 'redis.uptime', 'line'], - 'lines': [ - ['uptime_in_seconds', 'uptime', 'absolute'] - ] - } -} - - -def copy_chart(name): - return {name: deepcopy(CHARTS[name])} - - -RE = re.compile(r'\n([a-z_0-9 ]+):(?:keys=)?([^,\r]+)') - - -class Service(SocketService): - def __init__(self, configuration=None, name=None): - SocketService.__init__(self, configuration=configuration, name=name) - self.order = list() - self.definitions = dict() - self._keep_alive = True - self.host = self.configuration.get('host', 'localhost') - self.port = self.configuration.get('port', 6379) - self.unix_socket = self.configuration.get('socket') - p = self.configuration.get('pass') - self.auth_request = 'AUTH {0} \r\n'.format(p).encode() if p else None - self.request = 'INFO\r\n'.encode() - self.bgsave_time = 0 - self.keyspace_dbs = set() - - def do_auth(self): - resp = self._get_raw_data(request=self.auth_request) - if not resp: - return False - if resp.strip() != '+OK': - self.error('invalid password') - return False - return True - - def get_raw_and_parse(self): - if self.auth_request and not self.do_auth(): - return None - - resp = self._get_raw_data() - - if not resp: - return None - - parsed = RE.findall(resp) - - if not parsed: - self.error('response is invalid/empty') - return None - - return dict((k.replace(' ', '_'), v) for k, v in parsed) - - def get_data(self): - """ - Get data from socket - :return: dict - """ - data = self.get_raw_and_parse() - if not data: - return None - - self.calc_hit_rate(data) - self.calc_redis_keys(data) - self.calc_redis_rdb_save_operations(data) - return data - - @staticmethod - def calc_hit_rate(data): - try: - hits = int(data['keyspace_hits']) - misses = int(data['keyspace_misses']) - data['hit_rate'] = hits * 100 / (hits + misses) - except (KeyError, ZeroDivisionError): - data['hit_rate'] = 0 - - def calc_redis_keys(self, data): - if not data.get('redis_version'): - return - # db0:keys=2,expires=0,avg_ttl=0 - new_keyspace_dbs = [k for k in data if k.startswith('db') and k not in self.keyspace_dbs] - for db in new_keyspace_dbs: - self.keyspace_dbs.add(db) - self.charts['keys_redis'].add_dimension([db, None, 'absolute']) - for db in self.keyspace_dbs: - if db not in data: - data[db] = 0 - - def calc_redis_rdb_save_operations(self, data): - if not (data.get('redis_version') and data.get('rdb_bgsave_in_progress')): - return - if data['rdb_bgsave_in_progress'] != '0': - self.bgsave_time += self.update_every - else: - self.bgsave_time = 0 - - data['rdb_last_bgsave_status'] = 0 if data['rdb_last_bgsave_status'] == 'ok' else 1 - data['rdb_bgsave_in_progress'] = self.bgsave_time - - def check(self): - """ - Parse configuration, check if redis is available, and dynamically create chart lines data - :return: boolean - """ - data = self.get_raw_and_parse() - - if not data: - return False - - self.order = PIKA_ORDER if data.get('pika_version') else REDIS_ORDER - - for n in self.order: - self.definitions.update(copy_chart(n)) - - return True - - def _check_raw_data(self, data): - """ - Check if all data has been gathered from socket. - Parse first line containing message length and check against received message - :param data: str - :return: boolean - """ - length = len(data) - supposed = data.split('\n')[0][1:-1] - offset = len(supposed) + 4 # 1 dollar sing, 1 new line character + 1 ending sequence '\r\n' - if not supposed.isdigit(): - return True - supposed = int(supposed) - - if length - offset >= supposed: - self.debug('received full response from redis') - return True - - self.debug('waiting more data from redis') - return False diff --git a/collectors/python.d.plugin/redis/redis.conf b/collectors/python.d.plugin/redis/redis.conf deleted file mode 100644 index b456d75d3..000000000 --- a/collectors/python.d.plugin/redis/redis.conf +++ /dev/null @@ -1,110 +0,0 @@ -# netdata python.d.plugin configuration for redis -# -# This file is in YaML format. Generally the format is: -# -# name: value -# -# There are 2 sections: -# - global variables -# - one or more JOBS -# -# JOBS allow you to collect values from multiple sources. -# Each source will have its own set of charts. -# -# JOB parameters have to be indented (using spaces only, example below). - -# ---------------------------------------------------------------------- -# Global Variables -# These variables set the defaults for all JOBs, however each JOB -# may define its own, overriding the defaults. - -# update_every sets the default data collection frequency. -# If unset, the python.d.plugin default is used. -# update_every: 1 - -# priority controls the order of charts at the netdata dashboard. -# Lower numbers move the charts towards the top of the page. -# If unset, the default for python.d.plugin is used. -# priority: 60000 - -# penalty indicates whether to apply penalty to update_every in case of failures. -# Penalty will increase every 5 failed updates in a row. Maximum penalty is 10 minutes. -# penalty: yes - -# autodetection_retry sets the job re-check interval in seconds. -# The job is not deleted if check fails. -# Attempts to start the job are made once every autodetection_retry. -# This feature is disabled by default. -# autodetection_retry: 0 - -# ---------------------------------------------------------------------- -# JOBS (data collection sources) -# -# The default JOBS share the same *name*. JOBS with the same name -# are mutually exclusive. Only one of them will be allowed running at -# any time. This allows autodetection to try several alternatives and -# pick the one that works. -# -# Any number of jobs is supported. -# -# All python.d.plugin JOBS (for all its modules) support a set of -# predefined parameters. These are: -# -# job_name: -# name: myname # the JOB's name as it will appear at the -# # dashboard (by default is the job_name) -# # JOBs sharing a name are mutually exclusive -# update_every: 1 # the JOB's data collection frequency -# priority: 60000 # the JOB's order on the dashboard -# penalty: yes # the JOB's penalty -# autodetection_retry: 0 # the JOB's re-check interval in seconds -# -# Additionally to the above, redis also supports the following: -# -# socket: 'path/to/redis.sock' -# -# or -# host: 'IP or HOSTNAME' # the host to connect to -# port: PORT # the port to connect to -# -# and -# pass: 'password' # the redis password to use for AUTH command -# - -# ---------------------------------------------------------------------- -# AUTO-DETECTION JOBS -# only one of them will run (they have the same name) - -socket1: - name : 'local' - socket : '/tmp/redis.sock' - # pass : '' - -socket2: - name : 'local' - socket : '/var/run/redis/redis.sock' - # pass : '' - -socket3: - name : 'local' - socket : '/var/lib/redis/redis.sock' - # pass : '' - -localhost: - name : 'local' - host : 'localhost' - port : 6379 - # pass : '' - -localipv4: - name : 'local' - host : '127.0.0.1' - port : 6379 - # pass : '' - -localipv6: - name : 'local' - host : '::1' - port : 6379 - # pass : '' - diff --git a/collectors/python.d.plugin/web_log/Makefile.inc b/collectors/python.d.plugin/web_log/Makefile.inc deleted file mode 100644 index 893115992..000000000 --- a/collectors/python.d.plugin/web_log/Makefile.inc +++ /dev/null @@ -1,13 +0,0 @@ -# SPDX-License-Identifier: GPL-3.0-or-later - -# THIS IS NOT A COMPLETE Makefile -# IT IS INCLUDED BY ITS PARENT'S Makefile.am -# IT IS REQUIRED TO REFERENCE ALL FILES RELATIVE TO THE PARENT - -# install these files -dist_python_DATA += web_log/web_log.chart.py -dist_pythonconfig_DATA += web_log/web_log.conf - -# do not install these files, but include them in the distribution -dist_noinst_DATA += web_log/README.md web_log/Makefile.inc - diff --git a/collectors/python.d.plugin/web_log/README.md b/collectors/python.d.plugin/web_log/README.md deleted file mode 100644 index 552d56e90..000000000 --- a/collectors/python.d.plugin/web_log/README.md +++ /dev/null @@ -1,219 +0,0 @@ -<!-- -title: "Web server log (Apache, NGINX, Squid) monitoring with Netdata" -custom_edit_url: https://github.com/netdata/netdata/edit/master/collectors/python.d.plugin/web_log/README.md -sidebar_label: "Web server logs (Apache, NGINX, Squid)" ---> - -# Web server log (Apache, NGINX, Squid) monitoring with Netdata - -Tails access log file and Collects web server/caching proxy metrics. - -## Motivation - -Web server log files exist for more than 20 years. All web servers of all kinds, from all vendors, [since the time NCSA httpd was powering the web](https://en.wikipedia.org/wiki/NCSA_HTTPd), produce log files, saving in real-time all accesses to web sites and APIs. - -Yet, after the appearance of google analytics and similar services, and the recent rise of APM (Application Performance Monitoring) with sophisticated time-series databases that collect and analyze metrics at the application level, all these web server log files are mostly just filling our disks, rotated every night without any use whatsoever. - -Netdata turns this "useless" log file, into a powerful performance and health monitoring tool, capable of detecting, **in real-time**, most common web server problems, such as: - -- too many redirects (i.e. **oops!** *this should not redirect clients to itself*) -- too many bad requests (i.e. **oops!** *a few files were not uploaded*) -- too many internal server errors (i.e. **oops!** *this release crashes too much*) -- unreasonably too many requests (i.e. **oops!** *we are under attack*) -- unreasonably few requests (i.e. **oops!** *call the network guys*) -- unreasonably slow responses (i.e. **oops!** *the database is slow again*) -- too few successful responses (i.e. **oops!** *help us God!*) - -## Usage - -If Netdata is installed on a system running a web server, it will detect it and it will automatically present a series of charts, with information obtained from the web server API, like these (*these do not come from the web server log file*): - - -*[**netdata**](https://my-netdata.io/) charts based on metrics collected by querying the `nginx` API (i.e. `/stub_status`).* - -> [**netdata**](https://my-netdata.io/) supports `apache`, `nginx`, `lighttpd` and `tomcat`. To obtain real-time information from a web server API, the web server needs to expose it. For directions on configuring your web server, check the config files for each web server. There is a directory with a config file for each web server under `/etc/netdata/python.d/`. - -## Configuration - -Edit the `python.d/web_log.conf` configuration file using `edit-config` from the Netdata [config -directory](/docs/configure/nodes.md), which is typically at `/etc/netdata`. - -```bash -cd /etc/netdata # Replace this path with your Netdata config directory, if different -sudo ./edit-config python.d/web_log.conf -``` - -[**netdata**](https://my-netdata.io/) has a powerful `web_log` plugin, capable of incrementally parsing any number of web server log files. This plugin is automatically started with [**netdata**](https://my-netdata.io/) and comes, pre-configured, for finding web server log files on popular distributions. Its configuration is at `/etc/netdata/python.d/web_log.conf`, like this: - -```yaml -nginx_log: - name : 'nginx_log' - path : '/var/log/nginx/access.log' - -apache_log: - name : 'apache_log' - path : '/var/log/apache/other_vhosts_access.log' - categories: - cacti : 'cacti.*' - observium : 'observium' -``` - -The module has preconfigured jobs for nginx, apache and gunicorn on various distros. -You can add one such section for each of your web server log files. - -> **Important**<br/>Keep in mind [**netdata**](https://my-netdata.io/) runs as user `netdata`. So, make sure user `netdata` has access to the logs directory and can read the log file. - -## Charts - -Once you have all log files configured and [**netdata**](https://my-netdata.io/) restarted, **for each log file** you will get a section at the [**netdata**](https://my-netdata.io/) dashboard, with the following charts. - -### Responses by status - -In this chart we tried to provide a meaningful status for all responses. So: - -- `success` counts all the valid responses (i.e. `1xx` informational, `2xx` successful and `304` not modified). -- `error` are `5xx` internal server errors. These are very bad, they mean your web site or API is facing difficulties. -- `redirect` are `3xx` responses, except `304`. All `3xx` are redirects, but `304` means "not modified" - it tells the browsers the content they already have is still valid and can be used as-is. So, we decided to account it as a successful response. -- `bad` are bad requests that cannot be served. -- `other` as all the other, non-standard, types of responses. - - - -### Responses by type - -Then, we group all responses by code family, without interpreting their meaning. -**Response by type** requests/s - -- success (1xx, 2xx, 304) -- error (5xx) -- redirect (3xx except 304) -- bad (4xx) -- other (all other responses) - - - -### Responses by code family - -Here we show all the response codes in detail. - -**Response by code family** requests/s - -- 1xx (informational) -- 2xx (successful) -- 3xx (redirect) -- 4xx (bad) -- 5xx (internal server errors) -- other (non-standart responses) -- unmatched (the lines in the log file that are not matched) - - - -> **Important**<br/>If your application is using hundreds of non-standard response codes, your browser may become slow while viewing this chart, so we have added a configuration [option to disable this chart](https://github.com/netdata/netdata/blob/419cd0a237275e5eeef3f92dcded84e735ee6c58/conf.d/python.d/web_log.conf#L63). - -### Detailed Response Codes - -Number of responses for each response code family individually (requests/s) - -### Bandwidth - -This is a nice view of the traffic the web server is receiving and is sending. - -What is important to know for this chart, is that the bandwidth used for each request and response is accounted at the time the log is written. Since [**netdata**](https://my-netdata.io/) refreshes this chart every single second, you may have unrealistic spikes is the size of the requests or responses is too big. The reason is simple: a response may have needed 1 minute to be completed, but all the bandwidth used during that minute for the specific response will be accounted at the second the log line is written. - -As the legend on the chart suggests, you can use FireQOS to setup QoS on the web server ports and IPs to accurately measure the bandwidth the web server is using. Actually, [there may be a few more reasons to install QoS on your servers](/collectors/tc.plugin/README.md#tcplugin)... - -**Bandwidth** KB/s - -- received (bandwidth of requests) -- send (bandwidth of responses) - - - -> **Important**<br/>Most web servers do not log the request size by default.<br/>So, [unless you have configured your web server to log the size of requests](https://github.com/netdata/netdata/blob/419cd0a237275e5eeef3f92dcded84e735ee6c58/conf.d/python.d/web_log.conf#L76-L89), the `received` dimension will be always zero. - -### Timings - -[**netdata**](https://my-netdata.io/) will also render the `minimum`, `average` and `maximum` time the web server needed to respond to requests. - -Keep in mind most web servers timings start at the reception of the full request, until the dispatch of the last byte of the response. So, they include network latencies of responses, but they do not include network latencies of requests. - -**Timings** ms (request processing time) - -- min (bandwidth of requests) -- max (bandwidth of responses) -- average (bandwidth of responses) - - - -> **Important**<br/>Most web servers do not log timing information by default.<br/>So, [unless you have configured your web server to also log timings](https://github.com/netdata/netdata/blob/419cd0a237275e5eeef3f92dcded84e735ee6c58/conf.d/python.d/web_log.conf#L76-L89), this chart will not exist. - -### URL patterns - -This is a very interesting chart. It is configured entirely by you. - -[**netdata**](https://my-netdata.io/) can map the URLs found in the log file into categories. You can define these categories, by providing names and regular expressions in `web_log.conf`. - -So, this configuration: - -```yaml -nginx_netdata: # name the charts - path: '/var/log/nginx/access.log' # web server log file - categories: - badges : '^/api/v1/badge\.svg' - charts : '^/api/v1/(data|chart|charts)' - registry : '^/api/v1/registry' - alarms : '^/api/v1/alarm' - allmetrics : '^/api/v1/allmetrics' - api_other : '^/api/' - netdata_conf: '^/netdata.conf' - api_old : '^/(data|datasource|graph|list|all\.json)' -``` - -Produces the following chart. The `categories` section is matched in the order given. So, pay attention to the order you give your patterns. - - - -### HTTP methods - -This chart breaks down requests by HTTP method used. - - - -### IP versions - -This one provides requests per IP version used by the clients (`IPv4`, `IPv6`). - - - -### Unique clients - -The last charts are about the unique IPs accessing your web server. - -**Current Poll Unique Client IPs** unique ips/s. This one counts the unique IPs for each data collection iteration (i.e. **unique clients per second**). - - - -**All Time Unique Client IPs** unique ips/s. Counts the unique IPs, since the last [**netdata**](https://my-netdata.io/) restart. - - - -> **Important**<br/>To provide this information `web_log` plugin keeps in memory all the IPs seen by the web server. Although this does not require so much memory, if you have a web server with several million unique client IPs, we suggest to [disable this chart](https://github.com/netdata/netdata/blob/419cd0a237275e5eeef3f92dcded84e735ee6c58/conf.d/python.d/web_log.conf#L64). - -## Alarms - -The magic of [**netdata**](https://my-netdata.io/) is that all metrics are collected per second, and all metrics can be used or correlated to provide real-time alarms. Out of the box, [**netdata**](https://my-netdata.io/) automatically attaches the following alarms] to all `web_log` charts (i.e. to all log files configured, individually): - -| alarm|description|minimum<br/>requests|warning|critical| -|:----|-----------|:------------------:|:-----:|:------:| -| `1m_redirects`|The ratio of HTTP redirects (3xx except 304) over all the requests, during the last minute.<br/> <br/>*Detects if the site or the web API is suffering from too many or circular redirects.*<br/> <br/>(i.e. **oops!** *this should not redirect clients to itself*)|120/min|> 20%|> 30%| -| `1m_bad_requests`|The ratio of HTTP bad requests (4xx) over all the requests, during the last minute.<br/> <br/>*Detects if the site or the web API is receiving too many bad requests, including `404`, not found.*<br/> <br/>(i.e. **oops!** *a few files were not uploaded*)|120/min|> 30%|> 50%| -| `1m_internal_errors`|The ratio of HTTP internal server errors (5xx), over all the requests, during the last minute.<br/> <br/>*Detects if the site is facing difficulties to serve requests.*<br/> <br/>(i.e. **oops!** *this release crashes too much*)|120/min|> 2%|> 5%| -| `5m_requests_ratio`|The percentage of successful web requests of the last 5 minutes, compared with the previous 5 minutes.<br/> <br/>*Detects if the site or the web API is suddenly getting too many or too few requests.*<br/> <br/>(i.e. too many = **oops!** *we are under attack*)<br/>(i.e. too few = **oops!** *call the network guys*)|120/5min|> double or \< half|> 4x or \< 1/4x| -| `web_slow`|The average time to respond to requests, over the last 1 minute, compared to the average of last 10 minutes.<br/> <br/>*Detects if the site or the web API is suddenly a lot slower.*<br/> <br/>(i.e. **oops!** *the database is slow again*)|120/min|> 2x|> 4x| -| `1m_successful`|The ratio of successful HTTP responses (1xx, 2xx, 304) over all the requests, during the last minute.<br/> <br/>*Detects if the site or the web API is performing within limits.*<br/> <br/>(i.e. **oops!** *help us God!*)|120/min|\< 85%|\< 75%| - -The column `minimum requests` state the minimum number of requests required for the alarm to be evaluated. We found that when the site is receiving requests above this rate, these alarms are pretty accurate (i.e. no false-positives). - -Netdata alarms are user-configurable. Sample config files can be found under directory `health/health.d` of the [Netdata GitHub repository](https://github.com/netdata/netdata/). - - diff --git a/collectors/python.d.plugin/web_log/web_log.chart.py b/collectors/python.d.plugin/web_log/web_log.chart.py deleted file mode 100644 index 04ecadec8..000000000 --- a/collectors/python.d.plugin/web_log/web_log.chart.py +++ /dev/null @@ -1,1194 +0,0 @@ -# -*- coding: utf-8 -*- -# Description: web log netdata python.d module -# Author: ilyam8 -# SPDX-License-Identifier: GPL-3.0-or-later - -import bisect -import os -import re -from collections import namedtuple, defaultdict -from copy import deepcopy - -try: - from itertools import filterfalse -except ImportError: - from itertools import ifilter as filter - from itertools import ifilterfalse as filterfalse - -try: - from sys import maxint -except ImportError: - from sys import maxsize as maxint - -from bases.collection import read_last_line -from bases.FrameworkServices.LogService import LogService - -ORDER_APACHE_CACHE = [ - 'apache_cache', -] - -ORDER_WEB = [ - 'response_statuses', - 'response_codes', - 'bandwidth', - 'response_time', - 'response_time_hist', - 'response_time_upstream', - 'response_time_upstream_hist', - 'requests_per_url', - 'requests_per_user_defined', - 'http_method', - 'vhost', - 'port', - 'http_version', - 'requests_per_ipproto', - 'clients', - 'clients_all' -] - -ORDER_SQUID = [ - 'squid_response_statuses', - 'squid_response_codes', - 'squid_detailed_response_codes', - 'squid_method', - 'squid_mime_type', - 'squid_hier_code', - 'squid_transport_methods', - 'squid_transport_errors', - 'squid_code', - 'squid_handling_opts', - 'squid_object_types', - 'squid_cache_events', - 'squid_bytes', - 'squid_duration', - 'squid_clients', - 'squid_clients_all' -] - -CHARTS_WEB = { - 'response_codes': { - 'options': [None, 'Response Codes', 'requests/s', 'responses', 'web_log.response_codes', 'stacked'], - 'lines': [ - ['2xx', None, 'incremental'], - ['5xx', None, 'incremental'], - ['3xx', None, 'incremental'], - ['4xx', None, 'incremental'], - ['1xx', None, 'incremental'], - ['0xx', 'other', 'incremental'], - ['unmatched', None, 'incremental'] - ] - }, - 'bandwidth': { - 'options': [None, 'Bandwidth', 'kilobits/s', 'bandwidth', 'web_log.bandwidth', 'area'], - 'lines': [ - ['resp_length', 'received', 'incremental', 8, 1000], - ['bytes_sent', 'sent', 'incremental', -8, 1000] - ] - }, - 'response_time': { - 'options': [None, 'Processing Time', 'milliseconds', 'timings', 'web_log.response_time', 'area'], - 'lines': [ - ['resp_time_min', 'min', 'incremental', 1, 1000], - ['resp_time_max', 'max', 'incremental', 1, 1000], - ['resp_time_avg', 'avg', 'incremental', 1, 1000] - ] - }, - 'response_time_hist': { - 'options': [None, 'Processing Time Histogram', 'requests/s', 'timings', 'web_log.response_time_hist', 'line'], - 'lines': [] - }, - 'response_time_upstream': { - 'options': [None, 'Processing Time Upstream', 'milliseconds', 'timings', - 'web_log.response_time_upstream', 'area'], - 'lines': [ - ['resp_time_upstream_min', 'min', 'incremental', 1, 1000], - ['resp_time_upstream_max', 'max', 'incremental', 1, 1000], - ['resp_time_upstream_avg', 'avg', 'incremental', 1, 1000] - ] - }, - 'response_time_upstream_hist': { - 'options': [None, 'Processing Time Histogram', 'requests/s', 'timings', - 'web_log.response_time_upstream_hist', 'line'], - 'lines': [] - }, - 'clients': { - 'options': [None, 'Current Poll Unique Client IPs', 'unique ips', 'clients', 'web_log.clients', 'stacked'], - 'lines': [ - ['unique_cur_ipv4', 'ipv4', 'incremental', 1, 1], - ['unique_cur_ipv6', 'ipv6', 'incremental', 1, 1] - ] - }, - 'clients_all': { - 'options': [None, 'All Time Unique Client IPs', 'unique ips', 'clients', 'web_log.clients_all', 'stacked'], - 'lines': [ - ['unique_tot_ipv4', 'ipv4', 'absolute', 1, 1], - ['unique_tot_ipv6', 'ipv6', 'absolute', 1, 1] - ] - }, - 'http_method': { - 'options': [None, 'Requests Per HTTP Method', 'requests/s', 'http methods', 'web_log.http_method', 'stacked'], - 'lines': [ - ['GET', 'GET', 'incremental', 1, 1] - ] - }, - 'http_version': { - 'options': [None, 'Requests Per HTTP Version', 'requests/s', 'http versions', - 'web_log.http_version', 'stacked'], - 'lines': [] - }, - 'requests_per_ipproto': { - 'options': [None, 'Requests Per IP Protocol', 'requests/s', 'ip protocols', 'web_log.requests_per_ipproto', - 'stacked'], - 'lines': [ - ['req_ipv4', 'ipv4', 'incremental', 1, 1], - ['req_ipv6', 'ipv6', 'incremental', 1, 1] - ] - }, - 'response_statuses': { - 'options': [None, 'Response Statuses', 'requests/s', 'responses', 'web_log.response_statuses', 'stacked'], - 'lines': [ - ['successful_requests', 'success', 'incremental', 1, 1], - ['server_errors', 'error', 'incremental', 1, 1], - ['redirects', 'redirect', 'incremental', 1, 1], - ['bad_requests', 'bad', 'incremental', 1, 1], - ['other_requests', 'other', 'incremental', 1, 1] - ] - }, - 'requests_per_url': { - 'options': [None, 'Requests Per Url', 'requests/s', 'urls', 'web_log.requests_per_url', 'stacked'], - 'lines': [ - ['url_pattern_other', 'other', 'incremental', 1, 1] - ] - }, - 'requests_per_user_defined': { - 'options': [None, 'Requests Per User Defined Pattern', 'requests/s', 'user defined', - 'web_log.requests_per_user_defined', 'stacked'], - 'lines': [ - ['user_pattern_other', 'other', 'incremental', 1, 1] - ] - }, - 'port': { - 'options': [None, 'Requests Per Port', 'requests/s', 'port', 'web_log.port', 'stacked'], - 'lines': [ - ['port_80', 'http', 'incremental', 1, 1], - ['port_443', 'https', 'incremental', 1, 1] - ] - }, - 'vhost': { - 'options': [None, 'Requests Per Vhost', 'requests/s', 'vhost', 'web_log.vhost', 'stacked'], - 'lines': [] - } -} - -CHARTS_APACHE_CACHE = { - 'apache_cache': { - 'options': [None, 'Apache Cached Responses', 'percentage', 'cached', 'web_log.apache_cache_cache', - 'stacked'], - 'lines': [ - ['hit', 'cache', 'percentage-of-absolute-row'], - ['miss', None, 'percentage-of-absolute-row'], - ['other', None, 'percentage-of-absolute-row'] - ] - } -} - -CHARTS_SQUID = { - 'squid_duration': { - 'options': [None, 'Elapsed Time The Transaction Busied The Cache', - 'milliseconds', 'squid_timings', 'web_log.squid_duration', 'area'], - 'lines': [ - ['duration_min', 'min', 'incremental', 1, 1000], - ['duration_max', 'max', 'incremental', 1, 1000], - ['duration_avg', 'avg', 'incremental', 1, 1000] - ] - }, - 'squid_bytes': { - 'options': [None, 'Amount Of Data Delivered To The Clients', - 'kilobits/s', 'squid_bandwidth', 'web_log.squid_bytes', 'area'], - 'lines': [ - ['bytes', 'sent', 'incremental', 8, 1000] - ] - }, - 'squid_response_statuses': { - 'options': [None, 'Response Statuses', 'responses/s', 'squid_responses', 'web_log.squid_response_statuses', - 'stacked'], - 'lines': [ - ['successful_requests', 'success', 'incremental', 1, 1], - ['server_errors', 'error', 'incremental', 1, 1], - ['redirects', 'redirect', 'incremental', 1, 1], - ['bad_requests', 'bad', 'incremental', 1, 1], - ['other_requests', 'other', 'incremental', 1, 1] - ] - }, - 'squid_response_codes': { - 'options': [None, 'Response Codes', 'responses/s', 'squid_responses', - 'web_log.squid_response_codes', 'stacked'], - 'lines': [ - ['2xx', None, 'incremental'], - ['5xx', None, 'incremental'], - ['3xx', None, 'incremental'], - ['4xx', None, 'incremental'], - ['1xx', None, 'incremental'], - ['0xx', None, 'incremental'], - ['other', None, 'incremental'], - ['unmatched', None, 'incremental'] - ] - }, - 'squid_code': { - 'options': [None, 'Responses Per Cache Result Of The Request', - 'requests/s', 'squid_squid_cache', 'web_log.squid_code', 'stacked'], - 'lines': [] - }, - 'squid_detailed_response_codes': { - 'options': [None, 'Detailed Response Codes', - 'responses/s', 'squid_responses', 'web_log.squid_detailed_response_codes', 'stacked'], - 'lines': [] - }, - 'squid_hier_code': { - 'options': [None, 'Responses Per Hierarchy Code', - 'requests/s', 'squid_hierarchy', 'web_log.squid_hier_code', 'stacked'], - 'lines': [] - }, - 'squid_method': { - 'options': [None, 'Requests Per Method', - 'requests/s', 'squid_requests', 'web_log.squid_method', 'stacked'], - 'lines': [] - }, - 'squid_mime_type': { - 'options': [None, 'Requests Per MIME Type', - 'requests/s', 'squid_requests', 'web_log.squid_mime_type', 'stacked'], - 'lines': [] - }, - 'squid_clients': { - 'options': [None, 'Current Poll Unique Client IPs', 'unique ips', 'squid_clients', - 'web_log.squid_clients', 'stacked'], - 'lines': [ - ['unique_ipv4', 'ipv4', 'incremental'], - ['unique_ipv6', 'ipv6', 'incremental'] - ] - }, - 'squid_clients_all': { - 'options': [None, 'All Time Unique Client IPs', 'unique ips', 'squid_clients', - 'web_log.squid_clients_all', 'stacked'], - 'lines': [ - ['unique_tot_ipv4', 'ipv4', 'absolute'], - ['unique_tot_ipv6', 'ipv6', 'absolute'] - ] - }, - 'squid_transport_methods': { - 'options': [None, 'Transport Methods', 'requests/s', 'squid_squid_transport', - 'web_log.squid_transport_methods', 'stacked'], - 'lines': [] - }, - 'squid_transport_errors': { - 'options': [None, 'Transport Errors', 'requests/s', 'squid_squid_transport', - 'web_log.squid_transport_errors', 'stacked'], - 'lines': [] - }, - 'squid_handling_opts': { - 'options': [None, 'Handling Opts', 'requests/s', 'squid_squid_cache', - 'web_log.squid_handling_opts', 'stacked'], - 'lines': [] - }, - 'squid_object_types': { - 'options': [None, 'Object Types', 'objects/s', 'squid_squid_cache', - 'web_log.squid_object_types', 'stacked'], - 'lines': [] - }, - 'squid_cache_events': { - 'options': [None, 'Cache Events', 'events/s', 'squid_squid_cache', - 'web_log.squid_cache_events', 'stacked'], - 'lines': [] - } -} - -NAMED_PATTERN = namedtuple('PATTERN', ['description', 'func']) - -DET_RESP_AGGR = ['', '_1xx', '_2xx', '_3xx', '_4xx', '_5xx', '_Other'] - -SQUID_CODES = { - 'TCP': 'squid_transport_methods', - 'UDP': 'squid_transport_methods', - 'NONE': 'squid_transport_methods', - 'CLIENT': 'squid_handling_opts', - 'IMS': 'squid_handling_opts', - 'ASYNC': 'squid_handling_opts', - 'SWAPFAIL': 'squid_handling_opts', - 'REFRESH': 'squid_handling_opts', - 'SHARED': 'squid_handling_opts', - 'REPLY': 'squid_handling_opts', - 'NEGATIVE': 'squid_object_types', - 'STALE': 'squid_object_types', - 'OFFLINE': 'squid_object_types', - 'INVALID': 'squid_object_types', - 'FAIL': 'squid_object_types', - 'MODIFIED': 'squid_object_types', - 'UNMODIFIED': 'squid_object_types', - 'REDIRECT': 'squid_object_types', - 'HIT': 'squid_cache_events', - 'MEM': 'squid_cache_events', - 'MISS': 'squid_cache_events', - 'DENIED': 'squid_cache_events', - 'NOFETCH': 'squid_cache_events', - 'TUNNEL': 'squid_cache_events', - 'ABORTED': 'squid_transport_errors', - 'TIMEOUT': 'squid_transport_errors' -} - -REQUEST_REGEX = re.compile(r'(?P<method>[A-Z]+) (?P<url>[^ ]+) [A-Z]+/(?P<http_version>\d(?:.\d)?)') - -MIME_TYPES = ['application', 'audio', 'example', 'font', 'image', 'message', 'model', 'multipart', 'text', 'video'] - - -class Service(LogService): - def __init__(self, configuration=None, name=None): - """ - :param configuration: - :param name: - """ - LogService.__init__(self, configuration=configuration, name=name) - self.configuration = configuration - self.log_path = self.configuration.get('path') - self.job = None - - def check(self): - """ - :return: bool - - 1. "log_path" is specified in the module configuration file - 2. "log_path" must be readable by netdata user and must exist - 3. "log_path' must not be empty. We need at least 1 line to find appropriate pattern to parse - 4. other checks depends on log "type" - """ - - log_type = self.configuration.get('type', 'web') - log_types = dict(web=Web, apache_cache=ApacheCache, squid=Squid) - - if log_type not in log_types: - self.error('bad log type {log_type}. Supported types: {types}'.format(log_type=log_type, - types=log_types.keys())) - return False - - if not self.log_path: - self.error('log path is not specified') - return False - - if not (self._find_recent_log_file() and os.access(self.log_path, os.R_OK)): - self.error('{log_file} not readable or not exist'.format(log_file=self.log_path)) - return False - - if not os.path.getsize(self.log_path): - self.error('{log_file} is empty'.format(log_file=self.log_path)) - return False - - self.job = log_types[log_type](self) - if self.job.check(): - self.order = self.job.order - self.definitions = self.job.definitions - return True - return False - - def _get_data(self): - return self.job.get_data(self._get_raw_data()) - - -class Web: - def __init__(self, service): - self.service = service - self.order = ORDER_WEB[:] - self.definitions = deepcopy(CHARTS_WEB) - self.pre_filter = check_patterns('filter', self.configuration.get('filter')) - self.storage = dict() - self.data = { - 'bytes_sent': 0, - 'resp_length': 0, - 'resp_time_min': 0, - 'resp_time_max': 0, - 'resp_time_avg': 0, - 'resp_time_upstream_min': 0, - 'resp_time_upstream_max': 0, - 'resp_time_upstream_avg': 0, - 'unique_cur_ipv4': 0, - 'unique_cur_ipv6': 0, - '2xx': 0, - '5xx': 0, - '3xx': 0, - '4xx': 0, - '1xx': 0, - '0xx': 0, - 'unmatched': 0, - 'req_ipv4': 0, - 'req_ipv6': 0, - 'unique_tot_ipv4': 0, - 'unique_tot_ipv6': 0, - 'successful_requests': 0, - 'redirects': 0, - 'bad_requests': 0, - 'server_errors': 0, - 'other_requests': 0, - 'GET': 0 - } - - def __getattr__(self, item): - return getattr(self.service, item) - - def check(self): - last_line = read_last_line(self.log_path) - if not last_line: - return False - # Custom_log_format or predefined log format. - if self.configuration.get('custom_log_format'): - match_dict, error = self.find_regex_custom(last_line) - else: - match_dict, error = self.find_regex(last_line) - - # "match_dict" is None if there are any problems - if match_dict is None: - self.error(error) - return False - - self.storage['unique_all_time'] = list() - self.storage['url_pattern'] = check_patterns('url_pattern', self.configuration.get('categories')) - self.storage['user_pattern'] = check_patterns('user_pattern', self.configuration.get('user_defined')) - - self.create_web_charts(match_dict) # Create charts - self.info('Collected data: %s' % list(match_dict.keys())) - return True - - def create_web_charts(self, match_dict): - """ - :param match_dict: dict: regex.search.groupdict(). Ex. {'address': '127.0.0.1', 'code': '200', 'method': 'GET'} - :return: - Create/remove additional charts depending on the 'match_dict' keys and configuration file options - """ - if 'resp_time' not in match_dict: - self.order.remove('response_time') - self.order.remove('response_time_hist') - if 'resp_time_upstream' not in match_dict: - self.order.remove('response_time_upstream') - self.order.remove('response_time_upstream_hist') - - # Add 'response_time_hist' and 'response_time_upstream_hist' charts if is specified in the configuration - histogram = self.configuration.get('histogram', None) - if isinstance(histogram, list): - self.storage['bucket_index'] = histogram[:] - self.storage['bucket_index'].append(maxint) - self.storage['buckets'] = [0] * (len(histogram) + 1) - self.storage['upstream_buckets'] = [0] * (len(histogram) + 1) - hist_lines = self.definitions['response_time_hist']['lines'] - upstream_hist_lines = self.definitions['response_time_upstream_hist']['lines'] - for i, le in enumerate(histogram): - hist_key = 'response_time_hist_%d' % i - upstream_hist_key = 'response_time_upstream_hist_%d' % i - hist_lines.append([hist_key, str(le), 'incremental', 1, 1]) - upstream_hist_lines.append([upstream_hist_key, str(le), 'incremental', 1, 1]) - - hist_lines.append(['response_time_hist_%d' % len(histogram), '+Inf', 'incremental', 1, 1]) - upstream_hist_lines.append(['response_time_upstream_hist_%d' % len(histogram), '+Inf', 'incremental', 1, 1]) - elif histogram is not None: - self.error('expect histogram list, but was {0}'.format(type(histogram))) - - if not self.configuration.get('all_time', True): - self.order.remove('clients_all') - - # Add 'detailed_response_codes' chart if specified in the configuration - if self.configuration.get('detailed_response_codes', True): - if self.configuration.get('detailed_response_aggregate', True): - codes = DET_RESP_AGGR[:1] - else: - codes = DET_RESP_AGGR[1:] - - for code in codes: - self.order.append('detailed_response_codes%s' % code) - self.definitions['detailed_response_codes%s' % code] = { - 'options': [None, 'Detailed Response Codes %s' % code[1:], 'requests/s', 'responses', - 'web_log.detailed_response_codes%s' % code, 'stacked'], - 'lines': [] - } - - # Add 'requests_per_url' chart if specified in the configuration - if self.storage['url_pattern']: - for elem in self.storage['url_pattern']: - dim = [elem.description, elem.description[12:], 'incremental'] - self.definitions['requests_per_url']['lines'].append(dim) - self.data[elem.description] = 0 - self.data['url_pattern_other'] = 0 - else: - self.order.remove('requests_per_url') - - # Add 'requests_per_user_defined' chart if specified in the configuration - if self.storage['user_pattern'] and 'user_defined' in match_dict: - for elem in self.storage['user_pattern']: - dim = [elem.description, elem.description[13:], 'incremental'] - self.definitions['requests_per_user_defined']['lines'].append(dim) - self.data[elem.description] = 0 - self.data['user_pattern_other'] = 0 - else: - self.order.remove('requests_per_user_defined') - - def get_data(self, raw_data=None): - """ - Parses new log lines - :return: dict OR None - None if _get_raw_data method fails. - In all other cases - dict. - """ - if not raw_data: - return None if raw_data is None else self.data - - filtered_data = filter_data(raw_data=raw_data, pre_filter=self.pre_filter) - - unique_current = set() - timings = defaultdict(lambda: dict(minimum=None, maximum=0, summary=0, count=0)) - - for line in filtered_data: - match = self.storage['regex'].search(line) - if match: - match_dict = match.groupdict() - try: - code = match_dict['code'][0] + 'xx' - self.data[code] += 1 - except KeyError: - self.data['0xx'] += 1 - # detailed response code - if self.configuration.get('detailed_response_codes', True): - self.get_data_per_response_codes_detailed(code=match_dict['code']) - # response statuses - self.get_data_per_statuses(code=match_dict['code']) - # requests per user defined pattern - if self.storage['user_pattern'] and 'user_defined' in match_dict: - self.get_data_per_pattern(row=match_dict['user_defined'], - other='user_pattern_other', - pattern=self.storage['user_pattern']) - # method, url, http version - self.get_data_from_request_field(match_dict=match_dict) - # bandwidth sent - bytes_sent = match_dict['bytes_sent'] if '-' not in match_dict['bytes_sent'] else 0 - self.data['bytes_sent'] += int(bytes_sent) - # request processing time and bandwidth received - if 'resp_length' in match_dict: - resp_length = match_dict['resp_length'] if '-' not in match_dict['resp_length'] else 0 - self.data['resp_length'] += int(resp_length) - if 'resp_time' in match_dict: - resp_time = self.storage['func_resp_time'](float(match_dict['resp_time'])) - get_timings(timings=timings['resp_time'], time=resp_time) - if 'bucket_index' in self.storage: - get_hist(self.storage['bucket_index'], self.storage['buckets'], resp_time / 1000) - if 'resp_time_upstream' in match_dict and match_dict['resp_time_upstream'] != '-': - resp_time_upstream = self.storage['func_resp_time'](float(match_dict['resp_time_upstream'])) - get_timings(timings=timings['resp_time_upstream'], time=resp_time_upstream) - if 'bucket_index' in self.storage: - get_hist(self.storage['bucket_index'], self.storage['upstream_buckets'], resp_time / 1000) - # requests per ip proto - proto = 'ipv6' if ':' in match_dict['address'] else 'ipv4' - self.data['req_' + proto] += 1 - # unique clients ips - if self.configuration.get('all_time', True): - if address_not_in_pool(pool=self.storage['unique_all_time'], - address=match_dict['address'], - pool_size=self.data['unique_tot_ipv4'] + self.data['unique_tot_ipv6']): - self.data['unique_tot_' + proto] += 1 - if match_dict['address'] not in unique_current: - self.data['unique_cur_' + proto] += 1 - unique_current.add(match_dict['address']) - else: - self.data['unmatched'] += 1 - - # timings - for elem in timings: - self.data[elem + '_min'] += timings[elem]['minimum'] - self.data[elem + '_avg'] += timings[elem]['summary'] / timings[elem]['count'] - self.data[elem + '_max'] += timings[elem]['maximum'] - - # histogram - if 'bucket_index' in self.storage: - buckets = self.storage['buckets'] - upstream_buckets = self.storage['upstream_buckets'] - for i in range(0, len(self.storage['bucket_index'])): - hist_key = 'response_time_hist_%d' % i - upstream_hist_key = 'response_time_upstream_hist_%d' % i - self.data[hist_key] = buckets[i] - self.data[upstream_hist_key] = upstream_buckets[i] - - return self.data - - def find_regex(self, last_line): - """ - :param last_line: str: literally last line from log file - :return: tuple where: - [0]: dict or None: match_dict or None - [1]: str: error description - We need to find appropriate pattern for current log file - All logic is do a regex search through the string for all predefined patterns - until we find something or fail. - """ - # REGEX: 1.IPv4 address 2.HTTP method 3. URL 4. Response code - # 5. Bytes sent 6. Response length 7. Response process time - default = re.compile(r'(?P<address>[\da-f.:]+|localhost)' - r' -.*?"(?P<request>[^"]*)"' - r' (?P<code>[1-9]\d{2})' - r' (?P<bytes_sent>\d+|-)') - - apache_ext_insert = re.compile(r'(?P<address>[\da-f.:]+|localhost)' - r' -.*?"(?P<request>[^"]*)"' - r' (?P<code>[1-9]\d{2})' - r' (?P<bytes_sent>\d+|-)' - r' (?P<resp_length>\d+|-)' - r' (?P<resp_time>\d+) ') - - apache_ext_append = re.compile(r'(?P<address>[\da-f.:]+|localhost)' - r' -.*?"(?P<request>[^"]*)"' - r' (?P<code>[1-9]\d{2})' - r' (?P<bytes_sent>\d+|-)' - r' .*?' - r' (?P<resp_length>\d+|-)' - r' (?P<resp_time>\d+)' - r'(?: |$)') - - nginx_ext_insert = re.compile(r'(?P<address>[\da-f.:]+)' - r' -.*?"(?P<request>[^"]*)"' - r' (?P<code>[1-9]\d{2})' - r' (?P<bytes_sent>\d+)' - r' (?P<resp_length>\d+)' - r' (?P<resp_time>\d+\.\d+) ') - - nginx_ext2_insert = re.compile(r'(?P<address>[\da-f.:]+)' - r' -.*?"(?P<request>[^"]*)"' - r' (?P<code>[1-9]\d{2})' - r' (?P<bytes_sent>\d+)' - r' (?P<resp_length>\d+)' - r' (?P<resp_time>\d+\.\d+)' - r' (?P<resp_time_upstream>[\d.-]+)') - - nginx_ext_append = re.compile(r'(?P<address>[\da-f.:]+)' - r' -.*?"(?P<request>[^"]*)"' - r' (?P<code>[1-9]\d{2})' - r' (?P<bytes_sent>\d+)' - r' .*?' - r' (?P<resp_length>\d+)' - r' (?P<resp_time>\d+\.\d+)') - - def func_usec(time): - return time - - def func_sec(time): - return time * 1000000 - - r_regex = [apache_ext_insert, apache_ext_append, - nginx_ext2_insert, nginx_ext_insert, nginx_ext_append, - default] - r_function = [func_usec, func_usec, func_sec, func_sec, func_sec, func_usec] - regex_function = zip(r_regex, r_function) - - match_dict = dict() - for regex, func in regex_function: - match = regex.search(last_line) - if match: - self.storage['regex'] = regex - self.storage['func_resp_time'] = func - match_dict = match.groupdict() - break - - return find_regex_return(match_dict=match_dict or None, - msg='Unknown log format. You need to use "custom_log_format" feature.') - - def find_regex_custom(self, last_line): - """ - :param last_line: str: literally last line from log file - :return: tuple where: - [0]: dict or None: match_dict or None - [1]: str: error description - - We are here only if "custom_log_format" is in logs. We need to make sure: - 1. "custom_log_format" is a dict - 2. "pattern" in "custom_log_format" and pattern is <str> instance - 3. if "time_multiplier" is in "custom_log_format" it must be <int> or <float> instance - - If all parameters is ok we need to make sure: - 1. Pattern search is success - 2. Pattern search contains named subgroups (?P<subgroup_name>) (= "match_dict") - - If pattern search is success we need to make sure: - 1. All mandatory keys ['address', 'code', 'bytes_sent', 'method', 'url'] are in "match_dict" - - If this is True we need to make sure: - 1. All mandatory key values from "match_dict" have the correct format - ("code" is integer, "method" is uppercase word, etc) - - If non mandatory keys in "match_dict" we need to make sure: - 1. All non mandatory key values from match_dict ['resp_length', 'resp_time'] have the correct format - ("resp_length" is integer or "-", "resp_time" is integer or float) - - """ - if not hasattr(self.configuration.get('custom_log_format'), 'keys'): - return find_regex_return(msg='Custom log: "custom_log_format" is not a <dict>') - - pattern = self.configuration.get('custom_log_format', dict()).get('pattern') - if not (pattern and isinstance(pattern, str)): - return find_regex_return(msg='Custom log: "pattern" option is not specified or type is not <str>') - - resp_time_func = self.configuration.get('custom_log_format', dict()).get('time_multiplier') or 0 - - if not isinstance(resp_time_func, (int, float)): - return find_regex_return(msg='Custom log: "time_multiplier" is not an integer or a float') - - try: - regex = re.compile(pattern) - except re.error as error: - return find_regex_return(msg='Pattern compile error: %s' % str(error)) - - match = regex.search(last_line) - if not match: - return find_regex_return(msg='Custom log: pattern search FAILED') - - match_dict = match.groupdict() or None - if match_dict is None: - return find_regex_return(msg='Custom log: search OK but contains no named subgroups' - ' (you need to use ?P<subgroup_name>)') - mandatory_dict = {'address': r'[\w.:-]+', - 'code': r'[1-9]\d{2}', - 'bytes_sent': r'\d+|-'} - optional_dict = {'resp_length': r'\d+|-', - 'resp_time': r'[\d.]+', - 'resp_time_upstream': r'[\d.-]+', - 'method': r'[A-Z]+', - 'http_version': r'\d(?:.\d)?'} - - mandatory_values = set(mandatory_dict) - set(match_dict) - if mandatory_values: - return find_regex_return(msg='Custom log: search OK but some mandatory keys (%s) are missing' - % list(mandatory_values)) - for key in mandatory_dict: - if not re.search(mandatory_dict[key], match_dict[key]): - return find_regex_return(msg='Custom log: can\'t parse "%s": %s' - % (key, match_dict[key])) - - optional_values = set(optional_dict) & set(match_dict) - for key in optional_values: - if not re.search(optional_dict[key], match_dict[key]): - return find_regex_return(msg='Custom log: can\'t parse "%s": %s' - % (key, match_dict[key])) - - dot_in_time = '.' in match_dict.get('resp_time', '') - if dot_in_time: - self.storage['func_resp_time'] = lambda time: time * (resp_time_func or 1000000) - else: - self.storage['func_resp_time'] = lambda time: time * (resp_time_func or 1) - - self.storage['regex'] = regex - return find_regex_return(match_dict=match_dict) - - def get_data_from_request_field(self, match_dict): - if match_dict.get('request'): - match_dict = REQUEST_REGEX.search(match_dict['request']) - if match_dict: - match_dict = match_dict.groupdict() - else: - return - # requests per url - if match_dict.get('url') and self.storage['url_pattern']: - self.get_data_per_pattern(row=match_dict['url'], - other='url_pattern_other', - pattern=self.storage['url_pattern']) - # requests per http method - if match_dict.get('method'): - if match_dict['method'] not in self.data: - self.charts['http_method'].add_dimension([match_dict['method'], - match_dict['method'], - 'incremental']) - self.data[match_dict['method']] = 0 - self.data[match_dict['method']] += 1 - # requests per http version - if match_dict.get('http_version'): - dim_id = match_dict['http_version'].replace('.', '_') - if dim_id not in self.data: - self.charts['http_version'].add_dimension([dim_id, - match_dict['http_version'], - 'incremental']) - self.data[dim_id] = 0 - self.data[dim_id] += 1 - # requests per port number - if match_dict.get('port'): - if match_dict['port'] not in self.data: - self.charts['port'].add_dimension([match_dict['port'], - match_dict['port'], - 'incremental']) - self.data[match_dict['port']] = 0 - self.data[match_dict['port']] += 1 - # requests per vhost - if match_dict.get('vhost'): - dim_id = match_dict['vhost'].replace('.', '_') - if dim_id not in self.data: - self.charts['vhost'].add_dimension([dim_id, - match_dict['vhost'], - 'incremental']) - self.data[dim_id] = 0 - self.data[dim_id] += 1 - - def get_data_per_response_codes_detailed(self, code): - """ - :param code: str: CODE from parsed line. Ex.: '202, '499' - :return: - Calls add_new_dimension method If the value is found for the first time - """ - if code not in self.data: - if self.configuration.get('detailed_response_aggregate', True): - self.charts['detailed_response_codes'].add_dimension([code, code, 'incremental']) - self.data[code] = 0 - else: - code_index = int(code[0]) if int(code[0]) < 6 else 6 - chart_key = 'detailed_response_codes' + DET_RESP_AGGR[code_index] - self.charts[chart_key].add_dimension([code, code, 'incremental']) - self.data[code] = 0 - self.data[code] += 1 - - def get_data_per_pattern(self, row, other, pattern): - """ - :param row: str: - :param other: str: - :param pattern: named tuple: (['pattern_description', 'regular expression']) - :return: - Scan through string looking for the first location where patterns produce a match for all user - defined patterns - """ - match = None - for elem in pattern: - if elem.func(row): - self.data[elem.description] += 1 - match = True - break - if not match: - self.data[other] += 1 - - def get_data_per_statuses(self, code): - """ - :param code: str: response status code. Ex.: '202', '499' - :return: - """ - code_class = code[0] - if code_class == '2' or code == '304' or code_class == '1' or code == '401': - self.data['successful_requests'] += 1 - elif code_class == '3': - self.data['redirects'] += 1 - elif code_class == '4': - self.data['bad_requests'] += 1 - elif code_class == '5': - self.data['server_errors'] += 1 - else: - self.data['other_requests'] += 1 - - -class ApacheCache: - def __init__(self, service): - self.service = service - self.order = ORDER_APACHE_CACHE - self.definitions = CHARTS_APACHE_CACHE - - @staticmethod - def check(): - return True - - @staticmethod - def get_data(raw_data=None): - data = dict(hit=0, miss=0, other=0) - if not raw_data: - return None if raw_data is None else data - - for line in raw_data: - if 'cache hit' in line: - data['hit'] += 1 - elif 'cache miss' in line: - data['miss'] += 1 - else: - data['other'] += 1 - return data - - -class Squid: - def __init__(self, service): - self.service = service - self.order = ORDER_SQUID - self.definitions = CHARTS_SQUID - self.pre_filter = check_patterns('filter', self.configuration.get('filter')) - self.storage = dict() - self.data = { - 'duration_max': 0, - 'duration_avg': 0, - 'duration_min': 0, - 'bytes': 0, - '0xx': 0, - '1xx': 0, - '2xx': 0, - '3xx': 0, - '4xx': 0, - '5xx': 0, - 'other': 0, - 'unmatched': 0, - 'unique_ipv4': 0, - 'unique_ipv6': 0, - 'unique_tot_ipv4': 0, - 'unique_tot_ipv6': 0, - 'successful_requests': 0, - 'redirects': 0, - 'bad_requests': 0, - 'server_errors': 0, - 'other_requests': 0 - } - - def __getattr__(self, item): - return getattr(self.service, item) - - def check(self): - last_line = read_last_line(self.log_path) - if not last_line: - return False - self.storage['unique_all_time'] = list() - self.storage['regex'] = re.compile(r'[0-9.]+\s+(?P<duration>[0-9]+)' - r' (?P<client_address>[\da-f.:]+)' - r' (?P<squid_code>[A-Z_]+)/' - r'(?P<http_code>[0-9]+)' - r' (?P<bytes>[0-9]+)' - r' (?P<method>[A-Z_]+)' - r' (?P<url>[^ ]+)' - r' (?P<user>[^ ]+)' - r' (?P<hier_code>[A-Z_]+)/[\da-z.:-]+' - r' (?P<mime_type>[A-Za-z-]*)') - - match = self.storage['regex'].search(last_line) - if not match: - self.error('Regex not matches (%s)' % self.storage['regex'].pattern) - return False - self.storage['dynamic'] = { - 'http_code': { - 'chart': 'squid_detailed_response_codes', - 'func_dim_id': None, - 'func_dim': None - }, - 'hier_code': { - 'chart': 'squid_hier_code', - 'func_dim_id': None, - 'func_dim': lambda v: v.replace('HIER_', '') - }, - 'method': { - 'chart': 'squid_method', - 'func_dim_id': None, - 'func_dim': None - }, - 'mime_type': { - 'chart': 'squid_mime_type', - 'func_dim_id': lambda v: str.lower(v) if str.lower(v) in MIME_TYPES else 'unknown', - 'func_dim': None - } - } - if not self.configuration.get('all_time', True): - self.order.remove('squid_clients_all') - return True - - def get_data(self, raw_data=None): - if not raw_data: - return None if raw_data is None else self.data - - filtered_data = filter_data(raw_data=raw_data, pre_filter=self.pre_filter) - - unique_ip = set() - timings = defaultdict(lambda: dict(minimum=None, maximum=0, summary=0, count=0)) - - for row in filtered_data: - match = self.storage['regex'].search(row) - if match: - match = match.groupdict() - if match['duration'] != '0': - get_timings(timings=timings['duration'], time=float(match['duration']) * 1000) - try: - self.data[match['http_code'][0] + 'xx'] += 1 - except KeyError: - self.data['other'] += 1 - - self.get_data_per_statuses(match['http_code']) - - self.get_data_per_squid_code(match['squid_code']) - - self.data['bytes'] += int(match['bytes']) - - proto = 'ipv4' if '.' in match['client_address'] else 'ipv6' - # unique clients ips - if self.configuration.get('all_time', True): - if address_not_in_pool(pool=self.storage['unique_all_time'], - address=match['client_address'], - pool_size=self.data['unique_tot_ipv4'] + self.data['unique_tot_ipv6']): - self.data['unique_tot_' + proto] += 1 - - if match['client_address'] not in unique_ip: - self.data['unique_' + proto] += 1 - unique_ip.add(match['client_address']) - - for key, values in self.storage['dynamic'].items(): - if match[key] == '-': - continue - dimension_id = values['func_dim_id'](match[key]) if values['func_dim_id'] else match[key] - if dimension_id not in self.data: - dimension = values['func_dim'](match[key]) if values['func_dim'] else dimension_id - self.charts[values['chart']].add_dimension([dimension_id, - dimension, - 'incremental']) - self.data[dimension_id] = 0 - self.data[dimension_id] += 1 - else: - self.data['unmatched'] += 1 - - for elem in timings: - self.data[elem + '_min'] += timings[elem]['minimum'] - self.data[elem + '_avg'] += timings[elem]['summary'] / timings[elem]['count'] - self.data[elem + '_max'] += timings[elem]['maximum'] - return self.data - - def get_data_per_statuses(self, code): - """ - :param code: str: response status code. Ex.: '202', '499' - :return: - """ - code_class = code[0] - if code_class == '2' or code == '304' or code_class == '1' or code == '000': - self.data['successful_requests'] += 1 - elif code_class == '3': - self.data['redirects'] += 1 - elif code_class == '4': - self.data['bad_requests'] += 1 - elif code_class == '5' or code_class == '6': - self.data['server_errors'] += 1 - else: - self.data['other_requests'] += 1 - - def get_data_per_squid_code(self, code): - """ - :param code: str: squid response code. Ex.: 'TCP_MISS', 'TCP_MISS_ABORTED' - :return: - """ - if code not in self.data: - self.charts['squid_code'].add_dimension([code, code, 'incremental']) - self.data[code] = 0 - self.data[code] += 1 - - for tag in code.split('_'): - try: - chart_key = SQUID_CODES[tag] - except KeyError: - continue - dimension_id = '_'.join(['code_detailed', tag]) - if dimension_id not in self.data: - self.charts[chart_key].add_dimension([dimension_id, tag, 'incremental']) - self.data[dimension_id] = 0 - self.data[dimension_id] += 1 - - -def get_timings(timings, time): - """ - :param timings: - :param time: - :return: - """ - if timings['minimum'] is None: - timings['minimum'] = time - if time > timings['maximum']: - timings['maximum'] = time - elif time < timings['minimum']: - timings['minimum'] = time - timings['summary'] += time - timings['count'] += 1 - - -def get_hist(index, buckets, time): - """ - :param index: histogram index (Ex. [10, 50, 100, 150, ...]) - :param buckets: histogram buckets - :param time: time - :return: None - """ - for i in range(len(index) - 1, -1, -1): - if time <= index[i]: - buckets[i] += 1 - else: - break - - -def address_not_in_pool(pool, address, pool_size): - """ - :param pool: list of ip addresses - :param address: ip address - :param pool_size: current pool size - :return: True if address not in pool. False otherwise. - """ - index = bisect.bisect_left(pool, address) - if index < pool_size: - if pool[index] == address: - return False - bisect.insort_left(pool, address) - return True - bisect.insort_left(pool, address) - return True - - -def find_regex_return(match_dict=None, msg='Generic error message'): - """ - :param match_dict: dict: re.search.groupdict() or None - :param msg: str: error description - :return: tuple: - """ - return match_dict, msg - - -def check_patterns(string, dimension_regex_dict): - """ - :param string: str: - :param dimension_regex_dict: dict: ex. {'dim1': '<pattern1>', 'dim2': '<pattern2>'} - :return: list of named tuples or None: - We need to make sure all patterns are valid regular expressions - """ - if not hasattr(dimension_regex_dict, 'keys'): - return None - - result = list() - - def valid_pattern(pattern): - """ - :param pattern: str - :return: re.compile(pattern) or None - """ - if not isinstance(pattern, str): - return False - try: - return re.compile(pattern) - except re.error: - return False - - def func_search(pattern): - def closure(v): - return pattern.search(v) - - return closure - - for dimension, regex in dimension_regex_dict.items(): - valid = valid_pattern(regex) - if isinstance(dimension, str) and valid_pattern: - func = func_search(valid) - result.append(NAMED_PATTERN(description='_'.join([string, dimension]), - func=func)) - return result or None - - -def filter_data(raw_data, pre_filter): - """ - :param raw_data: - :param pre_filter: - :return: - """ - - if not pre_filter: - return raw_data - filtered = raw_data - for elem in pre_filter: - if elem.description == 'filter_include': - filtered = filter(elem.func, filtered) - elif elem.description == 'filter_exclude': - filtered = filterfalse(elem.func, filtered) - return filtered diff --git a/collectors/python.d.plugin/web_log/web_log.conf b/collectors/python.d.plugin/web_log/web_log.conf deleted file mode 100644 index 220b7c283..000000000 --- a/collectors/python.d.plugin/web_log/web_log.conf +++ /dev/null @@ -1,219 +0,0 @@ -# netdata python.d.plugin configuration for web log -# -# This file is in YaML format. Generally the format is: -# -# name: value -# -# There are 2 sections: -# - global variables -# - one or more JOBS -# -# JOBS allow you to collect values from multiple sources. -# Each source will have its own set of charts. -# -# JOB parameters have to be indented (using spaces only, example below). - -# ---------------------------------------------------------------------- -# Global Variables -# These variables set the defaults for all JOBs, however each JOB -# may define its own, overriding the defaults. - -# update_every sets the default data collection frequency. -# If unset, the python.d.plugin default is used. -# update_every: 1 - -# priority controls the order of charts at the netdata dashboard. -# Lower numbers move the charts towards the top of the page. -# If unset, the default for python.d.plugin is used. -# priority: 60000 - -# penalty indicates whether to apply penalty to update_every in case of failures. -# Penalty will increase every 5 failed updates in a row. Maximum penalty is 10 minutes. -# penalty: yes - -# autodetection_retry sets the job re-check interval in seconds. -# The job is not deleted if check fails. -# Attempts to start the job are made once every autodetection_retry. -# This feature is disabled by default. -# autodetection_retry: 0 - -# ---------------------------------------------------------------------- -# JOBS (data collection sources) -# -# The default JOBS share the same *name*. JOBS with the same name -# are mutually exclusive. Only one of them will be allowed running at -# any time. This allows autodetection to try several alternatives and -# pick the one that works. -# -# Any number of jobs is supported. - -# ---------------------------------------------------------------------- -# PLUGIN CONFIGURATION -# -# All python.d.plugin JOBS (for all its modules) support a set of -# predefined parameters. These are: -# -# job_name: -# name: myname # the JOB's name as it will appear at the -# # dashboard (by default is the job_name) -# # JOBs sharing a name are mutually exclusive -# update_every: 1 # the JOB's data collection frequency -# priority: 60000 # the JOB's order on the dashboard -# penalty: yes # the JOB's penalty -# autodetection_retry: 0 # the JOB's re-check interval in seconds -# -# Additionally to the above, web_log also supports the following: -# -# path: 'PATH' # the path to web server log file -# path: 'PATH[0-9]*[0-9]' # log files with date suffix are also supported -# detailed_response_codes: yes/no # default: yes. Additional chart where response codes are not grouped -# detailed_response_aggregate: yes/no # default: yes. Not aggregated detailed response codes charts -# all_time : yes/no # default: yes. All time unique client IPs chart (50000 addresses ~ 400KB) -# filter: # filter with regex -# include: 'REGEX' # only those rows that matches the regex -# exclude: 'REGEX' # all rows except those that matches the regex -# categories: # requests per url chart configuration -# cacti: 'cacti.*' # name(dimension): REGEX to match -# observium: 'observium.*' # name(dimension): REGEX to match -# stub_status: 'stub_status' # name(dimension): REGEX to match -# user_defined: # requests per pattern in <user_defined> field (custom_log_format) -# cacti: 'cacti.*' # name(dimension): REGEX to match -# observium: 'observium.*' # name(dimension): REGEX to match -# stub_status: 'stub_status' # name(dimension): REGEX to match -# custom_log_format: # define a custom log format -# pattern: '(?P<address>[\da-f.:]+) -.*?"(?P<method>[A-Z]+) (?P<url>.*?)" (?P<code>[1-9]\d{2}) (?P<bytes_sent>\d+) (?P<resp_length>\d+) (?P<resp_time>\d+\.\d+) ' -# time_multiplier: 1000000 # type <int>/<float> - convert time to microseconds -# histogram: [1,3,10,30,100, ...] # type list of int - Cumulative histogram of response time in milli seconds - -# ---------------------------------------------------------------------- -# WEB SERVER CONFIGURATION -# -# Make sure the web server log directory and the web server log files -# can be read by user 'netdata'. -# -# To enable the timings chart and the requests size dimension, the -# web server needs to log them. This is how to add them: -# -# nginx: -# log_format netdata '$remote_addr - $remote_user [$time_local] ' -# '"$request" $status $body_bytes_sent ' -# '$request_length $request_time $upstream_response_time ' -# '"$http_referer" "$http_user_agent"'; -# access_log /var/log/nginx/access.log netdata; -# -# apache (you need mod_logio enabled): -# LogFormat "%h %l %u %t \"%r\" %>s %O %I %D \"%{Referer}i\" \"%{User-Agent}i\"" vhost_netdata -# LogFormat "%h %l %u %t \"%r\" %>s %O %I %D \"%{Referer}i\" \"%{User-Agent}i\"" netdata -# CustomLog "/var/log/apache2/access.log" netdata - -# ---------------------------------------------------------------------- -# VHOST AND PORT -# if your want to graph the request/sec per virtual host and per port (to check the number of requests in http vs https) - -# in apache : (%v gives the hostname, %p the port number) -# LogFormat "%v %p %h %t \"%r\" %>s %O %I %D \"%{Referer}i\" \"%{User-Agent}i\"" vhost_netdata -# -# and in this file in apache_vhosts_log section, add : -# custom_log_format: -# pattern: '(?P<vhost>[a-zA-Z\d.-_]+) (?P<port>\d+) (?P<address>[\da-f.:]+) \[.*\] "(?P<method>[A-Z]+)[^"]*" (?P<code>[1-9]\d{2}) (?P<bytes_sent>\d+) (?P<resp_length>\d+) (?P<resp_time>\d+)' - -# in nginx: ($host or $http_host give the hostname, $server_port the port number) -# log_format netdatavhost '$host $server_port $remote_addr - $remote_user [$time_local] ' -# '"$request" $status $body_bytes_sent ' -# '$request_length $request_time $upstream_response_time ' -# '"$http_referer" "$http_user_agent"'; -# -# access_log /var/log/nginx/access.log netdatavhost; -# -# be aware that the access_log directive in a server{} block overwrites the one in http{}, if your vhosts have individual log -# files, you have to specify the general netdata log in each vhost as a second access_log statement. -# -# and in this file in nginx_log section, add : -# custom_log_format: -# pattern: '(?P<vhost>[a-zA-Z\d.-_\[\]]+) (?P<port>\d+) (?P<address>[\da-f.:]+) .* "(?P<method>[A-Z]+)[^"]*" (?P<code>[1-9]\d{2}) (?P<bytes_sent>\d+) (?P<resp_length>\d+) (?P<resp_time>\d+)' - -# ---------------------------------------------------------------------- -# AUTO-DETECTION JOBS -# only one of them per web server will run (when they have the same name) - - -# ------------------------------------------- -# nginx log on various distros - -# debian, arch -nginx_log: - name: 'nginx' - path: '/var/log/nginx/access.log' - -# gentoo -nginx_log2: - name: 'nginx' - path: '/var/log/nginx/localhost.access_log' - - -# ------------------------------------------- -# apache log on various distros - -# debian -apache_log: - name: 'apache' - path: '/var/log/apache2/access.log' - -# gentoo -apache_log2: - name: 'apache' - path: '/var/log/apache2/access_log' - -# arch -apache_log3: - name: 'apache' - path: '/var/log/httpd/access_log' - -# debian -apache_vhosts_log: - name: 'apache_vhosts' - path: '/var/log/apache2/other_vhosts_access.log' - - -# ------------------------------------------- -# gunicorn log on various distros - -gunicorn_log: - name: 'gunicorn' - path: '/var/log/gunicorn/access.log' - -gunicorn_log2: - name: 'gunicorn' - path: '/var/log/gunicorn/gunicorn-access.log' - -# ------------------------------------------- -# Apache Cache -apache_cache: - name: 'apache_cache' - type: 'apache_cache' - path: '/var/log/apache/cache.log' - -apache2_cache: - name: 'apache_cache' - type: 'apache_cache' - path: '/var/log/apache2/cache.log' - -httpd_cache: - name: 'apache_cache' - type: 'apache_cache' - path: '/var/log/httpd/cache.log' - -# ------------------------------------------- -# Squid - -# debian/ubuntu -squid_log1: - name: 'squid' - type: 'squid' - path: '/var/log/squid3/access.log' - -#gentoo -squid_log2: - name: 'squid' - type: 'squid' - path: '/var/log/squid/access.log' diff --git a/collectors/slabinfo.plugin/slabinfo.c b/collectors/slabinfo.plugin/slabinfo.c index 0913b895e..2e47ee229 100644 --- a/collectors/slabinfo.plugin/slabinfo.c +++ b/collectors/slabinfo.plugin/slabinfo.c @@ -336,6 +336,7 @@ void usage(void) { } int main(int argc, char **argv) { + clocks_init(); program_name = argv[0]; program_version = "0.1"; diff --git a/collectors/statsd.plugin/README.md b/collectors/statsd.plugin/README.md index aadd55bd6..7dc5dbb72 100644 --- a/collectors/statsd.plugin/README.md +++ b/collectors/statsd.plugin/README.md @@ -11,17 +11,17 @@ If you want to learn more about the StatsD protocol, we have written a [blog pos Netdata is a fully featured statsd server. It can collect statsd formatted metrics, visualize them on its dashboards and store them in it's database for long-term retention. -Netdata statsd is inside Netdata (an internal plugin, running inside the Netdata daemon), it is configured via `netdata.conf` and by-default listens on standard statsd port 8125. Netdata supports both tcp and udp packets at the same time. +Netdata statsd is inside Netdata (an internal plugin, running inside the Netdata daemon), it is configured via `netdata.conf` and by-default listens on standard statsd port 8125. Netdata supports both TCP and UDP packets at the same time. Since statsd is embedded in Netdata, it means you now have a statsd server embedded on all your servers. -Netdata statsd is fast. It can collect more than **1.200.000 metrics per second** on modern hardware, more than **200Mbps of sustained statsd traffic**, using 1 CPU core. The implementation uses two threads: one thread collects metrics, another one updates the charts from the collected data. +Netdata statsd is fast. It can collect several millions of metrics per second on modern hardware, using just 1 CPU core. The implementation uses two threads: one thread collects metrics, another thread updates the charts from the collected data. -## Available StatsD collectors +## Available StatsD synthetic application charts -Netdata ships with collectors implemented using the StatsD collector. They are configuration files (as you will read below), but they function as a collector, in the sense that configuration file organize the metrics of a data source into pre-defined charts. +Netdata ships with a few synthetic chart definitions to automatically present application metrics into a more uniform way. These synthetic charts are configuration files (you can create your own) that re-arrange statsd metrics into a more meaningful way. -On these charts, we can have alarms as with any metric and chart. +On synthetic charts, we can have alarms as with any metric and chart. - [K6 load testing tool](https://k6.io) - **Description:** k6 is a developer-centric, free and open-source load testing tool built for making performance testing a productive and enjoyable experience. @@ -34,34 +34,36 @@ On these charts, we can have alarms as with any metric and chart. ## Metrics supported by Netdata -Netdata fully supports the StatsD protocol. All StatsD client libraries can be used with Netdata too. +Netdata fully supports the StatsD protocol and also extends it to support more advanced Netdata specific use cases. All StatsD client libraries can be used with Netdata too. -- **Gauges** +- **Gauges** The application sends `name:value|g`, where `value` is any **decimal/fractional** number, StatsD reports the latest value collected and the number of times it was updated (events). The application may increment or decrement a previous value, by setting the first character of the value to `+` or `-` (so, the only way to set a gauge to an absolute negative value, is to first set it to zero). [Sampling rate](#sampling-rates) is supported. + [Tags](#tags) are supported for changing chart units, family and dimension name. When a gauge is not collected and the setting is not to show gaps on the charts (the default), the last value will be shown, until a data collection event changes it. -- **Counters** and **Meters** +- **Counters** and **Meters** The application sends `name:value|c`, `name:value|C` or `name:value|m`, where `value` is a positive or negative **integer** number of events occurred, StatsD reports the **rate** and the number of times it was updated (events). - `:value` can be omitted and StatsD will assume it is `1`. `|c`, `|C` and `|m` can be omitted an StatsD will assume it is `|m`. So, the application may send just `name` and StatsD will parse it as `name:1|m`. + `:value` can be omitted and StatsD will assume it is `1`. `|c`, `|C` and `|m` can be omitted and StatsD will assume it is `|m`. So, the application may send just `name` and StatsD will parse it as `name:1|m`. - Counters use `|c` (etsy/StatsD compatible) or `|C` (brubeck compatible) - Meters use `|m` [Sampling rate](#sampling-rates) is supported. + [Tags](#tags) are supported for changing chart units, family and dimension name. - When a counter or meter is not collected, Netdata **defaults** to showing a zero value, until a data collection event changes the value. + When a counter or meter is not collected, StatsD **defaults** to showing a zero value, until a data collection event changes the value. -- **Timers** and **Histograms** +- **Timers** and **Histograms** - The application sends `name:value|ms` or `name:value|h`, where `value` is any **decimal/fractional** number, StatsD reports **min**, **max**, **average**, **sum**, **95th percentile**, **median** and **standard deviation** and the total number of times it was updated (events). + The application sends `name:value|ms` or `name:value|h`, where `value` is any **decimal/fractional** number, StatsD reports **min**, **max**, **average**, **95th percentile**, **median** and **standard deviation** and the total number of times it was updated (events). Internally it also calculates the **sum**, which is available for synthetic charts. - Timers use `|ms` - Histograms use `|h` @@ -69,38 +71,74 @@ Netdata fully supports the StatsD protocol. All StatsD client libraries can be u The only difference between the two, is the `units` of the charts, as timers report *milliseconds*. [Sampling rate](#sampling-rates) is supported. + [Tags](#tags) are supported for changing chart units and family. - When a counter or meter is not collected, Netdata **defaults** to showing a zero value, until a data collection event changes the value. + When a counter or meter is not collected, StatsD **defaults** to showing a zero value, until a data collection event changes the value. -- **Sets** +- **Sets** The application sends `name:value|s`, where `value` is anything (**number or text**, leading and trailing spaces are removed), StatsD reports the number of unique values sent and the number of times it was updated (events). - Sampling rate is **not** supported for Sets. `value` is always considered text. + Sampling rate is **not** supported for Sets. `value` is always considered text (so `01` and `1` are considered different). - When a counter or meter is not collected, Netdata **defaults** to showing a zero value, until a data collection event changes the value. + [Tags](#tags) are supported for changing chart units and family. + + When a set is not collected, Netdata **defaults** to showing a zero value, until a data collection event changes the value. + +- **Dictionaries** + + The application sends `name:value|d`, where `value` is anything (**number or text**, leading and trailing spaces are removed), StatsD reports the number of events sent for each `value` and the total times `name` was updated (events). + + Sampling rate is **not** supported for Dictionaries. `value` is always considered text (so `01` and `1` are considered different). + + [Tags](#tags) are supported for changing chart units and family. + + When a set is not collected, Netdata **defaults** to showing a zero value, until a data collection event changes the value. #### Sampling Rates The application may append `|@sampling_rate`, where `sampling_rate` is a number from `0.0` to `1.0` in order for StatD to extrapolate the value and predict the total for the entire period. If the application reports to StatsD a value for 1/10th of the time, it can append `|@0.1` to the metrics it sends to statsd. +#### Tags + +The application may append `|#tag1:value1,tag2:value2,tag3:value3` etc, where `tagX` and `valueX` are strings. `:valueX` can be omitted. + +Currently, Netdata uses only 2 tags: + + * `units=string` which sets the units of the chart that is automatically generated + * `family=string` which sets the family of the chart that is automatically generated (the family is the submenu of the dashboard) + * `name=string` which sets the name of the dimension of the chart that is automatically generated (only for counters, meters, gauges) + +Other tags are parsed, but currently are ignored. + +Charts are not updated to change units or dimension names once they are created. So, either send the tags on every event, or use the special `zinit` value to initiaze the charts at the beginning. `zinit` is a special value that can be used on any chart, to have netdata initialize the charts, without actually setting any values to them. So, instead of sending `my.metric:VALUE|c|#units=bytes,name=size` every time, the application can send at the beginning `my.metric:zinit|c|#units=bytes,name=size` and then `my.metric:VALUE|c`. + #### Overlapping metrics -Netdata's StatsD server maintains different indexes for each of the types supported. This means the same metric `name` may exist under different types concurrently. +Netdata's StatsD server maintains different indexes for each of the metric types supported. This means the same metric `name` may exist under different types concurrently. + +#### How to name your metrics + +A good practice is to name your metrics like `application.operation.metric`, where: + +- `application` is the application name - Netdata will automatically create a dashboard section based on the first keyword of the metrics, so you can have all your applications in different sections. +- `operation` is the operation your application is executing, like `dbquery`, `request`, `response`, etc. +- `metric` is anything you want to name your metric as. Netdata will automatically append the metric type (meter, counter, gauge, set, dictionary, timer, histogram) to the generated chart. + +Using [Tags](#tags) you can also change the submenus of the dashboard, the units of the charts and for meters, counters and gauges, the name of dimension. So, you can have a usable default view without using [Synthetic StatsD charts](#synthetic-statsd-charts) #### Multiple metrics per packet -Netdata accepts multiple metrics per packet if each is terminated with `\n`. +Netdata accepts multiple metrics per packet if each is terminated with a newline (`\n`) at the end. #### TCP packets Netdata listens for both TCP and UDP packets. For TCP, is it important to always append `\n` on each metric, as Netdata will use the newline character to detect if a metric is split into multiple TCP packets. -On disconnect, Netdata will process the entire buffer, even if it is not terminated with a `\n`. #### UDP packets -When sending multiple packets over UDP, it is important not to exceed the network MTU, which is usually 1500 bytes. +When sending multiple metrics over a single UDP message, it is important not to exceed the network MTU, which is usually 1500 bytes. Netdata will accept UDP packets up to 9000 bytes, but the underlying network will not exceed MTU. @@ -122,7 +160,7 @@ You can find the configuration at `/etc/netdata/netdata.conf`: # private charts memory mode = save # private charts history = 3996 # histograms and timers percentile (percentThreshold) = 95.00000 - # add dimension for number of events received = yes + # add dimension for number of events received = no # gaps on gauges (deleteGauges) = no # gaps on counters (deleteCounters) = no # gaps on meters (deleteMeters) = no @@ -150,7 +188,7 @@ You can find the configuration at `/etc/netdata/netdata.conf`: - `update every (flushInterval) = 1` seconds, controls the frequency StatsD will push the collected metrics to Netdata charts. -- `decimal detail = 1000` controls the number of fractional digits in gauges and histograms. Netdata collects metrics using signed 64 bit integers and their fractional detail is controlled using multipliers and divisors. This setting is used to multiply all collected values to convert them to integers and is also set as the divisors, so that the final data will be a floating point number with this fractional detail (1000 = X.0 - X.999, 10000 = X.0 - X.9999, etc). +- `decimal detail = 1000` controls the number of fractional digits in gauges and histograms. Netdata collects metrics using signed 64-bit integers and their fractional detail is controlled using multipliers and divisors. This setting is used to multiply all collected values to convert them to integers and is also set as the divisors, so that the final data will be a floating point number with this fractional detail (1000 = X.0 - X.999, 10000 = X.0 - X.9999, etc). The rest of the settings are discussed below. @@ -180,10 +218,9 @@ The default behavior is to use the same settings as the rest of the Netdata Agen ### Optimize private metric charts visualization and storage - If you have thousands of metrics, each with its own private chart, you may notice that your web browser becomes slow when you view the Netdata dashboard (this is a web browser issue we need to address at the Netdata UI). So, Netdata has a protection to stop creating charts when `max private charts allowed = 200` (soft limit) is reached. -The metrics above this soft limit are still processed by Netdata and will be available to be sent to backend time-series databases, up to `max private charts hard limit = 1000`. So, between 200 and 1000 charts, Netdata will still generate charts, but they will automatically be created with `memory mode = none` (Netdata will not maintain a database for them). These metrics will be sent to backend time series databases, if the backend configuration is set to `as collected`. +The metrics above this soft limit are still processed by Netdata, can be used in synthetic charts and will be available to be sent to backend time-series databases, up to `max private charts hard limit = 1000`. So, between 200 and 1000 charts, Netdata will still generate charts, but they will automatically be created with `memory mode = none` (Netdata will not maintain a database for them). These metrics will be sent to backend time series databases, if the backend configuration is set to `as collected`. Metrics above the hard limit are still collected, but they can only be used in synthetic charts (once a metric is added to chart, it will be sent to backend servers too). @@ -240,9 +277,6 @@ This is identical to `counter`. - Format: `name:FLOAT|ms` - StatsD maintains a list of all the values supplied and provides statistics on them. - - -The same chart with the `sum` unselected:  ### Synthetic StatsD charts @@ -369,7 +403,7 @@ Synthetic chart: 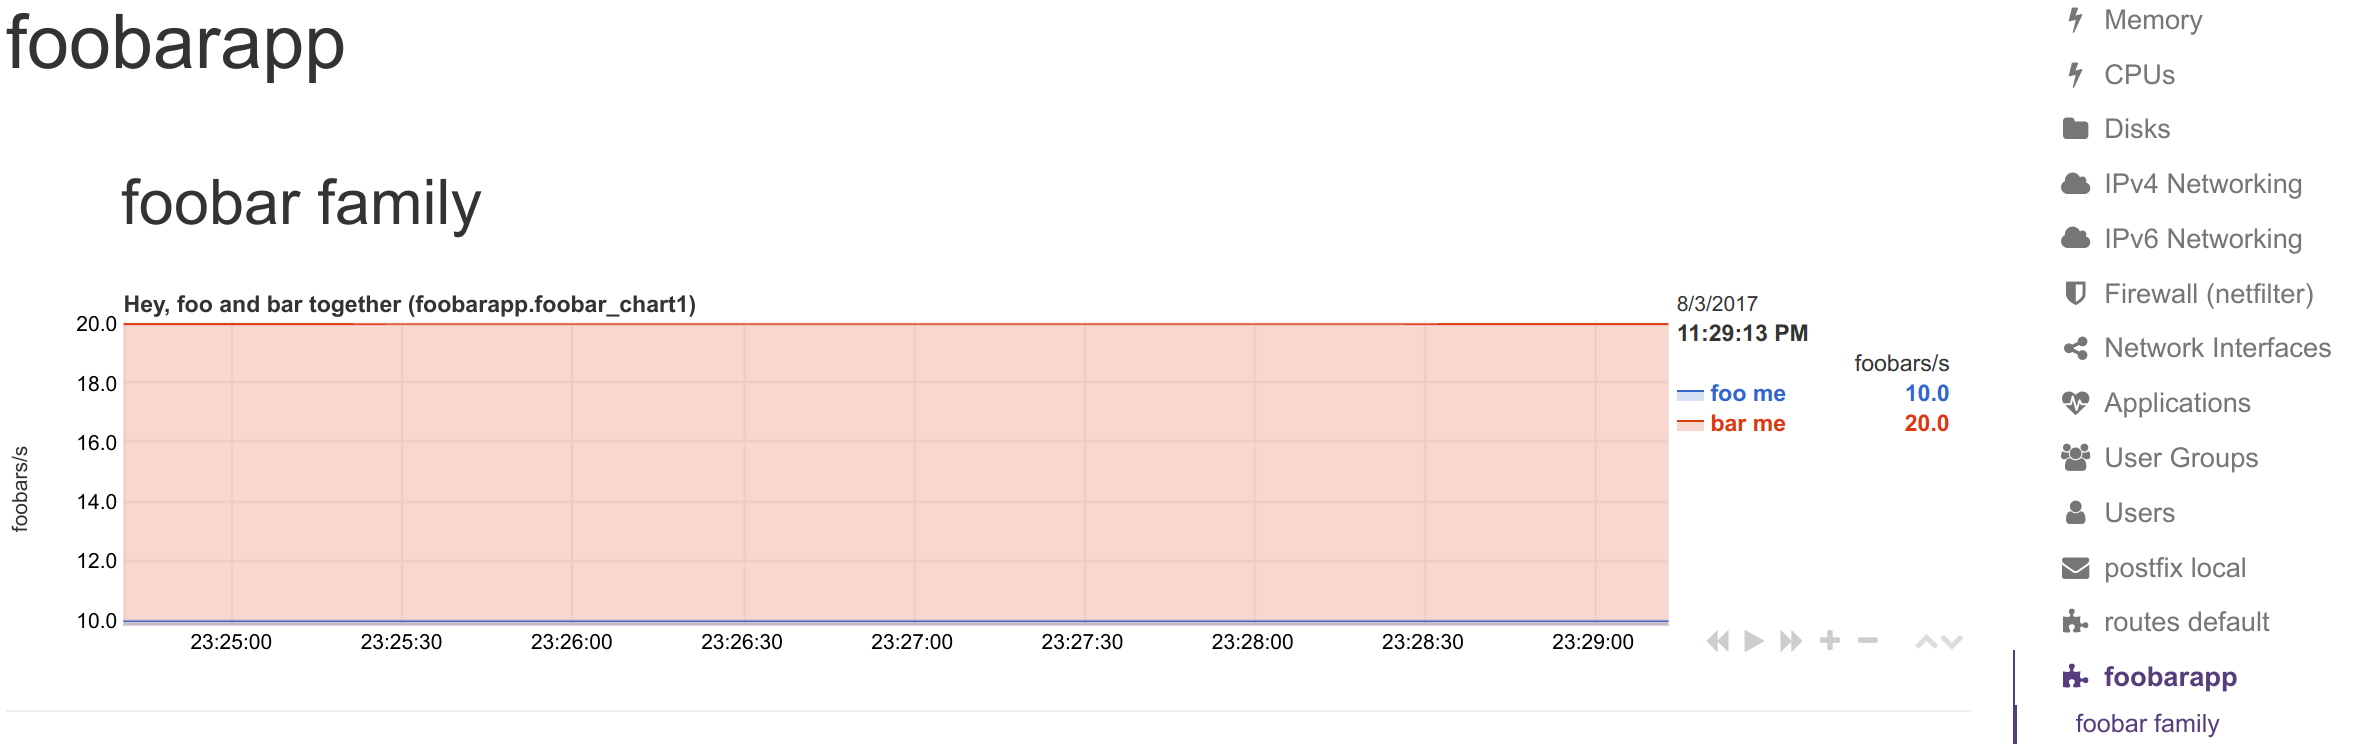 -#### Renaming StatsD metrics +#### Renaming StatsD synthetic charts' metrics You can define a dictionary to rename metrics sent by StatsD clients. This enables you to send response `"200"` and Netdata visualize it as `succesful connection` @@ -438,7 +472,7 @@ You can rename the dimensions with this: Note that we added a `NAME` to the dimension line with `get.`. This is prefixed to the wildcarded part of the metric name, to compose the key for looking up the dictionary. So `500` became `get.500` which was looked up to the dictionary to find value `500 cannot connect to db`. This way we can have different dimension names, for each of the API methods (i.e. `get.500 = 500 cannot connect to db` while `post.500 = 500 cannot write to disk`). -To add all API methods to a chart, you can do this: +To add all 200s across all API methods to a chart, you can do this: ``` [ok_by_method] @@ -539,44 +573,79 @@ You can also use StatsD with: ### Shell -Getting the proper support for a programming language is not always easy, but the Unix shell is available on most Unix systems. You can use shell and `nc` to instrument your systems and send metric data to Netdata's StatsD implementation. Here's how: +Getting the proper support for a programming language is not always easy, but the Unix shell is available on most Unix systems. You can use shell and `nc` to instrument your systems and send metric data to Netdata's StatsD implementation. + +Using the method you can send metrics from any script. You can generate events like: backup.started, backup.ended, backup.time, or even tail logs and convert them to metrics. + +> **IMPORTANT**: +> +> To send StatsD messages you need from the `netcat` package, the `nc` command. +> There are multiple versions of this package. Please try to experiment with the `nc` command you have available on your right system, to find the right parameters. +> +> In the examples below, we assume the `openbsd-netcat` is installed. + +If you plan to send short StatsD events at sporadic occasions, use UDP. The messages should not be too long (remember, most networks support up to 1500 bytes MTU, which is also the limit for StatsD messages over UDP). The good thing is that using UDP will not block your script, even if the StatsD server is not there (UDP messages are "fire-and-forget"). + -The command you need to run is: +For UDP use this: ```sh -echo "NAME:VALUE|TYPE" | nc -u --send-only localhost 8125 +echo "APPLICATION.METRIC:VALUE|TYPE" | nc -u -w 0 localhost 8125 ``` -Where: +`-u` turns on UDP, `-w 0` tells `nc` not to wait for a response from StatsD (idle time to close the connection). -- `NAME` is the metric name -- `VALUE` is the value for that metric (**gauges** `|g`, **timers** `|ms` and **histograms** `|h` accept decimal/fractional numbers, **counters** `|c` and **meters** `|m` accept integers, **sets** `|s` accept anything) -- `TYPE` is one of `g`, `ms`, `h`, `c`, `m`, `s` to select the metric type. +where: -So, to set `metric1` as gauge to value `10`, use: +- `APPLICATION` is any name for your application +- `METRIC` is the name for the specific metric +- `VALUE` is the value for that metric (**meters**, **counters**, **gauges**, **timers** and **histograms** accept integer/decimal/fractional numbers, **sets** and **dictionaries** accept strings) +- `TYPE` is one of `m`, `c`, `g`, `ms`, `h`, `s`, `d` to define the metric type. + +For tailing a log and converting it to metrics, do something like this: ```sh -echo "metric1:10|g" | nc -u --send-only localhost 8125 +tail -f some.log | awk 'awk commands to parse the log and format statsd metrics' | nc -N -w 120 localhost 8125 ``` -To increment `metric2` by `10`, as a counter, use: +`-N` tells `nc` to close the socket once it receives EOF on its input. `-w 120` tells `nc` to stop if the connection is idle for 120 seconds. The timeout is needed to stop the `nc` command if you restart Netdata while `nc` is connected to it. Without it, `nc` will sit idle forever. + +When you embed the above commands to a script, you may notice that all the metrics are sent to StatsD with a delay. They are buffered in the pipes `|`. You can turn them to real-time by prepending each command with `stdbuf -i0 -oL -eL command to be run`, like this: ```sh -echo "metric2:10|c" | nc -u --send-only localhost 8125 +stdbuf -i0 -oL -eL tail -f some.log |\ + stdbuf -i0 -oL -eL awk 'awk commands to parse the log and format statsd metrics' |\ + stdbuf -i0 -oL -eL nc -N -w 120 localhost 8125 +``` + +If you use `mawk` you also need to run awk with `-W interactive`. + +Examples: + +To set `myapp.used_memory` as gauge to value `123456`, use: + +```sh +echo "myapp.used_memory:123456|g|#units:bytes" | nc -u -w 0 localhost 8125 +``` + +To increment `myapp.files_sent` by `10`, as a counter, use: + +```sh +echo "myapp.files_sent:10|c|#units:files" | nc -u -w 0 localhost 8125 ``` You can send multiple metrics like this: ```sh # send multiple metrics via UDP -printf "metric1:10|g\nmetric2:10|c\n" | nc -u --send-only localhost 8125 +printf "myapp.used_memory:123456|g|#units:bytes\nmyapp.files_sent:10|c|#units:files\n" | nc -u -w 0 localhost 8125 ``` Remember, for UDP communication each packet should not exceed the MTU. So, if you plan to push too many metrics at once, prefer TCP communication: ```sh # send multiple metrics via TCP -printf "metric1:10|g\nmetric2:10|c\n" | nc --send-only localhost 8125 +cat /tmp/statsd.metrics.txt | nc -N -w 120 localhost 8125 ``` You can also use this little function to take care of all the details: @@ -584,22 +653,29 @@ You can also use this little function to take care of all the details: ```sh #!/usr/bin/env bash +# we assume nc is from the openbsd-netcat package + STATSD_HOST="localhost" STATSD_PORT="8125" statsd() { - local udp="-u" all="${*}" + local options="-u -w 0" all="${*}" + + # replace all spaces with newlines + all="${all// /\\n}" # if the string length of all parameters given is above 1000, use TCP - [ "${#all}" -gt 1000 ] && udp= + [ "${#all}" -gt 1000 ] && options="-N -w 0" - while [ ! -z "${1}" ] - do - printf "${1}\n" - shift - done | nc ${udp} --send-only ${STATSD_HOST} ${STATSD_PORT} || return 1 + # send the metrics to statsd + printf "${all}\n" | nc ${options} ${STATSD_HOST} ${STATSD_PORT} || return 1 return 0 } + +if [ ! -z "${*}" ] +then + statsd "${@}" +fi ``` You can use it like this: @@ -609,10 +685,15 @@ You can use it like this: source statsd.sh # then, at any point: -StatsD "metric1:10|g" "metric2:10|c" ... +statsd "myapp.used_memory:123456|g|#units:bytes" "myapp.files_sent:10|c|#units:files" ... ``` -The function is smart enough to call `nc` just once and pass all the metrics to it. It will also automatically switch to TCP if the metrics to send are above 1000 bytes. -If you have gotten thus far, make sure to check out our [community forums](https://community.netdata.cloud) to share your experience using Netdata with StatsD. +or even at a terminal prompt, like this: +```sh +./statsd.sh "myapp.used_memory:123456|g|#units:bytes" "myapp.files_sent:10|c|#units:files" ... +``` +The function is smart enough to call `nc` just once and pass all the metrics to it. It will also automatically switch to TCP if the metrics to send are above 1000 bytes. + +If you have gotten thus far, make sure to check out our [community forums](https://community.netdata.cloud) to share your experience using Netdata with StatsD. diff --git a/collectors/statsd.plugin/statsd.c b/collectors/statsd.plugin/statsd.c index a630d00d0..63e3316cb 100644 --- a/collectors/statsd.plugin/statsd.c +++ b/collectors/statsd.plugin/statsd.c @@ -9,31 +9,24 @@ #define STATSD_LISTEN_PORT 8125 #define STATSD_LISTEN_BACKLOG 4096 +#define WORKER_JOB_TYPE_TCP_CONNECTED 0 +#define WORKER_JOB_TYPE_TCP_DISCONNECTED 1 +#define WORKER_JOB_TYPE_RCV_DATA 2 +#define WORKER_JOB_TYPE_SND_DATA 3 + +#if WORKER_UTILIZATION_MAX_JOB_TYPES < 4 +#error Please increase WORKER_UTILIZATION_MAX_JOB_TYPES to at least 4 +#endif + // -------------------------------------------------------------------------------------- // #define STATSD_MULTITHREADED 1 #ifdef STATSD_MULTITHREADED // DO NOT ENABLE MULTITHREADING - IT IS NOT WELL TESTED -#define STATSD_AVL_TREE avl_tree_lock -#define STATSD_AVL_INSERT avl_insert_lock -#define STATSD_AVL_SEARCH avl_search_lock -#define STATSD_AVL_INDEX_INIT { .avl_tree = { NULL, statsd_metric_compare }, .rwlock = AVL_LOCK_INITIALIZER } -#define STATSD_FIRST_PTR_MUTEX netdata_mutex_t first_mutex -#define STATSD_FIRST_PTR_MUTEX_INIT .first_mutex = NETDATA_MUTEX_INITIALIZER -#define STATSD_FIRST_PTR_MUTEX_LOCK(index) netdata_mutex_lock(&((index)->first_mutex)) -#define STATSD_FIRST_PTR_MUTEX_UNLOCK(index) netdata_mutex_unlock(&((index)->first_mutex)) -#define STATSD_DICTIONARY_OPTIONS DICTIONARY_FLAG_DEFAULT +#define STATSD_DICTIONARY_OPTIONS DICTIONARY_FLAG_DONT_OVERWRITE_VALUE|DICTIONARY_FLAG_ADD_IN_FRONT #else -#define STATSD_AVL_TREE avl_tree_type -#define STATSD_AVL_INSERT avl_insert -#define STATSD_AVL_SEARCH avl_search -#define STATSD_AVL_INDEX_INIT { .root = NULL, .compar = statsd_metric_compare } -#define STATSD_FIRST_PTR_MUTEX -#define STATSD_FIRST_PTR_MUTEX_INIT -#define STATSD_FIRST_PTR_MUTEX_LOCK(index) -#define STATSD_FIRST_PTR_MUTEX_UNLOCK(index) -#define STATSD_DICTIONARY_OPTIONS DICTIONARY_FLAG_SINGLE_THREADED +#define STATSD_DICTIONARY_OPTIONS DICTIONARY_FLAG_DONT_OVERWRITE_VALUE|DICTIONARY_FLAG_ADD_IN_FRONT|DICTIONARY_FLAG_SINGLE_THREADED #endif #define STATSD_DECIMAL_DETAIL 1000 // floating point values get multiplied by this, with the same divisor @@ -67,7 +60,7 @@ typedef struct statsd_histogram_extensions { RRDDIM *rd_percentile; RRDDIM *rd_median; RRDDIM *rd_stddev; - RRDDIM *rd_sum; + //RRDDIM *rd_sum; size_t size; size_t used; @@ -83,6 +76,16 @@ typedef struct statsd_metric_set { size_t unique; } STATSD_METRIC_SET; +typedef struct statsd_metric_dictionary_item { + size_t count; + RRDDIM *rd; +} STATSD_METRIC_DICTIONARY_ITEM; + +typedef struct statsd_metric_dictionary { + DICTIONARY *dict; + size_t unique; +} STATSD_METRIC_DICTIONARY; + // -------------------------------------------------------------------------------------------------------------------- // this is a metric - for all types of metrics @@ -97,6 +100,7 @@ typedef enum statsd_metric_options { STATSD_METRIC_OPTION_USED_IN_APPS = 0x00000020, // set when this metric is used in apps STATSD_METRIC_OPTION_CHECKED = 0x00000040, // set when the charting thread checks this metric for use in charts (its usefulness) STATSD_METRIC_OPTION_USEFUL = 0x00000080, // set when the charting thread finds the metric useful (i.e. used in a chart) + STATSD_METRIC_OPTION_COLLECTION_FULL_LOGGED = 0x00000100, // set when the collection is full for this metric } STATS_METRIC_OPTIONS; typedef enum statsd_metric_type { @@ -105,14 +109,13 @@ typedef enum statsd_metric_type { STATSD_METRIC_TYPE_METER, STATSD_METRIC_TYPE_TIMER, STATSD_METRIC_TYPE_HISTOGRAM, - STATSD_METRIC_TYPE_SET + STATSD_METRIC_TYPE_SET, + STATSD_METRIC_TYPE_DICTIONARY } STATSD_METRIC_TYPE; typedef struct statsd_metric { - avl_t avl; // indexing - has to be first - - const char *name; // the name of the metric + const char *name; // the name of the metric - linked to dictionary name uint32_t hash; // hash of the name STATSD_METRIC_TYPE type; @@ -127,8 +130,13 @@ typedef struct statsd_metric { STATSD_METRIC_COUNTER counter; STATSD_METRIC_HISTOGRAM histogram; STATSD_METRIC_SET set; + STATSD_METRIC_DICTIONARY dictionary; }; + char *units; + char *dimname; + char *family; + // chart related members STATS_METRIC_OPTIONS options; // STATSD_METRIC_OPTION_* (bitfield) char reset; // set to 1 by the charting thread to instruct the collector thread(s) to reset this metric @@ -138,7 +146,6 @@ typedef struct statsd_metric { RRDDIM *rd_count; // the dimension for the number of events received // linking, used for walking through all metrics - struct statsd_metric *next; struct statsd_metric *next_useful; } STATSD_METRIC; @@ -152,17 +159,14 @@ typedef struct statsd_index { size_t metrics; // the number of metrics in this index size_t useful; // the number of useful metrics in this index - STATSD_AVL_TREE index; // the AVL tree + STATSD_METRIC_TYPE type; // the type of index + DICTIONARY *dict; - STATSD_METRIC *first; // the linked list of metrics (new metrics are added in front) STATSD_METRIC *first_useful; // the linked list of useful metrics (new metrics are added in front) - STATSD_FIRST_PTR_MUTEX; // when multi-threading is enabled, a lock to protect the linked list STATS_METRIC_OPTIONS default_options; // default options for all metrics in this index } STATSD_INDEX; -static int statsd_metric_compare(void* a, void* b); - // -------------------------------------------------------------------------------------------------------------------- // synthetic charts @@ -237,10 +241,6 @@ struct collection_thread_status { size_t max_sockets; netdata_thread_t thread; - struct rusage rusage; - RRDSET *st_cpu; - RRDDIM *rd_user; - RRDDIM *rd_system; }; static struct statsd { @@ -250,6 +250,8 @@ static struct statsd { STATSD_INDEX histograms; STATSD_INDEX meters; STATSD_INDEX sets; + STATSD_INDEX dictionaries; + size_t unknown_types; size_t socket_errors; size_t tcp_socket_connects; @@ -280,6 +282,7 @@ static struct statsd { size_t histogram_increase_step; double histogram_percentile; char *histogram_percentile_str; + size_t dictionary_max_unique; int threads; struct collection_thread_status *collection_threads_status; @@ -297,55 +300,57 @@ static struct statsd { .name = "gauge", .events = 0, .metrics = 0, - .index = STATSD_AVL_INDEX_INIT, - .default_options = STATSD_METRIC_OPTION_NONE, - .first = NULL, - STATSD_FIRST_PTR_MUTEX_INIT + .dict = NULL, + .type = STATSD_METRIC_TYPE_GAUGE, + .default_options = STATSD_METRIC_OPTION_NONE }, .counters = { .name = "counter", .events = 0, .metrics = 0, - .index = STATSD_AVL_INDEX_INIT, - .default_options = STATSD_METRIC_OPTION_NONE, - .first = NULL, - STATSD_FIRST_PTR_MUTEX_INIT + .dict = NULL, + .type = STATSD_METRIC_TYPE_COUNTER, + .default_options = STATSD_METRIC_OPTION_NONE }, .timers = { .name = "timer", .events = 0, .metrics = 0, - .index = STATSD_AVL_INDEX_INIT, - .default_options = STATSD_METRIC_OPTION_NONE, - .first = NULL, - STATSD_FIRST_PTR_MUTEX_INIT + .dict = NULL, + .type = STATSD_METRIC_TYPE_TIMER, + .default_options = STATSD_METRIC_OPTION_NONE }, .histograms = { .name = "histogram", .events = 0, .metrics = 0, - .index = STATSD_AVL_INDEX_INIT, - .default_options = STATSD_METRIC_OPTION_NONE, - .first = NULL, - STATSD_FIRST_PTR_MUTEX_INIT + .dict = NULL, + .type = STATSD_METRIC_TYPE_HISTOGRAM, + .default_options = STATSD_METRIC_OPTION_NONE }, .meters = { .name = "meter", .events = 0, .metrics = 0, - .index = STATSD_AVL_INDEX_INIT, - .default_options = STATSD_METRIC_OPTION_NONE, - .first = NULL, - STATSD_FIRST_PTR_MUTEX_INIT + .dict = NULL, + .type = STATSD_METRIC_TYPE_METER, + .default_options = STATSD_METRIC_OPTION_NONE }, .sets = { .name = "set", .events = 0, .metrics = 0, - .index = STATSD_AVL_INDEX_INIT, - .default_options = STATSD_METRIC_OPTION_NONE, - .first = NULL, - STATSD_FIRST_PTR_MUTEX_INIT + .dict = NULL, + .type = STATSD_METRIC_TYPE_SET, + .default_options = STATSD_METRIC_OPTION_NONE + }, + .dictionaries = { + .name = "dictionary", + .events = 0, + .metrics = 0, + .dict = NULL, + .type = STATSD_METRIC_TYPE_DICTIONARY, + .default_options = STATSD_METRIC_OPTION_NONE }, .tcp_idle_timeout = 600, @@ -353,6 +358,7 @@ static struct statsd { .apps = NULL, .histogram_percentile = 95.0, .histogram_increase_step = 10, + .dictionary_max_unique = 200, .threads = 0, .collection_threads_status = NULL, .sockets = { @@ -368,54 +374,54 @@ static struct statsd { // -------------------------------------------------------------------------------------------------------------------- // statsd index management - add/find metrics -static int statsd_metric_compare(void* a, void* b) { - if(((STATSD_METRIC *)a)->hash < ((STATSD_METRIC *)b)->hash) return -1; - else if(((STATSD_METRIC *)a)->hash > ((STATSD_METRIC *)b)->hash) return 1; - else return strcmp(((STATSD_METRIC *)a)->name, ((STATSD_METRIC *)b)->name); -} +static void dictionary_metric_insert_callback(const char *name, void *value, void *data) { + STATSD_INDEX *index = (STATSD_INDEX *)data; + STATSD_METRIC *m = (STATSD_METRIC *)value; + + debug(D_STATSD, "Creating new %s metric '%s'", index->name, name); -static inline STATSD_METRIC *statsd_metric_index_find(STATSD_INDEX *index, const char *name, uint32_t hash) { - STATSD_METRIC tmp; - tmp.name = name; - tmp.hash = (hash)?hash:simple_hash(tmp.name); + m->name = name; + m->hash = simple_hash(name); + m->type = index->type; + m->options = index->default_options; + + if (m->type == STATSD_METRIC_TYPE_HISTOGRAM || m->type == STATSD_METRIC_TYPE_TIMER) { + m->histogram.ext = callocz(1,sizeof(STATSD_METRIC_HISTOGRAM_EXTENSIONS)); + netdata_mutex_init(&m->histogram.ext->mutex); + } - return (STATSD_METRIC *)STATSD_AVL_SEARCH(&index->index, (avl_t *)&tmp); + __atomic_fetch_add(&index->metrics, 1, __ATOMIC_SEQ_CST); } -static inline STATSD_METRIC *statsd_find_or_add_metric(STATSD_INDEX *index, const char *name, STATSD_METRIC_TYPE type) { - debug(D_STATSD, "searching for metric '%s' under '%s'", name, index->name); +static void dictionary_metric_delete_callback(const char *name, void *value, void *data) { + (void)data; // STATSD_INDEX *index = (STATSD_INDEX *)data; + (void)name; + STATSD_METRIC *m = (STATSD_METRIC *)value; - uint32_t hash = simple_hash(name); + if(m->type == STATSD_METRIC_TYPE_HISTOGRAM || m->type == STATSD_METRIC_TYPE_TIMER) { + freez(m->histogram.ext); + m->histogram.ext = NULL; + } - STATSD_METRIC *m = statsd_metric_index_find(index, name, hash); - if(unlikely(!m)) { - debug(D_STATSD, "Creating new %s metric '%s'", index->name, name); + freez(m->units); + freez(m->family); + freez(m->dimname); +} - m = (STATSD_METRIC *)callocz(sizeof(STATSD_METRIC), 1); - m->name = strdupz(name); - m->hash = hash; - m->type = type; - m->options = index->default_options; +static inline STATSD_METRIC *statsd_find_or_add_metric(STATSD_INDEX *index, const char *name) { + debug(D_STATSD, "searching for metric '%s' under '%s'", name, index->name); - if(type == STATSD_METRIC_TYPE_HISTOGRAM || type == STATSD_METRIC_TYPE_TIMER) { - m->histogram.ext = callocz(sizeof(STATSD_METRIC_HISTOGRAM_EXTENSIONS), 1); - netdata_mutex_init(&m->histogram.ext->mutex); - } - STATSD_METRIC *n = (STATSD_METRIC *)STATSD_AVL_INSERT(&index->index, (avl_t *)m); - if(unlikely(n != m)) { - freez((void *)m->histogram.ext); - freez((void *)m->name); - freez((void *)m); - m = n; - } - else { - STATSD_FIRST_PTR_MUTEX_LOCK(index); - index->metrics++; - m->next = index->first; - index->first = m; - STATSD_FIRST_PTR_MUTEX_UNLOCK(index); - } - } +#ifdef STATSD_MULTITHREADED + // avoid the write lock of dictionary_set() for existing metrics + STATSD_METRIC *m = dictionary_get(index->dict, name); + if(!m) m = dictionary_set(index->dict, name, NULL, sizeof(STATSD_METRIC)); +#else + // no locks here, go faster + // this will call the dictionary_metric_insert_callback() if an item + // is inserted, otherwise it will return the existing one. + // We used the flag DICTIONARY_FLAG_DONT_OVERWRITE_VALUE to support this. + STATSD_METRIC *m = dictionary_set(index->dict, name, NULL, sizeof(STATSD_METRIC)); +#endif index->events++; return m; @@ -569,6 +575,13 @@ static inline void statsd_process_histogram_or_timer(STATSD_METRIC *m, const cha #define statsd_process_timer(m, value, sampling) statsd_process_histogram_or_timer(m, value, sampling, "timer") #define statsd_process_histogram(m, value, sampling) statsd_process_histogram_or_timer(m, value, sampling, "histogram") +static void dictionary_metric_set_value_insert_callback(const char *name, void *value, void *data) { + (void)name; + (void)value; + STATSD_METRIC *m = (STATSD_METRIC *)data; + m->set.unique++; +} + static inline void statsd_process_set(STATSD_METRIC *m, const char *value) { if(!is_metric_useful_for_collection(m)) return; @@ -580,13 +593,14 @@ static inline void statsd_process_set(STATSD_METRIC *m, const char *value) { if(unlikely(m->reset)) { if(likely(m->set.dict)) { dictionary_destroy(m->set.dict); + dictionary_register_insert_callback(m->set.dict, dictionary_metric_set_value_insert_callback, m); m->set.dict = NULL; } statsd_reset_metric(m); } if (unlikely(!m->set.dict)) { - m->set.dict = dictionary_create(STATSD_DICTIONARY_OPTIONS | DICTIONARY_FLAG_VALUE_LINK_DONT_CLONE); + m->set.dict = dictionary_create(STATSD_DICTIONARY_OPTIONS); m->set.unique = 0; } @@ -594,12 +608,56 @@ static inline void statsd_process_set(STATSD_METRIC *m, const char *value) { // magic loading of metric, without affecting anything } else { - void *t = dictionary_get(m->set.dict, value); +#ifdef STATSD_MULTITHREADED + // avoid the write lock to check if something is already there + if(!dictionary_get(m->set.dict, value)) + dictionary_set(m->set.dict, value, NULL, 0); +#else + dictionary_set(m->set.dict, value, NULL, 0); +#endif + m->events++; + m->count++; + } +} + +static void dictionary_metric_dict_value_insert_callback(const char *name, void *value, void *data) { + (void)name; + (void)value; + STATSD_METRIC *m = (STATSD_METRIC *)data; + m->dictionary.unique++; +} + +static inline void statsd_process_dictionary(STATSD_METRIC *m, const char *value) { + if(!is_metric_useful_for_collection(m)) return; + + if(unlikely(!value || !*value)) { + error("STATSD: metric of type set, with empty value is ignored."); + return; + } + + if(unlikely(m->reset)) + statsd_reset_metric(m); + + if (unlikely(!m->dictionary.dict)) { + m->dictionary.dict = dictionary_create(STATSD_DICTIONARY_OPTIONS); + dictionary_register_insert_callback(m->dictionary.dict, dictionary_metric_dict_value_insert_callback, m); + m->dictionary.unique = 0; + } + + if(unlikely(value_is_zinit(value))) { + // magic loading of metric, without affecting anything + } + else { + STATSD_METRIC_DICTIONARY_ITEM *t = (STATSD_METRIC_DICTIONARY_ITEM *)dictionary_get(m->dictionary.dict, value); + if (unlikely(!t)) { - dictionary_set(m->set.dict, value, NULL, 1); - m->set.unique++; + if(!t && m->dictionary.unique >= statsd.dictionary_max_unique) + value = "other"; + + t = (STATSD_METRIC_DICTIONARY_ITEM *)dictionary_set(m->dictionary.dict, value, NULL, sizeof(STATSD_METRIC_DICTIONARY_ITEM)); } + t->count++; m->events++; m->count++; } @@ -609,85 +667,125 @@ static inline void statsd_process_set(STATSD_METRIC *m, const char *value) { // -------------------------------------------------------------------------------------------------------------------- // statsd parsing -static void statsd_process_metric(const char *name, const char *value, const char *type, const char *sampling, const char *tags) { - (void)tags; +static inline const char *statsd_parse_skip_up_to(const char *s, char d1, char d2, char d3) { + char c; + + for(c = *s; c && c != d1 && c != d2 && c != d3 && c != '\r' && c != '\n'; c = *++s) ; + return s; +} + +const char *statsd_parse_skip_spaces(const char *s) { + char c; + + for(c = *s; c && ( c == ' ' || c == '\t' || c == '\r' || c == '\n' ); c = *++s) ; + + return s; +} + +static inline const char *statsd_parse_field_trim(const char *start, char *end) { + if(unlikely(!start || !*start)) { + start = end; + return start; + } + + while(start <= end && (*start == ' ' || *start == '\t')) + start++; + + *end = '\0'; + end--; + while(end >= start && (*end == ' ' || *end == '\t')) + *end-- = '\0'; + + return start; +} + +static void statsd_process_metric(const char *name, const char *value, const char *type, const char *sampling, const char *tags) { debug(D_STATSD, "STATSD: raw metric '%s', value '%s', type '%s', sampling '%s', tags '%s'", name?name:"(null)", value?value:"(null)", type?type:"(null)", sampling?sampling:"(null)", tags?tags:"(null)"); if(unlikely(!name || !*name)) return; if(unlikely(!type || !*type)) type = "m"; - char t0 = type[0], t1 = type[1]; + STATSD_METRIC *m = NULL; + char t0 = type[0], t1 = type[1]; if(unlikely(t0 == 'g' && t1 == '\0')) { statsd_process_gauge( - statsd_find_or_add_metric(&statsd.gauges, name, STATSD_METRIC_TYPE_GAUGE), - value, sampling); + m = statsd_find_or_add_metric(&statsd.gauges, name), + value, sampling); } else if(unlikely((t0 == 'c' || t0 == 'C') && t1 == '\0')) { // etsy/statsd uses 'c' // brubeck uses 'C' statsd_process_counter( - statsd_find_or_add_metric(&statsd.counters, name, STATSD_METRIC_TYPE_COUNTER), - value, sampling); + m = statsd_find_or_add_metric(&statsd.counters, name), + value, sampling); } else if(unlikely(t0 == 'm' && t1 == '\0')) { statsd_process_meter( - statsd_find_or_add_metric(&statsd.meters, name, STATSD_METRIC_TYPE_METER), - value, sampling); + m = statsd_find_or_add_metric(&statsd.meters, name), + value, sampling); } else if(unlikely(t0 == 'h' && t1 == '\0')) { statsd_process_histogram( - statsd_find_or_add_metric(&statsd.histograms, name, STATSD_METRIC_TYPE_HISTOGRAM), - value, sampling); + m = statsd_find_or_add_metric(&statsd.histograms, name), + value, sampling); } else if(unlikely(t0 == 's' && t1 == '\0')) { statsd_process_set( - statsd_find_or_add_metric(&statsd.sets, name, STATSD_METRIC_TYPE_SET), - value); + m = statsd_find_or_add_metric(&statsd.sets, name), + value); + } + else if(unlikely(t0 == 'd' && t1 == '\0')) { + statsd_process_dictionary( + m = statsd_find_or_add_metric(&statsd.dictionaries, name), + value); } else if(unlikely(t0 == 'm' && t1 == 's' && type[2] == '\0')) { statsd_process_timer( - statsd_find_or_add_metric(&statsd.timers, name, STATSD_METRIC_TYPE_TIMER), - value, sampling); + m = statsd_find_or_add_metric(&statsd.timers, name), + value, sampling); } else { statsd.unknown_types++; error("STATSD: metric '%s' with value '%s' is sent with unknown metric type '%s'", name, value?value:"", type); } -} - -static inline const char *statsd_parse_skip_up_to(const char *s, char d1, char d2) { - char c; - for(c = *s; c && c != d1 && c != d2 && c != '\r' && c != '\n'; c = *++s) ; - - return s; -} + if(m && tags && *tags) { + const char *s = tags; + while(*s) { + const char *tagkey = NULL, *tagvalue = NULL; + char *tagkey_end = NULL, *tagvalue_end = NULL; -const char *statsd_parse_skip_spaces(const char *s) { - char c; + s = tagkey_end = (char *)statsd_parse_skip_up_to(tagkey = s, ':', '=', ','); + if(tagkey == tagkey_end) { + if (*s) { + s++; + s = statsd_parse_skip_spaces(s); + } + continue; + } - for(c = *s; c && ( c == ' ' || c == '\t' || c == '\r' || c == '\n' ); c = *++s) ; + if(likely(*s == ':' || *s == '=')) + s = tagvalue_end = (char *) statsd_parse_skip_up_to(tagvalue = ++s, ',', '\0', '\0'); - return s; -} + if(*s == ',') s++; -static inline const char *statsd_parse_field_trim(const char *start, char *end) { - if(unlikely(!start)) { - start = end; - return start; - } + statsd_parse_field_trim(tagkey, tagkey_end); + statsd_parse_field_trim(tagvalue, tagvalue_end); - while(start <= end && (*start == ' ' || *start == '\t')) - start++; + if(tagkey && *tagkey && tagvalue && *tagvalue) { + if (!m->units && strcmp(tagkey, "units") == 0) + m->units = strdupz(tagvalue); - *end = '\0'; - end--; - while(end >= start && (*end == ' ' || *end == '\t')) - *end-- = '\0'; + if (!m->dimname && strcmp(tagkey, "name") == 0) + m->dimname = strdupz(tagvalue); - return start; + if (!m->family && strcmp(tagkey, "family") == 0) + m->family = strdupz(tagvalue); + } + } + } } static inline size_t statsd_process(char *buffer, size_t size, int require_newlines) { @@ -699,7 +797,7 @@ static inline size_t statsd_process(char *buffer, size_t size, int require_newli const char *name = NULL, *value = NULL, *type = NULL, *sampling = NULL, *tags = NULL; char *name_end = NULL, *value_end = NULL, *type_end = NULL, *sampling_end = NULL, *tags_end = NULL; - s = name_end = (char *)statsd_parse_skip_up_to(name = s, ':', '|'); + s = name_end = (char *)statsd_parse_skip_up_to(name = s, ':', '=', '|'); if(name == name_end) { if (*s) { s++; @@ -708,20 +806,27 @@ static inline size_t statsd_process(char *buffer, size_t size, int require_newli continue; } - if(likely(*s == ':')) - s = value_end = (char *) statsd_parse_skip_up_to(value = ++s, '|', '|'); + if(likely(*s == ':' || *s == '=')) + s = value_end = (char *) statsd_parse_skip_up_to(value = ++s, '|', '@', '#'); if(likely(*s == '|')) - s = type_end = (char *) statsd_parse_skip_up_to(type = ++s, '|', '@'); + s = type_end = (char *) statsd_parse_skip_up_to(type = ++s, '|', '@', '#'); - if(likely(*s == '|' || *s == '@')) { - s = sampling_end = (char *) statsd_parse_skip_up_to(sampling = ++s, '|', '#'); - if(*sampling == '@') sampling++; - } + while(*s == '|' || *s == '@' || *s == '#') { + // parse all the fields that may be appended - if(likely(*s == '|' || *s == '#')) { - s = tags_end = (char *) statsd_parse_skip_up_to(tags = ++s, '|', '|'); - if(*tags == '#') tags++; + if ((*s == '|' && s[1] == '@') || *s == '@') { + s = sampling_end = (char *)statsd_parse_skip_up_to(sampling = ++s, '|', '@', '#'); + if (*sampling == '@') sampling++; + } + else if ((*s == '|' && s[1] == '#') || *s == '#') { + s = tags_end = (char *)statsd_parse_skip_up_to(tags = ++s, '|', '@', '#'); + if (*tags == '#') tags++; + } + else { + // unknown field, skip it + s = (char *)statsd_parse_skip_up_to(++s, '|', '@', '#'); + } } // skip everything until the end of the line @@ -788,6 +893,7 @@ static void *statsd_add_callback(POLLINFO *pi, short int *events, void *data) { (void)pi; (void)data; + worker_is_busy(WORKER_JOB_TYPE_TCP_CONNECTED); *events = POLLIN; struct statsd_tcp *t = (struct statsd_tcp *)callocz(sizeof(struct statsd_tcp) + STATSD_TCP_BUFFER_SIZE, 1); @@ -796,11 +902,14 @@ static void *statsd_add_callback(POLLINFO *pi, short int *events, void *data) { statsd.tcp_socket_connects++; statsd.tcp_socket_connected++; + worker_is_idle(); return t; } // TCP client disconnected static void statsd_del_callback(POLLINFO *pi) { + worker_is_busy(WORKER_JOB_TYPE_TCP_DISCONNECTED); + struct statsd_tcp *t = pi->data; if(likely(t)) { @@ -818,10 +927,15 @@ static void statsd_del_callback(POLLINFO *pi) { freez(t); } + + worker_is_idle(); } // Receive data static int statsd_rcv_callback(POLLINFO *pi, short int *events) { + int retval = -1; + worker_is_busy(WORKER_JOB_TYPE_RCV_DATA); + *events = POLLIN; int fd = pi->fd; @@ -832,14 +946,16 @@ static int statsd_rcv_callback(POLLINFO *pi, short int *events) { if(unlikely(!d)) { error("STATSD: internal error: expected TCP data pointer is NULL"); statsd.socket_errors++; - return -1; + retval = -1; + goto cleanup; } #ifdef NETDATA_INTERNAL_CHECKS if(unlikely(d->type != STATSD_SOCKET_DATA_TYPE_TCP)) { error("STATSD: internal error: socket data type should be %d, but it is %d", (int)STATSD_SOCKET_DATA_TYPE_TCP, (int)d->type); statsd.socket_errors++; - return -1; + retval = -1; + goto cleanup; } #endif @@ -872,8 +988,10 @@ static int statsd_rcv_callback(POLLINFO *pi, short int *events) { d->len = statsd_process(d->buffer, d->len, 1); } - if(unlikely(ret == -1)) - return -1; + if(unlikely(ret == -1)) { + retval = -1; + goto cleanup; + } } while (rc != -1); break; @@ -884,14 +1002,16 @@ static int statsd_rcv_callback(POLLINFO *pi, short int *events) { if(unlikely(!d)) { error("STATSD: internal error: expected UDP data pointer is NULL"); statsd.socket_errors++; - return -1; + retval = -1; + goto cleanup; } #ifdef NETDATA_INTERNAL_CHECKS if(unlikely(d->type != STATSD_SOCKET_DATA_TYPE_UDP)) { error("STATSD: internal error: socket data should be %d, but it is %d", (int)d->type, (int)STATSD_SOCKET_DATA_TYPE_UDP); statsd.socket_errors++; - return -1; + retval = -1; + goto cleanup; } #endif @@ -904,7 +1024,8 @@ static int statsd_rcv_callback(POLLINFO *pi, short int *events) { if (errno != EWOULDBLOCK && errno != EAGAIN && errno != EINTR) { error("STATSD: recvmmsg() on UDP socket %d failed.", fd); statsd.socket_errors++; - return -1; + retval = -1; + goto cleanup; } } else if (rc) { // data received @@ -929,7 +1050,8 @@ static int statsd_rcv_callback(POLLINFO *pi, short int *events) { if (errno != EWOULDBLOCK && errno != EAGAIN && errno != EINTR) { error("STATSD: recv() on UDP socket %d failed.", fd); statsd.socket_errors++; - return -1; + retval = -1; + goto cleanup; } } else if (rc) { // data received @@ -947,24 +1069,26 @@ static int statsd_rcv_callback(POLLINFO *pi, short int *events) { default: { error("STATSD: internal error: unknown socktype %d on socket %d", pi->socktype, fd); statsd.socket_errors++; - return -1; + retval = -1; + goto cleanup; } } - return 0; + retval = 0; +cleanup: + worker_is_idle(); + return retval; } static int statsd_snd_callback(POLLINFO *pi, short int *events) { (void)pi; (void)events; + worker_is_busy(WORKER_JOB_TYPE_SND_DATA); error("STATSD: snd_callback() called, but we never requested to send data to statsd clients."); - return -1; -} + worker_is_idle(); -static void statsd_timer_callback(void *timer_data) { - struct collection_thread_status *status = timer_data; - getrusage(RUSAGE_THREAD, &status->rusage); + return -1; } // -------------------------------------------------------------------------------------------------------------------- @@ -986,12 +1110,19 @@ void statsd_collector_thread_cleanup(void *data) { #endif freez(d); + worker_unregister(); } void *statsd_collector_thread(void *ptr) { struct collection_thread_status *status = ptr; status->status = 1; + worker_register("STATSD"); + worker_register_job_name(WORKER_JOB_TYPE_TCP_CONNECTED, "tcp connect"); + worker_register_job_name(WORKER_JOB_TYPE_TCP_DISCONNECTED, "tcp disconnect"); + worker_register_job_name(WORKER_JOB_TYPE_RCV_DATA, "receive"); + worker_register_job_name(WORKER_JOB_TYPE_SND_DATA, "send"); + info("STATSD collector thread started with taskid %d", gettid()); struct statsd_udp *d = callocz(sizeof(struct statsd_udp), 1); @@ -1019,7 +1150,7 @@ void *statsd_collector_thread(void *ptr) { , statsd_del_callback , statsd_rcv_callback , statsd_snd_callback - , statsd_timer_callback + , NULL , NULL // No access control pattern , 0 // No dns lookups for access control pattern , (void *)d @@ -1413,23 +1544,50 @@ static inline void statsd_readdir(const char *user_path, const char *stock_path, // send metrics to netdata - in private charts - called from the main thread // extract chart type and chart id from metric name -static inline void statsd_get_metric_type_and_id(STATSD_METRIC *m, char *type, char *id, const char *defid, size_t len) { - char *s; +static inline void statsd_get_metric_type_and_id(STATSD_METRIC *m, char *type, char *id, char *context, const char *metrictype, size_t len) { + + // The full chart type.id looks like this: + // ${STATSD_CHART_PREFIX} + "_" + ${METRIC_NAME} + "_" + ${METRIC_TYPE} + // + // where: + // STATSD_CHART_PREFIX = "statsd" as defined above + // METRIC_NAME = whatever the user gave to statsd + // METRIC_TYPE = "gauge", "counter", "meter", "timer", "histogram", "set", "dictionary" + + // for chart type, we want: + // ${STATSD_CHART_PREFIX} + "_" + the first word of ${METRIC_NAME} + + // find the first word of ${METRIC_NAME} + char firstword[len + 1], *s = ""; + strncpyz(firstword, m->name, len); + for (s = firstword; *s ; s++) { + if (unlikely(*s == '.' || *s == '_')) { + *s = '\0'; + s++; + break; + } + } + // firstword has the first word of ${METRIC_NAME} + // s has the remaining, if any - snprintfz(type, len, "%s_%s_%s", STATSD_CHART_PREFIX, defid, m->name); - for(s = type; *s ;s++) - if(unlikely(*s == '.')) break; + // create the chart type: + snprintfz(type, len, STATSD_CHART_PREFIX "_%s", firstword); - if(*s == '.') { - *s++ = '\0'; - strncpyz(id, s, len); - } - else { - strncpyz(id, defid, len); - } + // for chart id, we want: + // the remaining of the words of ${METRIC_NAME} + "_" + ${METRIC_TYPE} + // or the ${METRIC_NAME} has no remaining words, the ${METRIC_TYPE} alone + if(*s) + snprintfz(id, len, "%s_%s", s, metrictype); + else + snprintfz(id, len, "%s", metrictype); + + // for the context, we want the full of both the above, separated with a dot (type.id): + snprintfz(context, RRD_ID_LENGTH_MAX, "%s.%s", type, id); + // make sure they don't have illegal characters netdata_fix_chart_id(type); netdata_fix_chart_id(id); + netdata_fix_chart_id(context); } static inline RRDSET *statsd_private_rrdset_create( @@ -1486,11 +1644,8 @@ static inline void statsd_private_chart_gauge(STATSD_METRIC *m) { debug(D_STATSD, "updating private chart for gauge metric '%s'", m->name); if(unlikely(!m->st)) { - char type[RRD_ID_LENGTH_MAX + 1], id[RRD_ID_LENGTH_MAX + 1]; - statsd_get_metric_type_and_id(m, type, id, "gauge", RRD_ID_LENGTH_MAX); - - char context[RRD_ID_LENGTH_MAX + 1]; - snprintfz(context, RRD_ID_LENGTH_MAX, "statsd_gauge.%s", m->name); + char type[RRD_ID_LENGTH_MAX + 1], id[RRD_ID_LENGTH_MAX + 1], context[RRD_ID_LENGTH_MAX + 1]; + statsd_get_metric_type_and_id(m, type, id, context, "gauge", RRD_ID_LENGTH_MAX); char title[RRD_ID_LENGTH_MAX + 1]; snprintfz(title, RRD_ID_LENGTH_MAX, "statsd private chart for gauge %s", m->name); @@ -1500,16 +1655,16 @@ static inline void statsd_private_chart_gauge(STATSD_METRIC *m) { , type , id , NULL // name - , "gauges" // family (submenu) + , m->family?m->family:"gauges" // family (submenu) , context // context , title // title - , "value" // units + , m->units?m->units:"value" // units , NETDATA_CHART_PRIO_STATSD_PRIVATE , statsd.update_every , RRDSET_TYPE_LINE ); - m->rd_value = rrddim_add(m->st, "gauge", NULL, 1, statsd.decimal_detail, RRD_ALGORITHM_ABSOLUTE); + m->rd_value = rrddim_add(m->st, "gauge", m->dimname?m->dimname:NULL, 1, statsd.decimal_detail, RRD_ALGORITHM_ABSOLUTE); if(m->options & STATSD_METRIC_OPTION_CHART_DIMENSION_COUNT) m->rd_count = rrddim_add(m->st, "events", NULL, 1, 1, RRD_ALGORITHM_INCREMENTAL); @@ -1528,11 +1683,8 @@ static inline void statsd_private_chart_counter_or_meter(STATSD_METRIC *m, const debug(D_STATSD, "updating private chart for %s metric '%s'", dim, m->name); if(unlikely(!m->st)) { - char type[RRD_ID_LENGTH_MAX + 1], id[RRD_ID_LENGTH_MAX + 1]; - statsd_get_metric_type_and_id(m, type, id, dim, RRD_ID_LENGTH_MAX); - - char context[RRD_ID_LENGTH_MAX + 1]; - snprintfz(context, RRD_ID_LENGTH_MAX, "statsd_%s.%s", dim, m->name); + char type[RRD_ID_LENGTH_MAX + 1], id[RRD_ID_LENGTH_MAX + 1], context[RRD_ID_LENGTH_MAX + 1]; + statsd_get_metric_type_and_id(m, type, id, context, dim, RRD_ID_LENGTH_MAX); char title[RRD_ID_LENGTH_MAX + 1]; snprintfz(title, RRD_ID_LENGTH_MAX, "statsd private chart for %s %s", dim, m->name); @@ -1542,16 +1694,16 @@ static inline void statsd_private_chart_counter_or_meter(STATSD_METRIC *m, const , type , id , NULL // name - , family // family (submenu) + , m->family?m->family:family // family (submenu) , context // context , title // title - , "events/s" // units + , m->units?m->units:"events/s" // units , NETDATA_CHART_PRIO_STATSD_PRIVATE , statsd.update_every , RRDSET_TYPE_AREA ); - m->rd_value = rrddim_add(m->st, dim, NULL, 1, 1, RRD_ALGORITHM_INCREMENTAL); + m->rd_value = rrddim_add(m->st, dim, m->dimname?m->dimname:NULL, 1, 1, RRD_ALGORITHM_INCREMENTAL); if(m->options & STATSD_METRIC_OPTION_CHART_DIMENSION_COUNT) m->rd_count = rrddim_add(m->st, "events", NULL, 1, 1, RRD_ALGORITHM_INCREMENTAL); @@ -1570,11 +1722,8 @@ static inline void statsd_private_chart_set(STATSD_METRIC *m) { debug(D_STATSD, "updating private chart for set metric '%s'", m->name); if(unlikely(!m->st)) { - char type[RRD_ID_LENGTH_MAX + 1], id[RRD_ID_LENGTH_MAX + 1]; - statsd_get_metric_type_and_id(m, type, id, "set", RRD_ID_LENGTH_MAX); - - char context[RRD_ID_LENGTH_MAX + 1]; - snprintfz(context, RRD_ID_LENGTH_MAX, "statsd_set.%s", m->name); + char type[RRD_ID_LENGTH_MAX + 1], id[RRD_ID_LENGTH_MAX + 1], context[RRD_ID_LENGTH_MAX + 1]; + statsd_get_metric_type_and_id(m, type, id, context, "set", RRD_ID_LENGTH_MAX); char title[RRD_ID_LENGTH_MAX + 1]; snprintfz(title, RRD_ID_LENGTH_MAX, "statsd private chart for set %s", m->name); @@ -1584,16 +1733,16 @@ static inline void statsd_private_chart_set(STATSD_METRIC *m) { , type , id , NULL // name - , "sets" // family (submenu) + , m->family?m->family:"sets" // family (submenu) , context // context , title // title - , "entries" // units + , m->units?m->units:"entries" // units , NETDATA_CHART_PRIO_STATSD_PRIVATE , statsd.update_every , RRDSET_TYPE_LINE ); - m->rd_value = rrddim_add(m->st, "set", "set size", 1, 1, RRD_ALGORITHM_ABSOLUTE); + m->rd_value = rrddim_add(m->st, "set", m->dimname?m->dimname:"unique", 1, 1, RRD_ALGORITHM_ABSOLUTE); if(m->options & STATSD_METRIC_OPTION_CHART_DIMENSION_COUNT) m->rd_count = rrddim_add(m->st, "events", NULL, 1, 1, RRD_ALGORITHM_INCREMENTAL); @@ -1608,15 +1757,54 @@ static inline void statsd_private_chart_set(STATSD_METRIC *m) { rrdset_done(m->st); } +static inline void statsd_private_chart_dictionary(STATSD_METRIC *m) { + debug(D_STATSD, "updating private chart for dictionary metric '%s'", m->name); + + if(unlikely(!m->st)) { + char type[RRD_ID_LENGTH_MAX + 1], id[RRD_ID_LENGTH_MAX + 1], context[RRD_ID_LENGTH_MAX + 1]; + statsd_get_metric_type_and_id(m, type, id, context, "dictionary", RRD_ID_LENGTH_MAX); + + char title[RRD_ID_LENGTH_MAX + 1]; + snprintfz(title, RRD_ID_LENGTH_MAX, "statsd private chart for dictionary %s", m->name); + + m->st = statsd_private_rrdset_create( + m + , type + , id + , NULL // name + , m->family?m->family:"dictionaries" // family (submenu) + , context // context + , title // title + , m->units?m->units:"events/s" // units + , NETDATA_CHART_PRIO_STATSD_PRIVATE + , statsd.update_every + , RRDSET_TYPE_STACKED + ); + + if(m->options & STATSD_METRIC_OPTION_CHART_DIMENSION_COUNT) + m->rd_count = rrddim_add(m->st, "events", NULL, 1, 1, RRD_ALGORITHM_INCREMENTAL); + } + else rrdset_next(m->st); + + STATSD_METRIC_DICTIONARY_ITEM *t; + dfe_start_read(m->dictionary.dict, t) { + if (!t->rd) t->rd = rrddim_add(m->st, t_name, NULL, 1, 1, RRD_ALGORITHM_INCREMENTAL); + rrddim_set_by_pointer(m->st, t->rd, (collected_number)t->count); + } + dfe_done(t); + + if(m->rd_count) + rrddim_set_by_pointer(m->st, m->rd_count, m->events); + + rrdset_done(m->st); +} + static inline void statsd_private_chart_timer_or_histogram(STATSD_METRIC *m, const char *dim, const char *family, const char *units) { debug(D_STATSD, "updating private chart for %s metric '%s'", dim, m->name); if(unlikely(!m->st)) { - char type[RRD_ID_LENGTH_MAX + 1], id[RRD_ID_LENGTH_MAX + 1]; - statsd_get_metric_type_and_id(m, type, id, dim, RRD_ID_LENGTH_MAX); - - char context[RRD_ID_LENGTH_MAX + 1]; - snprintfz(context, RRD_ID_LENGTH_MAX, "statsd_%s.%s", dim, m->name); + char type[RRD_ID_LENGTH_MAX + 1], id[RRD_ID_LENGTH_MAX + 1], context[RRD_ID_LENGTH_MAX + 1]; + statsd_get_metric_type_and_id(m, type, id, context, dim, RRD_ID_LENGTH_MAX); char title[RRD_ID_LENGTH_MAX + 1]; snprintfz(title, RRD_ID_LENGTH_MAX, "statsd private chart for %s %s", dim, m->name); @@ -1626,10 +1814,10 @@ static inline void statsd_private_chart_timer_or_histogram(STATSD_METRIC *m, con , type , id , NULL // name - , family // family (submenu) + , m->family?m->family:family // family (submenu) , context // context , title // title - , units // units + , m->units?m->units:units // units , NETDATA_CHART_PRIO_STATSD_PRIVATE , statsd.update_every , RRDSET_TYPE_AREA @@ -1641,7 +1829,7 @@ static inline void statsd_private_chart_timer_or_histogram(STATSD_METRIC *m, con m->histogram.ext->rd_percentile = rrddim_add(m->st, statsd.histogram_percentile_str, NULL, 1, statsd.decimal_detail, RRD_ALGORITHM_ABSOLUTE); m->histogram.ext->rd_median = rrddim_add(m->st, "median", NULL, 1, statsd.decimal_detail, RRD_ALGORITHM_ABSOLUTE); m->histogram.ext->rd_stddev = rrddim_add(m->st, "stddev", NULL, 1, statsd.decimal_detail, RRD_ALGORITHM_ABSOLUTE); - m->histogram.ext->rd_sum = rrddim_add(m->st, "sum", NULL, 1, statsd.decimal_detail, RRD_ALGORITHM_ABSOLUTE); + //m->histogram.ext->rd_sum = rrddim_add(m->st, "sum", NULL, 1, statsd.decimal_detail, RRD_ALGORITHM_ABSOLUTE); if(m->options & STATSD_METRIC_OPTION_CHART_DIMENSION_COUNT) m->rd_count = rrddim_add(m->st, "events", NULL, 1, 1, RRD_ALGORITHM_INCREMENTAL); @@ -1653,7 +1841,7 @@ static inline void statsd_private_chart_timer_or_histogram(STATSD_METRIC *m, con rrddim_set_by_pointer(m->st, m->histogram.ext->rd_percentile, m->histogram.ext->last_percentile); rrddim_set_by_pointer(m->st, m->histogram.ext->rd_median, m->histogram.ext->last_median); rrddim_set_by_pointer(m->st, m->histogram.ext->rd_stddev, m->histogram.ext->last_stddev); - rrddim_set_by_pointer(m->st, m->histogram.ext->rd_sum, m->histogram.ext->last_sum); + //rrddim_set_by_pointer(m->st, m->histogram.ext->rd_sum, m->histogram.ext->last_sum); rrddim_set_by_pointer(m->st, m->rd_value, m->last); if(m->rd_count) @@ -1721,6 +1909,34 @@ static inline void statsd_flush_set(STATSD_METRIC *m) { statsd_private_chart_set(m); } +static inline void statsd_flush_dictionary(STATSD_METRIC *m) { + debug(D_STATSD, "flushing dictionary metric '%s'", m->name); + + int updated = 0; + if(unlikely(!m->reset && m->count)) { + m->last = (collected_number)m->dictionary.unique; + + m->reset = 1; + updated = 1; + } + else { + m->last = 0; + } + + if(unlikely(m->options & STATSD_METRIC_OPTION_PRIVATE_CHART_ENABLED && (updated || !(m->options & STATSD_METRIC_OPTION_SHOW_GAPS_WHEN_NOT_COLLECTED)))) + statsd_private_chart_dictionary(m); + + if(m->dictionary.unique >= statsd.dictionary_max_unique) { + if(!(m->options & STATSD_METRIC_OPTION_COLLECTION_FULL_LOGGED)) { + m->options |= STATSD_METRIC_OPTION_COLLECTION_FULL_LOGGED; + info( + "STATSD dictionary '%s' reach max of %zu items - try increasing 'dictionaries max unique dimensions' in netdata.conf", + m->name, + m->dictionary.unique); + } + } +} + static inline void statsd_flush_timer_or_histogram(STATSD_METRIC *m, const char *dim, const char *family, const char *units) { debug(D_STATSD, "flushing %s metric '%s'", dim, m->name); @@ -1793,6 +2009,7 @@ static inline RRD_ALGORITHM statsd_algorithm_for_metric(STATSD_METRIC *m) { case STATSD_METRIC_TYPE_METER: case STATSD_METRIC_TYPE_COUNTER: + case STATSD_METRIC_TYPE_DICTIONARY: return RRD_ALGORITHM_INCREMENTAL; } } @@ -2059,6 +2276,7 @@ const char *statsd_metric_type_string(STATSD_METRIC_TYPE type) { case STATSD_METRIC_TYPE_HISTOGRAM: return "histogram"; case STATSD_METRIC_TYPE_METER: return "meter"; case STATSD_METRIC_TYPE_SET: return "set"; + case STATSD_METRIC_TYPE_DICTIONARY: return "dictionary"; case STATSD_METRIC_TYPE_TIMER: return "timer"; default: return "unknown"; } @@ -2068,7 +2286,7 @@ static inline void statsd_flush_index_metrics(STATSD_INDEX *index, void (*flush_ STATSD_METRIC *m; // find the useful metrics (incremental = each time we are called, we check the new metrics only) - for(m = index->first; m ; m = m->next) { + dfe_start_read(index->dict, m) { // since we add new metrics at the beginning // check for useful charts, until the point we last checked if(unlikely(is_metric_checked(m))) break; @@ -2109,6 +2327,7 @@ static inline void statsd_flush_index_metrics(STATSD_INDEX *index, void (*flush_ index->first_useful = m; } } + dfe_done(m); // flush all the useful metrics for(m = index->first_useful; m ; m = m->next_useful) { @@ -2145,17 +2364,75 @@ static void statsd_main_cleanup(void *data) { info("STATSD: closing sockets..."); listen_sockets_close(&statsd.sockets); + // destroy the dictionaries + dictionary_destroy(statsd.gauges.dict); + dictionary_destroy(statsd.meters.dict); + dictionary_destroy(statsd.counters.dict); + dictionary_destroy(statsd.histograms.dict); + dictionary_destroy(statsd.dictionaries.dict); + dictionary_destroy(statsd.sets.dict); + dictionary_destroy(statsd.timers.dict); + info("STATSD: cleanup completed."); static_thread->enabled = NETDATA_MAIN_THREAD_EXITED; + + worker_unregister(); } +#define WORKER_STATSD_FLUSH_GAUGES 0 +#define WORKER_STATSD_FLUSH_COUNTERS 1 +#define WORKER_STATSD_FLUSH_METERS 2 +#define WORKER_STATSD_FLUSH_TIMERS 3 +#define WORKER_STATSD_FLUSH_HISTOGRAMS 4 +#define WORKER_STATSD_FLUSH_SETS 5 +#define WORKER_STATSD_FLUSH_DICTIONARIES 6 +#define WORKER_STATSD_FLUSH_STATS 7 + +#if WORKER_UTILIZATION_MAX_JOB_TYPES < 8 +#error WORKER_UTILIZATION_MAX_JOB_TYPES has to be at least 8 +#endif + void *statsd_main(void *ptr) { + worker_register("STATSDFLUSH"); + worker_register_job_name(WORKER_STATSD_FLUSH_GAUGES, "gauges"); + worker_register_job_name(WORKER_STATSD_FLUSH_COUNTERS, "counters"); + worker_register_job_name(WORKER_STATSD_FLUSH_METERS, "meters"); + worker_register_job_name(WORKER_STATSD_FLUSH_TIMERS, "timers"); + worker_register_job_name(WORKER_STATSD_FLUSH_HISTOGRAMS, "histograms"); + worker_register_job_name(WORKER_STATSD_FLUSH_SETS, "sets"); + worker_register_job_name(WORKER_STATSD_FLUSH_DICTIONARIES, "dictionaries"); + worker_register_job_name(WORKER_STATSD_FLUSH_STATS, "statistics"); + netdata_thread_cleanup_push(statsd_main_cleanup, ptr); + statsd.gauges.dict = dictionary_create(STATSD_DICTIONARY_OPTIONS); + statsd.meters.dict = dictionary_create(STATSD_DICTIONARY_OPTIONS); + statsd.counters.dict = dictionary_create(STATSD_DICTIONARY_OPTIONS); + statsd.histograms.dict = dictionary_create(STATSD_DICTIONARY_OPTIONS); + statsd.dictionaries.dict = dictionary_create(STATSD_DICTIONARY_OPTIONS); + statsd.sets.dict = dictionary_create(STATSD_DICTIONARY_OPTIONS); + statsd.timers.dict = dictionary_create(STATSD_DICTIONARY_OPTIONS); + + dictionary_register_insert_callback(statsd.gauges.dict, dictionary_metric_insert_callback, &statsd.gauges); + dictionary_register_insert_callback(statsd.meters.dict, dictionary_metric_insert_callback, &statsd.meters); + dictionary_register_insert_callback(statsd.counters.dict, dictionary_metric_insert_callback, &statsd.counters); + dictionary_register_insert_callback(statsd.histograms.dict, dictionary_metric_insert_callback, &statsd.histograms); + dictionary_register_insert_callback(statsd.dictionaries.dict, dictionary_metric_insert_callback, &statsd.dictionaries); + dictionary_register_insert_callback(statsd.sets.dict, dictionary_metric_insert_callback, &statsd.sets); + dictionary_register_insert_callback(statsd.timers.dict, dictionary_metric_insert_callback, &statsd.timers); + + dictionary_register_delete_callback(statsd.gauges.dict, dictionary_metric_delete_callback, &statsd.gauges); + dictionary_register_delete_callback(statsd.meters.dict, dictionary_metric_delete_callback, &statsd.meters); + dictionary_register_delete_callback(statsd.counters.dict, dictionary_metric_delete_callback, &statsd.counters); + dictionary_register_delete_callback(statsd.histograms.dict, dictionary_metric_delete_callback, &statsd.histograms); + dictionary_register_delete_callback(statsd.dictionaries.dict, dictionary_metric_delete_callback, &statsd.dictionaries); + dictionary_register_delete_callback(statsd.sets.dict, dictionary_metric_delete_callback, &statsd.sets); + dictionary_register_delete_callback(statsd.timers.dict, dictionary_metric_delete_callback, &statsd.timers); + // ---------------------------------------------------------------------------------------------------------------- // statsd configuration - statsd.enabled = config_get_boolean(CONFIG_SECTION_STATSD, "enabled", statsd.enabled); + statsd.enabled = config_get_boolean(CONFIG_SECTION_PLUGINS, "statsd", statsd.enabled); statsd.update_every = default_rrd_update_every; statsd.update_every = (int)config_get_number(CONFIG_SECTION_STATSD, "update every (flushInterval)", statsd.update_every); @@ -2188,13 +2465,16 @@ void *statsd_main(void *ptr) { statsd.histogram_percentile_str = strdupz(buffer); } - if(config_get_boolean(CONFIG_SECTION_STATSD, "add dimension for number of events received", 1)) { + statsd.dictionary_max_unique = config_get_number(CONFIG_SECTION_STATSD, "dictionaries max unique dimensions", statsd.dictionary_max_unique); + + if(config_get_boolean(CONFIG_SECTION_STATSD, "add dimension for number of events received", 0)) { statsd.gauges.default_options |= STATSD_METRIC_OPTION_CHART_DIMENSION_COUNT; statsd.counters.default_options |= STATSD_METRIC_OPTION_CHART_DIMENSION_COUNT; statsd.meters.default_options |= STATSD_METRIC_OPTION_CHART_DIMENSION_COUNT; statsd.sets.default_options |= STATSD_METRIC_OPTION_CHART_DIMENSION_COUNT; statsd.histograms.default_options |= STATSD_METRIC_OPTION_CHART_DIMENSION_COUNT; statsd.timers.default_options |= STATSD_METRIC_OPTION_CHART_DIMENSION_COUNT; + statsd.dictionaries.default_options |= STATSD_METRIC_OPTION_CHART_DIMENSION_COUNT; } if(config_get_boolean(CONFIG_SECTION_STATSD, "gaps on gauges (deleteGauges)", 0)) @@ -2215,6 +2495,9 @@ void *statsd_main(void *ptr) { if(config_get_boolean(CONFIG_SECTION_STATSD, "gaps on timers (deleteTimers)", 0)) statsd.timers.default_options |= STATSD_METRIC_OPTION_SHOW_GAPS_WHEN_NOT_COLLECTED; + if(config_get_boolean(CONFIG_SECTION_STATSD, "gaps on dictionaries (deleteDictionaries)", 0)) + statsd.dictionaries.default_options |= STATSD_METRIC_OPTION_SHOW_GAPS_WHEN_NOT_COLLECTED; + size_t max_sockets = (size_t)config_get_number(CONFIG_SECTION_STATSD, "statsd server max TCP sockets", (long long int)(rlimit_nofile.rlim_cur / 4)); #ifdef STATSD_MULTITHREADED @@ -2275,6 +2558,7 @@ void *statsd_main(void *ptr) { RRDDIM *rd_metrics_meter = rrddim_add(st_metrics, "meters", NULL, 1, 1, RRD_ALGORITHM_ABSOLUTE); RRDDIM *rd_metrics_histogram = rrddim_add(st_metrics, "histograms", NULL, 1, 1, RRD_ALGORITHM_ABSOLUTE); RRDDIM *rd_metrics_set = rrddim_add(st_metrics, "sets", NULL, 1, 1, RRD_ALGORITHM_ABSOLUTE); + RRDDIM *rd_metrics_dictionary= rrddim_add(st_metrics, "dictionaries", NULL, 1, 1, RRD_ALGORITHM_ABSOLUTE); RRDSET *st_useful_metrics = rrdset_create_localhost( "netdata" @@ -2296,6 +2580,7 @@ void *statsd_main(void *ptr) { RRDDIM *rd_useful_metrics_meter = rrddim_add(st_useful_metrics, "meters", NULL, 1, 1, RRD_ALGORITHM_ABSOLUTE); RRDDIM *rd_useful_metrics_histogram = rrddim_add(st_useful_metrics, "histograms", NULL, 1, 1, RRD_ALGORITHM_ABSOLUTE); RRDDIM *rd_useful_metrics_set = rrddim_add(st_useful_metrics, "sets", NULL, 1, 1, RRD_ALGORITHM_ABSOLUTE); + RRDDIM *rd_useful_metrics_dictionary= rrddim_add(st_useful_metrics, "dictionaries", NULL, 1, 1, RRD_ALGORITHM_ABSOLUTE); RRDSET *st_events = rrdset_create_localhost( "netdata" @@ -2317,6 +2602,7 @@ void *statsd_main(void *ptr) { RRDDIM *rd_events_meter = rrddim_add(st_events, "meters", NULL, 1, 1, RRD_ALGORITHM_INCREMENTAL); RRDDIM *rd_events_histogram = rrddim_add(st_events, "histograms", NULL, 1, 1, RRD_ALGORITHM_INCREMENTAL); RRDDIM *rd_events_set = rrddim_add(st_events, "sets", NULL, 1, 1, RRD_ALGORITHM_INCREMENTAL); + RRDDIM *rd_events_dictionary= rrddim_add(st_events, "dictionaries", NULL, 1, 1, RRD_ALGORITHM_INCREMENTAL); RRDDIM *rd_events_unknown = rrddim_add(st_events, "unknown", NULL, 1, 1, RRD_ALGORITHM_INCREMENTAL); RRDDIM *rd_events_errors = rrddim_add(st_events, "errors", NULL, 1, 1, RRD_ALGORITHM_INCREMENTAL); @@ -2420,70 +2706,39 @@ void *statsd_main(void *ptr) { ); RRDDIM *rd_pcharts = rrddim_add(st_pcharts, "charts", NULL, 1, 1, RRD_ALGORITHM_ABSOLUTE); - RRDSET *stcpu_thread = rrdset_create_localhost( - "netdata" - , "plugin_statsd_charting_cpu" - , NULL - , "statsd" - , "netdata.statsd_cpu" - , "Netdata statsd charting thread CPU usage" - , "milliseconds/s" - , PLUGIN_STATSD_NAME - , "stats" - , 132001 - , statsd.update_every - , RRDSET_TYPE_STACKED - ); - - RRDDIM *rd_user = rrddim_add(stcpu_thread, "user", NULL, 1, 1000, RRD_ALGORITHM_INCREMENTAL); - RRDDIM *rd_system = rrddim_add(stcpu_thread, "system", NULL, 1, 1000, RRD_ALGORITHM_INCREMENTAL); - struct rusage thread; - - for(i = 0; i < statsd.threads ;i++) { - char id[100 + 1]; - char title[100 + 1]; - - snprintfz(id, 100, "plugin_statsd_collector%d_cpu", i + 1); - snprintfz(title, 100, "Netdata statsd collector thread No %d CPU usage", i + 1); - - statsd.collection_threads_status[i].st_cpu = rrdset_create_localhost( - "netdata" - , id - , NULL - , "statsd" - , "netdata.statsd_cpu" - , title - , "milliseconds/s" - , PLUGIN_STATSD_NAME - , "stats" - , 132002 + i - , statsd.update_every - , RRDSET_TYPE_STACKED - ); - - statsd.collection_threads_status[i].rd_user = rrddim_add(statsd.collection_threads_status[i].st_cpu, "user", NULL, 1, 1000, RRD_ALGORITHM_INCREMENTAL); - statsd.collection_threads_status[i].rd_system = rrddim_add(statsd.collection_threads_status[i].st_cpu, "system", NULL, 1, 1000, RRD_ALGORITHM_INCREMENTAL); - } - - // ---------------------------------------------------------------------------------------------------------------- + // ---------------------------------------------------------------------------------------------------------------- // statsd thread to turn metrics into charts usec_t step = statsd.update_every * USEC_PER_SEC; heartbeat_t hb; heartbeat_init(&hb); while(!netdata_exit) { + worker_is_idle(); usec_t hb_dt = heartbeat_next(&hb, step); + worker_is_busy(WORKER_STATSD_FLUSH_GAUGES); statsd_flush_index_metrics(&statsd.gauges, statsd_flush_gauge); + + worker_is_busy(WORKER_STATSD_FLUSH_COUNTERS); statsd_flush_index_metrics(&statsd.counters, statsd_flush_counter); + + worker_is_busy(WORKER_STATSD_FLUSH_METERS); statsd_flush_index_metrics(&statsd.meters, statsd_flush_meter); + + worker_is_busy(WORKER_STATSD_FLUSH_TIMERS); statsd_flush_index_metrics(&statsd.timers, statsd_flush_timer); + + worker_is_busy(WORKER_STATSD_FLUSH_HISTOGRAMS); statsd_flush_index_metrics(&statsd.histograms, statsd_flush_histogram); + + worker_is_busy(WORKER_STATSD_FLUSH_SETS); statsd_flush_index_metrics(&statsd.sets, statsd_flush_set); - statsd_update_all_app_charts(); + worker_is_busy(WORKER_STATSD_FLUSH_DICTIONARIES); + statsd_flush_index_metrics(&statsd.dictionaries,statsd_flush_dictionary); - getrusage(RUSAGE_THREAD, &thread); + worker_is_busy(WORKER_STATSD_FLUSH_STATS); + statsd_update_all_app_charts(); if(unlikely(netdata_exit)) break; @@ -2498,9 +2753,6 @@ void *statsd_main(void *ptr) { rrdset_next(st_tcp_connects); rrdset_next(st_tcp_connected); rrdset_next(st_pcharts); - rrdset_next(stcpu_thread); - for(i = 0; i < statsd.threads ;i++) - rrdset_next(statsd.collection_threads_status[i].st_cpu); } rrddim_set_by_pointer(st_metrics, rd_metrics_gauge, (collected_number)statsd.gauges.metrics); @@ -2509,6 +2761,7 @@ void *statsd_main(void *ptr) { rrddim_set_by_pointer(st_metrics, rd_metrics_meter, (collected_number)statsd.meters.metrics); rrddim_set_by_pointer(st_metrics, rd_metrics_histogram, (collected_number)statsd.histograms.metrics); rrddim_set_by_pointer(st_metrics, rd_metrics_set, (collected_number)statsd.sets.metrics); + rrddim_set_by_pointer(st_metrics, rd_metrics_dictionary, (collected_number)statsd.dictionaries.metrics); rrdset_done(st_metrics); rrddim_set_by_pointer(st_useful_metrics, rd_useful_metrics_gauge, (collected_number)statsd.gauges.useful); @@ -2517,6 +2770,7 @@ void *statsd_main(void *ptr) { rrddim_set_by_pointer(st_useful_metrics, rd_useful_metrics_meter, (collected_number)statsd.meters.useful); rrddim_set_by_pointer(st_useful_metrics, rd_useful_metrics_histogram, (collected_number)statsd.histograms.useful); rrddim_set_by_pointer(st_useful_metrics, rd_useful_metrics_set, (collected_number)statsd.sets.useful); + rrddim_set_by_pointer(st_useful_metrics, rd_useful_metrics_dictionary, (collected_number)statsd.dictionaries.useful); rrdset_done(st_useful_metrics); rrddim_set_by_pointer(st_events, rd_events_gauge, (collected_number)statsd.gauges.events); @@ -2525,6 +2779,7 @@ void *statsd_main(void *ptr) { rrddim_set_by_pointer(st_events, rd_events_meter, (collected_number)statsd.meters.events); rrddim_set_by_pointer(st_events, rd_events_histogram, (collected_number)statsd.histograms.events); rrddim_set_by_pointer(st_events, rd_events_set, (collected_number)statsd.sets.events); + rrddim_set_by_pointer(st_events, rd_events_dictionary, (collected_number)statsd.dictionaries.events); rrddim_set_by_pointer(st_events, rd_events_unknown, (collected_number)statsd.unknown_types); rrddim_set_by_pointer(st_events, rd_events_errors, (collected_number)statsd.socket_errors); rrdset_done(st_events); @@ -2550,16 +2805,6 @@ void *statsd_main(void *ptr) { rrddim_set_by_pointer(st_pcharts, rd_pcharts, (collected_number)statsd.private_charts); rrdset_done(st_pcharts); - - rrddim_set_by_pointer(stcpu_thread, rd_user, thread.ru_utime.tv_sec * 1000000ULL + thread.ru_utime.tv_usec); - rrddim_set_by_pointer(stcpu_thread, rd_system, thread.ru_stime.tv_sec * 1000000ULL + thread.ru_stime.tv_usec); - rrdset_done(stcpu_thread); - - for(i = 0; i < statsd.threads ;i++) { - rrddim_set_by_pointer(statsd.collection_threads_status[i].st_cpu, statsd.collection_threads_status[i].rd_user, statsd.collection_threads_status[i].rusage.ru_utime.tv_sec * 1000000ULL + statsd.collection_threads_status[i].rusage.ru_utime.tv_usec); - rrddim_set_by_pointer(statsd.collection_threads_status[i].st_cpu, statsd.collection_threads_status[i].rd_system, statsd.collection_threads_status[i].rusage.ru_stime.tv_sec * 1000000ULL + statsd.collection_threads_status[i].rusage.ru_stime.tv_usec); - rrdset_done(statsd.collection_threads_status[i].st_cpu); - } } cleanup: ; // added semi-colon to prevent older gcc error: label at end of compound statement diff --git a/collectors/tc.plugin/plugin_tc.c b/collectors/tc.plugin/plugin_tc.c index ce3fe668b..f012c078d 100644 --- a/collectors/tc.plugin/plugin_tc.c +++ b/collectors/tc.plugin/plugin_tc.c @@ -844,6 +844,8 @@ static inline void tc_split_words(char *str, char **words, int max_words) { static pid_t tc_child_pid = 0; static void tc_main_cleanup(void *ptr) { + worker_unregister(); + struct netdata_static_thread *static_thread = (struct netdata_static_thread *)ptr; static_thread->enabled = NETDATA_MAIN_THREAD_EXITING; @@ -864,10 +866,35 @@ static void tc_main_cleanup(void *ptr) { static_thread->enabled = NETDATA_MAIN_THREAD_EXITED; } +#define WORKER_TC_CLASS 0 +#define WORKER_TC_BEGIN 1 +#define WORKER_TC_END 2 +#define WORKER_TC_SENT 3 +#define WORKER_TC_LENDED 4 +#define WORKER_TC_TOKENS 5 +#define WORKER_TC_SETDEVICENAME 6 +#define WORKER_TC_SETDEVICEGROUP 7 +#define WORKER_TC_SETCLASSNAME 8 +#define WORKER_TC_WORKTIME 9 + +#if WORKER_UTILIZATION_MAX_JOB_TYPES < 10 +#error WORKER_UTILIZATION_MAX_JOB_TYPES has to be at least 10 +#endif + void *tc_main(void *ptr) { - netdata_thread_cleanup_push(tc_main_cleanup, ptr); + worker_register("TC"); + worker_register_job_name(WORKER_TC_CLASS, "class"); + worker_register_job_name(WORKER_TC_BEGIN, "begin"); + worker_register_job_name(WORKER_TC_END, "end"); + worker_register_job_name(WORKER_TC_SENT, "sent"); + worker_register_job_name(WORKER_TC_LENDED, "lended"); + worker_register_job_name(WORKER_TC_TOKENS, "tokens"); + worker_register_job_name(WORKER_TC_SETDEVICENAME, "devicename"); + worker_register_job_name(WORKER_TC_SETDEVICEGROUP, "devicegroup"); + worker_register_job_name(WORKER_TC_SETCLASSNAME, "classname"); + worker_register_job_name(WORKER_TC_WORKTIME, "worktime"); - struct rusage thread; + netdata_thread_cleanup_push(tc_main_cleanup, ptr); char command[FILENAME_MAX + 1]; char *words[PLUGINSD_MAX_WORDS] = { NULL }; @@ -913,6 +940,7 @@ void *tc_main(void *ptr) { if(unlikely(!words[0] || !*words[0])) { // debug(D_TC_LOOP, "empty line"); + worker_is_idle(); continue; } // else debug(D_TC_LOOP, "First word is '%s'", words[0]); @@ -920,6 +948,8 @@ void *tc_main(void *ptr) { first_hash = simple_hash(words[0]); if(unlikely(device && ((first_hash == CLASS_HASH && strcmp(words[0], "class") == 0) || (first_hash == QDISC_HASH && strcmp(words[0], "qdisc") == 0)))) { + worker_is_busy(WORKER_TC_CLASS); + // debug(D_TC_LOOP, "CLASS line on class id='%s', parent='%s', parentid='%s', leaf='%s', leafid='%s'", words[2], words[3], words[4], words[5], words[6]); char *type = words[1]; // the class/qdisc type: htb, fq_codel, etc @@ -949,6 +979,7 @@ void *tc_main(void *ptr) { // there should be an IFB interface for this class = NULL; + worker_is_idle(); continue; } @@ -985,6 +1016,8 @@ void *tc_main(void *ptr) { } } else if(unlikely(first_hash == END_HASH && strcmp(words[0], "END") == 0)) { + worker_is_busy(WORKER_TC_END); + // debug(D_TC_LOOP, "END line"); if(likely(device)) { @@ -998,6 +1031,8 @@ void *tc_main(void *ptr) { class = NULL; } else if(unlikely(first_hash == BEGIN_HASH && strcmp(words[0], "BEGIN") == 0)) { + worker_is_busy(WORKER_TC_BEGIN); + // debug(D_TC_LOOP, "BEGIN line on device '%s'", words[1]); if(likely(words[1] && *words[1])) { @@ -1011,6 +1046,8 @@ void *tc_main(void *ptr) { class = NULL; } else if(unlikely(device && class && first_hash == SENT_HASH && strcmp(words[0], "Sent") == 0)) { + worker_is_busy(WORKER_TC_SENT); + // debug(D_TC_LOOP, "SENT line '%s'", words[1]); if(likely(words[1] && *words[1])) { class->bytes = str2ull(words[1]); @@ -1033,6 +1070,8 @@ void *tc_main(void *ptr) { class->requeues = str2ull(words[8]); } else if(unlikely(device && class && class->updated && first_hash == LENDED_HASH && strcmp(words[0], "lended:") == 0)) { + worker_is_busy(WORKER_TC_LENDED); + // debug(D_TC_LOOP, "LENDED line '%s'", words[1]); if(likely(words[1] && *words[1])) class->lended = str2ull(words[1]); @@ -1044,6 +1083,8 @@ void *tc_main(void *ptr) { class->giants = str2ull(words[5]); } else if(unlikely(device && class && class->updated && first_hash == TOKENS_HASH && strcmp(words[0], "tokens:") == 0)) { + worker_is_busy(WORKER_TC_TOKENS); + // debug(D_TC_LOOP, "TOKENS line '%s'", words[1]); if(likely(words[1] && *words[1])) class->tokens = str2ull(words[1]); @@ -1052,16 +1093,22 @@ void *tc_main(void *ptr) { class->ctokens = str2ull(words[3]); } else if(unlikely(device && first_hash == SETDEVICENAME_HASH && strcmp(words[0], "SETDEVICENAME") == 0)) { + worker_is_busy(WORKER_TC_SETDEVICENAME); + // debug(D_TC_LOOP, "SETDEVICENAME line '%s'", words[1]); if(likely(words[1] && *words[1])) tc_device_set_device_name(device, words[1]); } else if(unlikely(device && first_hash == SETDEVICEGROUP_HASH && strcmp(words[0], "SETDEVICEGROUP") == 0)) { + worker_is_busy(WORKER_TC_SETDEVICEGROUP); + // debug(D_TC_LOOP, "SETDEVICEGROUP line '%s'", words[1]); if(likely(words[1] && *words[1])) tc_device_set_device_family(device, words[1]); } else if(unlikely(device && first_hash == SETCLASSNAME_HASH && strcmp(words[0], "SETCLASSNAME") == 0)) { + worker_is_busy(WORKER_TC_SETCLASSNAME); + // debug(D_TC_LOOP, "SETCLASSNAME line '%s' '%s'", words[1], words[2]); char *id = words[1]; char *path = words[2]; @@ -1069,36 +1116,9 @@ void *tc_main(void *ptr) { tc_device_set_class_name(device, id, path); } else if(unlikely(first_hash == WORKTIME_HASH && strcmp(words[0], "WORKTIME") == 0)) { - // debug(D_TC_LOOP, "WORKTIME line '%s' '%s'", words[1], words[2]); - getrusage(RUSAGE_THREAD, &thread); - - static RRDSET *stcpu = NULL; - static RRDDIM *rd_user = NULL, *rd_system = NULL; - - if(unlikely(!stcpu)) { - stcpu = rrdset_create_localhost( - "netdata" - , "plugin_tc_cpu" - , NULL - , "tc.helper" - , NULL - , "Netdata TC CPU usage" - , "milliseconds/s" - , PLUGIN_TC_NAME - , NULL - , NETDATA_CHART_PRIO_NETDATA_TC_CPU - , localhost->rrd_update_every - , RRDSET_TYPE_STACKED - ); - rd_user = rrddim_add(stcpu, "user", NULL, 1, 1000, RRD_ALGORITHM_INCREMENTAL); - rd_system = rrddim_add(stcpu, "system", NULL, 1, 1000, RRD_ALGORITHM_INCREMENTAL); - } - else rrdset_next(stcpu); - - rrddim_set_by_pointer(stcpu, rd_user , thread.ru_utime.tv_sec * 1000000ULL + thread.ru_utime.tv_usec); - rrddim_set_by_pointer(stcpu, rd_system, thread.ru_stime.tv_sec * 1000000ULL + thread.ru_stime.tv_usec); - rrdset_done(stcpu); + worker_is_busy(WORKER_TC_WORKTIME); + // debug(D_TC_LOOP, "WORKTIME line '%s' '%s'", words[1], words[2]); static RRDSET *sttime = NULL; static RRDDIM *rd_run_time = NULL; @@ -1107,8 +1127,8 @@ void *tc_main(void *ptr) { "netdata" , "plugin_tc_time" , NULL - , "tc.helper" - , NULL + , "workers plugin tc" + , "netdata.workers.tc.script_time" , "Netdata TC script execution" , "milliseconds/run" , PLUGIN_TC_NAME @@ -1128,6 +1148,8 @@ void *tc_main(void *ptr) { //else { // debug(D_TC_LOOP, "IGNORED line"); //} + + worker_is_idle(); } // fgets() failed or loop broke @@ -1158,6 +1180,7 @@ void *tc_main(void *ptr) { } cleanup: ; // added semi-colon to prevent older gcc error: label at end of compound statement + worker_unregister(); netdata_thread_cleanup_pop(1); return NULL; } diff --git a/collectors/timex.plugin/plugin_timex.c b/collectors/timex.plugin/plugin_timex.c index 34a3415a0..0390b9920 100644 --- a/collectors/timex.plugin/plugin_timex.c +++ b/collectors/timex.plugin/plugin_timex.c @@ -32,6 +32,8 @@ struct status_codes { static void timex_main_cleanup(void *ptr) { + worker_unregister(); + struct netdata_static_thread *static_thread = (struct netdata_static_thread *)ptr; static_thread->enabled = NETDATA_MAIN_THREAD_EXITING; @@ -42,9 +44,10 @@ static void timex_main_cleanup(void *ptr) void *timex_main(void *ptr) { - netdata_thread_cleanup_push(timex_main_cleanup, ptr); + worker_register("TIMEX"); + worker_register_job_name(0, "clock check"); - int vdo_cpu_netdata = config_get_boolean(CONFIG_SECTION_TIMEX, "timex plugin resource charts", CONFIG_BOOLEAN_YES); + netdata_thread_cleanup_push(timex_main_cleanup, ptr); int update_every = (int)config_get_number(CONFIG_SECTION_TIMEX, "update every", 10); if (update_every < localhost->rrd_update_every) @@ -62,8 +65,9 @@ void *timex_main(void *ptr) heartbeat_t hb; heartbeat_init(&hb); while (!netdata_exit) { - usec_t duration = heartbeat_monotonic_dt_to_now_usec(&hb); + worker_is_idle(); heartbeat_next(&hb, step); + worker_is_busy(0); struct timex timex_buf = {}; int sync_state = 0; @@ -170,68 +174,6 @@ void *timex_main(void *ptr) rrddim_set_by_pointer(st_offset, rd_offset, timex_buf.offset); rrdset_done(st_offset); } - - if (vdo_cpu_netdata) { - static RRDSET *stcpu_thread = NULL, *st_duration = NULL; - static RRDDIM *rd_user = NULL, *rd_system = NULL, *rd_duration = NULL; - - // ---------------------------------------------------------------- - - struct rusage thread; - getrusage(RUSAGE_THREAD, &thread); - - if (unlikely(!stcpu_thread)) { - stcpu_thread = rrdset_create_localhost( - "netdata", - "plugin_timex", - NULL, - "timex", - NULL, - "Netdata Timex Plugin CPU usage", - "milliseconds/s", - PLUGIN_TIMEX_NAME, - NULL, - NETDATA_CHART_PRIO_NETDATA_TIMEX, - update_every, - RRDSET_TYPE_STACKED); - - rd_user = rrddim_add(stcpu_thread, "user", NULL, 1, USEC_PER_MS, RRD_ALGORITHM_INCREMENTAL); - rd_system = rrddim_add(stcpu_thread, "system", NULL, 1, USEC_PER_MS, RRD_ALGORITHM_INCREMENTAL); - } else { - rrdset_next(stcpu_thread); - } - - rrddim_set_by_pointer( - stcpu_thread, rd_user, thread.ru_utime.tv_sec * USEC_PER_SEC + thread.ru_utime.tv_usec); - rrddim_set_by_pointer( - stcpu_thread, rd_system, thread.ru_stime.tv_sec * USEC_PER_SEC + thread.ru_stime.tv_usec); - rrdset_done(stcpu_thread); - - // ---------------------------------------------------------------- - - if (unlikely(!st_duration)) { - st_duration = rrdset_create_localhost( - "netdata", - "plugin_timex_dt", - NULL, - "timex", - NULL, - "Netdata Timex Plugin Duration", - "milliseconds/run", - PLUGIN_TIMEX_NAME, - NULL, - NETDATA_CHART_PRIO_NETDATA_TIMEX + 1, - update_every, - RRDSET_TYPE_AREA); - - rd_duration = rrddim_add(st_duration, "duration", NULL, 1, USEC_PER_MS, RRD_ALGORITHM_ABSOLUTE); - } else { - rrdset_next(st_duration); - } - - rrddim_set_by_pointer(st_duration, rd_duration, duration); - rrdset_done(st_duration); - } } exit: diff --git a/collectors/xenstat.plugin/xenstat_plugin.c b/collectors/xenstat.plugin/xenstat_plugin.c index 781b22afe..882f72ce9 100644 --- a/collectors/xenstat.plugin/xenstat_plugin.c +++ b/collectors/xenstat.plugin/xenstat_plugin.c @@ -920,6 +920,7 @@ static void xenstat_send_domain_metrics() { } int main(int argc, char **argv) { + clocks_init(); // ------------------------------------------------------------------------ // initialization of netdata plugin |