
diff options
| author | Daniel Baumann <daniel.baumann@progress-linux.org> | 2021-05-19 12:33:38 +0000 |
|---|---|---|
| committer | Daniel Baumann <daniel.baumann@progress-linux.org> | 2021-05-19 12:33:59 +0000 |
| commit | 1ee0c09c5742557e037df5421ca62abddb90ae22 (patch) | |
| tree | 71c0fa48bb6d31d036c9badd7e038527f90d1a73 /collectors | |
| parent | Releasing debian version 1.30.1-1. (diff) | |
| download | netdata-1ee0c09c5742557e037df5421ca62abddb90ae22.tar.xz netdata-1ee0c09c5742557e037df5421ca62abddb90ae22.zip | |
Merging upstream version 1.31.0.
Signed-off-by: Daniel Baumann <daniel.baumann@progress-linux.org>
Diffstat (limited to 'collectors')
87 files changed, 3558 insertions, 518 deletions
diff --git a/collectors/COLLECTORS.md b/collectors/COLLECTORS.md index a795de100..3325049e7 100644 --- a/collectors/COLLECTORS.md +++ b/collectors/COLLECTORS.md @@ -26,35 +26,38 @@ issues](https://github.com/netdata/netdata/issues). Use the search bar to look f collector—we may be looking for contributions from users such as yourself! If you don't see the collector there, make a [feature request](https://community.netdata.cloud/c/feature-requests/7/none) on our community forums. -- [Service and application collectors](#service-and-application-collectors) - - [APM (application performance monitoring)](#apm-application-performance-monitoring) - - [Containers and VMs](#containers-and-vms) - - [Data stores](#data-stores) - - [Distributed computing](#distributed-computing) - - [Email](#email) - - [Kubernetes](#kubernetes) - - [Logs](#logs) - - [Messaging](#messaging) - - [Network](#network) - - [Provisioning](#provisioning) - - [Remote devices](#remote-devices) - - [Search](#search) - - [Storage](#storage) - - [Web](#web) -- [System collectors](#system-collectors) - - [Applications](#applications) - - [Disks and filesystems](#disks-and-filesystems) - - [eBPF (extended Berkeley Packet Filter)](#ebpf) - - [Hardware](#hardware) - - [Memory](#memory) - - [Networks](#networks) - - [Processes](#processes) - - [Resources](#resources) - - [Users](#users) -- [Netdata collectors](#netdata-collectors) -- [Orchestrators](#orchestrators) -- [Third-party collectors](#third-party-collectors) -- [Etc](#etc) +- [Supported collectors list](#supported-collectors-list) + - [Service and application collectors](#service-and-application-collectors) + - [Generic](#generic) + - [APM (application performance monitoring)](#apm-application-performance-monitoring) + - [Containers and VMs](#containers-and-vms) + - [Data stores](#data-stores) + - [Distributed computing](#distributed-computing) + - [Email](#email) + - [Kubernetes](#kubernetes) + - [Logs](#logs) + - [Messaging](#messaging) + - [Network](#network) + - [Provisioning](#provisioning) + - [Remote devices](#remote-devices) + - [Search](#search) + - [Storage](#storage) + - [Web](#web) + - [System collectors](#system-collectors) + - [Applications](#applications) + - [Disks and filesystems](#disks-and-filesystems) + - [eBPF](#ebpf) + - [Hardware](#hardware) + - [Memory](#memory) + - [Networks](#networks) + - [Operating systems](#operating-systems) + - [Processes](#processes) + - [Resources](#resources) + - [Users](#users) + - [Netdata collectors](#netdata-collectors) + - [Orchestrators](#orchestrators) + - [Third-party collectors](#third-party-collectors) + - [Etc](#etc) ## Service and application collectors @@ -366,6 +369,7 @@ The Netdata Agent can collect these system- and hardware-level metrics using a v - [Device mapper](/collectors/proc.plugin/README.md): Gather metrics about the Linux device mapper with the proc collector. - [Disk space](/collectors/diskspace.plugin/README.md): Collect disk space usage metrics on Linux mount points. +- [Clock synchronization](/collectors/timex.plugin/README.md): Collect the system clock synchronization status on Linux. - [Files and directories](https://learn.netdata.cloud/docs/agent/collectors/go.d.plugin/modules/filecheck): Gather metrics about the existence, modification time, and size of files or directories. - [ioping.plugin](/collectors/ioping.plugin/README.md): Measure disk read/write latency. @@ -522,10 +526,11 @@ default. To use a third-party collector, visit their GitHub/documentation page a - [CyberPower UPS](https://github.com/HawtDogFlvrWtr/netdata_cyberpwrups_plugin): Polls CyberPower UPS data using PowerPanel® Personal Linux. - [Logged-in users](https://github.com/veksh/netdata-numsessions): Collect the number of currently logged-on users. +- [nextcloud](https://github.com/arnowelzel/netdata-nextcloud): Monitor Nextcloud servers. - [nim-netdata-plugin](https://github.com/FedericoCeratto/nim-netdata-plugin): A helper to create native Netdata plugins using Nim. - [Nvidia GPUs](https://github.com/coraxx/netdata_nv_plugin): Monitor Nvidia GPUs. -- [Teamspeak 3](https://github.com/coraxx/netdata_ts3_plugin): Plls active users and bandwidth from TeamSpeak 3 +- [Teamspeak 3](https://github.com/coraxx/netdata_ts3_plugin): Pulls active users and bandwidth from TeamSpeak 3 servers. - [SSH](https://github.com/Yaser-Amiri/netdata-ssh-module): Monitor failed authentication requests of an SSH server. diff --git a/collectors/Makefile.am b/collectors/Makefile.am index 460612c68..021e2ff23 100644 --- a/collectors/Makefile.am +++ b/collectors/Makefile.am @@ -10,6 +10,7 @@ SUBDIRS = \ checks.plugin \ cups.plugin \ diskspace.plugin \ + timex.plugin \ fping.plugin \ ioping.plugin \ freebsd.plugin \ diff --git a/collectors/REFERENCE.md b/collectors/REFERENCE.md index 9c6f0a61e..4922ff9a9 100644 --- a/collectors/REFERENCE.md +++ b/collectors/REFERENCE.md @@ -96,6 +96,7 @@ This section features a list of Netdata's plugins, with a boolean setting to ena # PYTHONPATH environment variable = # proc = yes # diskspace = yes + # timex = yes # cgroups = yes # tc = yes # idlejitter = yes diff --git a/collectors/all.h b/collectors/all.h index 295261b56..bbb395691 100644 --- a/collectors/all.h +++ b/collectors/all.h @@ -12,6 +12,7 @@ #include "idlejitter.plugin/plugin_idlejitter.h" #include "cgroups.plugin/sys_fs_cgroup.h" #include "diskspace.plugin/plugin_diskspace.h" +#include "timex.plugin/plugin_timex.h" #include "proc.plugin/plugin_proc.h" #include "tc.plugin/plugin_tc.h" #include "macos.plugin/plugin_macos.h" @@ -53,6 +54,8 @@ #define NETDATA_CHART_PRIO_SYSTEM_SOFT_INTR 1100 // freebsd only #define NETDATA_CHART_PRIO_SYSTEM_ENTROPY 1000 #define NETDATA_CHART_PRIO_SYSTEM_UPTIME 1000 +#define NETDATA_CHART_PRIO_CLOCK_SYNC_STATE 1100 +#define NETDATA_CHART_PRIO_CLOCK_SYNC_OFFSET 1110 #define NETDATA_CHART_PRIO_SYSTEM_IPC_MSQ_QUEUES 1200 // freebsd only #define NETDATA_CHART_PRIO_SYSTEM_IPC_MSQ_MESSAGES 1201 #define NETDATA_CHART_PRIO_SYSTEM_IPC_MSQ_SIZE 1202 @@ -80,8 +83,9 @@ // Memory Section - 1xxx #define NETDATA_CHART_PRIO_MEM_SYSTEM_AVAILABLE 1010 -#define NETDATA_CHART_PRIO_MEM_SYSTEM_COMMITTED 1020 -#define NETDATA_CHART_PRIO_MEM_SYSTEM_PGFAULTS 1030 +#define NETDATA_CHART_PRIO_MEM_SYSTEM_OOM_KILL 1020 +#define NETDATA_CHART_PRIO_MEM_SYSTEM_COMMITTED 1030 +#define NETDATA_CHART_PRIO_MEM_SYSTEM_PGFAULTS 1040 #define NETDATA_CHART_PRIO_MEM_KERNEL 1100 #define NETDATA_CHART_PRIO_MEM_SLAB 1200 #define NETDATA_CHART_PRIO_MEM_HUGEPAGES 1250 @@ -102,16 +106,16 @@ // Disks #define NETDATA_CHART_PRIO_DISK_IO 2000 -#define NETDATA_CHART_PRIO_DISK_OPS 2001 -#define NETDATA_CHART_PRIO_DISK_QOPS 2002 -#define NETDATA_CHART_PRIO_DISK_BACKLOG 2003 -#define NETDATA_CHART_PRIO_DISK_BUSY 2004 -#define NETDATA_CHART_PRIO_DISK_UTIL 2005 -#define NETDATA_CHART_PRIO_DISK_AWAIT 2006 -#define NETDATA_CHART_PRIO_DISK_AVGSZ 2007 -#define NETDATA_CHART_PRIO_DISK_SVCTM 2008 -#define NETDATA_CHART_PRIO_DISK_MOPS 2021 -#define NETDATA_CHART_PRIO_DISK_IOTIME 2022 +#define NETDATA_CHART_PRIO_DISK_OPS 2010 +#define NETDATA_CHART_PRIO_DISK_QOPS 2015 +#define NETDATA_CHART_PRIO_DISK_BACKLOG 2020 +#define NETDATA_CHART_PRIO_DISK_BUSY 2030 +#define NETDATA_CHART_PRIO_DISK_UTIL 2040 +#define NETDATA_CHART_PRIO_DISK_AWAIT 2050 +#define NETDATA_CHART_PRIO_DISK_AVGSZ 2060 +#define NETDATA_CHART_PRIO_DISK_SVCTM 2070 +#define NETDATA_CHART_PRIO_DISK_MOPS 2080 +#define NETDATA_CHART_PRIO_DISK_IOTIME 2090 #define NETDATA_CHART_PRIO_BCACHE_CACHE_ALLOC 2120 #define NETDATA_CHART_PRIO_BCACHE_HIT_RATIO 2120 #define NETDATA_CHART_PRIO_BCACHE_RATES 2121 @@ -176,6 +180,8 @@ #define NETDATA_CHART_PRIO_ZFS_HASH_ELEMENTS 2800 #define NETDATA_CHART_PRIO_ZFS_HASH_CHAINS 2810 +#define NETDATA_CHART_PRIO_ZFS_POOL_STATE 2820 + // SOFTIRQs @@ -280,8 +286,8 @@ #define NETDATA_CHART_PRIO_TC_QOS 7000 #define NETDATA_CHART_PRIO_TC_QOS_PACKETS 7010 #define NETDATA_CHART_PRIO_TC_QOS_DROPPED 7020 -#define NETDATA_CHART_PRIO_TC_QOS_TOCKENS 7030 -#define NETDATA_CHART_PRIO_TC_QOS_CTOCKENS 7040 +#define NETDATA_CHART_PRIO_TC_QOS_TOKENS 7030 +#define NETDATA_CHART_PRIO_TC_QOS_CTOKENS 7040 // Infiniband #define NETDATA_CHART_PRIO_INFINIBAND 7100 @@ -338,6 +344,7 @@ #define NETDATA_CHART_PRIO_CHECKS 99999 #define NETDATA_CHART_PRIO_NETDATA_DISKSPACE 132020 +#define NETDATA_CHART_PRIO_NETDATA_TIMEX 132030 #define NETDATA_CHART_PRIO_NETDATA_TC_CPU 135000 #define NETDATA_CHART_PRIO_NETDATA_TC_TIME 135001 diff --git a/collectors/apps.plugin/README.md b/collectors/apps.plugin/README.md index d10af1cdd..a85c07898 100644 --- a/collectors/apps.plugin/README.md +++ b/collectors/apps.plugin/README.md @@ -160,7 +160,7 @@ There are a few command line options you can pass to `apps.plugin`. The list of ### Integration with eBPF If you don't see charts under the **eBPF syscall** or **eBPF net** sections, you should edit your -[`ebpf.conf`](/collectors/ebpf.plugin/README.md#ebpf-programs) file to ensure the eBPF program is enabled. +[`ebpf.d.conf`](/collectors/ebpf.plugin/README.md#ebpf-programs) file to ensure the eBPF program is enabled. Also see our [guide on troubleshooting apps with eBPF metrics](/docs/guides/troubleshoot/monitor-debug-applications-ebpf.md) for ideas on how to interpret these charts in a diff --git a/collectors/cgroups.plugin/README.md b/collectors/cgroups.plugin/README.md index 21dbcae83..86776d6e0 100644 --- a/collectors/cgroups.plugin/README.md +++ b/collectors/cgroups.plugin/README.md @@ -147,6 +147,33 @@ Support per distribution: |AMI|NO|[here](http://pastebin.com/FrxmptjL)|not a systemd system| |CentOS 7.3.1611|NO|[here](http://pastebin.com/SpzgezAg)|can be enabled, see below| +### Monitored systemd service metrics + +- CPU utilization +- Used memory +- RSS memory +- Mapped memory +- Cache memory +- Writeback memory +- Memory minor page faults +- Memory major page faults +- Memory charging activity +- Memory uncharging activity +- Memory limit failures +- Swap memory used +- Disk read bandwidth +- Disk write bandwidth +- Disk read operations +- Disk write operations +- Throttle disk read bandwidth +- Throttle disk write bandwidth +- Throttle disk read operations +- Throttle disk write operations +- Queued disk read operations +- Queued disk write operations +- Merged disk read operations +- Merged disk write operations + ### how to enable cgroup accounting on systemd systems that is by default disabled You can verify there is no accounting enabled, by running `systemd-cgtop`. The program will show only resources for cgroup `/`, but all services will show nothing. @@ -230,4 +257,31 @@ So, when a network interface or container stops, Netdata might log a few errors 6. obsolete charts will be removed from memory, 1 hour after the last user viewed them (configurable with `[global].cleanup obsolete charts after seconds = 3600` (at `netdata.conf`). 7. when obsolete charts are removed from memory they are also deleted from disk (configurable with `[global].delete obsolete charts files = yes`) +### Monitored container metrics + +- CPU usage +- CPU usage within the limits +- CPU usage per core +- Memory usage +- Writeback memory +- Memory activity +- Memory page faults +- Used memory +- Used RAM within the limits +- Memory utilization +- Memory limit failures +- I/O bandwidth (all disks) +- Serviced I/O operations (all disks) +- Throttle I/O bandwidth (all disks) +- Throttle serviced I/O operations (all disks) +- Queued I/O operations (all disks) +- Merged I/O operations (all disks) +- CPU pressure +- Memory pressure +- Memory full pressure +- I/O pressure +- I/O full pressure + +Network interfaces are monitored by means of the [proc plugin](/collectors/proc.plugin/README.md#monitored-network-interface-metrics). + [](<>) diff --git a/collectors/cgroups.plugin/cgroup-name.sh.in b/collectors/cgroups.plugin/cgroup-name.sh.in index 19fbf3989..8ef8ab58e 100755 --- a/collectors/cgroups.plugin/cgroup-name.sh.in +++ b/collectors/cgroups.plugin/cgroup-name.sh.in @@ -428,6 +428,14 @@ if [ -z "${NAME}" ]; then # systemd-nspawn NAME="$(echo "${CGROUP}" | sed 's/.*machine.slice[_\/]\(.*\)\.service/\1/g')" + elif [[ ${CGROUP} =~ machine.slice_machine.*-lxc ]]; then + # libvirtd / lxc containers + # examples: + # before: machine.slice machine-lxc/x2d969/x2dhubud0xians01.scope + # after: lxc/hubud0xians01 + # before: machine.slice_machine-lxc/x2d969/x2dhubud0xians01.scope/libvirt_init.scope + # after: lxc/hubud0xians01/libvirt_init + NAME="lxc/$(echo "${CGROUP}" | sed 's/machine.slice_machine.*-lxc//; s/\/x2d[[:digit:]]*//; s/\/x2d//g; s/\.scope//g')" elif [[ ${CGROUP} =~ machine.slice_machine.*-qemu ]]; then # libvirtd / qemu virtual machines # NAME="$(echo ${CGROUP} | sed 's/machine.slice_machine.*-qemu//; s/\/x2d//; s/\/x2d/\-/g; s/\.scope//g')" diff --git a/collectors/cgroups.plugin/cgroup-network-helper.sh b/collectors/cgroups.plugin/cgroup-network-helper.sh index eb839ef57..1b60f452a 100755 --- a/collectors/cgroups.plugin/cgroup-network-helper.sh +++ b/collectors/cgroups.plugin/cgroup-network-helper.sh @@ -123,7 +123,7 @@ proc_pid_fdinfo_iff() { find_tun_tap_interfaces_for_cgroup() { local c="${1}" # the cgroup path [ -d "${c}/emulator" ] && c="${c}/emulator" # check for 'emulator' subdirectory - c="${c}/cgroup.procs" # make full path + c="${c}/cgroup.procs" # make full path # for each pid of the cgroup # find any tun/tap devices linked to the pid @@ -168,18 +168,26 @@ virsh_find_all_interfaces_for_cgroup() { then local d d="$(virsh_cgroup_to_domain_name "${c}")" + # convert hex to character + # e.g.: vm01\x2dweb => vm01-web (https://github.com/netdata/netdata/issues/11088#issuecomment-832618149) + d="$(printf '%b' "${d}")" if [ ! -z "${d}" ] then debug "running: virsh domiflist ${d}; to find the network interfaces" - # match only 'network' interfaces from virsh output + # 'virsh -r domiflist <domain>' example output + # Interface Type Source Model MAC + #-------------------------------------------------------------- + # vnet3 bridge br0 virtio 52:54:00:xx:xx:xx + # vnet4 network default virtio 52:54:00:yy:yy:yy + # match only 'network' interfaces from virsh output set_source "virsh" "${virsh}" -r domiflist "${d}" |\ sed -n \ - -e "s|^\([^[:space:]]\+\)[[:space:]]\+network[[:space:]]\+\([^[:space:]]\+\)[[:space:]]\+[^[:space:]]\+[[:space:]]\+[^[:space:]]\+$|\1 \1_\2|p" \ - -e "s|^\([^[:space:]]\+\)[[:space:]]\+bridge[[:space:]]\+\([^[:space:]]\+\)[[:space:]]\+[^[:space:]]\+[[:space:]]\+[^[:space:]]\+$|\1 \1_\2|p" + -e "s|^[[:space:]]\?\([^[:space:]]\+\)[[:space:]]\+network[[:space:]]\+\([^[:space:]]\+\)[[:space:]]\+[^[:space:]]\+[[:space:]]\+[^[:space:]]\+$|\1 \1_\2|p" \ + -e "s|^[[:space:]]\?\([^[:space:]]\+\)[[:space:]]\+bridge[[:space:]]\+\([^[:space:]]\+\)[[:space:]]\+[^[:space:]]\+[[:space:]]\+[^[:space:]]\+$|\1 \1_\2|p" else debug "no virsh domain extracted from cgroup ${c}" fi diff --git a/collectors/cgroups.plugin/cgroup-network.c b/collectors/cgroups.plugin/cgroup-network.c index 921b14dfb..562d30663 100644 --- a/collectors/cgroups.plugin/cgroup-network.c +++ b/collectors/cgroups.plugin/cgroup-network.c @@ -453,7 +453,7 @@ void detect_veth_interfaces(pid_t pid) { if(!eligible_ifaces(host)) { errno = 0; - error("there are no double-linked host interfaces available."); + info("there are no double-linked host interfaces available."); goto cleanup; } diff --git a/collectors/cgroups.plugin/sys_fs_cgroup.c b/collectors/cgroups.plugin/sys_fs_cgroup.c index ceffffe92..eea4d9ae7 100644 --- a/collectors/cgroups.plugin/sys_fs_cgroup.c +++ b/collectors/cgroups.plugin/sys_fs_cgroup.c @@ -142,7 +142,7 @@ static enum cgroups_type cgroups_try_detect_version() enum cgroups_systemd_setting systemd_setting; int cgroups2_available = 0; - // 1. check if cgroups2 availible on system at all + // 1. check if cgroups2 available on system at all FILE *f = mypopen("grep cgroup /proc/filesystems", &command_pid); if (!f) { error("popen failed"); @@ -160,7 +160,20 @@ static enum cgroups_type cgroups_try_detect_version() if(!cgroups2_available) return CGROUPS_V1; - // 2. check systemd compiletime setting +#if defined CGROUP2_SUPER_MAGIC + // 2. check filesystem type for the default mountpoint + char filename[FILENAME_MAX + 1]; + snprintfz(filename, FILENAME_MAX, "%s%s", netdata_configured_host_prefix, "/sys/fs/cgroup"); + struct statfs fsinfo; + if (!statfs(filename, &fsinfo)) { + if (fsinfo.f_type == CGROUP2_SUPER_MAGIC) + return CGROUPS_V2; + if (fsinfo.f_type == CGROUP_SUPER_MAGIC) + return CGROUPS_V1; + } +#endif + + // 3. check systemd compiletime setting if ((systemd_setting = cgroups_detect_systemd("systemd --version")) == SYSTEMD_CGROUP_ERR) systemd_setting = cgroups_detect_systemd(SYSTEMD_CMD_RHEL); @@ -168,13 +181,13 @@ static enum cgroups_type cgroups_try_detect_version() return CGROUPS_AUTODETECT_FAIL; if(systemd_setting == SYSTEMD_CGROUP_LEGACY || systemd_setting == SYSTEMD_CGROUP_HYBRID) { - // curently we prefer V1 if HYBRID is set as it seems to be more feature complete + // currently we prefer V1 if HYBRID is set as it seems to be more feature complete // in the future we might want to continue here if SYSTEMD_CGROUP_HYBRID // and go ahead with V2 return CGROUPS_V1; } - // 3. if we are unified as on Fedora (default cgroups2 only mode) + // 4. if we are unified as on Fedora (default cgroups2 only mode) // check kernel command line flag that can override that setting f = fopen("/proc/cmdline", "r"); if (!f) { @@ -1300,6 +1313,12 @@ static inline char *cgroup_chart_id_strdupz(const char *s) { char *r = strdupz(s); netdata_fix_chart_id(r); + // dots are used to distinguish chart type and id in streaming, so we should replace them + for (char *d = r; *d; d++) { + if (*d == '.') + *d = '-'; + } + return r; } @@ -1469,7 +1488,7 @@ static inline struct cgroup *cgroup_add(const char *id) { } if(user_configurable) { - // allow the user to enable/disable this individualy + // allow the user to enable/disable this individually char option[FILENAME_MAX + 1]; snprintfz(option, FILENAME_MAX, "enable cgroup %s", cg->chart_title); cg->enabled = (char) config_get_boolean("plugin:cgroups", option, def); @@ -3996,9 +4015,10 @@ static void cgroup_main_cleanup(void *ptr) { uv_mutex_unlock(&discovery_thread.mutex); } + info("waiting for discovery thread to finish..."); + while (!discovery_thread.exited && max > 0) { max -= step; - info("waiting for discovery thread to finish..."); sleep_usec(step); } @@ -4077,7 +4097,7 @@ void *cgroups_main(void *ptr) { , NULL , "cgroups" , NULL - , "NetData CGroups Plugin CPU usage" + , "Netdata CGroups Plugin CPU usage" , "milliseconds/s" , PLUGIN_CGROUPS_NAME , "stats" diff --git a/collectors/charts.d.plugin/charts.d.conf b/collectors/charts.d.plugin/charts.d.conf index d6add5e5b..0872d39e6 100644 --- a/collectors/charts.d.plugin/charts.d.conf +++ b/collectors/charts.d.plugin/charts.d.conf @@ -1,6 +1,6 @@ # This is the configuration for charts.d.plugin -# Each of its collectors can read configuration eiher from this file +# Each of its collectors can read configuration either from this file # or a NAME.conf file (where NAME is the collector name). # The collector specific file has higher precedence. diff --git a/collectors/charts.d.plugin/charts.d.plugin.in b/collectors/charts.d.plugin/charts.d.plugin.in index 62363f3db..1b5c3f337 100755 --- a/collectors/charts.d.plugin/charts.d.plugin.in +++ b/collectors/charts.d.plugin/charts.d.plugin.in @@ -130,7 +130,7 @@ update_every=${minimum_update_frequency} # this will be overwritten by the comma charts_create="_create" charts_update="_update" charts_check="_check" -charts_undescore="_" +charts_underscore="_" # when making iterations, charts.d can loop more frequently # to prevent plugins missing iterations. @@ -345,7 +345,7 @@ float2int() { [ -z "${a}" ] && a="0" # strip leading zeros from the integer part - # base 10 convertion + # base 10 conversion a=$((10#$a)) # check the length of the decimal part @@ -361,7 +361,7 @@ float2int() { fi # strip leading zeros from the decimal part - # base 10 convertion + # base 10 conversion b=$((10#$b)) # store the result @@ -467,9 +467,9 @@ all_enabled_charts() { # check its config #if [ -f "$userconfd/$chart.conf" ] #then - # if [ ! -z "$( cat "$userconfd/$chart.conf" | sed "s/^ \+//g" | grep -v "^$" | grep -v "^#" | grep -v "^$chart$charts_undescore" )" ] + # if [ ! -z "$( cat "$userconfd/$chart.conf" | sed "s/^ \+//g" | grep -v "^$" | grep -v "^#" | grep -v "^$chart$charts_underscore" )" ] # then - # error "module's $chart config $userconfd/$chart.conf should only have lines starting with $chart$charts_undescore . Disabling it." + # error "module's $chart config $userconfd/$chart.conf should only have lines starting with $chart$charts_underscore . Disabling it." # continue # fi #fi diff --git a/collectors/charts.d.plugin/opensips/opensips.chart.sh b/collectors/charts.d.plugin/opensips/opensips.chart.sh index 447dd0bc0..d3a2118ce 100644 --- a/collectors/charts.d.plugin/opensips/opensips.chart.sh +++ b/collectors/charts.d.plugin/opensips/opensips.chart.sh @@ -31,6 +31,7 @@ opensips_check() { # try to find it in the system if [ -z "$opensips_cmd" ]; then require_cmd opensipsctl || return 1 + opensips_cmd="$OPENSIPSCTL_CMD" fi # check once if the command works diff --git a/collectors/checks.plugin/plugin_checks.c b/collectors/checks.plugin/plugin_checks.c index f8a2008a8..1bd053b8c 100644 --- a/collectors/checks.plugin/plugin_checks.c +++ b/collectors/checks.plugin/plugin_checks.c @@ -82,7 +82,7 @@ void *checks_main(void *ptr) { now_realtime_timeval(&now); loop_usec = dt_usec(&now, &last); usec = loop_usec - susec; - debug(D_PROCNETDEV_LOOP, "CHECK: last loop took %llu usec (worked for %llu, sleeped for %llu).", loop_usec, usec, susec); + debug(D_PROCNETDEV_LOOP, "CHECK: last loop took %llu usec (worked for %llu, slept for %llu).", loop_usec, usec, susec); if(usec < (localhost->rrd_update_every * USEC_PER_SEC / 2ULL)) susec = (localhost->rrd_update_every * USEC_PER_SEC) - usec; else susec = localhost->rrd_update_every * USEC_PER_SEC / 2ULL; diff --git a/collectors/cups.plugin/cups_plugin.c b/collectors/cups.plugin/cups_plugin.c index a80930e4d..25d6f8cb5 100644 --- a/collectors/cups.plugin/cups_plugin.c +++ b/collectors/cups.plugin/cups_plugin.c @@ -49,7 +49,7 @@ static int netdata_priority = 100004; http_t *http; // connection to the cups daemon /* - * Used to aggregate job metrics for a destination (and all destianations). + * Used to aggregate job metrics for a destination (and all destinations). */ struct job_metrics { int is_collected; // flag if this was collected in the current cycle diff --git a/collectors/diskspace.plugin/plugin_diskspace.c b/collectors/diskspace.plugin/plugin_diskspace.c index 4010e5759..311b55adf 100644 --- a/collectors/diskspace.plugin/plugin_diskspace.c +++ b/collectors/diskspace.plugin/plugin_diskspace.c @@ -4,7 +4,7 @@ #define PLUGIN_DISKSPACE_NAME "diskspace.plugin" -#define DELAULT_EXCLUDED_PATHS "/proc/* /sys/* /var/run/user/* /run/user/* /snap/* /var/lib/docker/*" +#define DEFAULT_EXCLUDED_PATHS "/proc/* /sys/* /var/run/user/* /run/user/* /snap/* /var/lib/docker/*" #define DEFAULT_EXCLUDED_FILESYSTEMS "*gvfs *gluster* *s3fs *ipfs *davfs2 *httpfs *sshfs *gdfs *moosefs fusectl autofs" #define CONFIG_SECTION_DISKSPACE "plugin:proc:diskspace" @@ -100,7 +100,7 @@ static inline void do_disk_space_stats(struct mountinfo *mi, int update_every) { } excluded_mountpoints = simple_pattern_create( - config_get(CONFIG_SECTION_DISKSPACE, "exclude space metrics on paths", DELAULT_EXCLUDED_PATHS) + config_get(CONFIG_SECTION_DISKSPACE, "exclude space metrics on paths", DEFAULT_EXCLUDED_PATHS) , NULL , mode ); @@ -413,7 +413,7 @@ void *diskspace_main(void *ptr) { , NULL , "diskspace" , NULL - , "NetData Disk Space Plugin CPU usage" + , "Netdata Disk Space Plugin CPU usage" , "milliseconds/s" , PLUGIN_DISKSPACE_NAME , NULL @@ -441,7 +441,7 @@ void *diskspace_main(void *ptr) { , NULL , "diskspace" , NULL - , "NetData Disk Space Plugin Duration" + , "Netdata Disk Space Plugin Duration" , "milliseconds/run" , PLUGIN_DISKSPACE_NAME , NULL diff --git a/collectors/ebpf.plugin/Makefile.am b/collectors/ebpf.plugin/Makefile.am index 4fb2056fd..18b1fc6c8 100644 --- a/collectors/ebpf.plugin/Makefile.am +++ b/collectors/ebpf.plugin/Makefile.am @@ -33,6 +33,7 @@ dist_libconfig_DATA = \ dist_ebpfconfig_DATA = \ ebpf.d/ebpf_kernel_reject_list.txt \ ebpf.d/cachestat.conf \ + ebpf.d/dcstat.conf \ ebpf.d/network.conf \ ebpf.d/process.conf \ ebpf.d/sync.conf \ diff --git a/collectors/ebpf.plugin/README.md b/collectors/ebpf.plugin/README.md index 405eab875..1e593786b 100644 --- a/collectors/ebpf.plugin/README.md +++ b/collectors/ebpf.plugin/README.md @@ -123,11 +123,11 @@ To enable the collector, scroll down to the `[plugins]` section ensure the relev ebpf = yes ``` -You can also configure the eBPF collector's behavior by editing `ebpf.conf`. +You can also configure the eBPF collector's behavior by editing `ebpf.d.conf`. ```bash cd /etc/netdata/ # Replace with your Netdata configuration directory, if not /etc/netdata/ -./edit-config ebpf.conf +./edit-config ebpf.d.conf ``` ### `[global]` @@ -149,6 +149,7 @@ accepts the following values: new charts for the return of these functions, such as errors. Monitoring function returns can help in debugging software, such as failing to close file descriptors or creating zombie processes. - `update every`: Number of seconds used for eBPF to send data for Netdata. +- `pid table size`: Defines the maximum number of PIDs stored inside the application hash table. #### Integration with `apps.plugin` @@ -187,6 +188,11 @@ If you want to _disable_ the integration with `apps.plugin` along with the above apps = yes ``` +When the integration is enabled, eBPF collector allocates memory for each process running. The total + allocated memory has direct relationship with the kernel version. When the eBPF plugin is running on kernels newer than `4.15`, + it uses per-cpu maps to speed up the update of hash tables. This also implies storing data for the same PID + for each processor it runs. + #### `[ebpf programs]` The eBPF collector enables and runs the following eBPF programs by default: @@ -194,6 +200,9 @@ The eBPF collector enables and runs the following eBPF programs by default: - `cachestat`: Netdata's eBPF data collector creates charts about the memory page cache. When the integration with [`apps.plugin`](/collectors/apps.plugin/README.md) is enabled, this collector creates charts for the whole host _and_ for each application. +- `dcstat` : This eBPF program creates charts that show information about file access using directory cache. It appends + `kprobes` for `lookup_fast()` and `d_lookup()` to identify if files are inside directory cache, outside and + files are not found. - `process`: This eBPF program creates charts that show information about process creation, VFS IO, and files removed. When in `return` mode, it also creates charts showing errors when these operations are executed. - `network viewer`: This eBPF program creates charts with information about `TCP` and `UDP` functions, including the @@ -215,6 +224,7 @@ cd /etc/netdata/ # Replace with your Netdata configuration directory, if not / The following configuration files are available: - `cachestat.conf`: Configuration for the `cachestat` thread. +- `dcstat.conf`: Configuration for the `dcstat` thread. - `process.conf`: Configuration for the `process` thread. - `network.conf`: Configuration for the `network viewer` thread. This config file overwrites the global options and also lets you specify which network the eBPF collector monitors. @@ -347,13 +357,16 @@ mount these filesystems on startup. More information can be found in the [ftrace ## Performance -Because eBPF monitoring is complex, we are evaluating the performance of this new collector in various real-world -conditions, across various system loads, and when monitoring complex applications. +eBPF monitoring is complex and produces a large volume of metrics. We've discovered scenarios where the eBPF plugin +significantly increases kernel memory usage by several hundred MB. + +If your node is experiencing high memory usage and there is no obvious culprit to be found in the `apps.mem` chart, +consider testing for high kernel memory usage by [disabling eBPF monitoring](#configuration). Next, +[restart Netdata](/docs/configure/start-stop-restart.md) with `sudo systemctl restart netdata` to see if system +memory usage (see the `system.ram` chart) has dropped significantly. -Our [initial testing](https://github.com/netdata/netdata/issues/8195) shows the performance of the eBPF collector is -nearly identical to our [apps.plugin collector](/collectors/apps.plugin/README.md), despite collecting and displaying -much more sophisticated metrics. You can now use the eBPF to gather deeper insights without affecting the performance of -your complex applications at any load. +Beginning with `v1.31`, kernel memory usage is configurable via the [`pid table size` setting](#ebpf-load-mode) +in `ebpf.conf`. ## SELinux diff --git a/collectors/ebpf.plugin/ebpf.c b/collectors/ebpf.plugin/ebpf.c index 26dacfd3e..5cc005f30 100644 --- a/collectors/ebpf.plugin/ebpf.c +++ b/collectors/ebpf.plugin/ebpf.c @@ -77,19 +77,26 @@ pthread_cond_t collect_data_cond_var; ebpf_module_t ebpf_modules[] = { { .thread_name = "process", .config_name = "process", .enabled = 0, .start_routine = ebpf_process_thread, .update_time = 1, .global_charts = 1, .apps_charts = 1, .mode = MODE_ENTRY, - .optional = 0, .apps_routine = ebpf_process_create_apps_charts }, + .optional = 0, .apps_routine = ebpf_process_create_apps_charts, .maps = NULL, + .pid_map_size = ND_EBPF_DEFAULT_PID_SIZE, .names = NULL}, { .thread_name = "socket", .config_name = "socket", .enabled = 0, .start_routine = ebpf_socket_thread, .update_time = 1, .global_charts = 1, .apps_charts = 1, .mode = MODE_ENTRY, - .optional = 0, .apps_routine = ebpf_socket_create_apps_charts }, + .optional = 0, .apps_routine = ebpf_socket_create_apps_charts, .maps = NULL, + .pid_map_size = ND_EBPF_DEFAULT_PID_SIZE, .names = NULL}, { .thread_name = "cachestat", .config_name = "cachestat", .enabled = 0, .start_routine = ebpf_cachestat_thread, - .update_time = 1, .global_charts = 1, .apps_charts = 1, .mode = MODE_ENTRY, - .optional = 0, .apps_routine = ebpf_cachestat_create_apps_charts }, + .update_time = 1, .global_charts = 1, .apps_charts = 1, .mode = MODE_ENTRY, + .optional = 0, .apps_routine = ebpf_cachestat_create_apps_charts, .maps = NULL, + .pid_map_size = ND_EBPF_DEFAULT_PID_SIZE, .names = NULL}, { .thread_name = "sync", .config_name = "sync", .enabled = 0, .start_routine = ebpf_sync_thread, - .update_time = 1, .global_charts = 1, .apps_charts = 1, .mode = MODE_ENTRY, - .optional = 0, .apps_routine = NULL }, + .update_time = 1, .global_charts = 1, .apps_charts = 1, .mode = MODE_ENTRY, + .optional = 0, .apps_routine = NULL, .maps = NULL, .pid_map_size = ND_EBPF_DEFAULT_PID_SIZE, .names = NULL }, + { .thread_name = "dc", .config_name = "dc", .enabled = 0, .start_routine = ebpf_dcstat_thread, + .update_time = 1, .global_charts = 1, .apps_charts = 1, .mode = MODE_ENTRY, + .optional = 0, .apps_routine = ebpf_dcstat_create_apps_charts, .maps = NULL, + .pid_map_size = ND_EBPF_DEFAULT_PID_SIZE }, { .thread_name = NULL, .enabled = 0, .start_routine = NULL, .update_time = 1, .global_charts = 0, .apps_charts = 1, .mode = MODE_ENTRY, - .optional = 0, .apps_routine = NULL }, + .optional = 0, .apps_routine = NULL, .maps = NULL, .pid_map_size = 0, .names = NULL }, }; // Link with apps.plugin @@ -130,7 +137,23 @@ static void ebpf_exit(int sig) return; } - freez(global_process_stat); + if (ebpf_modules[EBPF_MODULE_SOCKET_IDX].enabled) { + ebpf_modules[EBPF_MODULE_SOCKET_IDX].enabled = 0; + clean_socket_apps_structures(); + freez(socket_bandwidth_curr); + } + + if (ebpf_modules[EBPF_MODULE_CACHESTAT_IDX].enabled) { + ebpf_modules[EBPF_MODULE_CACHESTAT_IDX].enabled = 0; + clean_cachestat_pid_structures(); + freez(cachestat_pid); + } + + if (ebpf_modules[EBPF_MODULE_DCSTAT_IDX].enabled) { + ebpf_modules[EBPF_MODULE_DCSTAT_IDX].enabled = 0; + clean_dcstat_pid_structures(); + freez(dcstat_pid); + } /* int ret = fork(); @@ -154,7 +177,7 @@ static void ebpf_exit(int sig) int sid = setsid(); if (sid >= 0) { debug(D_EXIT, "Wait for father %d die", getpid()); - sleep_usec(200000); // Sleep 200 miliseconds to father dies. + sleep_usec(200000); // Sleep 200 milliseconds to father dies. clean_loaded_events(); } else { error("Cannot become session id leader, so I won't try to clean kprobe_events.\n"); @@ -318,7 +341,7 @@ void write_io_chart(char *chart, char *family, char *dwrite, long long vwrite, c * @param id chart id * @param title chart title * @param units units label - * @param family group name used to attach the chart on dashaboard + * @param family group name used to attach the chart on dashboard * @param charttype chart type * @param context chart context * @param order chart order @@ -376,7 +399,7 @@ void ebpf_create_global_dimension(void *ptr, int end) * @param id chart id * @param title chart title * @param units axis label - * @param family group name used to attach the chart on dashaboard + * @param family group name used to attach the chart on dashboard * @param context chart context * @param charttype chart type * @param order order number of the specified chart @@ -572,6 +595,8 @@ void ebpf_print_help() "\n" " --cachestat or -c Enable charts related to process run time.\n" "\n" + " --dcstat or -d Enable charts related to directory cache.\n" + "\n" " --net or -n Enable network viewer charts.\n" "\n" " --process or -p Enable charts related to process run time.\n" @@ -691,7 +716,7 @@ static void read_local_addresses() } /** - * Start Ptherad Variable + * Start Pthread Variable * * This function starts all pthread variables. * @@ -764,6 +789,22 @@ static void ebpf_update_interval() } /** + * Update PID table size + * + * Update default size with value from user + */ +static void ebpf_update_table_size() +{ + int i; + uint32_t value = (uint32_t) appconfig_get_number(&collector_config, EBPF_GLOBAL_SECTION, + EBPF_CFG_PID_SIZE, ND_EBPF_DEFAULT_PID_SIZE); + for (i = 0; ebpf_modules[i].thread_name; i++) { + ebpf_modules[i].pid_map_size = value; + } +} + + +/** * Read collector values * * @param disable_apps variable to store information related to apps. @@ -783,6 +824,8 @@ static void read_collector_values(int *disable_apps) ebpf_update_interval(); + ebpf_update_table_size(); + // This is kept to keep compatibility uint32_t enabled = appconfig_get_boolean(&collector_config, EBPF_GLOBAL_SECTION, "disable apps", CONFIG_BOOLEAN_NO); @@ -844,6 +887,13 @@ static void read_collector_values(int *disable_apps) started++; } + enabled = appconfig_get_boolean(&collector_config, EBPF_PROGRAMS_SECTION, "dcstat", + CONFIG_BOOLEAN_NO); + if (enabled) { + ebpf_enable_chart(EBPF_MODULE_DCSTAT_IDX, *disable_apps); + started++; + } + if (!started){ ebpf_enable_all_charts(*disable_apps); // Read network viewer section @@ -927,6 +977,7 @@ static void parse_args(int argc, char **argv) {"global", no_argument, 0, 'g' }, {"all", no_argument, 0, 'a' }, {"cachestat", no_argument, 0, 'c' }, + {"dcstat", no_argument, 0, 'd' }, {"net", no_argument, 0, 'n' }, {"process", no_argument, 0, 'p' }, {"return", no_argument, 0, 'r' }, @@ -945,7 +996,7 @@ static void parse_args(int argc, char **argv) } while (1) { - int c = getopt_long(argc, argv, "hvgcanprs", long_options, &option_index); + int c = getopt_long(argc, argv, "hvgacdnprs", long_options, &option_index); if (c == -1) break; @@ -983,6 +1034,15 @@ static void parse_args(int argc, char **argv) #endif break; } + case 'd': { + enabled = 1; + ebpf_enable_chart(EBPF_MODULE_DCSTAT_IDX, disable_apps); +#ifdef NETDATA_INTERNAL_CHECKS + info( + "EBPF enabling \"DCSTAT\" charts, because it was started with the option \"--dcstat\" or \"-d\"."); +#endif + break; + } case 'n': { enabled = 1; ebpf_enable_chart(EBPF_MODULE_SOCKET_IDX, disable_apps); @@ -1027,7 +1087,7 @@ static void parse_args(int argc, char **argv) if (load_collector_config(ebpf_user_config_dir, &disable_apps)) { info( - "Does not have a configuration file inside `%s/ebpf.conf. It will try to load stock file.", + "Does not have a configuration file inside `%s/ebpf.d.conf. It will try to load stock file.", ebpf_user_config_dir); if (load_collector_config(ebpf_stock_config_dir, &disable_apps)) { info("Does not have a stock file. It is starting with default options."); @@ -1141,6 +1201,8 @@ int main(int argc, char **argv) NULL, NULL, ebpf_modules[EBPF_MODULE_CACHESTAT_IDX].start_routine}, {"EBPF SYNC" , NULL, NULL, 1, NULL, NULL, ebpf_modules[EBPF_MODULE_SYNC_IDX].start_routine}, + {"EBPF DCSTAT" , NULL, NULL, 1, + NULL, NULL, ebpf_modules[EBPF_MODULE_DCSTAT_IDX].start_routine}, {NULL , NULL, NULL, 0, NULL, NULL, NULL} }; diff --git a/collectors/ebpf.plugin/ebpf.d.conf b/collectors/ebpf.plugin/ebpf.d.conf index 7191d7416..ef6ff8145 100644 --- a/collectors/ebpf.plugin/ebpf.d.conf +++ b/collectors/ebpf.plugin/ebpf.d.conf @@ -11,10 +11,14 @@ # 'no'. # # The `update every` option defines the number of seconds used to read data from kernel and send to netdata +# +# The `pid table size` defines the maximum number of PIDs stored in the application hash tables. +# [global] ebpf load mode = entry apps = yes update every = 1 + pid table size = 32768 # # eBPF Programs @@ -29,6 +33,7 @@ # `sync` : Montitor calls for syscall sync(2). [ebpf programs] cachestat = no + dcstat = no process = yes socket = yes sync = yes diff --git a/collectors/ebpf.plugin/ebpf.d/cachestat.conf b/collectors/ebpf.plugin/ebpf.d/cachestat.conf index 78277cf56..0c4d991df 100644 --- a/collectors/ebpf.plugin/ebpf.d/cachestat.conf +++ b/collectors/ebpf.plugin/ebpf.d/cachestat.conf @@ -7,8 +7,10 @@ # If you want to disable the integration with `apps.plugin` along with the above charts, change the setting `apps` to # 'no'. # +# The `pid table size` defines the maximum number of PIDs stored inside the application hash table. # [global] ebpf load mode = entry apps = yes update every = 2 + pid table size = 32768 diff --git a/collectors/ebpf.plugin/ebpf.d/dcstat.conf b/collectors/ebpf.plugin/ebpf.d/dcstat.conf new file mode 100644 index 000000000..2607b98fd --- /dev/null +++ b/collectors/ebpf.plugin/ebpf.d/dcstat.conf @@ -0,0 +1,13 @@ +# The `ebpf load mode` option accepts the following values : +# `entry` : The eBPF collector only monitors calls for the functions, and does not show charts related to errors. +# `return : In the `return` mode, the eBPF collector monitors the same kernel functions as `entry`, but also creates +# new charts for the return of these functions, such as errors. +# +# The eBPF collector also creates charts for each running application through an integration with the `apps plugin`. +# If you want to disable the integration with `apps.plugin` along with the above charts, change the setting `apps` to +# 'no'. +# +[global] + ebpf load mode = entry + apps = yes + update every = 2 diff --git a/collectors/ebpf.plugin/ebpf.d/network.conf b/collectors/ebpf.plugin/ebpf.d/network.conf index b033bc39c..6bbd49a49 100644 --- a/collectors/ebpf.plugin/ebpf.d/network.conf +++ b/collectors/ebpf.plugin/ebpf.d/network.conf @@ -7,11 +7,20 @@ # If you want to disable the integration with `apps.plugin` along with the above charts, change the setting `apps` to # 'no'. # -# +# The following options change the hash table size: +# `bandwidth table size`: Maximum number of connections monitored +# `ipv4 connection table size`: Maximum number of IPV4 connections monitored +# `ipv6 connection table size`: Maximum number of IPV6 connections monitored +# `udp connection table size`: Maximum number of UDP connections monitored +# [global] ebpf load mode = entry apps = yes update every = 1 + bandwidth table size = 16384 + ipv4 connection table size = 16384 + ipv6 connection table size = 16384 + udp connection table size = 4096 # # Network Connection diff --git a/collectors/ebpf.plugin/ebpf.d/process.conf b/collectors/ebpf.plugin/ebpf.d/process.conf index 7806dc844..511da95ad 100644 --- a/collectors/ebpf.plugin/ebpf.d/process.conf +++ b/collectors/ebpf.plugin/ebpf.d/process.conf @@ -7,8 +7,10 @@ # If you want to disable the integration with `apps.plugin` along with the above charts, change the setting `apps` to # 'no'. # +# The `pid table size` defines the maximum number of PIDs stored inside the hash table. # [global] ebpf load mode = entry apps = yes update every = 1 + pid table size = 32768 diff --git a/collectors/ebpf.plugin/ebpf.h b/collectors/ebpf.plugin/ebpf.h index 6796dcdad..841701e20 100644 --- a/collectors/ebpf.plugin/ebpf.h +++ b/collectors/ebpf.plugin/ebpf.h @@ -77,7 +77,8 @@ enum ebpf_module_indexes { EBPF_MODULE_PROCESS_IDX, EBPF_MODULE_SOCKET_IDX, EBPF_MODULE_CACHESTAT_IDX, - EBPF_MODULE_SYNC_IDX + EBPF_MODULE_SYNC_IDX, + EBPF_MODULE_DCSTAT_IDX }; // Copied from musl header @@ -89,8 +90,9 @@ enum ebpf_module_indexes { #endif #endif -// Chart defintions +// Chart definitions #define NETDATA_EBPF_FAMILY "ebpf" +#define NETDATA_FILESYSTEM_FAMILY "filesystem" #define NETDATA_EBPF_CHART_TYPE_LINE "line" #define NETDATA_EBPF_CHART_TYPE_STACKED "stacked" #define NETDATA_EBPF_MEMORY_GROUP "mem" @@ -196,6 +198,7 @@ extern void ebpf_cleanup_publish_syscall(netdata_publish_syscall_t *nps); #define EBPF_COMMON_DIMENSION_BYTES "bytes/s" #define EBPF_COMMON_DIMENSION_DIFFERENCE "difference" #define EBPF_COMMON_DIMENSION_PACKETS "packets" +#define EBPF_COMMON_DIMENSION_FILES "files" // Common variables extern int debug_enabled; @@ -215,6 +218,7 @@ extern void ebpf_socket_create_apps_charts(struct ebpf_module *em, void *ptr); extern void ebpf_cachestat_create_apps_charts(struct ebpf_module *em, void *root); extern void ebpf_one_dimension_write_charts(char *family, char *chart, char *dim, long long v1); extern collected_number get_value_from_structure(char *basis, size_t offset); +extern void ebpf_update_pid_table(ebpf_local_maps_t *pid, ebpf_module_t *em); #define EBPF_MAX_SYNCHRONIZATION_TIME 300 diff --git a/collectors/ebpf.plugin/ebpf_apps.c b/collectors/ebpf.plugin/ebpf_apps.c index 1be7b9260..6459bad0d 100644 --- a/collectors/ebpf.plugin/ebpf_apps.c +++ b/collectors/ebpf.plugin/ebpf_apps.c @@ -265,7 +265,7 @@ struct target *get_apps_groups_target(struct target **agrt, const char *id, stru * @param path the directory to search apps_%s.conf * @param file the word to complement the file name. * - * @return It returns 0 on succcess and -1 otherwise + * @return It returns 0 on success and -1 otherwise */ int ebpf_read_apps_groups_conf(struct target **agdt, struct target **agrt, const char *path, const char *file) { @@ -470,7 +470,7 @@ static inline int managed_log(struct pid_stat *p, uint32_t log, int status) /** * Get PID entry * - * Get or allocate the PID entry for the specifid pid. + * Get or allocate the PID entry for the specified pid. * * @param pid the pid to search the data. * @@ -664,7 +664,7 @@ static inline int read_proc_pid_stat(struct pid_stat *p, void *ptr) * @param pid the current pid that we are working * @param ptr a NULL value * - * @return It returns 1 on succcess and 0 otherwise + * @return It returns 1 on success and 0 otherwise */ static inline int collect_data_for_pid(pid_t pid, void *ptr) { @@ -927,6 +927,12 @@ void cleanup_variables_from_other_threads(uint32_t pid) freez(cachestat_pid[pid]); cachestat_pid[pid] = NULL; } + + // Clean directory cache structure + if (dcstat_pid) { + freez(dcstat_pid[pid]); + dcstat_pid[pid] = NULL; + } } /** @@ -943,7 +949,6 @@ void cleanup_exited_pids() pid_t r = p->pid; p = p->next; - del_pid_entry(r); // Clean process structure freez(global_process_stats[r]); @@ -953,6 +958,8 @@ void cleanup_exited_pids() current_apps_data[r] = NULL; cleanup_variables_from_other_threads(r); + + del_pid_entry(r); } else { if (unlikely(p->keep)) p->keeploops++; diff --git a/collectors/ebpf.plugin/ebpf_apps.h b/collectors/ebpf.plugin/ebpf_apps.h index eb54754c6..edcdef605 100644 --- a/collectors/ebpf.plugin/ebpf_apps.h +++ b/collectors/ebpf.plugin/ebpf_apps.h @@ -16,8 +16,10 @@ #define NETDATA_APPS_PROCESS_GROUP "process (eBPF)" #define NETDATA_APPS_NET_GROUP "net (eBPF)" #define NETDATA_APPS_CACHESTAT_GROUP "page cache (eBPF)" +#define NETDATA_APPS_DCSTAT_GROUP "directory cache (eBPF)" #include "ebpf_process.h" +#include "ebpf_dcstat.h" #include "ebpf_cachestat.h" #include "ebpf_sync.h" @@ -108,8 +110,9 @@ struct target { uid_t uid; gid_t gid; - // Page cache statistic per process + // Changes made to simplify integration between apps and eBPF. netdata_publish_cachestat_t cachestat; + netdata_publish_dcstat_t dcstat; /* These variables are not necessary for eBPF collector kernel_uint_t minflt; @@ -430,8 +433,11 @@ extern size_t read_bandwidth_statistic_using_pid_on_target(ebpf_bandwidth_t **ep extern void collect_data_for_all_processes(int tbl_pid_stats_fd); +extern void clean_global_memory(); + extern ebpf_process_stat_t **global_process_stats; extern ebpf_process_publish_apps_t **current_apps_data; extern netdata_publish_cachestat_t **cachestat_pid; +extern netdata_publish_dcstat_t **dcstat_pid; #endif /* NETDATA_EBPF_APPS_H */ diff --git a/collectors/ebpf.plugin/ebpf_cachestat.c b/collectors/ebpf.plugin/ebpf_cachestat.c index 6516d4da2..cdeac6951 100644 --- a/collectors/ebpf.plugin/ebpf_cachestat.c +++ b/collectors/ebpf.plugin/ebpf_cachestat.c @@ -24,6 +24,10 @@ struct netdata_static_thread cachestat_threads = {"CACHESTAT KERNEL", NULL, NULL, 1, NULL, NULL, NULL}; +static ebpf_local_maps_t cachestat_maps[] = {{.name = "cstat_pid", .internal_input = ND_EBPF_DEFAULT_PID_SIZE, + .user_input = 0}, + {.name = NULL, .internal_input = 0, .user_input = 0}}; + static int *map_fd = NULL; struct config cachestat_config = { .first_section = NULL, @@ -43,7 +47,7 @@ struct config cachestat_config = { .first_section = NULL, * * Clean the allocated structures. */ -static void clean_pid_structures() { +void clean_cachestat_pid_structures() { struct pid_stat *pids = root_of_pids; while (pids) { freez(cachestat_pid[pids->pid]); @@ -71,9 +75,6 @@ static void ebpf_cachestat_cleanup(void *ptr) UNUSED(dt); } - clean_pid_structures(); - freez(cachestat_pid); - ebpf_cleanup_publish_syscall(cachestat_counter_publish_aggregated); freez(cachestat_vector); @@ -125,7 +126,7 @@ void cachestat_update_publish(netdata_publish_cachestat_t *out, uint64_t mpa, ui hits = 0; } - calculated_number ratio = (total > 0) ? hits/total : 0; + calculated_number ratio = (total > 0) ? hits/total : 1; out->ratio = (long long )(ratio*100); out->hit = (long long)hits; @@ -282,7 +283,7 @@ void ebpf_cachestat_create_apps_charts(struct ebpf_module *em, void *ptr) "The ratio is calculated dividing the Hit pages per total cache accesses without counting dirties.", EBPF_COMMON_DIMENSION_PERCENTAGE, NETDATA_APPS_CACHESTAT_GROUP, - NETDATA_EBPF_CHART_TYPE_STACKED, + NETDATA_EBPF_CHART_TYPE_LINE, 20090, ebpf_algorithms[NETDATA_EBPF_ABSOLUTE_IDX], root); @@ -360,15 +361,11 @@ void *ebpf_cachestat_read_hash(void *ptr) ebpf_module_t *em = (ebpf_module_t *)ptr; usec_t step = NETDATA_LATENCY_CACHESTAT_SLEEP_MS * em->update_time; - int apps = em->apps_charts; while (!close_ebpf_plugin) { usec_t dt = heartbeat_next(&hb, step); (void)dt; read_global_table(); - - if (apps) - read_apps_table(); } read_thread_closed = 1; @@ -385,12 +382,9 @@ static void cachestat_send_global(netdata_publish_cachestat_t *publish) calculate_stats(publish); netdata_publish_syscall_t *ptr = cachestat_counter_publish_aggregated; - // The algorithm sets this value to zero sometimes, we are not written them to have a smooth chart - if (publish->ratio) { - ebpf_one_dimension_write_charts( - NETDATA_EBPF_MEMORY_GROUP, NETDATA_CACHESTAT_HIT_RATIO_CHART, ptr[NETDATA_CACHESTAT_IDX_RATIO].dimension, - publish->ratio); - } + ebpf_one_dimension_write_charts( + NETDATA_EBPF_MEMORY_GROUP, NETDATA_CACHESTAT_HIT_RATIO_CHART, ptr[NETDATA_CACHESTAT_IDX_RATIO].dimension, + publish->ratio); ebpf_one_dimension_write_charts( NETDATA_EBPF_MEMORY_GROUP, NETDATA_CACHESTAT_DIRTY_CHART, ptr[NETDATA_CACHESTAT_IDX_DIRTY].dimension, @@ -512,6 +506,9 @@ static void cachestat_collector(ebpf_module_t *em) pthread_mutex_lock(&collect_data_mutex); pthread_cond_wait(&collect_data_cond_var, &collect_data_mutex); + if (apps) + read_apps_table(); + pthread_mutex_lock(&lock); cachestat_send_global(&publish); @@ -539,7 +536,7 @@ static void ebpf_create_memory_charts() { ebpf_create_chart(NETDATA_EBPF_MEMORY_GROUP, NETDATA_CACHESTAT_HIT_RATIO_CHART, "Hit is calculating using total cache added without dirties per total added because of red misses.", - EBPF_CACHESTAT_DIMENSION_HITS, NETDATA_CACHESTAT_SUBMENU, + EBPF_COMMON_DIMENSION_PERCENTAGE, NETDATA_CACHESTAT_SUBMENU, NULL, NETDATA_EBPF_CHART_TYPE_LINE, 21100, @@ -615,9 +612,11 @@ void *ebpf_cachestat_thread(void *ptr) netdata_thread_cleanup_push(ebpf_cachestat_cleanup, ptr); ebpf_module_t *em = (ebpf_module_t *)ptr; + em->maps = cachestat_maps; fill_ebpf_data(&cachestat_data); ebpf_update_module(em, &cachestat_config, NETDATA_CACHESTAT_CONFIG_FILE); + ebpf_update_pid_table(&cachestat_maps[0], em); if (!em->enabled) goto endcachestat; diff --git a/collectors/ebpf.plugin/ebpf_cachestat.h b/collectors/ebpf.plugin/ebpf_cachestat.h index daf678975..694933e0c 100644 --- a/collectors/ebpf.plugin/ebpf_cachestat.h +++ b/collectors/ebpf.plugin/ebpf_cachestat.h @@ -60,5 +60,6 @@ typedef struct netdata_publish_cachestat { } netdata_publish_cachestat_t; extern void *ebpf_cachestat_thread(void *ptr); +extern void clean_cachestat_pid_structures(); #endif // NETDATA_EBPF_CACHESTAT_H diff --git a/collectors/ebpf.plugin/ebpf_dcstat.c b/collectors/ebpf.plugin/ebpf_dcstat.c new file mode 100644 index 000000000..01fd97972 --- /dev/null +++ b/collectors/ebpf.plugin/ebpf_dcstat.c @@ -0,0 +1,603 @@ +// SPDX-License-Identifier: GPL-3.0-or-later + +#include "ebpf.h" +#include "ebpf_dcstat.h" + +static char *dcstat_counter_dimension_name[NETDATA_DCSTAT_IDX_END] = { "ratio", "reference", "slow", "miss" }; +static netdata_syscall_stat_t dcstat_counter_aggregated_data[NETDATA_DCSTAT_IDX_END]; +static netdata_publish_syscall_t dcstat_counter_publish_aggregated[NETDATA_DCSTAT_IDX_END]; + +static ebpf_data_t dcstat_data; + +netdata_dcstat_pid_t *dcstat_vector = NULL; +netdata_publish_dcstat_t **dcstat_pid = NULL; + +static struct bpf_link **probe_links = NULL; +static struct bpf_object *objects = NULL; + +static int *map_fd = NULL; +static netdata_idx_t dcstat_hash_values[NETDATA_DCSTAT_IDX_END]; + +static int read_thread_closed = 1; + +struct config dcstat_config = { .first_section = NULL, + .last_section = NULL, + .mutex = NETDATA_MUTEX_INITIALIZER, + .index = { .avl_tree = { .root = NULL, .compar = appconfig_section_compare }, + .rwlock = AVL_LOCK_INITIALIZER } }; + +struct netdata_static_thread dcstat_threads = {"DCSTAT KERNEL", + NULL, NULL, 1, NULL, + NULL, NULL}; + +static ebpf_local_maps_t dcstat_maps[] = {{.name = "dcstat_pid", .internal_input = ND_EBPF_DEFAULT_PID_SIZE, + .user_input = 0}, + {.name = NULL, .internal_input = 0, .user_input = 0}}; + +static ebpf_specify_name_t dc_optional_name[] = { {.program_name = "netdata_lookup_fast", + .function_to_attach = "lookup_fast", + .optional = NULL, + .retprobe = CONFIG_BOOLEAN_NO}, + {.program_name = NULL}}; + +/***************************************************************** + * + * COMMON FUNCTIONS + * + *****************************************************************/ + +/** + * Update publish + * + * Update publish values before to write dimension. + * + * @param out strcuture that will receive data. + * @param cache_access number of access to directory cache. + * @param not_found number of files not found on the file system + */ +void dcstat_update_publish(netdata_publish_dcstat_t *out, uint64_t cache_access, uint64_t not_found) +{ + calculated_number successful_access = (calculated_number) (((long long)cache_access) - ((long long)not_found)); + calculated_number ratio = (cache_access) ? successful_access/(calculated_number)cache_access : 0; + + out->ratio = (long long )(ratio*100); +} + +/***************************************************************** + * + * FUNCTIONS TO CLOSE THE THREAD + * + *****************************************************************/ + +/** + * Clean PID structures + * + * Clean the allocated structures. + */ +void clean_dcstat_pid_structures() { + struct pid_stat *pids = root_of_pids; + while (pids) { + freez(dcstat_pid[pids->pid]); + + pids = pids->next; + } +} + +/** + * Clean names + * + * Clean the optional names allocated during startup. + */ +void ebpf_dcstat_clean_names() +{ + size_t i = 0; + while (dc_optional_name[i].program_name) { + freez(dc_optional_name[i].optional); + i++; + } +} + +/** + * Clean up the main thread. + * + * @param ptr thread data. + */ +static void ebpf_dcstat_cleanup(void *ptr) +{ + ebpf_module_t *em = (ebpf_module_t *)ptr; + if (!em->enabled) + return; + + heartbeat_t hb; + heartbeat_init(&hb); + uint32_t tick = 2 * USEC_PER_MS; + while (!read_thread_closed) { + usec_t dt = heartbeat_next(&hb, tick); + UNUSED(dt); + } + + freez(dcstat_vector); + + ebpf_cleanup_publish_syscall(dcstat_counter_publish_aggregated); + + ebpf_dcstat_clean_names(); + + struct bpf_program *prog; + size_t i = 0 ; + bpf_object__for_each_program(prog, objects) { + bpf_link__destroy(probe_links[i]); + i++; + } + bpf_object__close(objects); +} + +/***************************************************************** + * + * APPS + * + *****************************************************************/ + +/** + * Create apps charts + * + * Call ebpf_create_chart to create the charts on apps submenu. + * + * @param em a pointer to the structure with the default values. + */ +void ebpf_dcstat_create_apps_charts(struct ebpf_module *em, void *ptr) +{ + UNUSED(em); + struct target *root = ptr; + ebpf_create_charts_on_apps(NETDATA_DC_HIT_CHART, + "Percentage of files listed inside directory cache", + EBPF_COMMON_DIMENSION_PERCENTAGE, + NETDATA_APPS_DCSTAT_GROUP, + NETDATA_EBPF_CHART_TYPE_LINE, + 20100, + ebpf_algorithms[NETDATA_EBPF_ABSOLUTE_IDX], + root); + + ebpf_create_charts_on_apps(NETDATA_DC_REFERENCE_CHART, + "Count file access.", + EBPF_COMMON_DIMENSION_FILES, + NETDATA_APPS_DCSTAT_GROUP, + NETDATA_EBPF_CHART_TYPE_STACKED, + 20101, + ebpf_algorithms[NETDATA_EBPF_ABSOLUTE_IDX], + root); + + ebpf_create_charts_on_apps(NETDATA_DC_REQUEST_NOT_CACHE_CHART, + "Access to files that were not present inside directory cache.", + EBPF_COMMON_DIMENSION_FILES, + NETDATA_APPS_DCSTAT_GROUP, + NETDATA_EBPF_CHART_TYPE_STACKED, + 20102, + ebpf_algorithms[NETDATA_EBPF_ABSOLUTE_IDX], + root); + + ebpf_create_charts_on_apps(NETDATA_DC_REQUEST_NOT_FOUND_CHART, + "Number of requests for files that were not found on filesystem.", + EBPF_COMMON_DIMENSION_FILES, + NETDATA_APPS_DCSTAT_GROUP, + NETDATA_EBPF_CHART_TYPE_STACKED, + 20103, + ebpf_algorithms[NETDATA_EBPF_ABSOLUTE_IDX], + root); +} + +/***************************************************************** + * + * MAIN LOOP + * + *****************************************************************/ + +/** + * Apps Accumulator + * + * Sum all values read from kernel and store in the first address. + * + * @param out the vector with read values. + */ +static void dcstat_apps_accumulator(netdata_dcstat_pid_t *out) +{ + int i, end = (running_on_kernel >= NETDATA_KERNEL_V4_15) ? ebpf_nprocs : 1; + netdata_dcstat_pid_t *total = &out[0]; + for (i = 1; i < end; i++) { + netdata_dcstat_pid_t *w = &out[i]; + total->cache_access += w->cache_access; + total->file_system += w->file_system; + total->not_found += w->not_found; + } +} + +/** + * Save PID values + * + * Save the current values inside the structure + * + * @param out vector used to plot charts + * @param publish vector with values read from hash tables. + */ +static inline void dcstat_save_pid_values(netdata_publish_dcstat_t *out, netdata_dcstat_pid_t *publish) +{ + memcpy(&out->curr, &publish[0], sizeof(netdata_dcstat_pid_t)); +} + +/** + * Fill PID + * + * Fill PID structures + * + * @param current_pid pid that we are collecting data + * @param out values read from hash tables; + */ +static void dcstat_fill_pid(uint32_t current_pid, netdata_dcstat_pid_t *publish) +{ + netdata_publish_dcstat_t *curr = dcstat_pid[current_pid]; + if (!curr) { + curr = callocz(1, sizeof(netdata_publish_dcstat_t)); + dcstat_pid[current_pid] = curr; + } + + dcstat_save_pid_values(curr, publish); +} + +/** + * Read APPS table + * + * Read the apps table and store data inside the structure. + */ +static void read_apps_table() +{ + netdata_dcstat_pid_t *cv = dcstat_vector; + uint32_t key; + struct pid_stat *pids = root_of_pids; + int fd = map_fd[NETDATA_DCSTAT_PID_STATS]; + size_t length = sizeof(netdata_dcstat_pid_t)*ebpf_nprocs; + while (pids) { + key = pids->pid; + + if (bpf_map_lookup_elem(fd, &key, cv)) { + pids = pids->next; + continue; + } + + dcstat_apps_accumulator(cv); + + dcstat_fill_pid(key, cv); + + // We are cleaning to avoid passing data read from one process to other. + memset(cv, 0, length); + + pids = pids->next; + } +} + +/** + * Read global table + * + * Read the table with number of calls for all functions + */ +static void read_global_table() +{ + uint32_t idx; + netdata_idx_t *val = dcstat_hash_values; + netdata_idx_t stored; + int fd = map_fd[NETDATA_DCSTAT_GLOBAL_STATS]; + + for (idx = NETDATA_KEY_DC_REFERENCE; idx < NETDATA_DIRECTORY_CACHE_END; idx++) { + if (!bpf_map_lookup_elem(fd, &idx, &stored)) { + val[idx] = stored; + } + } +} + +/** + * DCstat read hash + * + * This is the thread callback. + * This thread is necessary, because we cannot freeze the whole plugin to read the data. + * + * @param ptr It is a NULL value for this thread. + * + * @return It always returns NULL. + */ +void *ebpf_dcstat_read_hash(void *ptr) +{ + read_thread_closed = 0; + + heartbeat_t hb; + heartbeat_init(&hb); + + ebpf_module_t *em = (ebpf_module_t *)ptr; + + usec_t step = NETDATA_LATENCY_DCSTAT_SLEEP_MS * em->update_time; + while (!close_ebpf_plugin) { + usec_t dt = heartbeat_next(&hb, step); + (void)dt; + + read_global_table(); + } + read_thread_closed = 1; + + return NULL; +} + +/** + * Cachestat sum PIDs + * + * Sum values for all PIDs associated to a group + * + * @param publish output structure. + * @param root structure with listed IPs + */ +void ebpf_dcstat_sum_pids(netdata_publish_dcstat_t *publish, struct pid_on_target *root) +{ + memset(&publish->curr, 0, sizeof(netdata_dcstat_pid_t)); + netdata_dcstat_pid_t *dst = &publish->curr; + while (root) { + int32_t pid = root->pid; + netdata_publish_dcstat_t *w = dcstat_pid[pid]; + if (w) { + netdata_dcstat_pid_t *src = &w->curr; + dst->cache_access += src->cache_access; + dst->file_system += src->file_system; + dst->not_found += src->not_found; + } + + root = root->next; + } +} + +/** + * Send data to Netdata calling auxiliar functions. + * + * @param root the target list. +*/ +void ebpf_dcache_send_apps_data(struct target *root) +{ + struct target *w; + collected_number value; + + write_begin_chart(NETDATA_APPS_FAMILY, NETDATA_DC_HIT_CHART); + for (w = root; w; w = w->next) { + if (unlikely(w->exposed && w->processes)) { + ebpf_dcstat_sum_pids(&w->dcstat, w->root_pid); + + uint64_t cache = w->dcstat.curr.cache_access; + uint64_t not_found = w->dcstat.curr.not_found; + + dcstat_update_publish(&w->dcstat, cache, not_found); + value = (collected_number) w->dcstat.ratio; + write_chart_dimension(w->name, value); + } + } + write_end_chart(); + + write_begin_chart(NETDATA_APPS_FAMILY, NETDATA_DC_REFERENCE_CHART); + for (w = root; w; w = w->next) { + if (unlikely(w->exposed && w->processes)) { + if (w->dcstat.curr.cache_access < w->dcstat.prev.cache_access) { + w->dcstat.prev.cache_access = 0; + } + + w->dcstat.cache_access = (long long)w->dcstat.curr.cache_access - (long long)w->dcstat.prev.cache_access; + value = (collected_number) w->dcstat.cache_access; + write_chart_dimension(w->name, value); + w->dcstat.prev.cache_access = w->dcstat.curr.cache_access; + } + } + write_end_chart(); + + write_begin_chart(NETDATA_APPS_FAMILY, NETDATA_DC_REQUEST_NOT_CACHE_CHART); + for (w = root; w; w = w->next) { + if (unlikely(w->exposed && w->processes)) { + if (w->dcstat.curr.file_system < w->dcstat.prev.file_system) { + w->dcstat.prev.file_system = 0; + } + + value = (collected_number) (!w->dcstat.cache_access) ? 0 : + (long long )w->dcstat.curr.file_system - (long long)w->dcstat.prev.file_system; + write_chart_dimension(w->name, value); + w->dcstat.prev.file_system = w->dcstat.curr.file_system; + } + } + write_end_chart(); + + write_begin_chart(NETDATA_APPS_FAMILY, NETDATA_DC_REQUEST_NOT_FOUND_CHART); + for (w = root; w; w = w->next) { + if (unlikely(w->exposed && w->processes)) { + if (w->dcstat.curr.not_found < w->dcstat.prev.not_found) { + w->dcstat.prev.not_found = 0; + } + value = (collected_number) (!w->dcstat.cache_access) ? 0 : + (long long)w->dcstat.curr.not_found - (long long)w->dcstat.prev.not_found; + write_chart_dimension(w->name, value); + w->dcstat.prev.not_found = w->dcstat.curr.not_found; + } + } + write_end_chart(); +} + +/** + * Send global + * + * Send global charts to Netdata + */ +static void dcstat_send_global(netdata_publish_dcstat_t *publish) +{ + dcstat_update_publish(publish, dcstat_hash_values[NETDATA_KEY_DC_REFERENCE], + dcstat_hash_values[NETDATA_KEY_DC_MISS]); + + netdata_publish_syscall_t *ptr = dcstat_counter_publish_aggregated; + netdata_idx_t value = dcstat_hash_values[NETDATA_KEY_DC_REFERENCE]; + if (value != ptr[NETDATA_DCSTAT_IDX_REFERENCE].pcall) { + ptr[NETDATA_DCSTAT_IDX_REFERENCE].ncall = value - ptr[NETDATA_DCSTAT_IDX_REFERENCE].pcall; + ptr[NETDATA_DCSTAT_IDX_REFERENCE].pcall = value; + + value = dcstat_hash_values[NETDATA_KEY_DC_SLOW]; + ptr[NETDATA_DCSTAT_IDX_SLOW].ncall = value - ptr[NETDATA_DCSTAT_IDX_SLOW].pcall; + ptr[NETDATA_DCSTAT_IDX_SLOW].pcall = value; + + value = dcstat_hash_values[NETDATA_KEY_DC_MISS]; + ptr[NETDATA_DCSTAT_IDX_MISS].ncall = value - ptr[NETDATA_DCSTAT_IDX_MISS].pcall; + ptr[NETDATA_DCSTAT_IDX_MISS].pcall = value; + } else { + ptr[NETDATA_DCSTAT_IDX_REFERENCE].ncall = 0; + ptr[NETDATA_DCSTAT_IDX_SLOW].ncall = 0; + ptr[NETDATA_DCSTAT_IDX_MISS].ncall = 0; + } + + ebpf_one_dimension_write_charts(NETDATA_FILESYSTEM_FAMILY, NETDATA_DC_HIT_CHART, + ptr[NETDATA_DCSTAT_IDX_RATIO].dimension, publish->ratio); + + write_count_chart( + NETDATA_DC_REFERENCE_CHART, NETDATA_FILESYSTEM_FAMILY, + &dcstat_counter_publish_aggregated[NETDATA_DCSTAT_IDX_REFERENCE], 3); +} + +/** +* Main loop for this collector. +*/ +static void dcstat_collector(ebpf_module_t *em) +{ + dcstat_threads.thread = mallocz(sizeof(netdata_thread_t)); + dcstat_threads.start_routine = ebpf_dcstat_read_hash; + + map_fd = dcstat_data.map_fd; + + netdata_thread_create(dcstat_threads.thread, dcstat_threads.name, NETDATA_THREAD_OPTION_JOINABLE, + ebpf_dcstat_read_hash, em); + + netdata_publish_dcstat_t publish; + memset(&publish, 0, sizeof(publish)); + int apps = em->apps_charts; + while (!close_ebpf_plugin) { + pthread_mutex_lock(&collect_data_mutex); + pthread_cond_wait(&collect_data_cond_var, &collect_data_mutex); + + if (apps) + read_apps_table(); + + pthread_mutex_lock(&lock); + + dcstat_send_global(&publish); + + if (apps) + ebpf_dcache_send_apps_data(apps_groups_root_target); + + pthread_mutex_unlock(&lock); + pthread_mutex_unlock(&collect_data_mutex); + } +} + +/***************************************************************** + * + * INITIALIZE THREAD + * + *****************************************************************/ + +/** + * Create filesystem charts + * + * Call ebpf_create_chart to create the charts for the collector. + */ +static void ebpf_create_filesystem_charts() +{ + ebpf_create_chart(NETDATA_FILESYSTEM_FAMILY, NETDATA_DC_HIT_CHART, + "Percentage of files listed inside directory cache", + EBPF_COMMON_DIMENSION_PERCENTAGE, NETDATA_DIRECTORY_FILESYSTEM_SUBMENU, + NULL, + NETDATA_EBPF_CHART_TYPE_LINE, + 21200, + ebpf_create_global_dimension, + dcstat_counter_publish_aggregated, 1); + + ebpf_create_chart(NETDATA_FILESYSTEM_FAMILY, NETDATA_DC_REFERENCE_CHART, + "Variables used to calculate hit ratio.", + EBPF_COMMON_DIMENSION_FILES, NETDATA_DIRECTORY_FILESYSTEM_SUBMENU, + NULL, + NETDATA_EBPF_CHART_TYPE_LINE, + 21201, + ebpf_create_global_dimension, + &dcstat_counter_publish_aggregated[NETDATA_DCSTAT_IDX_REFERENCE], 3); + + fflush(stdout); +} + +/** + * Allocate vectors used with this thread. + * + * We are not testing the return, because callocz does this and shutdown the software + * case it was not possible to allocate. + * + * @param length is the length for the vectors used inside the collector. + */ +static void ebpf_dcstat_allocate_global_vectors(size_t length) +{ + dcstat_pid = callocz((size_t)pid_max, sizeof(netdata_publish_dcstat_t *)); + dcstat_vector = callocz((size_t)ebpf_nprocs, sizeof(netdata_dcstat_pid_t)); + + memset(dcstat_counter_aggregated_data, 0, length*sizeof(netdata_syscall_stat_t)); + memset(dcstat_counter_publish_aggregated, 0, length*sizeof(netdata_publish_syscall_t)); +} + +/***************************************************************** + * + * MAIN THREAD + * + *****************************************************************/ + +/** + * Directory Cache thread + * + * Thread used to make dcstat thread + * + * @param ptr a pointer to `struct ebpf_module` + * + * @return It always returns NULL + */ +void *ebpf_dcstat_thread(void *ptr) +{ + netdata_thread_cleanup_push(ebpf_dcstat_cleanup, ptr); + + ebpf_module_t *em = (ebpf_module_t *)ptr; + em->maps = dcstat_maps; + fill_ebpf_data(&dcstat_data); + + ebpf_update_module(em, &dcstat_config, NETDATA_DIRECTORY_DCSTAT_CONFIG_FILE); + ebpf_update_pid_table(&dcstat_maps[0], em); + + ebpf_update_names(dc_optional_name, em); + + if (!em->enabled) + goto enddcstat; + + ebpf_dcstat_allocate_global_vectors(NETDATA_DCSTAT_IDX_END); + + pthread_mutex_lock(&lock); + + probe_links = ebpf_load_program(ebpf_plugin_dir, em, kernel_string, &objects, dcstat_data.map_fd); + if (!probe_links) { + pthread_mutex_unlock(&lock); + goto enddcstat; + } + + int algorithms[NETDATA_DCSTAT_IDX_END] = { + NETDATA_EBPF_ABSOLUTE_IDX, NETDATA_EBPF_ABSOLUTE_IDX, NETDATA_EBPF_ABSOLUTE_IDX, + NETDATA_EBPF_ABSOLUTE_IDX + }; + + ebpf_global_labels(dcstat_counter_aggregated_data, dcstat_counter_publish_aggregated, + dcstat_counter_dimension_name, dcstat_counter_dimension_name, + algorithms, NETDATA_DCSTAT_IDX_END); + + ebpf_create_filesystem_charts(); + pthread_mutex_unlock(&lock); + + dcstat_collector(em); + +enddcstat: + netdata_thread_cleanup_pop(1); + return NULL; +} diff --git a/collectors/ebpf.plugin/ebpf_dcstat.h b/collectors/ebpf.plugin/ebpf_dcstat.h new file mode 100644 index 000000000..ad4bd1992 --- /dev/null +++ b/collectors/ebpf.plugin/ebpf_dcstat.h @@ -0,0 +1,64 @@ +// SPDX-License-Identifier: GPL-3.0-or-later + +#ifndef NETDATA_EBPF_DCSTAT_H +#define NETDATA_EBPF_DCSTAT_H 1 + + +// charts +#define NETDATA_DC_HIT_CHART "dc_hit_ratio" +#define NETDATA_DC_REFERENCE_CHART "dc_reference" +#define NETDATA_DC_REQUEST_NOT_CACHE_CHART "dc_not_cache" +#define NETDATA_DC_REQUEST_NOT_FOUND_CHART "dc_not_found" + +#define NETDATA_DIRECTORY_CACHE_SUBMENU "directory cache (eBPF)" +#define NETDATA_DIRECTORY_FILESYSTEM_SUBMENU "Directory Cache (eBPF)" + +// configuration file +#define NETDATA_DIRECTORY_DCSTAT_CONFIG_FILE "dcstat.conf" + +#define NETDATA_LATENCY_DCSTAT_SLEEP_MS 700000ULL + +enum directory_cache_indexes { + NETDATA_DCSTAT_IDX_RATIO, + NETDATA_DCSTAT_IDX_REFERENCE, + NETDATA_DCSTAT_IDX_SLOW, + NETDATA_DCSTAT_IDX_MISS, + + // Keep this as last and don't skip numbers as it is used as element counter + NETDATA_DCSTAT_IDX_END +}; + +enum directory_cache_tables { + NETDATA_DCSTAT_GLOBAL_STATS, + NETDATA_DCSTAT_PID_STATS +}; + +// variables +enum directory_cache_counters { + NETDATA_KEY_DC_REFERENCE, + NETDATA_KEY_DC_SLOW, + NETDATA_KEY_DC_MISS, + + // Keep this as last and don't skip numbers as it is used as element counter + NETDATA_DIRECTORY_CACHE_END +}; + +typedef struct netdata_publish_dcstat_pid { + uint64_t cache_access; + uint64_t file_system; + uint64_t not_found; +} netdata_dcstat_pid_t; + +typedef struct netdata_publish_dcstat { + long long ratio; + long long cache_access; + + netdata_dcstat_pid_t curr; + netdata_dcstat_pid_t prev; +} netdata_publish_dcstat_t; + +extern void *ebpf_dcstat_thread(void *ptr); +extern void ebpf_dcstat_create_apps_charts(struct ebpf_module *em, void *ptr); +extern void clean_dcstat_pid_structures(); + +#endif // NETDATA_EBPF_DCSTAT_H diff --git a/collectors/ebpf.plugin/ebpf_process.c b/collectors/ebpf.plugin/ebpf_process.c index 5fa930b2d..9b15c8407 100644 --- a/collectors/ebpf.plugin/ebpf_process.c +++ b/collectors/ebpf.plugin/ebpf_process.c @@ -18,6 +18,10 @@ static char *process_id_names[NETDATA_KEY_PUBLISH_PROCESS_END] = { "do_sys_open" "release_task", "_do_fork", "sys_clone" }; static char *status[] = { "process", "zombie" }; +static ebpf_local_maps_t process_maps[] = {{.name = "tbl_pid_stats", .internal_input = ND_EBPF_DEFAULT_PID_SIZE, + .user_input = 0}, + {.name = NULL, .internal_input = 0, .user_input = 0}}; + static netdata_idx_t *process_hash_values = NULL; static netdata_syscall_stat_t process_aggregated_data[NETDATA_KEY_PUBLISH_PROCESS_END]; static netdata_publish_syscall_t process_publish_aggregated[NETDATA_KEY_PUBLISH_PROCESS_END]; @@ -464,7 +468,7 @@ static void ebpf_process_update_apps_data() * @param family the chart family * @param name the chart name * @param axis the axis label - * @param web the group name used to attach the chart on dashaboard + * @param web the group name used to attach the chart on dashboard * @param order the order number of the specified chart * @param algorithm the algorithm used to make the charts. */ @@ -494,7 +498,7 @@ static void ebpf_create_io_chart(char *family, char *name, char *axis, char *web * @param family the chart family * @param name the chart name * @param axis the axis label - * @param web the group name used to attach the chart on dashaboard + * @param web the group name used to attach the chart on dashboard * @param order the order number of the specified chart */ static void ebpf_process_status_chart(char *family, char *name, char *axis, @@ -905,26 +909,6 @@ void clean_global_memory() { } } -void clean_pid_on_target(struct pid_on_target *ptr) { - while (ptr) { - struct pid_on_target *next = ptr->next; - freez(ptr); - - ptr = next; - } -} - -void clean_apps_structures(struct target *ptr) { - struct target *agdt = ptr; - while (agdt) { - struct target *next = agdt->next; - clean_pid_on_target(agdt->root_pid); - freez(agdt); - - agdt = next; - } -} - /** * Clean up the main thread. * @@ -949,7 +933,6 @@ static void ebpf_process_cleanup(void *ptr) freez(global_process_stats); freez(current_apps_data); - clean_apps_structures(apps_groups_root_target); freez(process_data.map_fd); struct bpf_program *prog; @@ -1050,6 +1033,7 @@ void *ebpf_process_thread(void *ptr) netdata_thread_cleanup_push(ebpf_process_cleanup, ptr); ebpf_module_t *em = (ebpf_module_t *)ptr; + em->maps = process_maps; process_enabled = em->enabled; fill_ebpf_data(&process_data); @@ -1062,6 +1046,7 @@ void *ebpf_process_thread(void *ptr) } ebpf_update_module(em, &process_config, NETDATA_PROCESS_CONFIG_FILE); + ebpf_update_pid_table(&process_maps[0], em); set_local_pointers(); probe_links = ebpf_load_program(ebpf_plugin_dir, em, kernel_string, &objects, process_data.map_fd); diff --git a/collectors/ebpf.plugin/ebpf_socket.c b/collectors/ebpf.plugin/ebpf_socket.c index a142d43b3..cbb4dded0 100644 --- a/collectors/ebpf.plugin/ebpf_socket.c +++ b/collectors/ebpf.plugin/ebpf_socket.c @@ -16,6 +16,20 @@ static char *socket_dimension_names[NETDATA_MAX_SOCKET_VECTOR] = { "sent", "rece static char *socket_id_names[NETDATA_MAX_SOCKET_VECTOR] = { "tcp_sendmsg", "tcp_cleanup_rbuf", "tcp_close", "udp_sendmsg", "udp_recvmsg", "tcp_retransmit_skb" }; +static ebpf_local_maps_t socket_maps[] = {{.name = "tbl_bandwidth", + .internal_input = NETDATA_COMPILED_CONNECTIONS_ALLOWED, + .user_input = NETDATA_MAXIMUM_CONNECTIONS_ALLOWED}, + {.name = "tbl_conn_ipv4", + .internal_input = NETDATA_COMPILED_CONNECTIONS_ALLOWED, + .user_input = NETDATA_MAXIMUM_CONNECTIONS_ALLOWED}, + {.name = "tbl_conn_ipv6", + .internal_input = NETDATA_COMPILED_CONNECTIONS_ALLOWED, + .user_input = NETDATA_MAXIMUM_CONNECTIONS_ALLOWED}, + {.name = "tbl_nv_udp_conn_stats", + .internal_input = NETDATA_COMPILED_UDP_CONNECTIONS_ALLOWED, + .user_input = NETDATA_MAXIMUM_UDP_CONNECTIONS_ALLOWED}, + {.name = NULL, .internal_input = 0, .user_input = 0}}; + static netdata_idx_t *socket_hash_values = NULL; static netdata_syscall_stat_t socket_aggregated_data[NETDATA_MAX_SOCKET_VECTOR]; static netdata_publish_syscall_t socket_publish_aggregated[NETDATA_MAX_SOCKET_VECTOR]; @@ -600,7 +614,7 @@ void ebpf_socket_create_apps_charts(struct ebpf_module *em, void *ptr) * @param id the chart id * @param title the chart title * @param units the units label - * @param family the group name used to attach the chart on dashaboard + * @param family the group name used to attach the chart on dashboard * @param order the chart order * @param ptr the plot structure with values. */ @@ -637,7 +651,7 @@ static void ebpf_socket_create_nv_chart(char *id, char *title, char *units, * @param id the chart id * @param title the chart title * @param units the units label - * @param family the group name used to attach the chart on dashaboard + * @param family the group name used to attach the chart on dashboard * @param order the chart order * @param ptr the plot structure with values. */ @@ -1325,7 +1339,7 @@ static void read_socket_hash_table(int fd, int family, int network_connection) return; netdata_socket_idx_t key = {}; - netdata_socket_idx_t next_key; + netdata_socket_idx_t next_key = {}; netdata_socket_idx_t removeme; int removesock = 0; @@ -1421,7 +1435,7 @@ void update_listen_table(uint16_t value, uint8_t proto) static void read_listen_table() { uint16_t key = 0; - uint16_t next_key; + uint16_t next_key = 0; int fd = map_fd[NETDATA_SOCKET_LISTEN_TABLE]; uint8_t value; @@ -1713,7 +1727,7 @@ static void clean_allocated_socket_plot() } /** - * Clean netowrk ports allocated during initializaion. + * Clean network ports allocated during initialization. * * @param ptr a pointer to the link list. */ @@ -1769,7 +1783,7 @@ static void clean_hostnames(ebpf_network_viewer_hostname_list_t *hostnames) } } -void clean_thread_structures() { +void clean_socket_apps_structures() { struct pid_stat *pids = root_of_pids; while (pids) { freez(socket_bandwidth_curr[pids->pid]); @@ -1853,8 +1867,6 @@ static void ebpf_socket_cleanup(void *ptr) ebpf_cleanup_publish_syscall(socket_publish_aggregated); freez(socket_hash_values); - clean_thread_structures(); - freez(socket_bandwidth_curr); freez(bandwidth_vector); freez(socket_values); @@ -2755,7 +2767,7 @@ static void link_dimension_name(char *port, uint32_t hash, char *value) } else { for (; names->next; names = names->next) { if (names->port == w->port) { - info("Dupplicated definition for a service, the name %s will be ignored. ", names->name); + info("Duplicated definition for a service, the name %s will be ignored. ", names->name); freez(names->name); names->name = w->name; names->hash = w->hash; @@ -2809,6 +2821,25 @@ void parse_service_name_section(struct config *cfg) } } +void parse_table_size_options(struct config *cfg) +{ + socket_maps[NETDATA_SOCKET_TABLE_BANDWIDTH].user_input = (uint32_t) appconfig_get_number(cfg, + EBPF_GLOBAL_SECTION, + EBPF_CONFIG_BANDWIDTH_SIZE, NETDATA_MAXIMUM_CONNECTIONS_ALLOWED); + + socket_maps[NETDATA_SOCKET_TABLE_IPV4].user_input = (uint32_t) appconfig_get_number(cfg, + EBPF_GLOBAL_SECTION, + EBPF_CONFIG_IPV4_SIZE, NETDATA_MAXIMUM_CONNECTIONS_ALLOWED); + + socket_maps[NETDATA_SOCKET_TABLE_IPV6].user_input = (uint32_t) appconfig_get_number(cfg, + EBPF_GLOBAL_SECTION, + EBPF_CONFIG_IPV6_SIZE, NETDATA_MAXIMUM_CONNECTIONS_ALLOWED); + + socket_maps[NETDATA_SOCKET_TABLE_UDP].user_input = (uint32_t) appconfig_get_number(cfg, + EBPF_GLOBAL_SECTION, + EBPF_CONFIG_UDP_SIZE, NETDATA_MAXIMUM_UDP_CONNECTIONS_ALLOWED); +} + /** * Socket thread * @@ -2822,15 +2853,19 @@ void *ebpf_socket_thread(void *ptr) { netdata_thread_cleanup_push(ebpf_socket_cleanup, ptr); + memset(&inbound_vectors.tree, 0, sizeof(avl_tree_lock)); + memset(&outbound_vectors.tree, 0, sizeof(avl_tree_lock)); avl_init_lock(&inbound_vectors.tree, compare_sockets); avl_init_lock(&outbound_vectors.tree, compare_sockets); ebpf_module_t *em = (ebpf_module_t *)ptr; + em->maps = socket_maps; fill_ebpf_data(&socket_data); ebpf_update_module(em, &socket_config, NETDATA_NETWORK_CONFIG_FILE); parse_network_viewer_section(&socket_config); parse_service_name_section(&socket_config); + parse_table_size_options(&socket_config); if (!em->enabled) goto endsocket; diff --git a/collectors/ebpf.plugin/ebpf_socket.h b/collectors/ebpf.plugin/ebpf_socket.h index 81001bab6..8dd422507 100644 --- a/collectors/ebpf.plugin/ebpf_socket.h +++ b/collectors/ebpf.plugin/ebpf_socket.h @@ -24,8 +24,19 @@ #define EBPF_CONFIG_RESOLVE_SERVICE "resolve service names" #define EBPF_CONFIG_PORTS "ports" #define EBPF_CONFIG_HOSTNAMES "hostnames" +#define EBPF_CONFIG_BANDWIDTH_SIZE "bandwidth table size" +#define EBPF_CONFIG_IPV4_SIZE "ipv4 connection table size" +#define EBPF_CONFIG_IPV6_SIZE "ipv6 connection table size" +#define EBPF_CONFIG_UDP_SIZE "udp connection table size" #define EBPF_MAXIMUM_DIMENSIONS "maximum dimensions" +enum ebpf_socket_table_list { + NETDATA_SOCKET_TABLE_BANDWIDTH, + NETDATA_SOCKET_TABLE_IPV4, + NETDATA_SOCKET_TABLE_IPV6, + NETDATA_SOCKET_TABLE_UDP +}; + enum ebpf_socket_publish_index { NETDATA_IDX_TCP_SENDMSG, NETDATA_IDX_TCP_CLEANUP_RBUF, @@ -94,6 +105,10 @@ typedef enum ebpf_socket_idx { // Port range #define NETDATA_MINIMUM_PORT_VALUE 1 #define NETDATA_MAXIMUM_PORT_VALUE 65535 +#define NETDATA_COMPILED_CONNECTIONS_ALLOWED 65535U +#define NETDATA_MAXIMUM_CONNECTIONS_ALLOWED 16384U +#define NETDATA_COMPILED_UDP_CONNECTIONS_ALLOWED 8192U +#define NETDATA_MAXIMUM_UDP_CONNECTIONS_ALLOWED 4096U #define NETDATA_MINIMUM_IPV4_CIDR 0 #define NETDATA_MAXIMUM_IPV4_CIDR 32 @@ -294,6 +309,7 @@ extern void update_listen_table(uint16_t value, uint8_t proto); extern void parse_network_viewer_section(struct config *cfg); extern void fill_ip_list(ebpf_network_viewer_ip_list_t **out, ebpf_network_viewer_ip_list_t *in, char *table); extern void parse_service_name_section(struct config *cfg); +extern void clean_socket_apps_structures(); extern ebpf_socket_publish_apps_t **socket_bandwidth_curr; diff --git a/collectors/fping.plugin/fping.plugin.in b/collectors/fping.plugin/fping.plugin.in index 5518194be..83c431768 100755 --- a/collectors/fping.plugin/fping.plugin.in +++ b/collectors/fping.plugin/fping.plugin.in @@ -16,6 +16,8 @@ if [ "${1}" = "install" ] then [ "${UID}" != 0 ] && echo >&2 "Please run me as root. This will install a single binary file: /usr/local/bin/fping." && exit 1 + [ -z "${2}" ] && fping_version="5.0" || fping_version="${2}" + run() { printf >&2 " > " printf >&2 "%q " "${@}" @@ -38,14 +40,14 @@ if [ "${1}" = "install" ] run cd /usr/src - if [ -d fping-4.2 ] + if [ -d "fping-${fping_version}" ] then - run rm -rf fping-4.2 || exit 1 + run rm -rf "fping-${fping_version}" || exit 1 fi - download 'https://github.com/schweikert/fping/releases/download/v4.2/fping-4.2.tar.gz' | run tar -zxvpf - + download "https://github.com/schweikert/fping/releases/download/v${fping_version}/fping-${fping_version}.tar.gz" | run tar -zxvpf - [ $? -ne 0 ] && exit 1 - run cd fping-4.2 || exit 1 + run cd "fping-${fping_version}" || exit 1 run ./configure --prefix=/usr/local run make clean diff --git a/collectors/freebsd.plugin/freebsd_devstat.c b/collectors/freebsd.plugin/freebsd_devstat.c index 910def599..66a1e61d2 100644 --- a/collectors/freebsd.plugin/freebsd_devstat.c +++ b/collectors/freebsd.plugin/freebsd_devstat.c @@ -185,7 +185,7 @@ static struct disk *get_disk(const char *name) { int do_kern_devstat(int update_every, usec_t dt) { -#define DELAULT_EXLUDED_DISKS "" +#define DEFAULT_EXCLUDED_DISKS "" #define CONFIG_SECTION_KERN_DEVSTAT "plugin:freebsd:kern.devstat" #define BINTIME_SCALE 5.42101086242752217003726400434970855712890625e-17 // this is 1000/2^64 @@ -222,7 +222,7 @@ int do_kern_devstat(int update_every, usec_t dt) { CONFIG_BOOLEAN_AUTO); excluded_disks = simple_pattern_create( - config_get(CONFIG_SECTION_KERN_DEVSTAT, "disable by default disks matching", DELAULT_EXLUDED_DISKS) + config_get(CONFIG_SECTION_KERN_DEVSTAT, "disable by default disks matching", DEFAULT_EXCLUDED_DISKS) , NULL , SIMPLE_PATTERN_EXACT ); diff --git a/collectors/freebsd.plugin/freebsd_getifaddrs.c b/collectors/freebsd.plugin/freebsd_getifaddrs.c index 1437d08fa..1a84902d6 100644 --- a/collectors/freebsd.plugin/freebsd_getifaddrs.c +++ b/collectors/freebsd.plugin/freebsd_getifaddrs.c @@ -143,7 +143,7 @@ static struct cgroup_network_interface *get_network_interface(const char *name) int do_getifaddrs(int update_every, usec_t dt) { (void)dt; -#define DEFAULT_EXLUDED_INTERFACES "lo*" +#define DEFAULT_EXCLUDED_INTERFACES "lo*" #define DEFAULT_PHYSICAL_INTERFACES "igb* ix* cxl* em* ixl* ixlv* bge* ixgbe* vtnet* vmx* re*" #define CONFIG_SECTION_GETIFADDRS "plugin:freebsd:getifaddrs" @@ -177,7 +177,7 @@ int do_getifaddrs(int update_every, usec_t dt) { CONFIG_BOOLEAN_AUTO); excluded_interfaces = simple_pattern_create( - config_get(CONFIG_SECTION_GETIFADDRS, "disable by default interfaces matching", DEFAULT_EXLUDED_INTERFACES) + config_get(CONFIG_SECTION_GETIFADDRS, "disable by default interfaces matching", DEFAULT_EXCLUDED_INTERFACES) , NULL , SIMPLE_PATTERN_EXACT ); diff --git a/collectors/freebsd.plugin/freebsd_getmntinfo.c b/collectors/freebsd.plugin/freebsd_getmntinfo.c index 58b67a3c3..f83a4a0db 100644 --- a/collectors/freebsd.plugin/freebsd_getmntinfo.c +++ b/collectors/freebsd.plugin/freebsd_getmntinfo.c @@ -124,7 +124,7 @@ static struct mount_point *get_mount_point(const char *name) { int do_getmntinfo(int update_every, usec_t dt) { (void)dt; -#define DELAULT_EXCLUDED_PATHS "/proc/*" +#define DEFAULT_EXCLUDED_PATHS "/proc/*" // taken from gnulib/mountlist.c and shortened to FreeBSD related fstypes #define DEFAULT_EXCLUDED_FILESYSTEMS "autofs procfs subfs devfs none" #define CONFIG_SECTION_GETMNTINFO "plugin:freebsd:getmntinfo" @@ -144,7 +144,7 @@ int do_getmntinfo(int update_every, usec_t dt) { excluded_mountpoints = simple_pattern_create( config_get(CONFIG_SECTION_GETMNTINFO, "exclude space metrics on paths", - DELAULT_EXCLUDED_PATHS) + DEFAULT_EXCLUDED_PATHS) , NULL , SIMPLE_PATTERN_EXACT ); diff --git a/collectors/freebsd.plugin/freebsd_sysctl.c b/collectors/freebsd.plugin/freebsd_sysctl.c index a71ec5604..7d48e76dc 100644 --- a/collectors/freebsd.plugin/freebsd_sysctl.c +++ b/collectors/freebsd.plugin/freebsd_sysctl.c @@ -499,7 +499,7 @@ int do_dev_cpu_temperature(int update_every, usec_t dt) { "temperature", NULL, "temperature", - "cpu.temperatute", + "cpu.temperature", "Core temperature", "Celsius", "freebsd.plugin", @@ -969,7 +969,7 @@ int do_system_ram(int update_every, usec_t dt) { static int mib_active_count[4] = {0, 0, 0, 0}, mib_inactive_count[4] = {0, 0, 0, 0}, mib_wire_count[4] = {0, 0, 0, 0}, mib_cache_count[4] = {0, 0, 0, 0}, mib_vfs_bufspace[2] = {0, 0}, mib_free_count[4] = {0, 0, 0, 0}; vmmeter_t vmmeter_data; - int vfs_bufspace_count; + size_t vfs_bufspace_count; #if defined(NETDATA_COLLECT_LAUNDRY) static int mib_laundry_count[4] = {0, 0, 0, 0}; diff --git a/collectors/freebsd.plugin/plugin_freebsd.c b/collectors/freebsd.plugin/plugin_freebsd.c index bee8395f5..17fec4128 100644 --- a/collectors/freebsd.plugin/plugin_freebsd.c +++ b/collectors/freebsd.plugin/plugin_freebsd.c @@ -15,60 +15,61 @@ static struct freebsd_module { } freebsd_modules[] = { - // system metrics - { .name = "kern.cp_time", .dim = "cp_time", .enabled = 1, .func = do_kern_cp_time }, - { .name = "vm.loadavg", .dim = "loadavg", .enabled = 1, .func = do_vm_loadavg }, - { .name = "system.ram", .dim = "system_ram", .enabled = 1, .func = do_system_ram }, - { .name = "vm.swap_info", .dim = "swap", .enabled = 1, .func = do_vm_swap_info }, - { .name = "vm.stats.vm.v_swappgs", .dim = "swap_io", .enabled = 1, .func = do_vm_stats_sys_v_swappgs }, - { .name = "vm.vmtotal", .dim = "vmtotal", .enabled = 1, .func = do_vm_vmtotal }, - { .name = "vm.stats.vm.v_forks", .dim = "forks", .enabled = 1, .func = do_vm_stats_sys_v_forks }, - { .name = "vm.stats.sys.v_swtch", .dim = "context_swtch", .enabled = 1, .func = do_vm_stats_sys_v_swtch }, - { .name = "hw.intrcnt", .dim = "hw_intr", .enabled = 1, .func = do_hw_intcnt }, - { .name = "vm.stats.sys.v_intr", .dim = "dev_intr", .enabled = 1, .func = do_vm_stats_sys_v_intr }, - { .name = "vm.stats.sys.v_soft", .dim = "soft_intr", .enabled = 1, .func = do_vm_stats_sys_v_soft }, - { .name = "net.isr", .dim = "net_isr", .enabled = 1, .func = do_net_isr }, - { .name = "kern.ipc.sem", .dim = "semaphores", .enabled = 1, .func = do_kern_ipc_sem }, - { .name = "kern.ipc.shm", .dim = "shared_memory", .enabled = 1, .func = do_kern_ipc_shm }, - { .name = "kern.ipc.msq", .dim = "message_queues", .enabled = 1, .func = do_kern_ipc_msq }, - { .name = "uptime", .dim = "uptime", .enabled = 1, .func = do_uptime }, - - // memory metrics - { .name = "vm.stats.vm.v_pgfaults", .dim = "pgfaults", .enabled = 1, .func = do_vm_stats_sys_v_pgfaults }, - - // CPU metrics - { .name = "kern.cp_times", .dim = "cp_times", .enabled = 1, .func = do_kern_cp_times }, - { .name = "dev.cpu.temperature", .dim = "cpu_temperature", .enabled = 1, .func = do_dev_cpu_temperature }, - { .name = "dev.cpu.0.freq", .dim = "cpu_frequency", .enabled = 1, .func = do_dev_cpu_0_freq }, - - // disk metrics - { .name = "kern.devstat", .dim = "kern_devstat", .enabled = 1, .func = do_kern_devstat }, - { .name = "getmntinfo", .dim = "getmntinfo", .enabled = 1, .func = do_getmntinfo }, - - // network metrics - { .name = "net.inet.tcp.states", .dim = "tcp_states", .enabled = 1, .func = do_net_inet_tcp_states }, - { .name = "net.inet.tcp.stats", .dim = "tcp_stats", .enabled = 1, .func = do_net_inet_tcp_stats }, - { .name = "net.inet.udp.stats", .dim = "udp_stats", .enabled = 1, .func = do_net_inet_udp_stats }, - { .name = "net.inet.icmp.stats", .dim = "icmp_stats", .enabled = 1, .func = do_net_inet_icmp_stats }, - { .name = "net.inet.ip.stats", .dim = "ip_stats", .enabled = 1, .func = do_net_inet_ip_stats }, - { .name = "net.inet6.ip6.stats", .dim = "ip6_stats", .enabled = 1, .func = do_net_inet6_ip6_stats }, - { .name = "net.inet6.icmp6.stats", .dim = "icmp6_stats", .enabled = 1, .func = do_net_inet6_icmp6_stats }, - - // network interfaces metrics - { .name = "getifaddrs", .dim = "getifaddrs", .enabled = 1, .func = do_getifaddrs }, - - // ZFS metrics - { .name = "kstat.zfs.misc.arcstats", .dim = "arcstats", .enabled = 1, .func = do_kstat_zfs_misc_arcstats }, - { .name = "kstat.zfs.misc.zio_trim", .dim = "trim", .enabled = 1, .func = do_kstat_zfs_misc_zio_trim }, - - // ipfw metrics - { .name = "ipfw", .dim = "ipfw", .enabled = 1, .func = do_ipfw }, - - // the terminator of this array - { .name = NULL, .dim = NULL, .enabled = 0, .func = NULL } + // system metrics + {.name = "kern.cp_time", .dim = "cp_time", .enabled = 1, .func = do_kern_cp_time}, + {.name = "vm.loadavg", .dim = "loadavg", .enabled = 1, .func = do_vm_loadavg}, + {.name = "system.ram", .dim = "system_ram", .enabled = 1, .func = do_system_ram}, + {.name = "vm.swap_info", .dim = "swap", .enabled = 1, .func = do_vm_swap_info}, + {.name = "vm.stats.vm.v_swappgs", .dim = "swap_io", .enabled = 1, .func = do_vm_stats_sys_v_swappgs}, + {.name = "vm.vmtotal", .dim = "vmtotal", .enabled = 1, .func = do_vm_vmtotal}, + {.name = "vm.stats.vm.v_forks", .dim = "forks", .enabled = 1, .func = do_vm_stats_sys_v_forks}, + {.name = "vm.stats.sys.v_swtch", .dim = "context_swtch", .enabled = 1, .func = do_vm_stats_sys_v_swtch}, + {.name = "hw.intrcnt", .dim = "hw_intr", .enabled = 1, .func = do_hw_intcnt}, + {.name = "vm.stats.sys.v_intr", .dim = "dev_intr", .enabled = 1, .func = do_vm_stats_sys_v_intr}, + {.name = "vm.stats.sys.v_soft", .dim = "soft_intr", .enabled = 1, .func = do_vm_stats_sys_v_soft}, + {.name = "net.isr", .dim = "net_isr", .enabled = 1, .func = do_net_isr}, + {.name = "kern.ipc.sem", .dim = "semaphores", .enabled = 1, .func = do_kern_ipc_sem}, + {.name = "kern.ipc.shm", .dim = "shared_memory", .enabled = 1, .func = do_kern_ipc_shm}, + {.name = "kern.ipc.msq", .dim = "message_queues", .enabled = 1, .func = do_kern_ipc_msq}, + {.name = "uptime", .dim = "uptime", .enabled = 1, .func = do_uptime}, + + // memory metrics + {.name = "vm.stats.vm.v_pgfaults", .dim = "pgfaults", .enabled = 1, .func = do_vm_stats_sys_v_pgfaults}, + + // CPU metrics + {.name = "kern.cp_times", .dim = "cp_times", .enabled = 1, .func = do_kern_cp_times}, + {.name = "dev.cpu.temperature", .dim = "cpu_temperature", .enabled = 1, .func = do_dev_cpu_temperature}, + {.name = "dev.cpu.0.freq", .dim = "cpu_frequency", .enabled = 1, .func = do_dev_cpu_0_freq}, + + // disk metrics + {.name = "kern.devstat", .dim = "kern_devstat", .enabled = 1, .func = do_kern_devstat}, + {.name = "getmntinfo", .dim = "getmntinfo", .enabled = 1, .func = do_getmntinfo}, + + // network metrics + {.name = "net.inet.tcp.states", .dim = "tcp_states", .enabled = 1, .func = do_net_inet_tcp_states}, + {.name = "net.inet.tcp.stats", .dim = "tcp_stats", .enabled = 1, .func = do_net_inet_tcp_stats}, + {.name = "net.inet.udp.stats", .dim = "udp_stats", .enabled = 1, .func = do_net_inet_udp_stats}, + {.name = "net.inet.icmp.stats", .dim = "icmp_stats", .enabled = 1, .func = do_net_inet_icmp_stats}, + {.name = "net.inet.ip.stats", .dim = "ip_stats", .enabled = 1, .func = do_net_inet_ip_stats}, + {.name = "net.inet6.ip6.stats", .dim = "ip6_stats", .enabled = 1, .func = do_net_inet6_ip6_stats}, + {.name = "net.inet6.icmp6.stats", .dim = "icmp6_stats", .enabled = 1, .func = do_net_inet6_icmp6_stats}, + + // network interfaces metrics + {.name = "getifaddrs", .dim = "getifaddrs", .enabled = 1, .func = do_getifaddrs}, + + // ZFS metrics + {.name = "kstat.zfs.misc.arcstats", .dim = "arcstats", .enabled = 1, .func = do_kstat_zfs_misc_arcstats}, + {.name = "kstat.zfs.misc.zio_trim", .dim = "trim", .enabled = 1, .func = do_kstat_zfs_misc_zio_trim}, + + // ipfw metrics + {.name = "ipfw", .dim = "ipfw", .enabled = 1, .func = do_ipfw}, + + // the terminator of this array + {.name = NULL, .dim = NULL, .enabled = 0, .func = NULL} }; -static void freebsd_main_cleanup(void *ptr) { +static void freebsd_main_cleanup(void *ptr) +{ struct netdata_static_thread *static_thread = (struct netdata_static_thread *)ptr; static_thread->enabled = NETDATA_MAIN_THREAD_EXITING; @@ -77,7 +78,8 @@ static void freebsd_main_cleanup(void *ptr) { static_thread->enabled = NETDATA_MAIN_THREAD_EXITED; } -void *freebsd_main(void *ptr) { +void *freebsd_main(void *ptr) +{ netdata_thread_cleanup_push(freebsd_main_cleanup, ptr); int vdo_cpu_netdata = config_get_boolean("plugin:freebsd", "netdata server resources", 1); @@ -88,7 +90,7 @@ void *freebsd_main(void *ptr) { // check the enabled status for each module int i; - for(i = 0 ; freebsd_modules[i].name ;i++) { + for (i = 0; freebsd_modules[i].name; i++) { struct freebsd_module *pm = &freebsd_modules[i]; pm->enabled = config_get_boolean("plugin:freebsd", pm->name, pm->enabled); @@ -100,17 +102,19 @@ void *freebsd_main(void *ptr) { heartbeat_t hb; heartbeat_init(&hb); - while(!netdata_exit) { + while (!netdata_exit) { usec_t hb_dt = heartbeat_next(&hb, step); usec_t duration = 0ULL; - if(unlikely(netdata_exit)) break; + if (unlikely(netdata_exit)) + break; // BEGIN -- the job to be done - for(i = 0 ; freebsd_modules[i].name ;i++) { + for (i = 0; freebsd_modules[i].name; i++) { struct freebsd_module *pm = &freebsd_modules[i]; - if(unlikely(!pm->enabled)) continue; + if (unlikely(!pm->enabled)) + continue; debug(D_PROCNETDEV_LOOP, "FREEBSD calling %s.", pm->name); @@ -118,55 +122,87 @@ void *freebsd_main(void *ptr) { pm->duration = heartbeat_monotonic_dt_to_now_usec(&hb) - duration; duration += pm->duration; - if(unlikely(netdata_exit)) break; + if (unlikely(netdata_exit)) + break; } // END -- the job is done - // -------------------------------------------------------------------- - - if(vdo_cpu_netdata) { - static RRDSET *st = NULL; - - if(unlikely(!st)) { - st = rrdset_find_active_bytype_localhost("netdata", "plugin_freebsd_modules"); - - if(!st) { - st = rrdset_create_localhost( - "netdata" - , "plugin_freebsd_modules" - , NULL - , "freebsd" - , NULL - , "NetData FreeBSD Plugin Modules Durations" - , "milliseconds/run" - , "netdata" - , "stats" - , 132001 - , localhost->rrd_update_every - , RRDSET_TYPE_STACKED - ); - - for(i = 0 ; freebsd_modules[i].name ;i++) { + if (vdo_cpu_netdata) { + static RRDSET *st_cpu_thread = NULL, *st_duration = NULL; + static RRDDIM *rd_user = NULL, *rd_system = NULL; + + // ---------------------------------------------------------------- + + struct rusage thread; + getrusage(RUSAGE_THREAD, &thread); + + if (unlikely(!st_cpu_thread)) { + st_cpu_thread = rrdset_create_localhost( + "netdata", + "plugin_freebsd_cpu", + NULL, + "freebsd", + NULL, + "Netdata FreeBSD plugin CPU usage", + "milliseconds/s", + "freebsd", + "stats", + 132000, + localhost->rrd_update_every, + RRDSET_TYPE_STACKED); + + rd_user = rrddim_add(st_cpu_thread, "user", NULL, 1, USEC_PER_MS, RRD_ALGORITHM_INCREMENTAL); + rd_system = rrddim_add(st_cpu_thread, "system", NULL, 1, USEC_PER_MS, RRD_ALGORITHM_INCREMENTAL); + } else { + rrdset_next(st_cpu_thread); + } + + rrddim_set_by_pointer( + st_cpu_thread, rd_user, thread.ru_utime.tv_sec * USEC_PER_SEC + thread.ru_utime.tv_usec); + rrddim_set_by_pointer( + st_cpu_thread, rd_system, thread.ru_stime.tv_sec * USEC_PER_SEC + thread.ru_stime.tv_usec); + rrdset_done(st_cpu_thread); + + // ---------------------------------------------------------------- + + if (unlikely(!st_duration)) { + st_duration = rrdset_find_active_bytype_localhost("netdata", "plugin_freebsd_modules"); + + if (!st_duration) { + st_duration = rrdset_create_localhost( + "netdata", + "plugin_freebsd_modules", + NULL, + "freebsd", + NULL, + "Netdata FreeBSD plugin modules durations", + "milliseconds/run", + "freebsd", + "stats", + 132001, + localhost->rrd_update_every, + RRDSET_TYPE_STACKED); + + for (i = 0; freebsd_modules[i].name; i++) { struct freebsd_module *pm = &freebsd_modules[i]; - if(unlikely(!pm->enabled)) continue; + if (unlikely(!pm->enabled)) + continue; - pm->rd = rrddim_add(st, pm->dim, NULL, 1, 1000, RRD_ALGORITHM_ABSOLUTE); + pm->rd = rrddim_add(st_duration, pm->dim, NULL, 1, 1000, RRD_ALGORITHM_ABSOLUTE); } } - } - else rrdset_next(st); + } else + rrdset_next(st_duration); - for(i = 0 ; freebsd_modules[i].name ;i++) { + for (i = 0; freebsd_modules[i].name; i++) { struct freebsd_module *pm = &freebsd_modules[i]; - if(unlikely(!pm->enabled)) continue; + if (unlikely(!pm->enabled)) + continue; - rrddim_set_by_pointer(st, pm->rd, pm->duration); + rrddim_set_by_pointer(st_duration, pm->rd, pm->duration); } - rrdset_done(st); - - global_statistics_charts(); - registry_statistics(); + rrdset_done(st_duration); } } diff --git a/collectors/ioping.plugin/ioping.plugin.in b/collectors/ioping.plugin/ioping.plugin.in index 9f9babd89..1a82ef6d0 100755 --- a/collectors/ioping.plugin/ioping.plugin.in +++ b/collectors/ioping.plugin/ioping.plugin.in @@ -16,7 +16,7 @@ usage="$(basename "$0") [install] [-h] [-e] where: install install ioping binary - -e, --env path to environment file (defauls to '/etc/netdata/.environment' + -e, --env path to environment file (defaults to '/etc/netdata/.environment' -h show this help text" INSTALL=0 diff --git a/collectors/macos.plugin/plugin_macos.c b/collectors/macos.plugin/plugin_macos.c index 628a5b10d..1a64ed81c 100644 --- a/collectors/macos.plugin/plugin_macos.c +++ b/collectors/macos.plugin/plugin_macos.c @@ -2,7 +2,28 @@ #include "plugin_macos.h" -static void macos_main_cleanup(void *ptr) { +static struct macos_module { + const char *name; + const char *dim; + + int enabled; + + int (*func)(int update_every, usec_t dt); + usec_t duration; + + RRDDIM *rd; + +} macos_modules[] = { + {.name = "sysctl", .dim = "sysctl", .enabled = 1, .func = do_macos_sysctl}, + {.name = "mach system management interface", .dim = "mach_smi", .enabled = 1, .func = do_macos_mach_smi}, + {.name = "iokit", .dim = "iokit", .enabled = 1, .func = do_macos_iokit}, + + // the terminator of this array + {.name = NULL, .dim = NULL, .enabled = 0, .func = NULL} +}; + +static void macos_main_cleanup(void *ptr) +{ struct netdata_static_thread *static_thread = (struct netdata_static_thread *)ptr; static_thread->enabled = NETDATA_MAIN_THREAD_EXITING; @@ -11,56 +32,123 @@ static void macos_main_cleanup(void *ptr) { static_thread->enabled = NETDATA_MAIN_THREAD_EXITED; } -void *macos_main(void *ptr) { +void *macos_main(void *ptr) +{ netdata_thread_cleanup_push(macos_main_cleanup, ptr); - // when ZERO, attempt to do it - int vdo_cpu_netdata = !config_get_boolean("plugin:macos", "netdata server resources", 1); - int vdo_macos_sysctl = !config_get_boolean("plugin:macos", "sysctl", 1); - int vdo_macos_mach_smi = !config_get_boolean("plugin:macos", "mach system management interface", 1); - int vdo_macos_iokit = !config_get_boolean("plugin:macos", "iokit", 1); + int vdo_cpu_netdata = config_get_boolean("plugin:macos", "netdata server resources", CONFIG_BOOLEAN_YES); - // keep track of the time each module was called - unsigned long long sutime_macos_sysctl = 0ULL; - unsigned long long sutime_macos_mach_smi = 0ULL; - unsigned long long sutime_macos_iokit = 0ULL; + // check the enabled status for each module + for (int i = 0; macos_modules[i].name; i++) { + struct macos_module *pm = &macos_modules[i]; + + pm->enabled = config_get_boolean("plugin:macos", pm->name, pm->enabled); + pm->duration = 0ULL; + pm->rd = NULL; + } usec_t step = localhost->rrd_update_every * USEC_PER_SEC; heartbeat_t hb; heartbeat_init(&hb); - while(!netdata_exit) { + while (!netdata_exit) { usec_t hb_dt = heartbeat_next(&hb, step); - - if(unlikely(netdata_exit)) break; + usec_t duration = 0ULL; // BEGIN -- the job to be done - if(!vdo_macos_sysctl) { - debug(D_PROCNETDEV_LOOP, "MACOS: calling do_macos_sysctl()."); - vdo_macos_sysctl = do_macos_sysctl(localhost->rrd_update_every, hb_dt); - } - if(unlikely(netdata_exit)) break; + for (int i = 0; macos_modules[i].name; i++) { + struct macos_module *pm = &macos_modules[i]; + if (unlikely(!pm->enabled)) + continue; - if(!vdo_macos_mach_smi) { - debug(D_PROCNETDEV_LOOP, "MACOS: calling do_macos_mach_smi()."); - vdo_macos_mach_smi = do_macos_mach_smi(localhost->rrd_update_every, hb_dt); - } - if(unlikely(netdata_exit)) break; + debug(D_PROCNETDEV_LOOP, "macos calling %s.", pm->name); + + pm->enabled = !pm->func(localhost->rrd_update_every, hb_dt); + pm->duration = heartbeat_monotonic_dt_to_now_usec(&hb) - duration; + duration += pm->duration; - if(!vdo_macos_iokit) { - debug(D_PROCNETDEV_LOOP, "MACOS: calling do_macos_iokit()."); - vdo_macos_iokit = do_macos_iokit(localhost->rrd_update_every, hb_dt); + if (unlikely(netdata_exit)) + break; } - if(unlikely(netdata_exit)) break; // END -- the job is done - // -------------------------------------------------------------------- - - if(!vdo_cpu_netdata) { - global_statistics_charts(); - registry_statistics(); + if (vdo_cpu_netdata) { + static RRDSET *st_cpu_thread = NULL, *st_duration = NULL; + static RRDDIM *rd_user = NULL, *rd_system = NULL; + + // ---------------------------------------------------------------- + + struct rusage thread; + getrusage(RUSAGE_THREAD, &thread); + + if (unlikely(!st_cpu_thread)) { + st_cpu_thread = rrdset_create_localhost( + "netdata", + "plugin_macos_cpu", + NULL, + "macos", + NULL, + "Netdata macOS plugin CPU usage", + "milliseconds/s", + "macos", + "stats", + 132000, + localhost->rrd_update_every, + RRDSET_TYPE_STACKED); + + rd_user = rrddim_add(st_cpu_thread, "user", NULL, 1, USEC_PER_MS, RRD_ALGORITHM_INCREMENTAL); + rd_system = rrddim_add(st_cpu_thread, "system", NULL, 1, USEC_PER_MS, RRD_ALGORITHM_INCREMENTAL); + } else { + rrdset_next(st_cpu_thread); + } + + rrddim_set_by_pointer( + st_cpu_thread, rd_user, thread.ru_utime.tv_sec * USEC_PER_SEC + thread.ru_utime.tv_usec); + rrddim_set_by_pointer( + st_cpu_thread, rd_system, thread.ru_stime.tv_sec * USEC_PER_SEC + thread.ru_stime.tv_usec); + rrdset_done(st_cpu_thread); + + // ---------------------------------------------------------------- + + if (unlikely(!st_duration)) { + st_duration = rrdset_find_active_bytype_localhost("netdata", "plugin_macos_modules"); + + if (!st_duration) { + st_duration = rrdset_create_localhost( + "netdata", + "plugin_macos_modules", + NULL, + "macos", + NULL, + "Netdata macOS plugin modules durations", + "milliseconds/run", + "macos", + "stats", + 132001, + localhost->rrd_update_every, + RRDSET_TYPE_STACKED); + + for (int i = 0; macos_modules[i].name; i++) { + struct macos_module *pm = &macos_modules[i]; + if (unlikely(!pm->enabled)) + continue; + + pm->rd = rrddim_add(st_duration, pm->dim, NULL, 1, 1000, RRD_ALGORITHM_ABSOLUTE); + } + } + } else + rrdset_next(st_duration); + + for (int i = 0; macos_modules[i].name; i++) { + struct macos_module *pm = &macos_modules[i]; + if (unlikely(!pm->enabled)) + continue; + + rrddim_set_by_pointer(st_duration, pm->rd, pm->duration); + } + rrdset_done(st_duration); } } diff --git a/collectors/node.d.plugin/named/named.node.js b/collectors/node.d.plugin/named/named.node.js index d13c608cb..04cded8bd 100644 --- a/collectors/node.d.plugin/named/named.node.js +++ b/collectors/node.d.plugin/named/named.node.js @@ -322,7 +322,7 @@ var named = { service.module.chartFromMembers(service, global_requests, 'received_requests', 'Bind, Global Received Requests by IP version', 'requests/s', 'requests', 'named.requests', netdata.chartTypes.stacked, named.base_priority + 1, netdata.chartAlgorithms.incremental, 1, 1); if(global_queries_success_enable === true) - service.module.chartFromMembers(service, global_queries_success, 'global_queries_success', 'Bind, Global Successful Queries', 'queries/s', 'queries', 'named.queries_succcess', netdata.chartTypes.line, named.base_priority + 2, netdata.chartAlgorithms.incremental, 1, 1); + service.module.chartFromMembers(service, global_queries_success, 'global_queries_success', 'Bind, Global Successful Queries', 'queries/s', 'queries', 'named.queries_success', netdata.chartTypes.line, named.base_priority + 2, netdata.chartAlgorithms.incremental, 1, 1); if(protocol_queries_enable === true) service.module.chartFromMembers(service, protocol_queries, 'protocols_queries', 'Bind, Global Queries by IP Protocol', 'queries/s', 'queries', 'named.protocol_queries', netdata.chartTypes.stacked, named.base_priority + 3, netdata.chartAlgorithms.incremental, 1, 1); @@ -597,7 +597,7 @@ var named = { }, // module.update() - // this is called repeatidly to collect data, by calling + // this is called repeatedly to collect data, by calling // netdata.serviceExecute() update: function(service, callback) { service.execute(function(serv, data) { diff --git a/collectors/node.d.plugin/sma_webbox/sma_webbox.node.js b/collectors/node.d.plugin/sma_webbox/sma_webbox.node.js index aa60ae816..f32b65714 100644 --- a/collectors/node.d.plugin/sma_webbox/sma_webbox.node.js +++ b/collectors/node.d.plugin/sma_webbox/sma_webbox.node.js @@ -226,7 +226,7 @@ var webbox = { }, // module.update() - // this is called repeatidly to collect data, by calling + // this is called repeatedly to collect data, by calling // netdata.serviceExecute() update: function(service, callback) { service.execute(function(serv, data) { diff --git a/collectors/node.d.plugin/snmp/snmp.node.js b/collectors/node.d.plugin/snmp/snmp.node.js index ca3f0bfbc..9e874586e 100644 --- a/collectors/node.d.plugin/snmp/snmp.node.js +++ b/collectors/node.d.plugin/snmp/snmp.node.js @@ -514,7 +514,7 @@ var snmp = { }, // module.update() - // this is called repeatidly to collect data, by calling + // this is called repeatedly to collect data, by calling // service.execute() update: function (service, callback) { service.execute(function (serv, data) { diff --git a/collectors/perf.plugin/perf_plugin.c b/collectors/perf.plugin/perf_plugin.c index 9fe3c5e07..135e77984 100644 --- a/collectors/perf.plugin/perf_plugin.c +++ b/collectors/perf.plugin/perf_plugin.c @@ -9,7 +9,7 @@ // Hardware counters #define NETDATA_CHART_PRIO_PERF_CPU_CYCLES 8800 #define NETDATA_CHART_PRIO_PERF_INSTRUCTIONS 8801 -#define NETDATA_CHART_PRIO_PERF_BRANCH_INSTRUSTIONS 8802 +#define NETDATA_CHART_PRIO_PERF_BRANCH_INSTRUCTIONS 8802 #define NETDATA_CHART_PRIO_PERF_CACHE 8803 #define NETDATA_CHART_PRIO_PERF_BUS_CYCLES 8804 #define NETDATA_CHART_PRIO_PERF_FRONT_BACK_CYCLES 8805 @@ -443,7 +443,7 @@ static void perf_send_metrics() { // Software counters migrations_chart_generated = 0, - alighnment_chart_generated = 0, + alignment_chart_generated = 0, emulation_chart_generated = 0, // Hardware cache counters @@ -535,7 +535,7 @@ static void perf_send_metrics() { , RRD_TYPE_PERF , "branch_instructions" , RRD_FAMILY_HW - , NETDATA_CHART_PRIO_PERF_BRANCH_INSTRUSTIONS + , NETDATA_CHART_PRIO_PERF_BRANCH_INSTRUCTIONS , update_every , PLUGIN_PERF_NAME ); @@ -708,12 +708,12 @@ static void perf_send_metrics() { // ------------------------------------------------------------------------ if(likely(perf_events[EV_ID_ALIGNMENT_FAULTS].updated)) { - if(unlikely(!alighnment_chart_generated)) { - alighnment_chart_generated = 1; + if(unlikely(!alignment_chart_generated)) { + alignment_chart_generated = 1; - printf("CHART %s.%s '' 'Alighnment faults' 'faults' %s '' line %d %d %s\n" + printf("CHART %s.%s '' 'Alignment faults' 'faults' %s '' line %d %d %s\n" , RRD_TYPE_PERF - , "alighnment_faults" + , "alignment_faults" , RRD_FAMILY_SW , NETDATA_CHART_PRIO_PERF_ALIGNMENT , update_every @@ -725,7 +725,7 @@ static void perf_send_metrics() { printf( "BEGIN %s.%s\n" , RRD_TYPE_PERF - , "alighnment_faults" + , "alignment_faults" ); printf( "SET %s = %lld\n" @@ -1140,7 +1140,7 @@ void parse_command_line(int argc, char **argv) { plugin_enabled = 1; continue; } - else if(strcmp("alighnment", argv[i]) == 0) { + else if(strcmp("alignment", argv[i]) == 0) { perf_events[EV_ID_ALIGNMENT_FAULTS].disabled = 0; plugin_enabled = 1; continue; @@ -1231,7 +1231,7 @@ void parse_command_line(int argc, char **argv) { "\n" " migrations enable CPU migrations chart\n" "\n" - " alighnment enable Alignment faults chart\n" + " alignment enable Alignment faults chart\n" "\n" " emulation enable Emulation faults chart\n" "\n" diff --git a/collectors/plugins.d/pluginsd_parser.c b/collectors/plugins.d/pluginsd_parser.c index 4a97c5535..2d0788d80 100644 --- a/collectors/plugins.d/pluginsd_parser.c +++ b/collectors/plugins.d/pluginsd_parser.c @@ -565,7 +565,7 @@ PARSER_RC pluginsd_overwrite(char **words, void *user, PLUGINSD_ACTION *plugins UNUSED(words); RRDHOST *host = ((PARSER_USER_OBJECT *) user)->host; - debug(D_PLUGINSD, "requested a OVERWITE a variable"); + debug(D_PLUGINSD, "requested a OVERWRITE a variable"); struct label *new_labels = ((PARSER_USER_OBJECT *)user)->new_labels; ((PARSER_USER_OBJECT *)user)->new_labels = NULL; diff --git a/collectors/proc.plugin/README.md b/collectors/proc.plugin/README.md index 085afb4fb..7fff1ec0a 100644 --- a/collectors/proc.plugin/README.md +++ b/collectors/proc.plugin/README.md @@ -26,6 +26,8 @@ custom_edit_url: https://github.com/netdata/netdata/edit/master/collectors/proc. - `/proc/loadavg` (system load and total processes running) - `/proc/pressure/{cpu,memory,io}` (pressure stall information) - `/proc/sys/kernel/random/entropy_avail` (random numbers pool availability - used in cryptography) +- `/proc/spl/kstat/zfs/arcstats` (status of ZFS adaptive replacement cache) +- `/proc/spl/kstat/zfs/pool/state` (state of ZFS pools) - `/sys/class/power_supply` (power supply properties) - `/sys/class/infiniband` (infiniband interconnect) - `ipc` (IPC semaphores and message queues) @@ -46,8 +48,11 @@ Hopefully, the Linux kernel provides many metrics that can provide deep insights - **I/O bandwidth/s (kb/s)** The amount of data transferred from and to the disk. +- **Amount of discarded data (kb/s)** - **I/O operations/s** The number of I/O operations completed. +- **Extended I/O operations/s** + The number of extended I/O operations completed. - **Queued I/O operations** The number of currently queued I/O operations. For traditional disks that execute commands one after another, one of them is being run by the disk and the rest are just waiting in a queue. - **Backlog size (time in ms)** @@ -57,12 +62,19 @@ Hopefully, the Linux kernel provides many metrics that can provide deep insights Of course, for newer disk technologies (like fusion cards) that are capable to execute multiple commands in parallel, this metric is just meaningless. - **Average I/O operation time (ms)** The average time for I/O requests issued to the device to be served. This includes the time spent by the requests in queue and the time spent servicing them. +- **Average I/O operation time for extended operations (ms)** + The average time for extended I/O requests issued to the device to be served. This includes the time spent by the requests in queue and the time spent servicing them. - **Average I/O operation size (kb)** The average amount of data of the completed I/O operations. +- **Average amount of discarded data (kb)** + The average amount of data of the completed discard operations. - **Average Service Time (ms)** The average service time for completed I/O operations. This metric is calculated using the total busy time of the disk and the number of completed operations. If the disk is able to execute multiple parallel operations the reporting average service time will be misleading. +- **Average Service Time for extended I/O operations (ms)** + The average service time for completed extended I/O operations. - **Merged I/O operations/s** The Linux kernel is capable of merging I/O operations. So, if two requests to read data from the disk are adjacent, the Linux kernel may merge them to one before giving them to disk. This metric measures the number of operations that have been merged by the Linux kernel. +- **Merged discard operations/s** - **Total I/O time** The sum of the duration of all completed I/O operations. This number can exceed the interval if the disk is able to execute multiple I/O operations in parallel. - **Space usage** @@ -116,6 +128,7 @@ Then edit `netdata.conf` and find the following section. This is the basic plugi # i/o time for all disks = auto # queued operations for all disks = auto # utilization percentage for all disks = auto + # extended operations for all disks = auto # backlog for all disks = auto # bcache for all disks = auto # bcache priority stats update every = 0 @@ -147,6 +160,7 @@ For each virtual disk, physical disk and partition you will have a section like # i/o time = auto # queued operations = auto # utilization percentage = auto + # extended operations = auto # backlog = auto ``` @@ -291,6 +305,28 @@ each state. `schedstat filename to monitor`, `cpuidle name filename to monitor`, and `cpuidle time filename to monitor` in the `[plugin:proc:/proc/stat]` configuration section +## Monitoring memory + +### Monitored memory metrics + +- Amount of memory swapped in/out +- Amount of memory paged from/to disk +- Number of memory page faults +- Number of out of memory kills +- Number of NUMA events + +### Configuration + +```conf +[plugin:proc:/proc/vmstat] + filename to monitor = /proc/vmstat + swap i/o = auto + disk i/o = yes + memory page faults = yes + out of memory kills = yes + system-wide numa metric summary = auto +``` + ## Monitoring Network Interfaces ### Monitored network interface metrics diff --git a/collectors/proc.plugin/ipc.c b/collectors/proc.plugin/ipc.c index 048fe74a7..b5c9ae5e1 100644 --- a/collectors/proc.plugin/ipc.c +++ b/collectors/proc.plugin/ipc.c @@ -209,7 +209,7 @@ int ipc_msq_get_info(char *msg_filename, struct message_queue **message_queue_ro continue; } - // find the id in the linked list or create a new stucture + // find the id in the linked list or create a new structure int found = 0; unsigned long long id = str2ull(procfile_lineword(ff, l, 1)); diff --git a/collectors/proc.plugin/plugin_proc.c b/collectors/proc.plugin/plugin_proc.c index 19230c09d..190811e24 100644 --- a/collectors/proc.plugin/plugin_proc.c +++ b/collectors/proc.plugin/plugin_proc.c @@ -15,70 +15,76 @@ static struct proc_module { } proc_modules[] = { - // system metrics - { .name = "/proc/stat", .dim = "stat", .func = do_proc_stat }, - { .name = "/proc/uptime", .dim = "uptime", .func = do_proc_uptime }, - { .name = "/proc/loadavg", .dim = "loadavg", .func = do_proc_loadavg }, - { .name = "/proc/sys/kernel/random/entropy_avail", .dim = "entropy", .func = do_proc_sys_kernel_random_entropy_avail }, - - // pressure metrics - { .name = "/proc/pressure", .dim = "pressure", .func = do_proc_pressure }, - - // CPU metrics - { .name = "/proc/interrupts", .dim = "interrupts", .func = do_proc_interrupts }, - { .name = "/proc/softirqs", .dim = "softirqs", .func = do_proc_softirqs }, - - // memory metrics - { .name = "/proc/vmstat", .dim = "vmstat", .func = do_proc_vmstat }, - { .name = "/proc/meminfo", .dim = "meminfo", .func = do_proc_meminfo }, - { .name = "/sys/kernel/mm/ksm", .dim = "ksm", .func = do_sys_kernel_mm_ksm }, - { .name = "/sys/block/zram", .dim = "zram", .func = do_sys_block_zram }, - { .name = "/sys/devices/system/edac/mc", .dim = "ecc", .func = do_proc_sys_devices_system_edac_mc }, - { .name = "/sys/devices/system/node", .dim = "numa", .func = do_proc_sys_devices_system_node }, - { .name = "/proc/pagetypeinfo", .dim = "pagetypeinfo", .func = do_proc_pagetypeinfo }, - - // network metrics - { .name = "/proc/net/dev", .dim = "netdev", .func = do_proc_net_dev }, - { .name = "/proc/net/wireless", .dim = "netwireless", .func = do_proc_net_wireless }, - { .name = "/proc/net/sockstat", .dim = "sockstat", .func = do_proc_net_sockstat }, - { .name = "/proc/net/sockstat6", .dim = "sockstat6", .func = do_proc_net_sockstat6 }, - { .name = "/proc/net/netstat", .dim = "netstat", .func = do_proc_net_netstat }, // this has to be before /proc/net/snmp, because there is a shared metric - { .name = "/proc/net/snmp", .dim = "snmp", .func = do_proc_net_snmp }, - { .name = "/proc/net/snmp6", .dim = "snmp6", .func = do_proc_net_snmp6 }, - { .name = "/proc/net/sctp/snmp", .dim = "sctp", .func = do_proc_net_sctp_snmp }, - { .name = "/proc/net/softnet_stat", .dim = "softnet", .func = do_proc_net_softnet_stat }, - { .name = "/proc/net/ip_vs/stats", .dim = "ipvs", .func = do_proc_net_ip_vs_stats }, - { .name = "/sys/class/infiniband", .dim = "infiniband", .func = do_sys_class_infiniband }, - - // firewall metrics - { .name = "/proc/net/stat/conntrack", .dim = "conntrack", .func = do_proc_net_stat_conntrack }, - { .name = "/proc/net/stat/synproxy", .dim = "synproxy", .func = do_proc_net_stat_synproxy }, - - // disk metrics - { .name = "/proc/diskstats", .dim = "diskstats", .func = do_proc_diskstats }, - { .name = "/proc/mdstat", .dim = "mdstat", .func = do_proc_mdstat }, - - // NFS metrics - { .name = "/proc/net/rpc/nfsd", .dim = "nfsd", .func = do_proc_net_rpc_nfsd }, - { .name = "/proc/net/rpc/nfs", .dim = "nfs", .func = do_proc_net_rpc_nfs }, - - // ZFS metrics - { .name = "/proc/spl/kstat/zfs/arcstats", .dim = "zfs_arcstats", .func = do_proc_spl_kstat_zfs_arcstats }, - - // BTRFS metrics - { .name = "/sys/fs/btrfs", .dim = "btrfs", .func = do_sys_fs_btrfs }, - - // IPC metrics - { .name = "ipc", .dim = "ipc", .func = do_ipc }, - - // linux power supply metrics - { .name = "/sys/class/power_supply", .dim = "power_supply", .func = do_sys_class_power_supply }, - - // the terminator of this array - { .name = NULL, .dim = NULL, .func = NULL } + // system metrics + {.name = "/proc/stat", .dim = "stat", .func = do_proc_stat}, + {.name = "/proc/uptime", .dim = "uptime", .func = do_proc_uptime}, + {.name = "/proc/loadavg", .dim = "loadavg", .func = do_proc_loadavg}, + {.name = "/proc/sys/kernel/random/entropy_avail", .dim = "entropy", .func = do_proc_sys_kernel_random_entropy_avail}, + + // pressure metrics + {.name = "/proc/pressure", .dim = "pressure", .func = do_proc_pressure}, + + // CPU metrics + {.name = "/proc/interrupts", .dim = "interrupts", .func = do_proc_interrupts}, + {.name = "/proc/softirqs", .dim = "softirqs", .func = do_proc_softirqs}, + + // memory metrics + {.name = "/proc/vmstat", .dim = "vmstat", .func = do_proc_vmstat}, + {.name = "/proc/meminfo", .dim = "meminfo", .func = do_proc_meminfo}, + {.name = "/sys/kernel/mm/ksm", .dim = "ksm", .func = do_sys_kernel_mm_ksm}, + {.name = "/sys/block/zram", .dim = "zram", .func = do_sys_block_zram}, + {.name = "/sys/devices/system/edac/mc", .dim = "ecc", .func = do_proc_sys_devices_system_edac_mc}, + {.name = "/sys/devices/system/node", .dim = "numa", .func = do_proc_sys_devices_system_node}, + {.name = "/proc/pagetypeinfo", .dim = "pagetypeinfo", .func = do_proc_pagetypeinfo}, + + // network metrics + {.name = "/proc/net/dev", .dim = "netdev", .func = do_proc_net_dev}, + {.name = "/proc/net/wireless", .dim = "netwireless", .func = do_proc_net_wireless}, + {.name = "/proc/net/sockstat", .dim = "sockstat", .func = do_proc_net_sockstat}, + {.name = "/proc/net/sockstat6", .dim = "sockstat6", .func = do_proc_net_sockstat6}, + {.name = "/proc/net/netstat", + .dim = "netstat", + .func = do_proc_net_netstat}, // this has to be before /proc/net/snmp, because there is a shared metric + {.name = "/proc/net/snmp", .dim = "snmp", .func = do_proc_net_snmp}, + {.name = "/proc/net/snmp6", .dim = "snmp6", .func = do_proc_net_snmp6}, + {.name = "/proc/net/sctp/snmp", .dim = "sctp", .func = do_proc_net_sctp_snmp}, + {.name = "/proc/net/softnet_stat", .dim = "softnet", .func = do_proc_net_softnet_stat}, + {.name = "/proc/net/ip_vs/stats", .dim = "ipvs", .func = do_proc_net_ip_vs_stats}, + {.name = "/sys/class/infiniband", .dim = "infiniband", .func = do_sys_class_infiniband}, + + // firewall metrics + {.name = "/proc/net/stat/conntrack", .dim = "conntrack", .func = do_proc_net_stat_conntrack}, + {.name = "/proc/net/stat/synproxy", .dim = "synproxy", .func = do_proc_net_stat_synproxy}, + + // disk metrics + {.name = "/proc/diskstats", .dim = "diskstats", .func = do_proc_diskstats}, + {.name = "/proc/mdstat", .dim = "mdstat", .func = do_proc_mdstat}, + + // NFS metrics + {.name = "/proc/net/rpc/nfsd", .dim = "nfsd", .func = do_proc_net_rpc_nfsd}, + {.name = "/proc/net/rpc/nfs", .dim = "nfs", .func = do_proc_net_rpc_nfs}, + + // ZFS metrics + {.name = "/proc/spl/kstat/zfs/arcstats", .dim = "zfs_arcstats", .func = do_proc_spl_kstat_zfs_arcstats}, + {.name = "/proc/spl/kstat/zfs/pool/state", + .dim = "zfs_pool_state", + .func = do_proc_spl_kstat_zfs_pool_state}, + + // BTRFS metrics + {.name = "/sys/fs/btrfs", .dim = "btrfs", .func = do_sys_fs_btrfs}, + + // IPC metrics + {.name = "ipc", .dim = "ipc", .func = do_ipc}, + + {.name = "/sys/class/power_supply", .dim = "power_supply", .func = do_sys_class_power_supply}, + // linux power supply metrics + + // the terminator of this array + {.name = NULL, .dim = NULL, .func = NULL} }; -static void proc_main_cleanup(void *ptr) { +static void proc_main_cleanup(void *ptr) +{ struct netdata_static_thread *static_thread = (struct netdata_static_thread *)ptr; static_thread->enabled = NETDATA_MAIN_THREAD_EXITING; @@ -87,7 +93,8 @@ static void proc_main_cleanup(void *ptr) { static_thread->enabled = NETDATA_MAIN_THREAD_EXITED; } -void *proc_main(void *ptr) { +void *proc_main(void *ptr) +{ netdata_thread_cleanup_push(proc_main_cleanup, ptr); int vdo_cpu_netdata = config_get_boolean("plugin:proc", "netdata server resources", CONFIG_BOOLEAN_YES); @@ -96,7 +103,7 @@ void *proc_main(void *ptr) { // check the enabled status for each module int i; - for(i = 0 ; proc_modules[i].name ;i++) { + for (i = 0; proc_modules[i].name; i++) { struct proc_module *pm = &proc_modules[i]; pm->enabled = config_get_boolean("plugin:proc", pm->name, CONFIG_BOOLEAN_YES); @@ -109,20 +116,22 @@ void *proc_main(void *ptr) { heartbeat_init(&hb); size_t iterations = 0; - while(!netdata_exit) { + while (!netdata_exit) { iterations++; (void)iterations; usec_t hb_dt = heartbeat_next(&hb, step); usec_t duration = 0ULL; - if(unlikely(netdata_exit)) break; + if (unlikely(netdata_exit)) + break; // BEGIN -- the job to be done - for(i = 0 ; proc_modules[i].name ;i++) { + for (i = 0; proc_modules[i].name; i++) { struct proc_module *pm = &proc_modules[i]; - if(unlikely(!pm->enabled)) continue; + if (unlikely(!pm->enabled)) + continue; debug(D_PROCNETDEV_LOOP, "PROC calling %s.", pm->name); @@ -139,55 +148,87 @@ void *proc_main(void *ptr) { // log_thread_memory_allocations = 0; //#endif - if(unlikely(netdata_exit)) break; + if (unlikely(netdata_exit)) + break; } // END -- the job is done - // -------------------------------------------------------------------- - - if(vdo_cpu_netdata) { - static RRDSET *st = NULL; - - if(unlikely(!st)) { - st = rrdset_find_active_bytype_localhost("netdata", "plugin_proc_modules"); - - if(!st) { - st = rrdset_create_localhost( - "netdata" - , "plugin_proc_modules" - , NULL - , "proc" - , NULL - , "NetData Proc Plugin Modules Durations" - , "milliseconds/run" - , "netdata" - , "stats" - , 132001 - , localhost->rrd_update_every - , RRDSET_TYPE_STACKED - ); - - for(i = 0 ; proc_modules[i].name ;i++) { + if (vdo_cpu_netdata) { + static RRDSET *st_cpu_thread = NULL, *st_duration = NULL; + static RRDDIM *rd_user = NULL, *rd_system = NULL; + + // ---------------------------------------------------------------- + + struct rusage thread; + getrusage(RUSAGE_THREAD, &thread); + + if (unlikely(!st_cpu_thread)) { + st_cpu_thread = rrdset_create_localhost( + "netdata", + "plugin_proc_cpu", + NULL, + "proc", + NULL, + "Netdata proc plugin CPU usage", + "milliseconds/s", + "proc", + "stats", + 132000, + localhost->rrd_update_every, + RRDSET_TYPE_STACKED); + + rd_user = rrddim_add(st_cpu_thread, "user", NULL, 1, USEC_PER_MS, RRD_ALGORITHM_INCREMENTAL); + rd_system = rrddim_add(st_cpu_thread, "system", NULL, 1, USEC_PER_MS, RRD_ALGORITHM_INCREMENTAL); + } else { + rrdset_next(st_cpu_thread); + } + + rrddim_set_by_pointer( + st_cpu_thread, rd_user, thread.ru_utime.tv_sec * USEC_PER_SEC + thread.ru_utime.tv_usec); + rrddim_set_by_pointer( + st_cpu_thread, rd_system, thread.ru_stime.tv_sec * USEC_PER_SEC + thread.ru_stime.tv_usec); + rrdset_done(st_cpu_thread); + + // ---------------------------------------------------------------- + + if (unlikely(!st_duration)) { + st_duration = rrdset_find_active_bytype_localhost("netdata", "plugin_proc_modules"); + + if (!st_duration) { + st_duration = rrdset_create_localhost( + "netdata", + "plugin_proc_modules", + NULL, + "proc", + NULL, + "Netdata proc plugin modules durations", + "milliseconds/run", + "proc", + "stats", + 132001, + localhost->rrd_update_every, + RRDSET_TYPE_STACKED); + + for (i = 0; proc_modules[i].name; i++) { struct proc_module *pm = &proc_modules[i]; - if(unlikely(!pm->enabled)) continue; + if (unlikely(!pm->enabled)) + continue; - pm->rd = rrddim_add(st, pm->dim, NULL, 1, 1000, RRD_ALGORITHM_ABSOLUTE); + pm->rd = rrddim_add(st_duration, pm->dim, NULL, 1, USEC_PER_MS, RRD_ALGORITHM_ABSOLUTE); } } - } - else rrdset_next(st); + } else + rrdset_next(st_duration); - for(i = 0 ; proc_modules[i].name ;i++) { + for (i = 0; proc_modules[i].name; i++) { struct proc_module *pm = &proc_modules[i]; - if(unlikely(!pm->enabled)) continue; + if (unlikely(!pm->enabled)) + continue; - rrddim_set_by_pointer(st, pm->rd, pm->duration); + rrddim_set_by_pointer(st_duration, pm->rd, pm->duration); } - rrdset_done(st); - - global_statistics_charts(); - registry_statistics(); + rrdset_done(st_duration); } } @@ -209,16 +250,16 @@ int get_numa_node_count(void) char *dirname = config_get("plugin:proc:/sys/devices/system/node", "directory to monitor", name); DIR *dir = opendir(dirname); - if(dir) { + if (dir) { struct dirent *de = NULL; - while((de = readdir(dir))) { - if(de->d_type != DT_DIR) + while ((de = readdir(dir))) { + if (de->d_type != DT_DIR) continue; - if(strncmp(de->d_name, "node", 4) != 0) + if (strncmp(de->d_name, "node", 4) != 0) continue; - if(!isdigit(de->d_name[4])) + if (!isdigit(de->d_name[4])) continue; numa_node_count++; diff --git a/collectors/proc.plugin/plugin_proc.h b/collectors/proc.plugin/plugin_proc.h index 108c026ab..b0d60cd86 100644 --- a/collectors/proc.plugin/plugin_proc.h +++ b/collectors/proc.plugin/plugin_proc.h @@ -51,6 +51,7 @@ extern int do_proc_uptime(int update_every, usec_t dt); extern int do_proc_sys_devices_system_edac_mc(int update_every, usec_t dt); extern int do_proc_sys_devices_system_node(int update_every, usec_t dt); extern int do_proc_spl_kstat_zfs_arcstats(int update_every, usec_t dt); +extern int do_proc_spl_kstat_zfs_pool_state(int update_every, usec_t dt); extern int do_sys_fs_btrfs(int update_every, usec_t dt); extern int do_proc_net_sockstat(int update_every, usec_t dt); extern int do_proc_net_sockstat6(int update_every, usec_t dt); diff --git a/collectors/proc.plugin/proc_diskstats.c b/collectors/proc.plugin/proc_diskstats.c index b5d02f329..cfaf2134a 100644 --- a/collectors/proc.plugin/proc_diskstats.c +++ b/collectors/proc.plugin/proc_diskstats.c @@ -32,6 +32,7 @@ static struct disk { int do_iotime; int do_qops; int do_util; + int do_ext; int do_backlog; int do_bcache; @@ -64,10 +65,17 @@ static struct disk { RRDDIM *rd_io_reads; RRDDIM *rd_io_writes; + RRDSET *st_ext_io; + RRDDIM *rd_io_discards; + RRDSET *st_ops; RRDDIM *rd_ops_reads; RRDDIM *rd_ops_writes; + RRDSET *st_ext_ops; + RRDDIM *rd_ops_discards; + RRDDIM *rd_ops_flushes; + RRDSET *st_qops; RRDDIM *rd_qops_operations; @@ -84,18 +92,32 @@ static struct disk { RRDDIM *rd_mops_reads; RRDDIM *rd_mops_writes; + RRDSET *st_ext_mops; + RRDDIM *rd_mops_discards; + RRDSET *st_iotime; RRDDIM *rd_iotime_reads; RRDDIM *rd_iotime_writes; + RRDSET *st_ext_iotime; + RRDDIM *rd_iotime_discards; + RRDDIM *rd_iotime_flushes; + RRDSET *st_await; RRDDIM *rd_await_reads; RRDDIM *rd_await_writes; + RRDSET *st_ext_await; + RRDDIM *rd_await_discards; + RRDDIM *rd_await_flushes; + RRDSET *st_avgsz; RRDDIM *rd_avgsz_reads; RRDDIM *rd_avgsz_writes; + RRDSET *st_ext_avgsz; + RRDDIM *rd_avgsz_discards; + RRDSET *st_svctm; RRDDIM *rd_svctm_svctm; @@ -164,6 +186,7 @@ static int global_enable_new_disks_detected_at_runtime = CONFIG_BOOLEAN_YES, global_do_iotime = CONFIG_BOOLEAN_AUTO, global_do_qops = CONFIG_BOOLEAN_AUTO, global_do_util = CONFIG_BOOLEAN_AUTO, + global_do_ext = CONFIG_BOOLEAN_AUTO, global_do_backlog = CONFIG_BOOLEAN_AUTO, global_do_bcache = CONFIG_BOOLEAN_AUTO, globals_initialized = 0, @@ -463,6 +486,7 @@ static void get_disk_config(struct disk *d) { d->do_iotime = CONFIG_BOOLEAN_NO; d->do_qops = CONFIG_BOOLEAN_NO; d->do_util = CONFIG_BOOLEAN_NO; + d->do_ext = CONFIG_BOOLEAN_NO; d->do_backlog = CONFIG_BOOLEAN_NO; d->do_bcache = CONFIG_BOOLEAN_NO; } @@ -513,6 +537,7 @@ static void get_disk_config(struct disk *d) { ddo_iotime = CONFIG_BOOLEAN_NO, ddo_qops = CONFIG_BOOLEAN_NO, ddo_util = CONFIG_BOOLEAN_NO, + ddo_ext = CONFIG_BOOLEAN_NO, ddo_backlog = CONFIG_BOOLEAN_NO, ddo_bcache = CONFIG_BOOLEAN_NO; @@ -524,6 +549,7 @@ static void get_disk_config(struct disk *d) { ddo_iotime = global_do_iotime, ddo_qops = global_do_qops, ddo_util = global_do_util, + ddo_ext = global_do_ext, ddo_backlog = global_do_backlog, ddo_bcache = global_do_bcache; } @@ -534,6 +560,7 @@ static void get_disk_config(struct disk *d) { d->do_iotime = config_get_boolean_ondemand(var_name, "i/o time", ddo_iotime); d->do_qops = config_get_boolean_ondemand(var_name, "queued operations", ddo_qops); d->do_util = config_get_boolean_ondemand(var_name, "utilization percentage", ddo_util); + d->do_ext = config_get_boolean_ondemand(var_name, "extended operations", ddo_ext); d->do_backlog = config_get_boolean_ondemand(var_name, "backlog", ddo_backlog); if(d->device_is_bcache) @@ -820,6 +847,7 @@ int do_proc_diskstats(int update_every, usec_t dt) { global_do_iotime = config_get_boolean_ondemand(CONFIG_SECTION_PLUGIN_PROC_DISKSTATS, "i/o time for all disks", global_do_iotime); global_do_qops = config_get_boolean_ondemand(CONFIG_SECTION_PLUGIN_PROC_DISKSTATS, "queued operations for all disks", global_do_qops); global_do_util = config_get_boolean_ondemand(CONFIG_SECTION_PLUGIN_PROC_DISKSTATS, "utilization percentage for all disks", global_do_util); + global_do_ext = config_get_boolean_ondemand(CONFIG_SECTION_PLUGIN_PROC_DISKSTATS, "extended operations for all disks", global_do_ext); global_do_backlog = config_get_boolean_ondemand(CONFIG_SECTION_PLUGIN_PROC_DISKSTATS, "backlog for all disks", global_do_backlog); global_do_bcache = config_get_boolean_ondemand(CONFIG_SECTION_PLUGIN_PROC_DISKSTATS, "bcache for all disks", global_do_bcache); global_bcache_priority_stats_update_every = (int)config_get_number(CONFIG_SECTION_PLUGIN_PROC_DISKSTATS, "bcache priority stats update every", global_bcache_priority_stats_update_every); @@ -889,6 +917,8 @@ int do_proc_diskstats(int update_every, usec_t dt) { collected_number system_read_kb = 0, system_write_kb = 0; + int do_dc_stats = 0, do_fl_stats = 0; + for(l = 0; l < lines ;l++) { // -------------------------------------------------------------------------- // Read parameters @@ -898,11 +928,16 @@ int do_proc_diskstats(int update_every, usec_t dt) { collected_number reads = 0, mreads = 0, readsectors = 0, readms = 0, writes = 0, mwrites = 0, writesectors = 0, writems = 0, - queued_ios = 0, busy_ms = 0, backlog_ms = 0; + queued_ios = 0, busy_ms = 0, backlog_ms = 0, + discards = 0, mdiscards = 0, discardsectors = 0, discardms = 0, + flushes = 0, flushms = 0; + collected_number last_reads = 0, last_readsectors = 0, last_readms = 0, last_writes = 0, last_writesectors = 0, last_writems = 0, - last_busy_ms = 0; + last_busy_ms = 0, + last_discards = 0, last_discardsectors = 0, last_discardms = 0, + last_flushes = 0, last_flushms = 0; size_t words = procfile_linewords(ff, l); if(unlikely(words < 14)) continue; @@ -951,6 +986,40 @@ int do_proc_diskstats(int update_every, usec_t dt) { // I/O completion time and the backlog that may be accumulating. backlog_ms = str2ull(procfile_lineword(ff, l, 13)); // rq_ticks + if (unlikely(words > 13)) { + do_dc_stats = 1; + + // # of discards completed + // This is the total number of discards completed successfully. + discards = str2ull(procfile_lineword(ff, l, 14)); // dc_ios + + // # of discards merged + // See the description of mreads/mwrites + mdiscards = str2ull(procfile_lineword(ff, l, 15)); // dc_merges + + // # of sectors discarded + // This is the total number of sectors discarded successfully. + discardsectors = str2ull(procfile_lineword(ff, l, 16)); // dc_sec + + // # of milliseconds spent discarding + // This is the total number of milliseconds spent by all discards (as + // measured from __make_request() to end_that_request_last()). + discardms = str2ull(procfile_lineword(ff, l, 17)); // dc_ticks + } + + if (unlikely(words > 17)) { + do_fl_stats = 1; + + // number of flush I/Os processed + // These values increment when an flush I/O request completes. + // Block layer combines flush requests and executes at most one at a time. + // This counts flush requests executed by disk. Not tracked for partitions. + flushes = str2ull(procfile_lineword(ff, l, 18)); // fl_ios + + // total wait time for flush requests + flushms = str2ull(procfile_lineword(ff, l, 19)); // fl_ticks + } + // -------------------------------------------------------------------------- // get a disk structure for the disk @@ -976,7 +1045,7 @@ int do_proc_diskstats(int update_every, usec_t dt) { // Do performance metrics if(d->do_io == CONFIG_BOOLEAN_YES || (d->do_io == CONFIG_BOOLEAN_AUTO && - (readsectors || writesectors || + (readsectors || writesectors || discardsectors || netdata_zero_metrics_enabled == CONFIG_BOOLEAN_YES))) { d->do_io = CONFIG_BOOLEAN_YES; @@ -1008,8 +1077,37 @@ int do_proc_diskstats(int update_every, usec_t dt) { // -------------------------------------------------------------------- + if (do_dc_stats && d->do_io == CONFIG_BOOLEAN_YES && d->do_ext != CONFIG_BOOLEAN_NO) { + if (unlikely(!d->st_ext_io)) { + d->st_ext_io = rrdset_create_localhost( + "disk_ext" + , d->device + , d->disk + , family + , "disk_ext.io" + , "Amount of Discarded Data" + , "KiB/s" + , PLUGIN_PROC_NAME + , PLUGIN_PROC_MODULE_DISKSTATS_NAME + , NETDATA_CHART_PRIO_DISK_IO + 1 + , update_every + , RRDSET_TYPE_AREA + ); + + d->rd_io_discards = + rrddim_add(d->st_ext_io, "discards", NULL, d->sector_size, 1024, RRD_ALGORITHM_INCREMENTAL); + } else + rrdset_next(d->st_ext_io); + + last_discardsectors = rrddim_set_by_pointer(d->st_ext_io, d->rd_io_discards, discardsectors); + rrdset_done(d->st_ext_io); + } + + // -------------------------------------------------------------------- + if(d->do_ops == CONFIG_BOOLEAN_YES || (d->do_ops == CONFIG_BOOLEAN_AUTO && - (reads || writes || netdata_zero_metrics_enabled == CONFIG_BOOLEAN_YES))) { + (reads || writes || discards || flushes || + netdata_zero_metrics_enabled == CONFIG_BOOLEAN_YES))) { d->do_ops = CONFIG_BOOLEAN_YES; if(unlikely(!d->st_ops)) { @@ -1042,6 +1140,39 @@ int do_proc_diskstats(int update_every, usec_t dt) { // -------------------------------------------------------------------- + if (do_dc_stats && d->do_ops == CONFIG_BOOLEAN_YES && d->do_ext != CONFIG_BOOLEAN_NO) { + if (unlikely(!d->st_ext_ops)) { + d->st_ext_ops = rrdset_create_localhost( + "disk_ext_ops" + , d->device + , d->disk + , family + , "disk_ext.ops" + , "Disk Completed Extended I/O Operations" + , "operations/s" + , PLUGIN_PROC_NAME + , PLUGIN_PROC_MODULE_DISKSTATS_NAME + , NETDATA_CHART_PRIO_DISK_OPS + 1 + , update_every + , RRDSET_TYPE_LINE + ); + + rrdset_flag_set(d->st_ext_ops, RRDSET_FLAG_DETAIL); + + d->rd_ops_discards = rrddim_add(d->st_ext_ops, "discards", NULL, 1, 1, RRD_ALGORITHM_INCREMENTAL); + if (do_fl_stats) + d->rd_ops_flushes = rrddim_add(d->st_ext_ops, "flushes", NULL, 1, 1, RRD_ALGORITHM_INCREMENTAL); + } else + rrdset_next(d->st_ext_ops); + + last_discards = rrddim_set_by_pointer(d->st_ext_ops, d->rd_ops_discards, discards); + if (do_fl_stats) + last_flushes = rrddim_set_by_pointer(d->st_ext_ops, d->rd_ops_flushes, flushes); + rrdset_done(d->st_ext_ops); + } + + // -------------------------------------------------------------------- + if(d->do_qops == CONFIG_BOOLEAN_YES || (d->do_qops == CONFIG_BOOLEAN_AUTO && (queued_ios || netdata_zero_metrics_enabled == CONFIG_BOOLEAN_YES))) { d->do_qops = CONFIG_BOOLEAN_YES; @@ -1171,7 +1302,8 @@ int do_proc_diskstats(int update_every, usec_t dt) { // -------------------------------------------------------------------- if(d->do_mops == CONFIG_BOOLEAN_YES || (d->do_mops == CONFIG_BOOLEAN_AUTO && - (mreads || mwrites || netdata_zero_metrics_enabled == CONFIG_BOOLEAN_YES))) { + (mreads || mwrites || mdiscards || + netdata_zero_metrics_enabled == CONFIG_BOOLEAN_YES))) { d->do_mops = CONFIG_BOOLEAN_YES; if(unlikely(!d->st_mops)) { @@ -1204,8 +1336,39 @@ int do_proc_diskstats(int update_every, usec_t dt) { // -------------------------------------------------------------------- + if(do_dc_stats && d->do_mops == CONFIG_BOOLEAN_YES && d->do_ext != CONFIG_BOOLEAN_NO) { + d->do_mops = CONFIG_BOOLEAN_YES; + + if(unlikely(!d->st_ext_mops)) { + d->st_ext_mops = rrdset_create_localhost( + "disk_ext_mops" + , d->device + , d->disk + , family + , "disk_ext.mops" + , "Disk Merged Discard Operations" + , "merged operations/s" + , PLUGIN_PROC_NAME + , PLUGIN_PROC_MODULE_DISKSTATS_NAME + , NETDATA_CHART_PRIO_DISK_MOPS + 1 + , update_every + , RRDSET_TYPE_LINE + ); + + rrdset_flag_set(d->st_ext_mops, RRDSET_FLAG_DETAIL); + + d->rd_mops_discards = rrddim_add(d->st_ext_mops, "discards", NULL, 1, 1, RRD_ALGORITHM_INCREMENTAL); + } else + rrdset_next(d->st_ext_mops); + + rrddim_set_by_pointer(d->st_ext_mops, d->rd_mops_discards, mdiscards); + rrdset_done(d->st_ext_mops); + } + + // -------------------------------------------------------------------- + if(d->do_iotime == CONFIG_BOOLEAN_YES || (d->do_iotime == CONFIG_BOOLEAN_AUTO && - (readms || writems || netdata_zero_metrics_enabled == CONFIG_BOOLEAN_YES))) { + (readms || writems || discardms || flushms || netdata_zero_metrics_enabled == CONFIG_BOOLEAN_YES))) { d->do_iotime = CONFIG_BOOLEAN_YES; if(unlikely(!d->st_iotime)) { @@ -1237,6 +1400,40 @@ int do_proc_diskstats(int update_every, usec_t dt) { } // -------------------------------------------------------------------- + + if(do_dc_stats && d->do_iotime == CONFIG_BOOLEAN_YES && d->do_ext != CONFIG_BOOLEAN_NO) { + if(unlikely(!d->st_ext_iotime)) { + d->st_ext_iotime = rrdset_create_localhost( + "disk_ext_iotime" + , d->device + , d->disk + , family + , "disk_ext.iotime" + , "Disk Total I/O Time for Extended Operations" + , "milliseconds/s" + , PLUGIN_PROC_NAME + , PLUGIN_PROC_MODULE_DISKSTATS_NAME + , NETDATA_CHART_PRIO_DISK_IOTIME + 1 + , update_every + , RRDSET_TYPE_LINE + ); + + rrdset_flag_set(d->st_ext_iotime, RRDSET_FLAG_DETAIL); + + d->rd_iotime_discards = rrddim_add(d->st_ext_iotime, "discards", NULL, 1, 1, RRD_ALGORITHM_INCREMENTAL); + if (do_fl_stats) + d->rd_iotime_flushes = + rrddim_add(d->st_ext_iotime, "flushes", NULL, 1, 1, RRD_ALGORITHM_INCREMENTAL); + } else + rrdset_next(d->st_ext_iotime); + + last_discardms = rrddim_set_by_pointer(d->st_ext_iotime, d->rd_iotime_discards, discardms); + if (do_fl_stats) + last_flushms = rrddim_set_by_pointer(d->st_ext_iotime, d->rd_iotime_flushes, flushms); + rrdset_done(d->st_ext_iotime); + } + + // -------------------------------------------------------------------- // calculate differential charts // only if this is not the first time we run @@ -1276,6 +1473,42 @@ int do_proc_diskstats(int update_every, usec_t dt) { rrdset_done(d->st_await); } + if (do_dc_stats && d->do_iotime == CONFIG_BOOLEAN_YES && d->do_ops == CONFIG_BOOLEAN_YES && d->do_ext != CONFIG_BOOLEAN_NO) { + if(unlikely(!d->st_ext_await)) { + d->st_ext_await = rrdset_create_localhost( + "disk_ext_await" + , d->device + , d->disk + , family + , "disk_ext.await" + , "Average Completed Extended I/O Operation Time" + , "milliseconds/operation" + , PLUGIN_PROC_NAME + , PLUGIN_PROC_MODULE_DISKSTATS_NAME + , NETDATA_CHART_PRIO_DISK_AWAIT + 1 + , update_every + , RRDSET_TYPE_LINE + ); + + rrdset_flag_set(d->st_ext_await, RRDSET_FLAG_DETAIL); + + d->rd_await_discards = rrddim_add(d->st_ext_await, "discards", NULL, 1, 1, RRD_ALGORITHM_ABSOLUTE); + if (do_fl_stats) + d->rd_await_flushes = + rrddim_add(d->st_ext_await, "flushes", NULL, 1, 1, RRD_ALGORITHM_ABSOLUTE); + } else + rrdset_next(d->st_ext_await); + + rrddim_set_by_pointer( + d->st_ext_await, d->rd_await_discards, + (discards - last_discards) ? (discardms - last_discardms) / (discards - last_discards) : 0); + if (do_fl_stats) + rrddim_set_by_pointer( + d->st_ext_await, d->rd_await_flushes, + (flushes - last_flushes) ? (flushms - last_flushms) / (flushes - last_flushes) : 0); + rrdset_done(d->st_ext_await); + } + if( (d->do_io == CONFIG_BOOLEAN_YES || (d->do_io == CONFIG_BOOLEAN_AUTO && (readsectors || writesectors || netdata_zero_metrics_enabled == CONFIG_BOOLEAN_YES))) && (d->do_ops == CONFIG_BOOLEAN_YES || (d->do_ops == CONFIG_BOOLEAN_AUTO && @@ -1309,6 +1542,37 @@ int do_proc_diskstats(int update_every, usec_t dt) { rrdset_done(d->st_avgsz); } + if(do_dc_stats && d->do_io == CONFIG_BOOLEAN_YES && d->do_ops == CONFIG_BOOLEAN_YES && d->do_ext != CONFIG_BOOLEAN_NO) { + if(unlikely(!d->st_ext_avgsz)) { + d->st_ext_avgsz = rrdset_create_localhost( + "disk_ext_avgsz" + , d->device + , d->disk + , family + , "disk_ext.avgsz" + , "Average Amount of Discarded Data" + , "KiB/operation" + , PLUGIN_PROC_NAME + , PLUGIN_PROC_MODULE_DISKSTATS_NAME + , NETDATA_CHART_PRIO_DISK_AVGSZ + , update_every + , RRDSET_TYPE_AREA + ); + + rrdset_flag_set(d->st_ext_avgsz, RRDSET_FLAG_DETAIL); + + d->rd_avgsz_discards = + rrddim_add(d->st_ext_avgsz, "discards", NULL, d->sector_size, 1024, RRD_ALGORITHM_ABSOLUTE); + } else + rrdset_next(d->st_ext_avgsz); + + rrddim_set_by_pointer( + d->st_ext_avgsz, d->rd_avgsz_discards, + (discards - last_discards) ? (discardsectors - last_discardsectors) / (discards - last_discards) : + 0); + rrdset_done(d->st_ext_avgsz); + } + if( (d->do_util == CONFIG_BOOLEAN_YES || (d->do_util == CONFIG_BOOLEAN_AUTO && (busy_ms || netdata_zero_metrics_enabled == CONFIG_BOOLEAN_YES))) && diff --git a/collectors/proc.plugin/proc_mdstat.c b/collectors/proc.plugin/proc_mdstat.c index e932453b4..46f0134e6 100644 --- a/collectors/proc.plugin/proc_mdstat.c +++ b/collectors/proc.plugin/proc_mdstat.c @@ -8,6 +8,7 @@ struct raid { int redundant; char *name; uint32_t hash; + char *level; RRDDIM *rd_health; unsigned long long failed_disks; @@ -149,6 +150,7 @@ int do_proc_mdstat(int update_every, usec_t dt) for (raid_idx = 0; raid_idx < raids_allocated; raid_idx++) { struct raid *raid = &raids[raid_idx]; freez(raid->name); + freez(raid->level); freez(raid->mismatch_cnt_filename); } if (raids_num) { @@ -168,7 +170,7 @@ int do_proc_mdstat(int update_every, usec_t dt) words = procfile_linewords(ff, l); - if (unlikely(words < 2)) + if (unlikely(words < 3)) continue; if (unlikely(procfile_lineword(ff, l, 1)[0] != 'a')) @@ -177,12 +179,15 @@ int do_proc_mdstat(int update_every, usec_t dt) if (unlikely(!raid->name)) { raid->name = strdupz(procfile_lineword(ff, l, 0)); raid->hash = simple_hash(raid->name); + raid->level = strdupz(procfile_lineword(ff, l, 2)); } else if (unlikely(strcmp(raid->name, procfile_lineword(ff, l, 0)))) { freez(raid->name); freez(raid->mismatch_cnt_filename); + freez(raid->level); memset(raid, 0, sizeof(struct raid)); raid->name = strdupz(procfile_lineword(ff, l, 0)); raid->hash = simple_hash(raid->name); + raid->level = strdupz(procfile_lineword(ff, l, 2)); } if (unlikely(!raid->name || !raid->name[0])) @@ -436,7 +441,7 @@ int do_proc_mdstat(int update_every, usec_t dt) snprintfz(id, 50, "%s_disks", raid->name); if (unlikely(!raid->st_disks && !(raid->st_disks = rrdset_find_active_byname_localhost(id)))) { - snprintfz(family, 50, "%s", raid->name); + snprintfz(family, 50, "%s (%s)", raid->name, raid->level); raid->st_disks = rrdset_create_localhost( "mdstat", @@ -473,7 +478,7 @@ int do_proc_mdstat(int update_every, usec_t dt) snprintfz(id, 50, "%s_mismatch", raid->name); if (unlikely(!raid->st_mismatch_cnt && !(raid->st_mismatch_cnt = rrdset_find_active_byname_localhost(id)))) { - snprintfz(family, 50, "%s", raid->name); + snprintfz(family, 50, "%s (%s)", raid->name, raid->level); raid->st_mismatch_cnt = rrdset_create_localhost( "mdstat", @@ -507,7 +512,7 @@ int do_proc_mdstat(int update_every, usec_t dt) snprintfz(id, 50, "%s_operation", raid->name); if (unlikely(!raid->st_operation && !(raid->st_operation = rrdset_find_active_byname_localhost(id)))) { - snprintfz(family, 50, "%s", raid->name); + snprintfz(family, 50, "%s (%s)", raid->name, raid->level); raid->st_operation = rrdset_create_localhost( "mdstat", @@ -548,7 +553,7 @@ int do_proc_mdstat(int update_every, usec_t dt) snprintfz(id, 50, "%s_finish", raid->name); if (unlikely(!raid->st_finish && !(raid->st_finish = rrdset_find_active_byname_localhost(id)))) { - snprintfz(family, 50, "%s", raid->name); + snprintfz(family, 50, "%s (%s)", raid->name, raid->level); raid->st_finish = rrdset_create_localhost( "mdstat", @@ -579,7 +584,7 @@ int do_proc_mdstat(int update_every, usec_t dt) snprintfz(id, 50, "%s_speed", raid->name); if (unlikely(!raid->st_speed && !(raid->st_speed = rrdset_find_active_byname_localhost(id)))) { - snprintfz(family, 50, "%s", raid->name); + snprintfz(family, 50, "%s (%s)", raid->name, raid->level); raid->st_speed = rrdset_create_localhost( "mdstat", @@ -613,7 +618,7 @@ int do_proc_mdstat(int update_every, usec_t dt) snprintfz(id, 50, "%s_availability", raid->name); if (unlikely(!raid->st_nonredundant && !(raid->st_nonredundant = rrdset_find_active_localhost(id)))) { - snprintfz(family, 50, "%s", raid->name); + snprintfz(family, 50, "%s (%s)", raid->name, raid->level); raid->st_nonredundant = rrdset_create_localhost( "mdstat", diff --git a/collectors/proc.plugin/proc_meminfo.c b/collectors/proc.plugin/proc_meminfo.c index 51d77fe0b..5b402caaf 100644 --- a/collectors/proc.plugin/proc_meminfo.c +++ b/collectors/proc.plugin/proc_meminfo.c @@ -10,6 +10,7 @@ int do_proc_meminfo(int update_every, usec_t dt) { static procfile *ff = NULL; static int do_ram = -1, do_swap = -1, do_hwcorrupt = -1, do_committed = -1, do_writeback = -1, do_kernel = -1, do_slab = -1, do_hugepages = -1, do_transparent_hugepages = -1; + static int do_percpu = 0; static ARL_BASE *arl_base = NULL; static ARL_ENTRY *arl_hwcorrupted = NULL, *arl_memavailable = NULL; @@ -49,6 +50,7 @@ int do_proc_meminfo(int update_every, usec_t dt) { //VmallocTotal = 0, VmallocUsed = 0, //VmallocChunk = 0, + Percpu = 0, AnonHugePages = 0, ShmemHugePages = 0, HugePages_Total = 0, @@ -106,6 +108,7 @@ int do_proc_meminfo(int update_every, usec_t dt) { //arl_expect(arl_base, "VmallocTotal", &VmallocTotal); arl_expect(arl_base, "VmallocUsed", &VmallocUsed); //arl_expect(arl_base, "VmallocChunk", &VmallocChunk); + arl_expect(arl_base, "Percpu", &Percpu); arl_hwcorrupted = arl_expect(arl_base, "HardwareCorrupted", &HardwareCorrupted); arl_expect(arl_base, "AnonHugePages", &AnonHugePages); arl_expect(arl_base, "ShmemHugePages", &ShmemHugePages); @@ -134,15 +137,23 @@ int do_proc_meminfo(int update_every, usec_t dt) { arl_begin(arl_base); + static int first_ff_read = 1; + for(l = 0; l < lines ;l++) { size_t words = procfile_linewords(ff, l); if(unlikely(words < 2)) continue; + if (first_ff_read && !strcmp(procfile_lineword(ff, l, 0), "Percpu")) + do_percpu = 1; + if(unlikely(arl_check(arl_base, procfile_lineword(ff, l, 0), procfile_lineword(ff, l, 1)))) break; } + if (first_ff_read) + first_ff_read = 0; + // -------------------------------------------------------------------- // http://calimeroteknik.free.fr/blag/?article20/really-used-memory-on-gnu-linux @@ -371,7 +382,8 @@ int do_proc_meminfo(int update_every, usec_t dt) { if(do_kernel) { static RRDSET *st_mem_kernel = NULL; - static RRDDIM *rd_slab = NULL, *rd_kernelstack = NULL, *rd_pagetables = NULL, *rd_vmallocused = NULL; + static RRDDIM *rd_slab = NULL, *rd_kernelstack = NULL, *rd_pagetables = NULL, *rd_vmallocused = NULL, + *rd_percpu = NULL; if(unlikely(!st_mem_kernel)) { st_mem_kernel = rrdset_create_localhost( @@ -395,6 +407,8 @@ int do_proc_meminfo(int update_every, usec_t dt) { rd_kernelstack = rrddim_add(st_mem_kernel, "KernelStack", NULL, 1, 1024, RRD_ALGORITHM_ABSOLUTE); rd_pagetables = rrddim_add(st_mem_kernel, "PageTables", NULL, 1, 1024, RRD_ALGORITHM_ABSOLUTE); rd_vmallocused = rrddim_add(st_mem_kernel, "VmallocUsed", NULL, 1, 1024, RRD_ALGORITHM_ABSOLUTE); + if (do_percpu) + rd_percpu = rrddim_add(st_mem_kernel, "Percpu", NULL, 1, 1024, RRD_ALGORITHM_ABSOLUTE); } else rrdset_next(st_mem_kernel); @@ -402,6 +416,8 @@ int do_proc_meminfo(int update_every, usec_t dt) { rrddim_set_by_pointer(st_mem_kernel, rd_kernelstack, KernelStack); rrddim_set_by_pointer(st_mem_kernel, rd_pagetables, PageTables); rrddim_set_by_pointer(st_mem_kernel, rd_vmallocused, VmallocUsed); + if (do_percpu) + rrddim_set_by_pointer(st_mem_kernel, rd_percpu, Percpu); rrdset_done(st_mem_kernel); } diff --git a/collectors/proc.plugin/proc_net_dev.c b/collectors/proc.plugin/proc_net_dev.c index 24715f296..bbf8a590a 100644 --- a/collectors/proc.plugin/proc_net_dev.c +++ b/collectors/proc.plugin/proc_net_dev.c @@ -841,7 +841,7 @@ int do_proc_net_dev(int update_every, usec_t dt) { d->rd_tbytes = rrddim_add(d->st_bandwidth, "sent", NULL, -8, BITS_IN_A_KILOBIT, RRD_ALGORITHM_INCREMENTAL); if(d->flipped) { - // flip receive/trasmit + // flip receive/transmit RRDDIM *td = d->rd_rbytes; d->rd_rbytes = d->rd_tbytes; @@ -1064,7 +1064,7 @@ int do_proc_net_dev(int update_every, usec_t dt) { d->rd_rmulticast = rrddim_add(d->st_packets, "multicast", NULL, 1, 1, RRD_ALGORITHM_INCREMENTAL); if(d->flipped) { - // flip receive/trasmit + // flip receive/transmit RRDDIM *td = d->rd_rpackets; d->rd_rpackets = d->rd_tpackets; @@ -1111,7 +1111,7 @@ int do_proc_net_dev(int update_every, usec_t dt) { d->rd_terrors = rrddim_add(d->st_errors, "outbound", NULL, -1, 1, RRD_ALGORITHM_INCREMENTAL); if(d->flipped) { - // flip receive/trasmit + // flip receive/transmit RRDDIM *td = d->rd_rerrors; d->rd_rerrors = d->rd_terrors; @@ -1157,7 +1157,7 @@ int do_proc_net_dev(int update_every, usec_t dt) { d->rd_tdrops = rrddim_add(d->st_drops, "outbound", NULL, -1, 1, RRD_ALGORITHM_INCREMENTAL); if(d->flipped) { - // flip receive/trasmit + // flip receive/transmit RRDDIM *td = d->rd_rdrops; d->rd_rdrops = d->rd_tdrops; @@ -1203,7 +1203,7 @@ int do_proc_net_dev(int update_every, usec_t dt) { d->rd_tfifo = rrddim_add(d->st_fifo, "transmit", NULL, -1, 1, RRD_ALGORITHM_INCREMENTAL); if(d->flipped) { - // flip receive/trasmit + // flip receive/transmit RRDDIM *td = d->rd_rfifo; d->rd_rfifo = d->rd_tfifo; @@ -1249,7 +1249,7 @@ int do_proc_net_dev(int update_every, usec_t dt) { d->rd_tcompressed = rrddim_add(d->st_compressed, "sent", NULL, -1, 1, RRD_ALGORITHM_INCREMENTAL); if(d->flipped) { - // flip receive/trasmit + // flip receive/transmit RRDDIM *td = d->rd_rcompressed; d->rd_rcompressed = d->rd_tcompressed; diff --git a/collectors/proc.plugin/proc_net_wireless.c b/collectors/proc.plugin/proc_net_wireless.c index 32a53c68f..cb2443b1e 100644 --- a/collectors/proc.plugin/proc_net_wireless.c +++ b/collectors/proc.plugin/proc_net_wireless.c @@ -48,7 +48,7 @@ static struct netwireless { const char *chart_family; // charts - // satus + // status RRDSET *st_status; // Quality @@ -119,7 +119,7 @@ static void netwireless_cleanup(struct timeval *timestamp) { struct netwireless *previous = NULL; struct netwireless *current; - // search it, from begining to the end + // search it, from beginning to the end for (current = netwireless_root; current;) { if (timercmp(¤t->updated, timestamp, <)) { @@ -145,7 +145,7 @@ static struct netwireless *find_or_create_wireless(const char *name) struct netwireless *wireless; uint32_t hash = simple_hash(name); - // search it, from begining to the end + // search it, from beginning to the end for (wireless = netwireless_root ; wireless ; wireless = wireless->next) { if (unlikely(hash == wireless->hash && !strcmp(name, wireless->name))) { return wireless; diff --git a/collectors/proc.plugin/proc_pagetypeinfo.c b/collectors/proc.plugin/proc_pagetypeinfo.c index 6b6c6c4ed..3ce292227 100644 --- a/collectors/proc.plugin/proc_pagetypeinfo.c +++ b/collectors/proc.plugin/proc_pagetypeinfo.c @@ -226,7 +226,7 @@ int do_proc_pagetypeinfo(int update_every, usec_t dt) { for (p = 0; p < pagelines_cnt; p++) { pgl = &pagelines[p]; - // Skip invalid, refused or empty pagelines if not explicitely requested + // Skip invalid, refused or empty pagelines if not explicitly requested if (!pgl || do_detail == CONFIG_BOOLEAN_NO || (do_detail == CONFIG_BOOLEAN_AUTO && pageline_total_count(pgl) == 0 && netdata_zero_metrics_enabled != CONFIG_BOOLEAN_YES)) @@ -236,7 +236,7 @@ int do_proc_pagetypeinfo(int update_every, usec_t dt) { char setid[13+1+2+1+MAX_ZONETYPE_NAME+1+MAX_PAGETYPE_NAME+1]; snprintfz(setid, 13+1+2+1+MAX_ZONETYPE_NAME+1+MAX_PAGETYPE_NAME, "pagetype_Node%d_%s_%s", pgl->node, pgl->zone, pgl->type); - // Skip explicitely refused charts + // Skip explicitly refused charts if (simple_pattern_matches(filter_types, setid)) continue; diff --git a/collectors/proc.plugin/proc_spl_kstat_zfs.c b/collectors/proc.plugin/proc_spl_kstat_zfs.c index 32ff36b76..ce95c2d35 100644 --- a/collectors/proc.plugin/proc_spl_kstat_zfs.c +++ b/collectors/proc.plugin/proc_spl_kstat_zfs.c @@ -4,6 +4,10 @@ #include "zfs_common.h" #define ZFS_PROC_ARCSTATS "/proc/spl/kstat/zfs/arcstats" +#define ZFS_PROC_POOLS "/proc/spl/kstat/zfs" + +#define STATE_SIZE 8 +#define MAX_CHART_ID 256 extern struct arcstats arcstats; @@ -194,3 +198,219 @@ int do_proc_spl_kstat_zfs_arcstats(int update_every, usec_t dt) { return 0; } + +struct zfs_pool { + RRDSET *st; + + RRDDIM *rd_online; + RRDDIM *rd_degraded; + RRDDIM *rd_faulted; + RRDDIM *rd_offline; + RRDDIM *rd_removed; + RRDDIM *rd_unavail; + + int updated; + int disabled; + + int online; + int degraded; + int faulted; + int offline; + int removed; + int unavail; +}; + +struct deleted_zfs_pool { + char *name; + struct deleted_zfs_pool *next; +} *deleted_zfs_pools = NULL; + +DICTIONARY *zfs_pools = NULL; + +void disable_zfs_pool_state(struct zfs_pool *pool) +{ + if (pool->st) + rrdset_is_obsolete(pool->st); + + pool->st = NULL; + + pool->rd_online = NULL; + pool->rd_degraded = NULL; + pool->rd_faulted = NULL; + pool->rd_offline = NULL; + pool->rd_removed = NULL; + pool->rd_unavail = NULL; + + pool->disabled = 1; +} + +int update_zfs_pool_state_chart(char *name, void *pool_p, void *update_every_p) +{ + struct zfs_pool *pool = (struct zfs_pool *)pool_p; + int update_every = *(int *)update_every_p; + + if (pool->updated) { + pool->updated = 0; + + if (!pool->disabled) { + if (unlikely(!pool->st)) { + char chart_id[MAX_CHART_ID + 1]; + snprintf(chart_id, MAX_CHART_ID, "state_%s", name); + + pool->st = rrdset_create_localhost( + "zfspool", + chart_id, + NULL, + name, + "zfspool.state", + "ZFS pool state", + "boolean", + PLUGIN_PROC_NAME, + ZFS_PROC_POOLS, + NETDATA_CHART_PRIO_ZFS_POOL_STATE, + update_every, + RRDSET_TYPE_LINE); + + pool->rd_online = rrddim_add(pool->st, "online", NULL, 1, 1, RRD_ALGORITHM_ABSOLUTE); + pool->rd_degraded = rrddim_add(pool->st, "degraded", NULL, 1, 1, RRD_ALGORITHM_ABSOLUTE); + pool->rd_faulted = rrddim_add(pool->st, "faulted", NULL, 1, 1, RRD_ALGORITHM_ABSOLUTE); + pool->rd_offline = rrddim_add(pool->st, "offline", NULL, 1, 1, RRD_ALGORITHM_ABSOLUTE); + pool->rd_removed = rrddim_add(pool->st, "removed", NULL, 1, 1, RRD_ALGORITHM_ABSOLUTE); + pool->rd_unavail = rrddim_add(pool->st, "unavail", NULL, 1, 1, RRD_ALGORITHM_ABSOLUTE); + } else + rrdset_next(pool->st); + + rrddim_set_by_pointer(pool->st, pool->rd_online, pool->online); + rrddim_set_by_pointer(pool->st, pool->rd_degraded, pool->degraded); + rrddim_set_by_pointer(pool->st, pool->rd_faulted, pool->faulted); + rrddim_set_by_pointer(pool->st, pool->rd_offline, pool->offline); + rrddim_set_by_pointer(pool->st, pool->rd_removed, pool->removed); + rrddim_set_by_pointer(pool->st, pool->rd_unavail, pool->unavail); + rrdset_done(pool->st); + } + } else { + disable_zfs_pool_state(pool); + struct deleted_zfs_pool *new = calloc(1, sizeof(struct deleted_zfs_pool)); + new->name = strdupz(name); + new->next = deleted_zfs_pools; + deleted_zfs_pools = new; + } + + return 0; +} + +int do_proc_spl_kstat_zfs_pool_state(int update_every, usec_t dt) +{ + (void)dt; + + static int do_zfs_pool_state = -1; + static char *dirname = NULL; + + int pool_found = 0, state_file_found = 0; + + if (unlikely(do_zfs_pool_state == -1)) { + char filename[FILENAME_MAX + 1]; + snprintfz(filename, FILENAME_MAX, "%s%s", netdata_configured_host_prefix, "/proc/spl/kstat/zfs"); + dirname = config_get("plugin:proc:" ZFS_PROC_POOLS, "directory to monitor", filename); + + zfs_pools = dictionary_create(DICTIONARY_FLAG_SINGLE_THREADED); + + do_zfs_pool_state = 1; + } + + if (likely(do_zfs_pool_state)) { + DIR *dir = opendir(dirname); + if (unlikely(!dir)) { + error("Cannot read directory '%s'", dirname); + return 1; + } + + struct dirent *de = NULL; + while (likely(de = readdir(dir))) { + if (likely( + de->d_type == DT_DIR && ((de->d_name[0] == '.' && de->d_name[1] == '\0') || + (de->d_name[0] == '.' && de->d_name[1] == '.' && de->d_name[2] == '\0')))) + continue; + + if (unlikely(de->d_type == DT_LNK || de->d_type == DT_DIR)) { + pool_found = 1; + + struct zfs_pool *pool = dictionary_get(zfs_pools, de->d_name); + + if (unlikely(!pool)) { + struct zfs_pool new_zfs_pool = {}; + pool = dictionary_set(zfs_pools, de->d_name, &new_zfs_pool, sizeof(struct zfs_pool)); + }; + + pool->updated = 1; + + if (pool->disabled) { + state_file_found = 1; + continue; + } + + pool->online = 0; + pool->degraded = 0; + pool->faulted = 0; + pool->offline = 0; + pool->removed = 0; + pool->unavail = 0; + + char filename[FILENAME_MAX + 1]; + snprintfz( + filename, FILENAME_MAX, "%s%s/%s/state", netdata_configured_host_prefix, dirname, de->d_name); + + char state[STATE_SIZE + 1]; + int ret = read_file(filename, state, STATE_SIZE); + + if (!ret) { + state_file_found = 1; + + // ZFS pool states are described at https://openzfs.github.io/openzfs-docs/man/8/zpoolconcepts.8.html?#Device_Failure_and_Recovery + if (!strcmp(state, "ONLINE\n")) { + pool->online = 1; + } else if (!strcmp(state, "DEGRADED\n")) { + pool->degraded = 1; + } else if (!strcmp(state, "FAULTED\n")) { + pool->faulted = 1; + } else if (!strcmp(state, "OFFLINE\n")) { + pool->offline = 1; + } else if (!strcmp(state, "REMOVED\n")) { + pool->removed = 1; + } else if (!strcmp(state, "UNAVAIL\n")) { + pool->unavail = 1; + } else { + disable_zfs_pool_state(pool); + + char *c = strchr(state, '\n'); + if (c) + *c = '\0'; + error("ZFS POOLS: Undefined state %s for zpool %s, disabling the chart", state, de->d_name); + } + } + } + } + + closedir(dir); + } + + if (do_zfs_pool_state && pool_found && !state_file_found) { + info("ZFS POOLS: State files not found. Disabling the module."); + do_zfs_pool_state = 0; + } + + if (do_zfs_pool_state) + dictionary_get_all_name_value(zfs_pools, update_zfs_pool_state_chart, &update_every); + + while (deleted_zfs_pools) { + struct deleted_zfs_pool *current_pool = deleted_zfs_pools; + dictionary_del(zfs_pools, current_pool->name); + + deleted_zfs_pools = deleted_zfs_pools->next; + + freez(current_pool->name); + freez(current_pool); + } + + return 0; +} diff --git a/collectors/proc.plugin/proc_vmstat.c b/collectors/proc.plugin/proc_vmstat.c index 7def02ddf..c1a137161 100644 --- a/collectors/proc.plugin/proc_vmstat.c +++ b/collectors/proc.plugin/proc_vmstat.c @@ -4,11 +4,13 @@ #define PLUGIN_PROC_MODULE_VMSTAT_NAME "/proc/vmstat" +#define OOM_KILL_STRING "oom_kill" + int do_proc_vmstat(int update_every, usec_t dt) { (void)dt; static procfile *ff = NULL; - static int do_swapio = -1, do_io = -1, do_pgfaults = -1, do_numa = -1; + static int do_swapio = -1, do_io = -1, do_pgfaults = -1, do_oom_kill = -1, do_numa = -1; static int has_numa = -1; static ARL_BASE *arl_base = NULL; @@ -27,11 +29,25 @@ int do_proc_vmstat(int update_every, usec_t dt) { static unsigned long long pgpgout = 0ULL; static unsigned long long pswpin = 0ULL; static unsigned long long pswpout = 0ULL; + static unsigned long long oom_kill = 0ULL; + + if(unlikely(!ff)) { + char filename[FILENAME_MAX + 1]; + snprintfz(filename, FILENAME_MAX, "%s%s", netdata_configured_host_prefix, "/proc/vmstat"); + ff = procfile_open(config_get("plugin:proc:/proc/vmstat", "filename to monitor", filename), " \t:", PROCFILE_FLAG_DEFAULT); + if(unlikely(!ff)) return 1; + } + + ff = procfile_readall(ff); + if(unlikely(!ff)) return 0; // we return 0, so that we will retry to open it next time + + size_t lines = procfile_lines(ff), l; if(unlikely(!arl_base)) { do_swapio = config_get_boolean_ondemand("plugin:proc:/proc/vmstat", "swap i/o", CONFIG_BOOLEAN_AUTO); - do_io = config_get_boolean("plugin:proc:/proc/vmstat", "disk i/o", 1); - do_pgfaults = config_get_boolean("plugin:proc:/proc/vmstat", "memory page faults", 1); + do_io = config_get_boolean("plugin:proc:/proc/vmstat", "disk i/o", CONFIG_BOOLEAN_YES); + do_pgfaults = config_get_boolean("plugin:proc:/proc/vmstat", "memory page faults", CONFIG_BOOLEAN_YES); + do_oom_kill = config_get_boolean("plugin:proc:/proc/vmstat", "out of memory kills", CONFIG_BOOLEAN_AUTO); do_numa = config_get_boolean_ondemand("plugin:proc:/proc/vmstat", "system-wide numa metric summary", CONFIG_BOOLEAN_AUTO); @@ -43,6 +59,20 @@ int do_proc_vmstat(int update_every, usec_t dt) { arl_expect(arl_base, "pswpin", &pswpin); arl_expect(arl_base, "pswpout", &pswpout); + int has_oom_kill = 0; + + for (l = 0; l < lines; l++) { + if (!strcmp(procfile_lineword(ff, l, 0), OOM_KILL_STRING)) { + has_oom_kill = 1; + break; + } + } + + if (has_oom_kill) + arl_expect(arl_base, OOM_KILL_STRING, &oom_kill); + else + do_oom_kill = CONFIG_BOOLEAN_NO; + if(do_numa == CONFIG_BOOLEAN_YES || (do_numa == CONFIG_BOOLEAN_AUTO && (get_numa_node_count() >= 2 || netdata_zero_metrics_enabled == CONFIG_BOOLEAN_YES))) { @@ -66,18 +96,6 @@ int do_proc_vmstat(int update_every, usec_t dt) { } } - if(unlikely(!ff)) { - char filename[FILENAME_MAX + 1]; - snprintfz(filename, FILENAME_MAX, "%s%s", netdata_configured_host_prefix, "/proc/vmstat"); - ff = procfile_open(config_get("plugin:proc:/proc/vmstat", "filename to monitor", filename), " \t:", PROCFILE_FLAG_DEFAULT); - if(unlikely(!ff)) return 1; - } - - ff = procfile_readall(ff); - if(unlikely(!ff)) return 0; // we return 0, so that we will retry to open it next time - - size_t lines = procfile_lines(ff), l; - arl_begin(arl_base); for(l = 0; l < lines ;l++) { size_t words = procfile_linewords(ff, l); @@ -193,6 +211,41 @@ int do_proc_vmstat(int update_every, usec_t dt) { rrdset_done(st_pgfaults); } + // -------------------------------------------------------------------- + + if (do_oom_kill == CONFIG_BOOLEAN_YES || + (do_oom_kill == CONFIG_BOOLEAN_AUTO && (oom_kill || netdata_zero_metrics_enabled == CONFIG_BOOLEAN_YES))) { + static RRDSET *st_oom_kill = NULL; + static RRDDIM *rd_oom_kill = NULL; + + do_oom_kill = CONFIG_BOOLEAN_YES; + + if(unlikely(!st_oom_kill)) { + st_oom_kill = rrdset_create_localhost( + "mem" + , "oom_kill" + , NULL + , "system" + , NULL + , "Out of Memory Kills" + , "kills/s" + , PLUGIN_PROC_NAME + , PLUGIN_PROC_MODULE_VMSTAT_NAME + , NETDATA_CHART_PRIO_MEM_SYSTEM_OOM_KILL + , update_every + , RRDSET_TYPE_LINE + ); + + rrdset_flag_set(st_oom_kill, RRDSET_FLAG_DETAIL); + + rd_oom_kill = rrddim_add(st_oom_kill, "kills", NULL, 1, 1, RRD_ALGORITHM_INCREMENTAL); + } + else rrdset_next(st_oom_kill); + + rrddim_set_by_pointer(st_oom_kill, rd_oom_kill, oom_kill); + rrdset_done(st_oom_kill); + } + // -------------------------------------------------------------------- // Ondemand criteria for NUMA. Since this won't change at run time, we diff --git a/collectors/proc.plugin/sys_class_infiniband.c b/collectors/proc.plugin/sys_class_infiniband.c index 46f40f2c0..69e27f81e 100644 --- a/collectors/proc.plugin/sys_class_infiniband.c +++ b/collectors/proc.plugin/sys_class_infiniband.c @@ -367,7 +367,7 @@ int do_sys_class_infiniband(int update_every, usec_t dt) char buffer[FILENAME_MAX + 1]; - // Check if counters are availablea (mandatory) + // Check if counters are available (mandatory) // /sys/class/infiniband/<device>/ports/<port>/counters char counters_dirname[FILENAME_MAX + 1]; snprintfz(counters_dirname, FILENAME_MAX, "%s/%s/%s", ports_dirname, port_dent->d_name, "counters"); @@ -377,7 +377,7 @@ int do_sys_class_infiniband(int update_every, usec_t dt) continue; closedir(counters_dir); - // Hardware Counters are optionnal, used later + // Hardware Counters are optional, used later char hwcounters_dirname[FILENAME_MAX + 1]; snprintfz( hwcounters_dirname, FILENAME_MAX, "%s/%s/%s", ports_dirname, port_dent->d_name, "hw_counters"); diff --git a/collectors/python.d.plugin/Makefile.am b/collectors/python.d.plugin/Makefile.am index 1de2d1d54..38eb90f79 100644 --- a/collectors/python.d.plugin/Makefile.am +++ b/collectors/python.d.plugin/Makefile.am @@ -48,6 +48,7 @@ include beanstalk/Makefile.inc include bind_rndc/Makefile.inc include boinc/Makefile.inc include ceph/Makefile.inc +include changefinder/Makefile.inc include chrony/Makefile.inc include couchdb/Makefile.inc include dnsdist/Makefile.inc @@ -109,6 +110,7 @@ include uwsgi/Makefile.inc include varnish/Makefile.inc include w1sensor/Makefile.inc include web_log/Makefile.inc +include zscores/Makefile.inc pythonmodulesdir=$(pythondir)/python_modules dist_pythonmodules_DATA = \ diff --git a/collectors/python.d.plugin/README.md b/collectors/python.d.plugin/README.md index 312986e48..9170350fb 100644 --- a/collectors/python.d.plugin/README.md +++ b/collectors/python.d.plugin/README.md @@ -93,7 +93,7 @@ have made to do your development on). ```bash # clone your fork (done once at the start but shown here for clarity) -#git clone --branch my-example-collector https://github.com/mygithubusername/netdata.git --depth=100 +#git clone --branch my-example-collector https://github.com/mygithubusername/netdata.git --depth=100 --recursive # go into your netdata source folder cd netdata # git pull your latest changes (assuming you built from a fork you are using to develop on) @@ -127,7 +127,7 @@ CHART = { ]} ``` -All names are better explained in the [External Plugins](../) section. +All names are better explained in the [External Plugins](/collectors/plugins.d/README.md) section. Parameters like `priority` and `update_every` are handled by `python.d.plugin`. ### `Service` class diff --git a/collectors/python.d.plugin/anomalies/README.md b/collectors/python.d.plugin/anomalies/README.md index bcbfdbcd7..9d24e8685 100644 --- a/collectors/python.d.plugin/anomalies/README.md +++ b/collectors/python.d.plugin/anomalies/README.md @@ -35,18 +35,26 @@ Then, as the issue passes, the anomaly probabilities should settle back down int ## Requirements - This collector will only work with Python 3 and requires the packages below be installed. +- Typically you will not need to do this, but, if needed, to ensure Python 3 is used you can add the below line to the `[plugin:python.d]` section of `netdata.conf` + +```conf +[plugin:python.d] + # update every = 1 + command options = -ppython3 +``` + +Install the required python libraries. ```bash # become netdata user sudo su -s /bin/bash netdata # install required packages for the netdata user -pip3 install --user netdata-pandas==0.0.32 numba==0.50.1 scikit-learn==0.23.2 pyod==0.8.3 +pip3 install --user netdata-pandas==0.0.38 numba==0.50.1 scikit-learn==0.23.2 pyod==0.8.3 ``` ## Configuration -Install the Python requirements above, enable the collector and [restart -Netdata](/docs/configure/start-stop-restart.md). +Install the Python requirements above, enable the collector and restart Netdata. ```bash cd /etc/netdata/ @@ -69,7 +77,7 @@ sudo ./edit-config python.d/anomalies.conf The default configuration should look something like this. Here you can see each parameter (with sane defaults) and some information about each one and what it does. -```yaml +```conf # ---------------------------------------------------------------------- # JOBS (data collection sources) @@ -87,6 +95,9 @@ local: # Use http or https to pull data protocol: 'http' + # SSL verify parameter for requests.get() calls + tls_verify: true + # What charts to pull data for - A regex like 'system\..*|' or 'system\..*|apps.cpu|apps.mem' etc. charts_regex: 'system\..*' @@ -229,4 +240,4 @@ If you would like to go deeper on what exactly the anomalies collector is doing - Good [blog post](https://www.anodot.com/blog/what-is-anomaly-detection/) from Anodot on time series anomaly detection. Anodot also have some great whitepapers in this space too that some may find useful. - Novelty and outlier detection in the [scikit-learn documentation](https://scikit-learn.org/stable/modules/outlier_detection.html). -[]() +[]()
\ No newline at end of file diff --git a/collectors/python.d.plugin/anomalies/anomalies.chart.py b/collectors/python.d.plugin/anomalies/anomalies.chart.py index 97dbb1d1e..61b51d9c0 100644 --- a/collectors/python.d.plugin/anomalies/anomalies.chart.py +++ b/collectors/python.d.plugin/anomalies/anomalies.chart.py @@ -3,6 +3,7 @@ # Author: andrewm4894 # SPDX-License-Identifier: GPL-3.0-or-later +import sys import time from datetime import datetime import re @@ -51,14 +52,17 @@ class Service(SimpleService): self.basic_init() self.charts_init() self.custom_models_init() + self.data_init() self.model_params_init() self.models_init() + self.collected_dims = {'probability': set(), 'anomaly': set()} def check(self): - _ = get_allmetrics_async( - host_charts_dict=self.host_charts_dict, host_prefix=True, host_sep='::', wide=True, sort_cols=True, - protocol=self.protocol, numeric_only=True, float_size='float32', user=self.username, pwd=self.password - ) + python_version = float('{}.{}'.format(sys.version_info[0], sys.version_info[1])) + if python_version < 3.6: + self.error("anomalies collector only works with Python>=3.6") + if len(self.host_charts_dict[self.host]) > 0: + _ = get_allmetrics_async(host_charts_dict=self.host_charts_dict, protocol=self.protocol, user=self.username, pwd=self.password) return True def basic_init(self): @@ -70,17 +74,18 @@ class Service(SimpleService): self.host = self.configuration.get('host', '127.0.0.1:19999') self.username = self.configuration.get('username', None) self.password = self.configuration.get('password', None) + self.tls_verify = self.configuration.get('tls_verify', True) self.fitted_at = {} self.df_allmetrics = pd.DataFrame() - self.data_latest = {} self.last_train_at = 0 self.include_average_prob = bool(self.configuration.get('include_average_prob', True)) + self.reinitialize_at_every_step = bool(self.configuration.get('reinitialize_at_every_step', False)) def charts_init(self): """Do some initialisation of charts in scope related variables. """ self.charts_regex = re.compile(self.configuration.get('charts_regex','None')) - self.charts_available = [c for c in list(requests.get(f'{self.protocol}://{self.host}/api/v1/charts').json().get('charts', {}).keys())] + self.charts_available = [c for c in list(requests.get(f'{self.protocol}://{self.host}/api/v1/charts', verify=self.tls_verify).json().get('charts', {}).keys())] self.charts_in_scope = list(filter(self.charts_regex.match, self.charts_available)) self.charts_to_exclude = self.configuration.get('charts_to_exclude', '').split(',') if len(self.charts_to_exclude) > 0: @@ -115,6 +120,14 @@ class Service(SimpleService): self.models_in_scope = [f'{self.host}::{c}' for c in self.charts_in_scope] self.host_charts_dict = {self.host: self.charts_in_scope} self.model_display_names = {model: model.split('::')[1] if '::' in model else model for model in self.models_in_scope} + #self.info(f'self.host_charts_dict (len={len(self.host_charts_dict[self.host])}): {self.host_charts_dict}') + + def data_init(self): + """Initialize some empty data objects. + """ + self.data_probability_latest = {f'{m}_prob': 0 for m in self.charts_in_scope} + self.data_anomaly_latest = {f'{m}_anomaly': 0 for m in self.charts_in_scope} + self.data_latest = {**self.data_probability_latest, **self.data_anomaly_latest} def model_params_init(self): """Model parameters initialisation. @@ -153,12 +166,55 @@ class Service(SimpleService): self.models = {model: HBOS(contamination=self.contamination) for model in self.models_in_scope} self.custom_model_scalers = {model: MinMaxScaler() for model in self.models_in_scope} - def validate_charts(self, name, data, algorithm='absolute', multiplier=1, divisor=1): + def model_init(self, model): + """Model initialisation of a single model. + """ + if self.model == 'pca': + self.models[model] = PCA(contamination=self.contamination) + elif self.model == 'loda': + self.models[model] = LODA(contamination=self.contamination) + elif self.model == 'iforest': + self.models[model] = IForest(n_estimators=50, bootstrap=True, behaviour='new', contamination=self.contamination) + elif self.model == 'cblof': + self.models[model] = CBLOF(n_clusters=3, contamination=self.contamination) + elif self.model == 'feature_bagging': + self.models[model] = FeatureBagging(base_estimator=PCA(contamination=self.contamination), contamination=self.contamination) + elif self.model == 'copod': + self.models[model] = COPOD(contamination=self.contamination) + elif self.model == 'hbos': + self.models[model] = HBOS(contamination=self.contamination) + else: + self.models[model] = HBOS(contamination=self.contamination) + self.custom_model_scalers[model] = MinMaxScaler() + + def reinitialize(self): + """Reinitialize charts, models and data to a begining state. + """ + self.charts_init() + self.custom_models_init() + self.data_init() + self.model_params_init() + self.models_init() + + def save_data_latest(self, data, data_probability, data_anomaly): + """Save the most recent data objects to be used if needed in the future. + """ + self.data_latest = data + self.data_probability_latest = data_probability + self.data_anomaly_latest = data_anomaly + + def validate_charts(self, chart, data, algorithm='absolute', multiplier=1, divisor=1): """If dimension not in chart then add it. """ for dim in data: - if dim not in self.charts[name]: - self.charts[name].add_dimension([dim, dim, algorithm, multiplier, divisor]) + if dim not in self.collected_dims[chart]: + self.collected_dims[chart].add(dim) + self.charts[chart].add_dimension([dim, dim, algorithm, multiplier, divisor]) + + for dim in list(self.collected_dims[chart]): + if dim not in data: + self.collected_dims[chart].remove(dim) + self.charts[chart].del_dimension(dim, hide=False) def add_custom_models_dims(self, df): """Given a df, select columns used by custom models, add custom model name as prefix, and append to df. @@ -242,8 +298,9 @@ class Service(SimpleService): # get training data df_train = get_data( host_charts_dict=self.host_charts_dict, host_prefix=True, host_sep='::', after=after, before=before, - sort_cols=True, numeric_only=True, protocol=self.protocol, float_size='float32', user=self.username, pwd=self.password - ).ffill() + sort_cols=True, numeric_only=True, protocol=self.protocol, float_size='float32', user=self.username, pwd=self.password, + verify=self.tls_verify + ).ffill() if self.custom_models: df_train = self.add_custom_models_dims(df_train) @@ -262,6 +319,8 @@ class Service(SimpleService): models_to_train = list(self.models.keys()) self.n_fit_fail, self.n_fit_success = 0, 0 for model in models_to_train: + if model not in self.models: + self.model_init(model) X_train = self.make_features( df_train[df_train.columns[df_train.columns.str.startswith(f'{model}|')]].values, train=True, model=model) @@ -303,13 +362,16 @@ class Service(SimpleService): data_probability, data_anomaly = {}, {} for model in self.fitted_at.keys(): model_display_name = self.model_display_names[model] - X_model = np.nan_to_num(self.make_features( - self.df_allmetrics[self.df_allmetrics.columns[self.df_allmetrics.columns.str.startswith(f'{model}|')]].values, - model=model)[-1,:].reshape(1, -1)) try: + X_model = np.nan_to_num( + self.make_features( + self.df_allmetrics[self.df_allmetrics.columns[self.df_allmetrics.columns.str.startswith(f'{model}|')]].values, + model=model + )[-1,:].reshape(1, -1) + ) data_probability[model_display_name + '_prob'] = np.nan_to_num(self.models[model].predict_proba(X_model)[-1][1]) * 10000 data_anomaly[model_display_name + '_anomaly'] = self.models[model].predict(X_model)[-1] - except Exception: + except Exception as _: #self.info(e) if model_display_name + '_prob' in self.data_latest: #self.info(f'prediction failed for {model} at run_counter {self.runs_counter}, using last prediction instead.') @@ -323,27 +385,42 @@ class Service(SimpleService): def get_data(self): + # initialize to whats available right now + if self.reinitialize_at_every_step or len(self.host_charts_dict[self.host]) == 0: + self.charts_init() + self.custom_models_init() + self.model_params_init() + # if not all models have been trained then train those we need to - if len(self.fitted_at) < len(self.models): + if len(self.fitted_at) < len(self.models_in_scope): self.train( - models_to_train=[m for m in self.models if m not in self.fitted_at], + models_to_train=[m for m in self.models_in_scope if m not in self.fitted_at], train_data_after=self.initial_train_data_after, - train_data_before=self.initial_train_data_before) + train_data_before=self.initial_train_data_before + ) # retrain all models as per schedule from config elif self.train_every_n > 0 and self.runs_counter % self.train_every_n == 0: + self.reinitialize() self.train() # roll forward previous predictions around a training step to avoid the possibility of having the training itself trigger an anomaly if (self.runs_counter - self.last_train_at) <= self.train_no_prediction_n: - data = self.data_latest + data_probability = self.data_probability_latest + data_anomaly = self.data_anomaly_latest else: data_probability, data_anomaly = self.predict() if self.include_average_prob: - data_probability['average_prob'] = np.mean(list(data_probability.values())) - data = {**data_probability, **data_anomaly} - self.validate_charts('probability', data_probability, divisor=100) - self.validate_charts('anomaly', data_anomaly) + average_prob = np.mean(list(data_probability.values())) + data_probability['average_prob'] = 0 if np.isnan(average_prob) else average_prob + + data = {**data_probability, **data_anomaly} - self.data_latest = data + self.validate_charts('probability', data_probability, divisor=100) + self.validate_charts('anomaly', data_anomaly) + + self.save_data_latest(data, data_probability, data_anomaly) + + #self.info(f'len(data)={len(data)}') + #self.info(f'data') return data diff --git a/collectors/python.d.plugin/anomalies/anomalies.conf b/collectors/python.d.plugin/anomalies/anomalies.conf index 9950534aa..0dc40ef2c 100644 --- a/collectors/python.d.plugin/anomalies/anomalies.conf +++ b/collectors/python.d.plugin/anomalies/anomalies.conf @@ -44,6 +44,9 @@ local: # Use http or https to pull data protocol: 'http' + # SSL verify parameter for requests.get() calls + tls_verify: true + # What charts to pull data for - A regex like 'system\..*|' or 'system\..*|apps.cpu|apps.mem' etc. charts_regex: 'system\..*' diff --git a/collectors/python.d.plugin/changefinder/Makefile.inc b/collectors/python.d.plugin/changefinder/Makefile.inc new file mode 100644 index 000000000..01a92408b --- /dev/null +++ b/collectors/python.d.plugin/changefinder/Makefile.inc @@ -0,0 +1,13 @@ +# SPDX-License-Identifier: GPL-3.0-or-later + +# THIS IS NOT A COMPLETE Makefile +# IT IS INCLUDED BY ITS PARENT'S Makefile.am +# IT IS REQUIRED TO REFERENCE ALL FILES RELATIVE TO THE PARENT + +# install these files +dist_python_DATA += changefinder/changefinder.chart.py +dist_pythonconfig_DATA += changefinder/changefinder.conf + +# do not install these files, but include them in the distribution +dist_noinst_DATA += changefinder/README.md changefinder/Makefile.inc + diff --git a/collectors/python.d.plugin/changefinder/README.md b/collectors/python.d.plugin/changefinder/README.md new file mode 100644 index 000000000..e1c1d4ba4 --- /dev/null +++ b/collectors/python.d.plugin/changefinder/README.md @@ -0,0 +1,218 @@ +<!-- +title: "Online change point detection with Netdata" +description: "Use ML-driven change point detection to narrow your focus and shorten root cause analysis." +custom_edit_url: https://github.com/netdata/netdata/edit/master/collectors/python.d.plugin/changefinder/README.md +--> + +# Online changepoint detection with Netdata + +This collector uses the Python [changefinder](https://github.com/shunsukeaihara/changefinder) library to +perform [online](https://en.wikipedia.org/wiki/Online_machine_learning) [changepoint detection](https://en.wikipedia.org/wiki/Change_detection) +on your Netdata charts and/or dimensions. + +Instead of this collector just _collecting_ data, it also does some computation on the data it collects to return a +changepoint score for each chart or dimension you configure it to work on. This is +an [online](https://en.wikipedia.org/wiki/Online_machine_learning) machine learning algorithim so there is no batch step +to train the model, instead it evolves over time as more data arrives. That makes this particualr algorithim quite cheap +to compute at each step of data collection (see the notes section below for more details) and it should scale fairly +well to work on lots of charts or hosts (if running on a parent node for example). + +> As this is a somewhat unique collector and involves often subjective concepts like changepoints and anomalies, we would love to hear any feedback on it from the community. Please let us know on the [community forum](https://community.netdata.cloud/t/changefinder-collector-feedback/972) or drop us a note at [analytics-ml-team@netdata.cloud](mailto:analytics-ml-team@netdata.cloud) for any and all feedback, both positive and negative. This sort of feedback is priceless to help us make complex features more useful. + +## Charts + +Two charts are available: + +### ChangeFinder Scores (`changefinder.scores`) + +This chart shows the percentile of the score that is output from the ChangeFinder library (it is turned off by default +but available with `show_scores: true`). + +A high observed score is more likley to be a valid changepoint worth exploring, even more so when multiple charts or +dimensions have high changepoint scores at the same time or very close together. + +### ChangeFinder Flags (`changefinder.flags`) + +This chart shows `1` or `0` if the latest score has a percentile value that exceeds the `cf_threshold` threshold. By +default, any scores that are in the 99th or above percentile will raise a flag on this chart. + +The raw changefinder score itself can be a little noisey and so limiting ourselves to just periods where it surpasses +the 99th percentile can help manage the "[signal to noise ratio](https://en.wikipedia.org/wiki/Signal-to-noise_ratio)" +better. + +The `cf_threshold` paramater might be one you want to play around with to tune things specifically for the workloads on +your node and the specific charts you want to monitor. For example, maybe the 95th percentile might work better for you +than the 99th percentile. + +Below is an example of the chart produced by this collector. The first 3/4 of the period looks normal in that we see a +few individual changes being picked up somewhat randomly over time. But then at around 14:59 towards the end of the +chart we see two periods with 'spikes' of multiple changes for a small period of time. This is the sort of pattern that +might be a sign something on the system that has changed sufficiently enough to merit some investigation. + + + +## Requirements + +- This collector will only work with Python 3 and requires the packages below be installed. + +```bash +# become netdata user +sudo su -s /bin/bash netdata +# install required packages for the netdata user +pip3 install --user numpy==1.19.5 changefinder==0.03 scipy==1.5.4 +``` + +**Note**: if you need to tell Netdata to use Python 3 then you can pass the below command in the python plugin section +of your `netdata.conf` file. + +```yaml +[ plugin:python.d ] + # update every = 1 + command options = -ppython3 +``` + +## Configuration + +Install the Python requirements above, enable the collector and restart Netdata. + +```bash +cd /etc/netdata/ +sudo ./edit-config python.d.conf +# Set `changefinder: no` to `changefinder: yes` +sudo systemctl restart netdata +``` + +The configuration for the changefinder collector defines how it will behave on your system and might take some +experimentation with over time to set it optimally for your node. Out of the box, the config comes with +some [sane defaults](https://www.netdata.cloud/blog/redefining-monitoring-netdata/) to get you started that try to +balance the flexibility and power of the ML models with the goal of being as cheap as possible in term of cost on the +node resources. + +_**Note**: If you are unsure about any of the below configuration options then it's best to just ignore all this and +leave the `changefinder.conf` file alone to begin with. Then you can return to it later if you would like to tune things +a bit more once the collector is running for a while and you have a feeling for its performance on your node._ + +Edit the `python.d/changefinder.conf` configuration file using `edit-config` from the your +agent's [config directory](/docs/configure/nodes.md), which is usually at `/etc/netdata`. + +```bash +cd /etc/netdata # Replace this path with your Netdata config directory, if different +sudo ./edit-config python.d/changefinder.conf +``` + +The default configuration should look something like this. Here you can see each parameter (with sane defaults) and some +information about each one and what it does. + +```yaml +# ---------------------------------------------------------------------- +# JOBS (data collection sources) + +# Pull data from local Netdata node. +local: + + # A friendly name for this job. + name: 'local' + + # What host to pull data from. + host: '127.0.0.1:19999' + + # What charts to pull data for - A regex like 'system\..*|' or 'system\..*|apps.cpu|apps.mem' etc. + charts_regex: 'system\..*' + + # Charts to exclude, useful if you would like to exclude some specific charts. + # Note: should be a ',' separated string like 'chart.name,chart.name'. + charts_to_exclude: '' + + # Get ChangeFinder scores 'per_dim' or 'per_chart'. + mode: 'per_chart' + + # Default parameters that can be passed to the changefinder library. + cf_r: 0.5 + cf_order: 1 + cf_smooth: 15 + + # The percentile above which scores will be flagged. + cf_threshold: 99 + + # The number of recent scores to use when calculating the percentile of the changefinder score. + n_score_samples: 14400 + + # Set to true if you also want to chart the percentile scores in addition to the flags. + # Mainly useful for debugging or if you want to dive deeper on how the scores are evolving over time. + show_scores: false +``` + +## Troubleshooting + +To see any relevant log messages you can use a command like below. + +```bash +grep 'changefinder' /var/log/netdata/error.log +``` + +If you would like to log in as `netdata` user and run the collector in debug mode to see more detail. + +```bash +# become netdata user +sudo su -s /bin/bash netdata +# run collector in debug using `nolock` option if netdata is already running the collector itself. +/usr/libexec/netdata/plugins.d/python.d.plugin changefinder debug trace nolock +``` + +## Notes + +- It may take an hour or two (depending on your choice of `n_score_samples`) for the collector to 'settle' into it's + typical behaviour in terms of the trained models and scores you will see in the normal running of your node. Mainly + this is because it can take a while to build up a proper distribution of previous scores in over to convert the raw + score returned by the ChangeFinder algorithim into a percentile based on the most recent `n_score_samples` that have + already been produced. So when you first turn the collector on, it will have a lot of flags in the beginning and then + should 'settle down' once it has built up enough history. This is a typical characteristic of online machine learning + approaches which need some initial window of time before they can be useful. +- As this collector does most of the work in Python itself, you may want to try it out first on a test or development + system to get a sense of its performance characteristics on a node similar to where you would like to use it. +- On a development n1-standard-2 (2 vCPUs, 7.5 GB memory) vm running Ubuntu 18.04 LTS and not doing any work some of the + typical performance characteristics we saw from running this collector (with defaults) were: + - A runtime (`netdata.runtime_changefinder`) of ~30ms. + - Typically ~1% additional cpu usage. + - About ~85mb of ram (`apps.mem`) being continually used by the `python.d.plugin` under default configuration. + +## Useful links and further reading + +- [PyPi changefinder](https://pypi.org/project/changefinder/) reference page. +- [GitHub repo](https://github.com/shunsukeaihara/changefinder) for the changefinder library. +- Relevant academic papers: + - Yamanishi K, Takeuchi J. A unifying framework for detecting outliers and change points from nonstationary time + series data. 8th ACM SIGKDD international conference on Knowledge discovery and data mining - KDD02. 2002: + 676. ([pdf](https://citeseerx.ist.psu.edu/viewdoc/download?doi=10.1.1.12.3469&rep=rep1&type=pdf)) + - Kawahara Y, Sugiyama M. Sequential Change-Point Detection Based on Direct Density-Ratio Estimation. SIAM + International Conference on Data Mining. 2009: + 389–400. ([pdf](https://onlinelibrary.wiley.com/doi/epdf/10.1002/sam.10124)) + - Liu S, Yamada M, Collier N, Sugiyama M. Change-point detection in time-series data by relative density-ratio + estimation. Neural Networks. Jul.2013 43:72–83. [PubMed: 23500502] ([pdf](https://arxiv.org/pdf/1203.0453.pdf)) + - T. Iwata, K. Nakamura, Y. Tokusashi, and H. Matsutani, “Accelerating Online Change-Point Detection Algorithm using + 10 GbE FPGA NIC,” Proc. International European Conference on Parallel and Distributed Computing (Euro-Par’18) + Workshops, vol.11339, pp.506–517, Aug. + 2018 ([pdf](https://www.arc.ics.keio.ac.jp/~matutani/papers/iwata_heteropar2018.pdf)) +- The [ruptures](https://github.com/deepcharles/ruptures) python package is also a good place to learn more about + changepoint detection (mostly offline as opposed to online but deals with similar concepts). +- A nice [blog post](https://techrando.com/2019/08/14/a-brief-introduction-to-change-point-detection-using-python/) + showing some of the other options and libraries for changepoint detection in Python. +- [Bayesian changepoint detection](https://github.com/hildensia/bayesian_changepoint_detection) library - we may explore + implementing a collector for this or integrating this approach into this collector at a future date if there is + interest and it proves computationaly feasible. +- You might also find the + Netdata [anomalies collector](https://github.com/netdata/netdata/tree/master/collectors/python.d.plugin/anomalies) + interesting. +- [Anomaly Detection](https://en.wikipedia.org/wiki/Anomaly_detection) wikipedia page. +- [Anomaly Detection YouTube playlist](https://www.youtube.com/playlist?list=PL6Zhl9mK2r0KxA6rB87oi4kWzoqGd5vp0) + maintained by [andrewm4894](https://github.com/andrewm4894/) from Netdata. +- [awesome-TS-anomaly-detection](https://github.com/rob-med/awesome-TS-anomaly-detection) Github list of useful tools, + libraries and resources. +- [Mendeley public group](https://www.mendeley.com/community/interesting-anomaly-detection-papers/) with some + interesting anomaly detection papers we have been reading. +- Good [blog post](https://www.anodot.com/blog/what-is-anomaly-detection/) from Anodot on time series anomaly detection. + Anodot also have some great whitepapers in this space too that some may find useful. +- Novelty and outlier detection in + the [scikit-learn documentation](https://scikit-learn.org/stable/modules/outlier_detection.html). + +[]() diff --git a/collectors/python.d.plugin/changefinder/changefinder.chart.py b/collectors/python.d.plugin/changefinder/changefinder.chart.py new file mode 100644 index 000000000..c18e5600a --- /dev/null +++ b/collectors/python.d.plugin/changefinder/changefinder.chart.py @@ -0,0 +1,185 @@ +# -*- coding: utf-8 -*- +# Description: changefinder netdata python.d module +# Author: andrewm4894 +# SPDX-License-Identifier: GPL-3.0-or-later + +from json import loads +import re + +from bases.FrameworkServices.UrlService import UrlService + +import numpy as np +import changefinder +from scipy.stats import percentileofscore + +update_every = 5 +disabled_by_default = True + +ORDER = [ + 'scores', + 'flags' +] + +CHARTS = { + 'scores': { + 'options': [None, 'ChangeFinder', 'score', 'Scores', 'scores', 'line'], + 'lines': [] + }, + 'flags': { + 'options': [None, 'ChangeFinder', 'flag', 'Flags', 'flags', 'stacked'], + 'lines': [] + } +} + +DEFAULT_PROTOCOL = 'http' +DEFAULT_HOST = '127.0.0.1:19999' +DEFAULT_CHARTS_REGEX = 'system.*' +DEFAULT_MODE = 'per_chart' +DEFAULT_CF_R = 0.5 +DEFAULT_CF_ORDER = 1 +DEFAULT_CF_SMOOTH = 15 +DEFAULT_CF_DIFF = False +DEFAULT_CF_THRESHOLD = 99 +DEFAULT_N_SCORE_SAMPLES = 14400 +DEFAULT_SHOW_SCORES = False + + +class Service(UrlService): + def __init__(self, configuration=None, name=None): + UrlService.__init__(self, configuration=configuration, name=name) + self.order = ORDER + self.definitions = CHARTS + self.protocol = self.configuration.get('protocol', DEFAULT_PROTOCOL) + self.host = self.configuration.get('host', DEFAULT_HOST) + self.url = '{}://{}/api/v1/allmetrics?format=json'.format(self.protocol, self.host) + self.charts_regex = re.compile(self.configuration.get('charts_regex', DEFAULT_CHARTS_REGEX)) + self.charts_to_exclude = self.configuration.get('charts_to_exclude', '').split(',') + self.mode = self.configuration.get('mode', DEFAULT_MODE) + self.n_score_samples = int(self.configuration.get('n_score_samples', DEFAULT_N_SCORE_SAMPLES)) + self.show_scores = int(self.configuration.get('show_scores', DEFAULT_SHOW_SCORES)) + self.cf_r = float(self.configuration.get('cf_r', DEFAULT_CF_R)) + self.cf_order = int(self.configuration.get('cf_order', DEFAULT_CF_ORDER)) + self.cf_smooth = int(self.configuration.get('cf_smooth', DEFAULT_CF_SMOOTH)) + self.cf_diff = bool(self.configuration.get('cf_diff', DEFAULT_CF_DIFF)) + self.cf_threshold = float(self.configuration.get('cf_threshold', DEFAULT_CF_THRESHOLD)) + self.collected_dims = {'scores': set(), 'flags': set()} + self.models = {} + self.x_latest = {} + self.scores_latest = {} + self.scores_samples = {} + + def get_score(self, x, model): + """Update the score for the model based on most recent data, flag if it's percentile passes self.cf_threshold. + """ + + # get score + if model not in self.models: + # initialise empty model if needed + self.models[model] = changefinder.ChangeFinder(r=self.cf_r, order=self.cf_order, smooth=self.cf_smooth) + # if the update for this step fails then just fallback to last known score + try: + score = self.models[model].update(x) + self.scores_latest[model] = score + except Exception as _: + score = self.scores_latest.get(model, 0) + score = 0 if np.isnan(score) else score + + # update sample scores used to calculate percentiles + if model in self.scores_samples: + self.scores_samples[model].append(score) + else: + self.scores_samples[model] = [score] + self.scores_samples[model] = self.scores_samples[model][-self.n_score_samples:] + + # convert score to percentile + score = percentileofscore(self.scores_samples[model], score) + + # flag based on score percentile + flag = 1 if score >= self.cf_threshold else 0 + + return score, flag + + def validate_charts(self, chart, data, algorithm='absolute', multiplier=1, divisor=1): + """If dimension not in chart then add it. + """ + if not self.charts: + return + + for dim in data: + if dim not in self.collected_dims[chart]: + self.collected_dims[chart].add(dim) + self.charts[chart].add_dimension([dim, dim, algorithm, multiplier, divisor]) + + for dim in list(self.collected_dims[chart]): + if dim not in data: + self.collected_dims[chart].remove(dim) + self.charts[chart].del_dimension(dim, hide=False) + + def diff(self, x, model): + """Take difference of data. + """ + x_diff = x - self.x_latest.get(model, 0) + self.x_latest[model] = x + x = x_diff + return x + + def _get_data(self): + + # pull data from self.url + raw_data = self._get_raw_data() + if raw_data is None: + return None + + raw_data = loads(raw_data) + + # filter to just the data for the charts specified + charts_in_scope = list(filter(self.charts_regex.match, raw_data.keys())) + charts_in_scope = [c for c in charts_in_scope if c not in self.charts_to_exclude] + + data_score = {} + data_flag = {} + + # process each chart + for chart in charts_in_scope: + + if self.mode == 'per_chart': + + # average dims on chart and run changefinder on that average + x = [raw_data[chart]['dimensions'][dim]['value'] for dim in raw_data[chart]['dimensions']] + x = [x for x in x if x is not None] + + if len(x) > 0: + + x = sum(x) / len(x) + x = self.diff(x, chart) if self.cf_diff else x + + score, flag = self.get_score(x, chart) + if self.show_scores: + data_score['{}_score'.format(chart)] = score * 100 + data_flag[chart] = flag + + else: + + # run changefinder on each individual dim + for dim in raw_data[chart]['dimensions']: + + chart_dim = '{}|{}'.format(chart, dim) + + x = raw_data[chart]['dimensions'][dim]['value'] + x = x if x else 0 + x = self.diff(x, chart_dim) if self.cf_diff else x + + score, flag = self.get_score(x, chart_dim) + if self.show_scores: + data_score['{}_score'.format(chart_dim)] = score * 100 + data_flag[chart_dim] = flag + + self.validate_charts('flags', data_flag) + + if self.show_scores & len(data_score) > 0: + data_score['average_score'] = sum(data_score.values()) / len(data_score) + self.validate_charts('scores', data_score, divisor=100) + + data = {**data_score, **data_flag} + + return data diff --git a/collectors/python.d.plugin/changefinder/changefinder.conf b/collectors/python.d.plugin/changefinder/changefinder.conf new file mode 100644 index 000000000..56a681f1e --- /dev/null +++ b/collectors/python.d.plugin/changefinder/changefinder.conf @@ -0,0 +1,74 @@ +# netdata python.d.plugin configuration for example +# +# This file is in YaML format. Generally the format is: +# +# name: value +# +# There are 2 sections: +# - global variables +# - one or more JOBS +# +# JOBS allow you to collect values from multiple sources. +# Each source will have its own set of charts. +# +# JOB parameters have to be indented (using spaces only, example below). + +# ---------------------------------------------------------------------- +# Global Variables +# These variables set the defaults for all JOBs, however each JOB +# may define its own, overriding the defaults. + +# update_every sets the default data collection frequency. +# If unset, the python.d.plugin default is used. +# update_every: 5 + +# priority controls the order of charts at the netdata dashboard. +# Lower numbers move the charts towards the top of the page. +# If unset, the default for python.d.plugin is used. +# priority: 60000 + +# penalty indicates whether to apply penalty to update_every in case of failures. +# Penalty will increase every 5 failed updates in a row. Maximum penalty is 10 minutes. +# penalty: yes + +# autodetection_retry sets the job re-check interval in seconds. +# The job is not deleted if check fails. +# Attempts to start the job are made once every autodetection_retry. +# This feature is disabled by default. +# autodetection_retry: 0 + +# ---------------------------------------------------------------------- +# JOBS (data collection sources) + +local: + + # A friendly name for this job. + name: 'local' + + # What host to pull data from. + host: '127.0.0.1:19999' + + # What charts to pull data for - A regex like 'system\..*|' or 'system\..*|apps.cpu|apps.mem' etc. + charts_regex: 'system\..*' + + # Charts to exclude, useful if you would like to exclude some specific charts. + # Note: should be a ',' separated string like 'chart.name,chart.name'. + charts_to_exclude: '' + + # Get ChangeFinder scores 'per_dim' or 'per_chart'. + mode: 'per_chart' + + # Default parameters that can be passed to the changefinder library. + cf_r: 0.5 + cf_order: 1 + cf_smooth: 15 + + # The percentile above which scores will be flagged. + cf_threshold: 99 + + # The number of recent scores to use when calculating the percentile of the changefinder score. + n_score_samples: 14400 + + # Set to true if you also want to chart the percentile scores in addition to the flags. + # Mainly useful for debugging or if you want to dive deeper on how the scores are evolving over time. + show_scores: false diff --git a/collectors/python.d.plugin/nvidia_smi/README.md b/collectors/python.d.plugin/nvidia_smi/README.md index 9bfb2094b..f8ce824df 100644 --- a/collectors/python.d.plugin/nvidia_smi/README.md +++ b/collectors/python.d.plugin/nvidia_smi/README.md @@ -12,7 +12,13 @@ Monitors performance metrics (memory usage, fan speed, pcie bandwidth utilizatio ## Requirements and Notes - You must have the `nvidia-smi` tool installed and your NVIDIA GPU(s) must support the tool. Mostly the newer high end models used for AI / ML and Crypto or Pro range, read more about [nvidia_smi](https://developer.nvidia.com/nvidia-system-management-interface). -- You must enable this plugin as its disabled by default due to minor performance issues. +- You must enable this plugin, as its disabled by default due to minor performance issues: + ```bash + cd /etc/netdata # Replace this path with your Netdata config directory, if different + sudo ./edit-config python.d.conf + ``` + Remove the '#' before nvidia_smi so it reads: `nvidia_smi: yes`. + - On some systems when the GPU is idle the `nvidia-smi` tool unloads and there is added latency again when it is next queried. If you are running GPUs under constant workload this isn't likely to be an issue. - Currently the `nvidia-smi` tool is being queried via cli. Updating the plugin to use the nvidia c/c++ API directly should resolve this issue. See discussion here: <https://github.com/netdata/netdata/pull/4357> - Contributions are welcome. diff --git a/collectors/python.d.plugin/python.d.conf b/collectors/python.d.plugin/python.d.conf index 61cfd6093..af58b451c 100644 --- a/collectors/python.d.plugin/python.d.conf +++ b/collectors/python.d.plugin/python.d.conf @@ -38,6 +38,7 @@ apache_cache: no # boinc: yes # ceph: yes chrony: no +# changefinder: no # couchdb: yes # dns_query_time: yes # dnsdist: yes @@ -107,3 +108,4 @@ nginx_log: no # varnish: yes # w1sensor: yes # web_log: yes +# zscores: no diff --git a/collectors/python.d.plugin/python_modules/bases/charts.py b/collectors/python.d.plugin/python_modules/bases/charts.py index 93be43d14..2526af8ce 100644 --- a/collectors/python.d.plugin/python_modules/bases/charts.py +++ b/collectors/python.d.plugin/python_modules/bases/charts.py @@ -24,7 +24,7 @@ DIMENSION_SET = "SET '{id}' = {value}\n" CHART_VARIABLE_SET = "VARIABLE CHART '{id}' = {value}\n" RUNTIME_CHART_CREATE = "CHART netdata.runtime_{job_name} '' 'Execution time for {job_name}' 'ms' 'python.d' " \ - "netdata.pythond_runtime line 145000 {update_every}\n" \ + "netdata.pythond_runtime line 145000 {update_every} '' 'python.d.plugin' '{module_name}'\n" \ "DIMENSION run_time 'run time' absolute 1 1\n" @@ -45,6 +45,7 @@ def create_runtime_chart(func): chart = RUNTIME_CHART_CREATE.format( job_name=self.name, update_every=self._runtime_counters.update_every, + module_name=self.module_name, ) safe_print(chart) ok = func(*args, **kwargs) diff --git a/collectors/python.d.plugin/smartd_log/smartd_log.chart.py b/collectors/python.d.plugin/smartd_log/smartd_log.chart.py index e4a19d411..402035f14 100644 --- a/collectors/python.d.plugin/smartd_log/smartd_log.chart.py +++ b/collectors/python.d.plugin/smartd_log/smartd_log.chart.py @@ -50,6 +50,7 @@ ATTR199 = '199' ATTR202 = '202' ATTR206 = '206' ATTR233 = '233' +ATTR249 = '249' ATTR_READ_ERR_COR = 'read-total-err-corrected' ATTR_READ_ERR_UNC = 'read-total-unc-errors' ATTR_WRITE_ERR_COR = 'write-total-err-corrected' @@ -330,7 +331,13 @@ CHARTS = { 'lines': [], 'attrs': [ATTR233], 'algo': ABSOLUTE, - } + }, + 'nand_writes_1gib': { + 'options': [None, 'NAND Writes', 'GiB', 'wear', 'smartd_log.nand_writes_1gib', 'line'], + 'lines': [], + 'attrs': [ATTR249], + 'algo': ABSOLUTE, + }, } # NOTE: 'parse_temp' decodes ATA 194 raw value. Not heavily tested. Written by @Ferroin diff --git a/collectors/python.d.plugin/zscores/Makefile.inc b/collectors/python.d.plugin/zscores/Makefile.inc new file mode 100644 index 000000000..d8b182415 --- /dev/null +++ b/collectors/python.d.plugin/zscores/Makefile.inc @@ -0,0 +1,12 @@ +# SPDX-License-Identifier: GPL-3.0-or-later + +# THIS IS NOT A COMPLETE Makefile +# IT IS INCLUDED BY ITS PARENT'S Makefile.am +# IT IS REQUIRED TO REFERENCE ALL FILES RELATIVE TO THE PARENT + +# install these files +dist_python_DATA += zscores/zscores.chart.py +dist_pythonconfig_DATA += zscores/zscores.conf + +# do not install these files, but include them in the distribution +dist_noinst_DATA += zscores/README.md zscores/Makefile.inc diff --git a/collectors/python.d.plugin/zscores/README.md b/collectors/python.d.plugin/zscores/README.md new file mode 100644 index 000000000..0b4472374 --- /dev/null +++ b/collectors/python.d.plugin/zscores/README.md @@ -0,0 +1,146 @@ +<!-- +--- +title: "zscores" +description: "Use statistical anomaly detection to narrow your focus and shorten root cause analysis." +custom_edit_url: https://github.com/netdata/netdata/edit/master/collectors/python.d.plugin/zscores/README.md +--- +--> + +# Z-Scores - basic anomaly detection for your key metrics and charts + +Smoothed, rolling [Z-Scores](https://en.wikipedia.org/wiki/Standard_score) for selected metrics or charts. + +This collector uses the [Netdata rest api](https://learn.netdata.cloud/docs/agent/web/api) to get the `mean` and `stddev` +for each dimension on specified charts over a time range (defined by `train_secs` and `offset_secs`). For each dimension +it will calculate a Z-Score as `z = (x - mean) / stddev` (clipped at `z_clip`). Scores are then smoothed over +time (`z_smooth_n`) and, if `mode: 'per_chart'`, aggregated across dimensions to a smoothed, rolling chart level Z-Score +at each time step. + +## Charts + +Two charts are produced: + +- **Z-Score** (`zscores.z`): This chart shows the calculated Z-Score per chart (or dimension if `mode='per_dim'`). +- **Z-Score >3** (`zscores.3stddev`): This chart shows a `1` if the absolute value of the Z-Score is greater than 3 or + a `0` otherwise. + +Below is an example of the charts produced by this collector and a typical example of how they would look when things +are 'normal' on the system. Most of the zscores tend to bounce randomly around a range typically between 0 to +3 (or -3 +to +3 if `z_abs: 'false'`), a few charts might stay steady at a more constant higher value depending on your +configuration and the typical workload on your system (typically those charts that do not change that much have a +smaller range of values on which to calculate a zscore and so tend to have a higher typical zscore). + +So really its a combination of the zscores values themselves plus, perhaps more importantly, how they change when +something strange occurs on your system which can be most useful. + +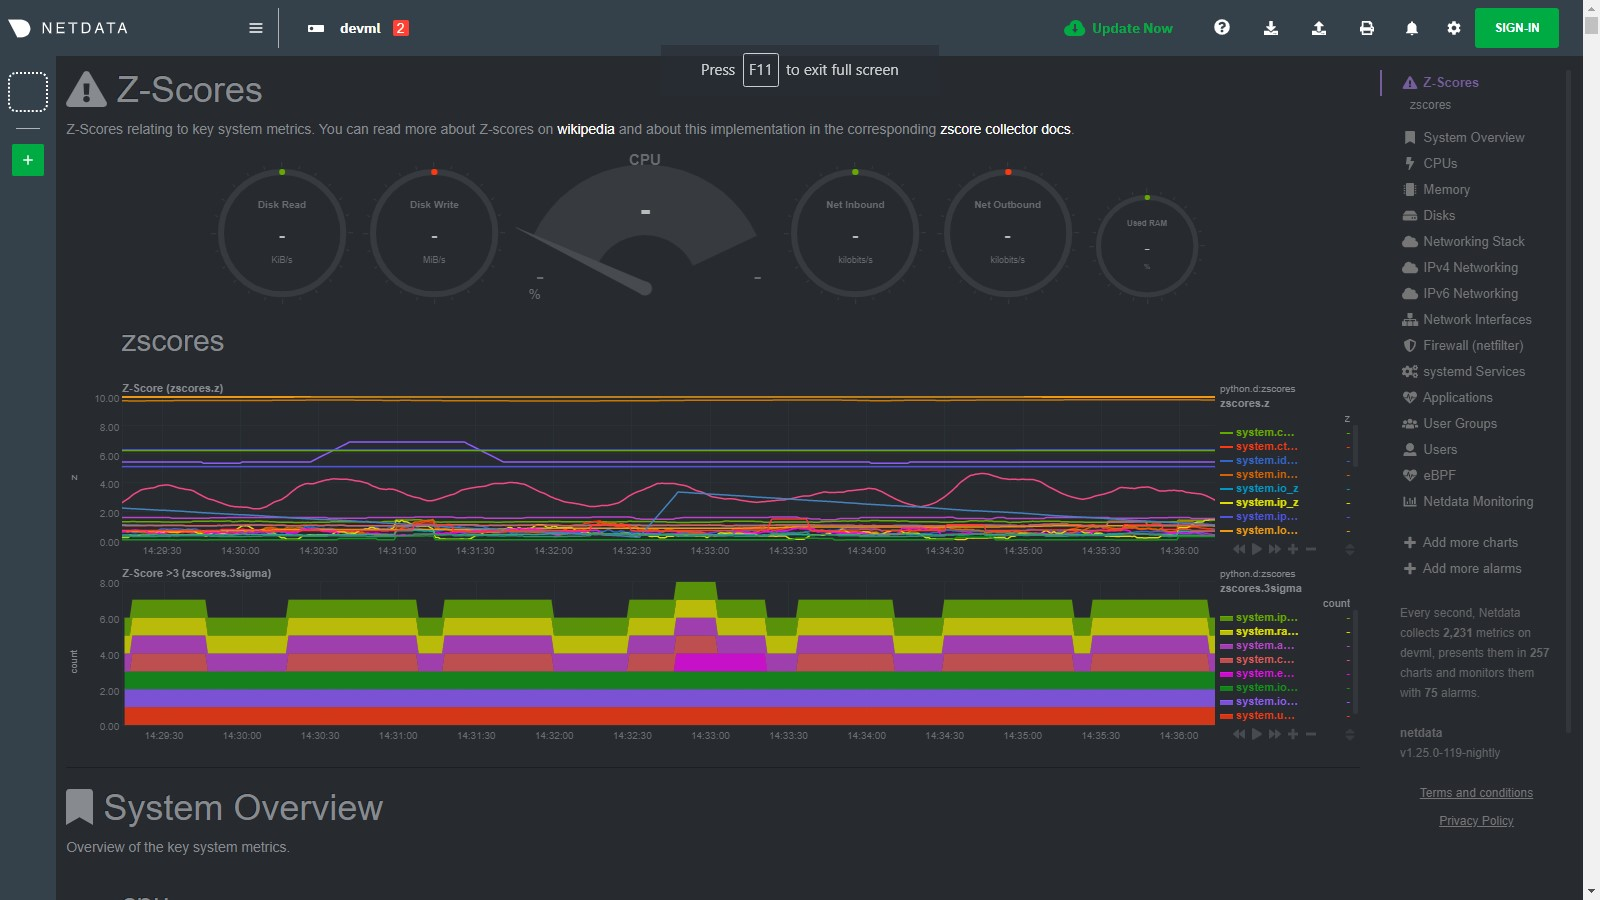 + +For example, if we go onto the system and run a command +like [`stress-ng --all 2`](https://wiki.ubuntu.com/Kernel/Reference/stress-ng) to create some stress, we see many charts +begin to have zscores that jump outside the typical range. When the absolute zscore for a chart is greater than 3 you +will see a corresponding line appear on the `zscores.3stddev` chart to make it a bit clearer what charts might be worth +looking at first (for more background information on why 3 stddev +see [here](https://en.wikipedia.org/wiki/68%E2%80%9395%E2%80%9399.7_rule#:~:text=In%20the%20empirical%20sciences%20the,99.7%25%20probability%20as%20near%20certainty.)) +. + +In the example below we basically took a sledge hammer to our system so its not suprising that lots of charts light up +after we run the stress command. In a more realistic setting you might just see a handful of charts with strange zscores +and that could be a good indication of where to look first. + +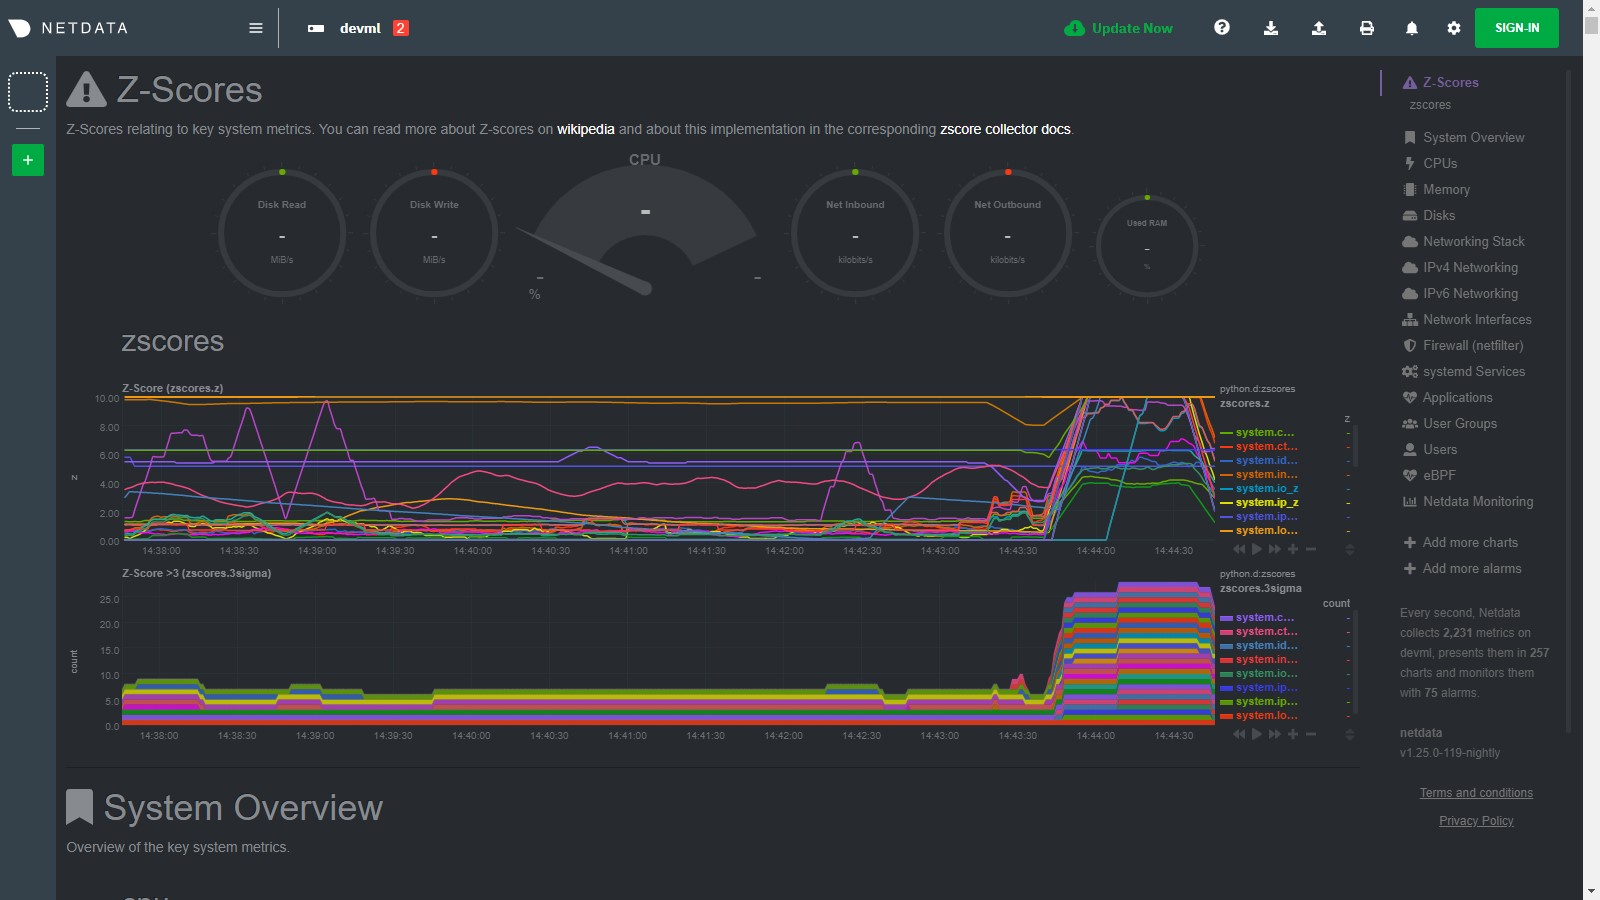 + +Then as the issue passes the zscores should settle back down into their normal range again as they are calculated in a +rolling and smoothed way (as defined by your `zscores.conf` file). + +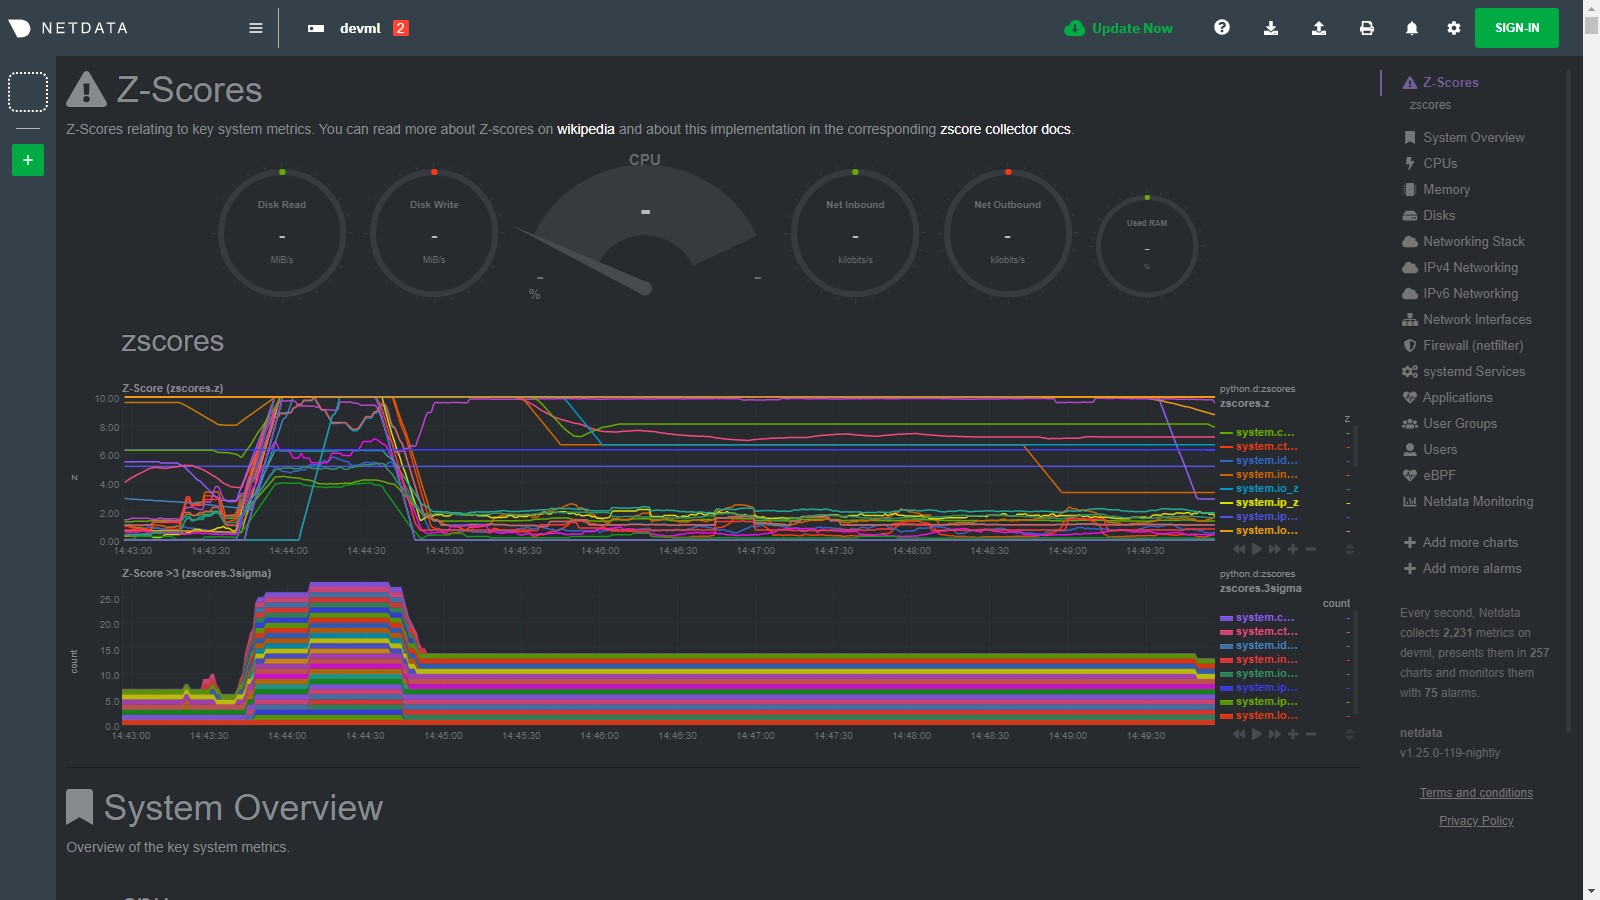 + +## Requirements + +This collector will only work with Python 3 and requires the below packages be installed. + +```bash +# become netdata user +sudo su -s /bin/bash netdata +# install required packages +pip3 install numpy pandas requests netdata-pandas==0.0.38 +``` + +## Configuration + +Install the underlying Python requirements, Enable the collector and restart Netdata. + +```bash +cd /etc/netdata/ +sudo ./edit-config python.d.conf +# Set `zscores: no` to `zscores: yes` +sudo systemctl restart netdata +``` + +The configuration for the zscores collector defines how it will behave on your system and might take some +experimentation with over time to set it optimally. Out of the box, the config comes with +some [sane defaults](https://www.netdata.cloud/blog/redefining-monitoring-netdata/) to get you started. + +If you are unsure about any of the below configuration options then it's best to just ignore all this and leave +the `zscores.conf` files alone to begin with. Then you can return to it later if you would like to tune things a bit +more once the collector is running for a while. + +Edit the `python.d/zscores.conf` configuration file using `edit-config` from the your +agent's [config directory](https://learn.netdata.cloud/guides/step-by-step/step-04#find-your-netdataconf-file), which is +usually at `/etc/netdata`. + +```bash +cd /etc/netdata # Replace this path with your Netdata config directory, if different +sudo ./edit-config python.d/zscores.conf +``` + +The default configuration should look something like this. Here you can see each parameter (with sane defaults) and some +information about each one and what it does. + +```bash +# what host to pull data from +host: '127.0.0.1:19999' +# What charts to pull data for - A regex like 'system\..*|' or 'system\..*|apps.cpu|apps.mem' etc. +charts_regex: 'system\..*' +# length of time to base calulcations off for mean and stddev +train_secs: 14400 # use last 4 hours to work out the mean and stddev for the zscore +# offset preceeding latest data to ignore when calculating mean and stddev +offset_secs: 300 # ignore last 5 minutes of data when calculating the mean and stddev +# recalculate the mean and stddev every n steps of the collector +train_every_n: 900 # recalculate mean and stddev every 15 minutes +# smooth the z score by averaging it over last n values +z_smooth_n: 15 # take a rolling average of the last 15 zscore values to reduce sensitivity to temporary 'spikes' +# cap absolute value of zscore (before smoothing) for better stability +z_clip: 10 # cap each zscore at 10 so as to avoid really large individual zscores swamping any rolling average +# set z_abs: 'true' to make all zscores be absolute values only. +z_abs: 'true' +# burn in period in which to initially calculate mean and stddev on every step +burn_in: 2 # on startup of the collector continually update the mean and stddev in case any gaps or inital calculations fail to return +# mode can be to get a zscore 'per_dim' or 'per_chart' +mode: 'per_chart' # 'per_chart' means individual dimension level smoothed zscores will be aggregated to one zscore per chart per time step +# per_chart_agg is how you aggregate from dimension to chart when mode='per_chart' +per_chart_agg: 'mean' # 'absmax' will take the max absolute value accross all dimensions but will maintain the sign. 'mean' will just average. +``` + +## Notes + +- Python 3 is required as the [`netdata-pandas`](https://github.com/netdata/netdata-pandas) package uses python async + libraries ([asks](https://pypi.org/project/asks/) and [trio](https://pypi.org/project/trio/)) to make asynchronous + calls to the netdata rest api to get the required data for each chart when calculating the mean and stddev. +- It may take a few hours or so for the collector to 'settle' into it's typical behaviour in terms of the scores you + will see in the normal running of your system. +- The zscore you see for each chart when using `mode: 'per_chart'` as actually an aggregated zscore accross all the + dimensions on the underlying chart. +- If you set `mode: 'per_dim'` then you will see a zscore for each dimension on each chart as opposed to one per chart. +- As this collector does some calculations itself in python you may want to try it out first on a test or development + system to get a sense of its performance characteristics. Most of the work in calculating the mean and stddev will be + pushed down to the underlying Netdata C libraries via the rest api. But some data wrangling and calculations are then + done using [Pandas](https://pandas.pydata.org/) and [Numpy](https://numpy.org/) within the collector itself. +- On a development n1-standard-2 (2 vCPUs, 7.5 GB memory) vm running Ubuntu 18.04 LTS and not doing any work some of the + typical performance characteristics we saw from running this collector were: + - A runtime (`netdata.runtime_zscores`) of ~50ms when doing scoring and ~500ms when recalculating the mean and + stddev. + - Typically 3%-3.5% cpu usage from scoring, jumping to ~35% for one second when recalculating the mean and stddev. + - About ~50mb of ram (`apps.mem`) being continually used by the `python.d.plugin`. +- If you activate this collector on a fresh node, it might take a little while to build up enough data to calculate a + proper zscore. So until you actually have `train_secs` of available data the mean and stddev calculated will be subject + to more noise.
\ No newline at end of file diff --git a/collectors/python.d.plugin/zscores/zscores.chart.py b/collectors/python.d.plugin/zscores/zscores.chart.py new file mode 100644 index 000000000..48397d8dd --- /dev/null +++ b/collectors/python.d.plugin/zscores/zscores.chart.py @@ -0,0 +1,146 @@ +# -*- coding: utf-8 -*- +# Description: zscores netdata python.d module +# Author: andrewm4894 +# SPDX-License-Identifier: GPL-3.0-or-later + +from datetime import datetime +import re + +import requests +import numpy as np +import pandas as pd + +from bases.FrameworkServices.SimpleService import SimpleService +from netdata_pandas.data import get_data, get_allmetrics + +priority = 60000 +update_every = 5 +disabled_by_default = True + +ORDER = [ + 'z', + '3stddev' +] + +CHARTS = { + 'z': { + 'options': ['z', 'Z Score', 'z', 'Z Score', 'z', 'line'], + 'lines': [] + }, + '3stddev': { + 'options': ['3stddev', 'Z Score >3', 'count', '3 Stddev', '3stddev', 'stacked'], + 'lines': [] + }, +} + + +class Service(SimpleService): + def __init__(self, configuration=None, name=None): + SimpleService.__init__(self, configuration=configuration, name=name) + self.host = self.configuration.get('host', '127.0.0.1:19999') + self.charts_regex = re.compile(self.configuration.get('charts_regex', 'system.*')) + self.charts_to_exclude = self.configuration.get('charts_to_exclude', '').split(',') + self.charts_in_scope = [ + c for c in + list(filter(self.charts_regex.match, + requests.get(f'http://{self.host}/api/v1/charts').json()['charts'].keys())) + if c not in self.charts_to_exclude + ] + self.train_secs = self.configuration.get('train_secs', 14400) + self.offset_secs = self.configuration.get('offset_secs', 300) + self.train_every_n = self.configuration.get('train_every_n', 900) + self.z_smooth_n = self.configuration.get('z_smooth_n', 15) + self.z_clip = self.configuration.get('z_clip', 10) + self.z_abs = bool(self.configuration.get('z_abs', True)) + self.burn_in = self.configuration.get('burn_in', 2) + self.mode = self.configuration.get('mode', 'per_chart') + self.per_chart_agg = self.configuration.get('per_chart_agg', 'mean') + self.order = ORDER + self.definitions = CHARTS + self.collected_dims = {'z': set(), '3stddev': set()} + self.df_mean = pd.DataFrame() + self.df_std = pd.DataFrame() + self.df_z_history = pd.DataFrame() + + def check(self): + _ = get_allmetrics(self.host, self.charts_in_scope, wide=True, col_sep='.') + return True + + def validate_charts(self, chart, data, algorithm='absolute', multiplier=1, divisor=1): + """If dimension not in chart then add it. + """ + for dim in data: + if dim not in self.collected_dims[chart]: + self.collected_dims[chart].add(dim) + self.charts[chart].add_dimension([dim, dim, algorithm, multiplier, divisor]) + + for dim in list(self.collected_dims[chart]): + if dim not in data: + self.collected_dims[chart].remove(dim) + self.charts[chart].del_dimension(dim, hide=False) + + def train_model(self): + """Calculate the mean and stddev for all relevant metrics and store them for use in calulcating zscore at each timestep. + """ + before = int(datetime.now().timestamp()) - self.offset_secs + after = before - self.train_secs + + self.df_mean = get_data( + self.host, self.charts_in_scope, after, before, points=10, group='average', col_sep='.' + ).mean().to_frame().rename(columns={0: "mean"}) + + self.df_std = get_data( + self.host, self.charts_in_scope, after, before, points=10, group='stddev', col_sep='.' + ).mean().to_frame().rename(columns={0: "std"}) + + def create_data(self, df_allmetrics): + """Use x, mean, stddev to generate z scores and 3stddev flags via some pandas manipulation. + Returning two dictionaries of dimensions and measures, one for each chart. + + :param df_allmetrics <pd.DataFrame>: pandas dataframe with latest data from api/v1/allmetrics. + :return: (<dict>,<dict>) tuple of dictionaries, one for zscores and the other for a flag if abs(z)>3. + """ + # calculate clipped z score for each available metric + df_z = pd.concat([self.df_mean, self.df_std, df_allmetrics], axis=1, join='inner') + df_z['z'] = ((df_z['value'] - df_z['mean']) / df_z['std']).clip(-self.z_clip, self.z_clip).fillna(0) * 100 + if self.z_abs: + df_z['z'] = df_z['z'].abs() + + # append last z_smooth_n rows of zscores to history table in wide format + self.df_z_history = self.df_z_history.append( + df_z[['z']].reset_index().pivot_table(values='z', columns='index'), sort=True + ).tail(self.z_smooth_n) + + # get average zscore for last z_smooth_n for each metric + df_z_smooth = self.df_z_history.melt(value_name='z').groupby('index')['z'].mean().to_frame() + df_z_smooth['3stddev'] = np.where(abs(df_z_smooth['z']) > 300, 1, 0) + data_z = df_z_smooth['z'].add_suffix('_z').to_dict() + + # aggregate to chart level if specified + if self.mode == 'per_chart': + df_z_smooth['chart'] = ['.'.join(x[0:2]) + '_z' for x in df_z_smooth.index.str.split('.').to_list()] + if self.per_chart_agg == 'absmax': + data_z = \ + list(df_z_smooth.groupby('chart').agg({'z': lambda x: max(x, key=abs)})['z'].to_dict().values())[0] + else: + data_z = list(df_z_smooth.groupby('chart').agg({'z': [self.per_chart_agg]})['z'].to_dict().values())[0] + + data_3stddev = {} + for k in data_z: + data_3stddev[k.replace('_z', '')] = 1 if abs(data_z[k]) > 300 else 0 + + return data_z, data_3stddev + + def get_data(self): + + if self.runs_counter <= self.burn_in or self.runs_counter % self.train_every_n == 0: + self.train_model() + + data_z, data_3stddev = self.create_data( + get_allmetrics(self.host, self.charts_in_scope, wide=True, col_sep='.').transpose()) + data = {**data_z, **data_3stddev} + + self.validate_charts('z', data_z, divisor=100) + self.validate_charts('3stddev', data_3stddev) + + return data diff --git a/collectors/python.d.plugin/zscores/zscores.conf b/collectors/python.d.plugin/zscores/zscores.conf new file mode 100644 index 000000000..fab18c787 --- /dev/null +++ b/collectors/python.d.plugin/zscores/zscores.conf @@ -0,0 +1,108 @@ +# netdata python.d.plugin configuration for example +# +# This file is in YaML format. Generally the format is: +# +# name: value +# +# There are 2 sections: +# - global variables +# - one or more JOBS +# +# JOBS allow you to collect values from multiple sources. +# Each source will have its own set of charts. +# +# JOB parameters have to be indented (using spaces only, example below). + +# ---------------------------------------------------------------------- +# Global Variables +# These variables set the defaults for all JOBs, however each JOB +# may define its own, overriding the defaults. + +# update_every sets the default data collection frequency. +# If unset, the python.d.plugin default is used. +update_every: 5 + +# priority controls the order of charts at the netdata dashboard. +# Lower numbers move the charts towards the top of the page. +# If unset, the default for python.d.plugin is used. +# priority: 60000 + +# penalty indicates whether to apply penalty to update_every in case of failures. +# Penalty will increase every 5 failed updates in a row. Maximum penalty is 10 minutes. +# penalty: yes + +# autodetection_retry sets the job re-check interval in seconds. +# The job is not deleted if check fails. +# Attempts to start the job are made once every autodetection_retry. +# This feature is disabled by default. +# autodetection_retry: 0 + +# ---------------------------------------------------------------------- +# JOBS (data collection sources) +# +# The default JOBS share the same *name*. JOBS with the same name +# are mutually exclusive. Only one of them will be allowed running at +# any time. This allows autodetection to try several alternatives and +# pick the one that works. +# +# Any number of jobs is supported. +# +# All python.d.plugin JOBS (for all its modules) support a set of +# predefined parameters. These are: +# +# job_name: +# name: myname # the JOB's name as it will appear at the +# # dashboard (by default is the job_name) +# # JOBs sharing a name are mutually exclusive +# update_every: 1 # the JOB's data collection frequency +# priority: 60000 # the JOB's order on the dashboard +# penalty: yes # the JOB's penalty +# autodetection_retry: 0 # the JOB's re-check interval in seconds +# +# Additionally to the above, example also supports the following: +# +# - none +# +# ---------------------------------------------------------------------- +# AUTO-DETECTION JOBS +# only one of them will run (they have the same name) + +local: + name: 'local' + + # what host to pull data from + host: '127.0.0.1:19999' + + # what charts to pull data for - A regex like 'system\..*|' or 'system\..*|apps.cpu|apps.mem' etc. + charts_regex: 'system\..*' + + # Charts to exclude, useful if you would like to exclude some specific charts. + # Note: should be a ',' separated string like 'chart.name,chart.name'. + charts_to_exclude: 'system.uptime' + + # length of time to base calculations off for mean and stddev + train_secs: 14400 # use last 4 hours to work out the mean and stddev for the zscore + + # offset preceeding latest data to ignore when calculating mean and stddev + offset_secs: 300 # ignore last 5 minutes of data when calculating the mean and stddev + + # recalculate the mean and stddev every n steps of the collector + train_every_n: 900 # recalculate mean and stddev every 15 minutes + + # smooth the z score by averaging it over last n values + z_smooth_n: 15 # take a rolling average of the last 15 zscore values to reduce sensitivity to temporary 'spikes' + + # cap absolute value of zscore (before smoothing) for better stability + z_clip: 10 # cap each zscore at 10 so as to avoid really large individual zscores swamping any rolling average + + # set z_abs: 'true' to make all zscores be absolute values only. + z_abs: 'true' + + # burn in period in which to initially calculate mean and stddev on every step + burn_in: 2 # on startup of the collector continually update the mean and stddev in case any gaps or inital calculations fail to return + + # mode can be to get a zscore 'per_dim' or 'per_chart' + mode: 'per_chart' # 'per_chart' means individual dimension level smoothed zscores will be aggregated to one zscore per chart per time step + + # per_chart_agg is how you aggregate from dimension to chart when mode='per_chart' + per_chart_agg: 'mean' # 'absmax' will take the max absolute value accross all dimensions but will maintain the sign. 'mean' will just average. diff --git a/collectors/slabinfo.plugin/slabinfo.c b/collectors/slabinfo.plugin/slabinfo.c index 00e0d3913..863f440e4 100644 --- a/collectors/slabinfo.plugin/slabinfo.c +++ b/collectors/slabinfo.plugin/slabinfo.c @@ -126,7 +126,7 @@ static struct slabinfo *get_slabstruct(const char *name) { } } - // Search it from the begining to the last position we used + // Search it from the beginning to the last position we used for (s = slabinfo_root; s != slabinfo_last_used; s = s->next) { if (hash == s->hash && !strcmp(name, s->name)) { slabdebug("<-- Found existing slabstruct after root %s", slabinfo_root->name); @@ -141,7 +141,7 @@ static struct slabinfo *get_slabstruct(const char *name) { s->name = strdupz(name); s->hash = hash; - // Add it to the current postion + // Add it to the current position if (slabinfo_root) { slabdebug("<-- Creating new slabstruct after %s", slabinfo_last_used->name); s->next = slabinfo_last_used->next; diff --git a/collectors/statsd.plugin/README.md b/collectors/statsd.plugin/README.md index 0e9c954fc..f3050cebb 100644 --- a/collectors/statsd.plugin/README.md +++ b/collectors/statsd.plugin/README.md @@ -19,6 +19,17 @@ Since statsd is embedded in Netdata, it means you now have a statsd server embed Netdata statsd is fast. It can collect more than **1.200.000 metrics per second** on modern hardware, more than **200Mbps of sustained statsd traffic**, using 1 CPU core. The implementation uses two threads: one thread collects metrics, another one updates the charts from the collected data. +# Available StatsD collectors + +Netdata ships with collectors implemented using the StatsD collector. They are configuration files (as you will read bellow), but they function as a collector, in the sense that configuration file organize the metrics of a data source into pre-defined charts. + +On these charts, we can have alarms as with any metric and chart. + +- [K6 load testing tool](https://k6.io) + - **Description:** k6 is a developer-centric, free and open-source load testing tool built for making performance testing a productive and enjoyable experience. + - [Documentation](/collectors/statsd.plugin/k6.md) + - [Configuration](https://github.com/netdata/netdata/blob/master/collectors/statsd.plugin/k6.conf) + ## Metrics supported by Netdata Netdata fully supports the StatsD protocol. All StatsD client libraries can be used with Netdata too. diff --git a/collectors/statsd.plugin/k6.conf b/collectors/statsd.plugin/k6.conf index 775f53060..3bef00ca1 100644 --- a/collectors/statsd.plugin/k6.conf +++ b/collectors/statsd.plugin/k6.conf @@ -6,6 +6,7 @@ [dictionary] http_reqs = HTTP Requests + http_reqs_failed = Failed HTTP Requests vus = Virtual active users vus_max = max Virtual active users iteration_duration = iteration duration @@ -19,7 +20,7 @@ http_req_receiving = Receiving HTTP requests http_req_waiting = Waiting HTTP requests http_req_duration_median = Median HTTP req duration - http_req_duration_average = AVG HTTP req duration + http_req_duration_average = Avg HTTP req duration http_req_duration = HTTP req duration http_req_duration_max = max HTTP req duration http_req_duration_min = min HTTP req duration @@ -30,13 +31,22 @@ [http_reqs] name = http_reqs - title = HTTP Requests + title = HTTP Requests rate family = http requests context = k6.http_requests dimension = k6.http_reqs http_reqs last 1 1 sum type = line units = requests/s +[http_reqs] + name = http_reqs_failed + title = Failed HTTP Requests rate + family = http requests + context = k6.http_requests + dimension = k6.http_reqs_failed http_reqs_failed last 1 1 sum + type = line + units = requests/s + [vus] name = vus title = Virtual Active Users @@ -53,7 +63,7 @@ dimension = k6.iteration_duration iteration_duration last 1 1 dimension = k6.iteration_duration iteration_duration_max max 1 1 dimension = k6.iteration_duration iteration_duration_min min 1 1 - dimension = k6.iteration_duration iteration_duration_avg avg 1 1 + dimension = k6.iteration_duration iteration_duration_avg average 1 1 type = line units = s @@ -74,31 +84,27 @@ units = kb/s type = area -[http_req_status] - name = http_req_status - title = Time spent on HTTP - family = http requests - dimension = k6.http_req_blocked http_req_blocked last 1 1 - dimension = k6.http_req_connecting http_req_connecting last 1 1 - units = ms - type = line - [http_req_duration_types] name = http_req_duration_types - title = Time spent on HTTP connection states + title = HTTP Requests total duration family = http requests dimension = k6.http_req_sending http_req_sending last 1 1 dimension = k6.http_req_waiting http_req_waiting last 1 1 dimension = k6.http_req_receiving http_req_receiving last 1 1 + dimension = k6.http_req_blocked http_req_blocked last 1 1 + dimension = k6.http_req_connecting http_req_connecting last 1 1 units = ms type = stacked [http_req_duration] name = http_req_duration - title = Total time for HTTP request + title = HTTP duration metrics family = http requests dimension = k6.http_req_duration http_req_duration_median median 1 1 dimension = k6.http_req_duration http_req_duration_max max 1 1 - dimension = k6.http_req_duration http_req_duration_average avg 1 1 + dimension = k6.http_req_duration http_req_duration_average average 1 1 dimension = k6.http_req_duration http_req_duration_min min 1 1 - dimension = k6.http_req_duration httP_req_duration_p95 percentile 1 1 + dimension = k6.http_req_duration http_req_duration_p95 percentile 1 1 + dimension = k6.http_req_duration http_req_duration last 1 1 + units = ms + type = line diff --git a/collectors/statsd.plugin/k6.md b/collectors/statsd.plugin/k6.md new file mode 100644 index 000000000..4f8c70133 --- /dev/null +++ b/collectors/statsd.plugin/k6.md @@ -0,0 +1,76 @@ +<!-- +title: "K6 load test monitoring with Netdata" +custom_edit_url: https://github.com/netdata/netdata/edit/master/collectors/statsd.plugin/k6.md + +sidebar_label: "K6 Load Testing" +--> + +# K6 Load Testing monitoring with Netdata + +Monitors the impact of load testing experiments performed with [K6](https://k6.io/). + +You can read more about the metrics that K6 sends in the [K6 documentation](https://k6.io/docs/using-k6/metrics/). + +## Requirements + +- When running the k6 experiment, specify a [StatsD output](https://k6.io/docs/results-visualization/statsd/). + - Tip: K6 currently supports tags only with [datadog output](https://k6.io/docs/results-visualization/datadog/), which is in essence StatsD. Netdata can be used with both. + +## Metrics + +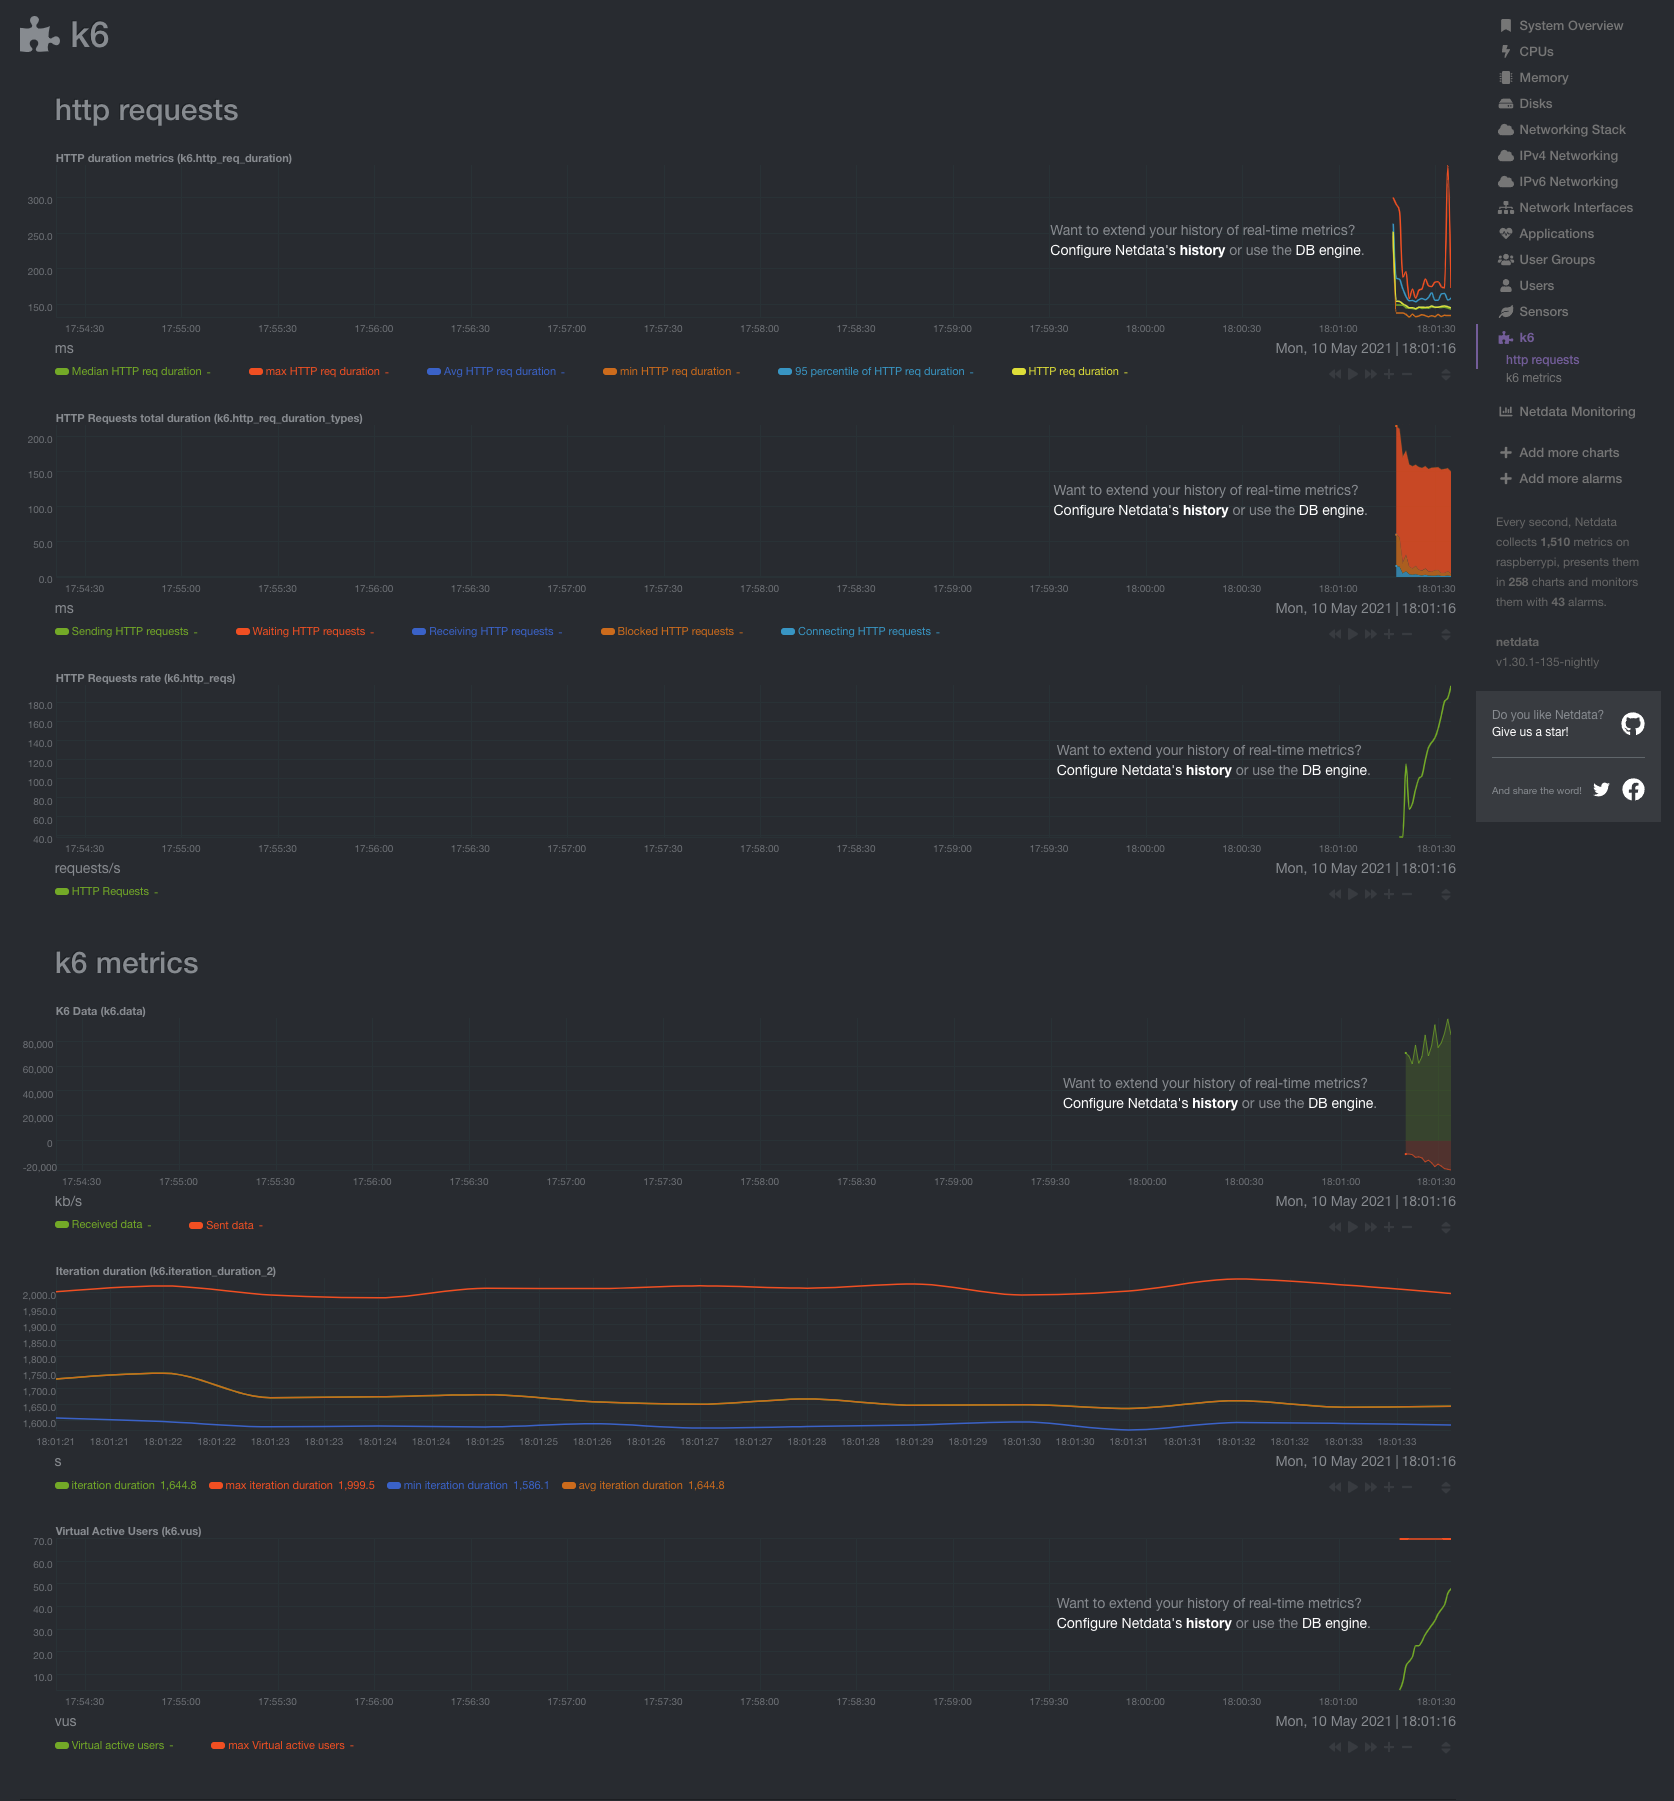 + + +### HTTP Requests + +Number of HTTP requests that K6 generates, per second. + +### Failed HTTP Requests + +Number of failed HTTP requests that K6 generates, per second. + +### Virtual Active Users +Current number of active virtual users. + +### Iteration Duration + +The time it took K6 to complete one full iteration of the main function. + +### Dropped Iterations + +The number of iterations that could not be started either due to lack of Virtual Users or lack of time. + +### Data + +The amount of data received and sent. + +### TTP Requests total duration + +The total duration it took for a round-trip of an HTTP request. It includes: +- Blocked HTTP requests: time spent blocked before initiating the request +- Connecting HTTP requests: time spent establishing TCP connection to the remote host +- Sending HTTP requests: time spent sending data to the remote host +- Receiving HTTP requests: time spent receiving data from the remote host +- Waiting HTTP requests: time spent waiting for response from the remote host + +### HTTP duration metrics + +Different metrics on the HTTP request as defined by K6. The HTTP request duration is defined by K6 as: `HTTP sending request` + `HTTP receiving request` + `HTTP waiting request`. + +Metrics: +- Median +- Average +- Max +- Min +- 95th percentile +- absolute (the value as it is, without any computation) + +## Configuration + +The collector is preconfigured and defined in `statsd.plugin/k6.conf`. + +Due to being a StatsD collector, you only need to define the configuration file and then send data to Netdata using the StatsD protocol. + +If Netdata is running on the same machine as K6, no further configuration is required. Otherwise, you will have to [point K6](https://k6.io/docs/results-visualization/statsd/) to your node and make sure that the K6 process can reach Netdata. + +The default namespace that is used in the configuration is `k6`. If you change it in K6, you will have to change it as well in the configuration file `k6.conf`. diff --git a/collectors/statsd.plugin/statsd.c b/collectors/statsd.plugin/statsd.c index e89585719..e30cc6e2b 100644 --- a/collectors/statsd.plugin/statsd.c +++ b/collectors/statsd.plugin/statsd.c @@ -153,7 +153,7 @@ typedef struct statsd_index { STATSD_METRIC *first; // the linked list of metrics (new metrics are added in front) STATSD_METRIC *first_useful; // the linked list of useful metrics (new metrics are added in front) - STATSD_FIRST_PTR_MUTEX; // when mutli-threading is enabled, a lock to protect the linked list + STATSD_FIRST_PTR_MUTEX; // when multi-threading is enabled, a lock to protect the linked list STATS_METRIC_OPTIONS default_options; // default options for all metrics in this index } STATSD_INDEX; @@ -182,7 +182,7 @@ typedef struct statsd_app_chart_dimension { SIMPLE_PATTERN *metric_pattern; // set when the 'metric' is a simple pattern - collected_number multiplier; // the multipler of the dimension + collected_number multiplier; // the multiplier of the dimension collected_number divisor; // the divisor of the dimension RRDDIM_FLAGS flags; // the RRDDIM flags for this dimension @@ -1340,7 +1340,7 @@ static int statsd_readfile(const char *filename, STATSD_APP *app, STATSD_APP_CHA char *dim_name = words[i++]; char *type = words[i++]; - char *multipler = words[i++]; + char *multiplier = words[i++]; char *divisor = words[i++]; char *options = words[i++]; @@ -1371,7 +1371,7 @@ static int statsd_readfile(const char *filename, STATSD_APP *app, STATSD_APP_CHA , chart , metric_name , dim_name - , (multipler && *multipler)?str2l(multipler):1 + , (multiplier && *multiplier)?str2l(multiplier):1 , (divisor && *divisor)?str2l(divisor):1 , flags , string2valuetype(type, line, filename) @@ -2418,7 +2418,7 @@ void *statsd_main(void *ptr) { , NULL , "statsd" , "netdata.statsd_cpu" - , "NetData statsd charting thread CPU usage" + , "Netdata statsd charting thread CPU usage" , "milliseconds/s" , PLUGIN_STATSD_NAME , "stats" diff --git a/collectors/tc.plugin/plugin_tc.c b/collectors/tc.plugin/plugin_tc.c index 26affee09..0197db073 100644 --- a/collectors/tc.plugin/plugin_tc.c +++ b/collectors/tc.plugin/plugin_tc.c @@ -558,7 +558,7 @@ static inline void tc_device_commit(struct tc_device *d) { , "tokens" , PLUGIN_TC_NAME , NULL - , NETDATA_CHART_PRIO_TC_QOS_TOCKENS + , NETDATA_CHART_PRIO_TC_QOS_TOKENS , localhost->rrd_update_every , RRDSET_TYPE_LINE ); @@ -614,7 +614,7 @@ static inline void tc_device_commit(struct tc_device *d) { , "ctokens" , PLUGIN_TC_NAME , NULL - , NETDATA_CHART_PRIO_TC_QOS_CTOCKENS + , NETDATA_CHART_PRIO_TC_QOS_CTOKENS , localhost->rrd_update_every , RRDSET_TYPE_LINE ); @@ -1082,7 +1082,7 @@ void *tc_main(void *ptr) { , NULL , "tc.helper" , NULL - , "NetData TC CPU usage" + , "Netdata TC CPU usage" , "milliseconds/s" , PLUGIN_TC_NAME , NULL @@ -1109,7 +1109,7 @@ void *tc_main(void *ptr) { , NULL , "tc.helper" , NULL - , "NetData TC script execution" + , "Netdata TC script execution" , "milliseconds/run" , PLUGIN_TC_NAME , NULL diff --git a/collectors/timex.plugin/Makefile.am b/collectors/timex.plugin/Makefile.am new file mode 100644 index 000000000..161784b8f --- /dev/null +++ b/collectors/timex.plugin/Makefile.am @@ -0,0 +1,8 @@ +# SPDX-License-Identifier: GPL-3.0-or-later + +AUTOMAKE_OPTIONS = subdir-objects +MAINTAINERCLEANFILES = $(srcdir)/Makefile.in + +dist_noinst_DATA = \ + README.md \ + $(NULL) diff --git a/collectors/timex.plugin/README.md b/collectors/timex.plugin/README.md new file mode 100644 index 000000000..79947441f --- /dev/null +++ b/collectors/timex.plugin/README.md @@ -0,0 +1,29 @@ +<!-- +title: "timex.plugin" +description: "Monitor the system clock synchronization state." +custom_edit_url: https://github.com/netdata/netdata/edit/master/collectors/timex.plugin/README.md +--> + +# timex.plugin + +This plugin monitors the system clock synchronization state on Linux nodes. + +This plugin creates two charts: + +- System clock synchronization state +- Computed time offset between local system and reference clock + +## Configuration + +Edit the `netdata.conf` configuration file using [`edit-config`](/docs/configure/nodes.md#use-edit-config-to-edit-configuration-files) from the [Netdata config directory](/docs/configure/nodes.md#the-netdata-config-directory), which is typically at `/etc/netdata`. + +Scroll down to the `[plugin:timex]` section to find the available options: + +``` +[plugin:timex] + # update every = 1 + # clock synchronization state = yes + # time offset = yes +``` + +[](<>) diff --git a/collectors/timex.plugin/plugin_timex.c b/collectors/timex.plugin/plugin_timex.c new file mode 100644 index 000000000..b3e722a4c --- /dev/null +++ b/collectors/timex.plugin/plugin_timex.c @@ -0,0 +1,176 @@ +// SPDX-License-Identifier: GPL-3.0-or-later + +#include "plugin_timex.h" +#include "sys/timex.h" + +#define PLUGIN_TIMEX_NAME "timex.plugin" + +#define CONFIG_SECTION_TIMEX "plugin:timex" + +static void timex_main_cleanup(void *ptr) +{ + struct netdata_static_thread *static_thread = (struct netdata_static_thread *)ptr; + static_thread->enabled = NETDATA_MAIN_THREAD_EXITING; + + info("cleaning up..."); + + static_thread->enabled = NETDATA_MAIN_THREAD_EXITED; +} + +void *timex_main(void *ptr) +{ + netdata_thread_cleanup_push(timex_main_cleanup, ptr); + + int vdo_cpu_netdata = config_get_boolean(CONFIG_SECTION_TIMEX, "timex plugin resource charts", CONFIG_BOOLEAN_YES); + + int update_every = (int)config_get_number(CONFIG_SECTION_TIMEX, "update every", 10); + if (update_every < localhost->rrd_update_every) + update_every = localhost->rrd_update_every; + + int do_sync = config_get_boolean(CONFIG_SECTION_TIMEX, "clock synchronization state", CONFIG_BOOLEAN_YES); + int do_offset = config_get_boolean(CONFIG_SECTION_TIMEX, "time offset", CONFIG_BOOLEAN_YES); + + if (unlikely(do_sync == CONFIG_BOOLEAN_NO && do_offset == CONFIG_BOOLEAN_NO)) { + info("No charts to show"); + goto exit; + } + + usec_t step = update_every * USEC_PER_SEC; + heartbeat_t hb; + heartbeat_init(&hb); + while (!netdata_exit) { + usec_t duration = heartbeat_monotonic_dt_to_now_usec(&hb); + heartbeat_next(&hb, step); + + struct timex timex_buf = {}; + int sync_state = 0; + sync_state = adjtimex(&timex_buf); + + collected_number divisor = USEC_PER_MS; + if (timex_buf.status & STA_NANO) + divisor = NSEC_PER_MSEC; + + // ---------------------------------------------------------------- + + if (do_sync) { + static RRDSET *st_sync_state = NULL; + static RRDDIM *rd_sync_state; + + if (unlikely(!st_sync_state)) { + st_sync_state = rrdset_create_localhost( + "system", + "clock_sync_state", + NULL, + "clock synchronization", + NULL, + "System Clock Synchronization State", + "state", + PLUGIN_TIMEX_NAME, + NULL, + NETDATA_CHART_PRIO_CLOCK_SYNC_STATE, + update_every, + RRDSET_TYPE_LINE); + + rd_sync_state = rrddim_add(st_sync_state, "state", NULL, 1, 1, RRD_ALGORITHM_ABSOLUTE); + } else { + rrdset_next(st_sync_state); + } + + rrddim_set_by_pointer(st_sync_state, rd_sync_state, sync_state != TIME_ERROR ? 1 : 0); + rrdset_done(st_sync_state); + } + + if (do_sync) { + static RRDSET *st_offset = NULL; + static RRDDIM *rd_offset; + + if (unlikely(!st_offset)) { + st_offset = rrdset_create_localhost( + "system", + "clock_sync_offset", + NULL, + "clock synchronization", + NULL, + "Computed Time Offset Between Local System and Reference Clock", + "milliseconds", + PLUGIN_TIMEX_NAME, + NULL, + NETDATA_CHART_PRIO_CLOCK_SYNC_OFFSET, + update_every, + RRDSET_TYPE_LINE); + + rd_offset = rrddim_add(st_offset, "offset", NULL, 1, divisor, RRD_ALGORITHM_ABSOLUTE); + } else { + rrdset_next(st_offset); + } + + rrddim_set_by_pointer(st_offset, rd_offset, timex_buf.offset); + rrdset_done(st_offset); + } + + if (vdo_cpu_netdata) { + static RRDSET *stcpu_thread = NULL, *st_duration = NULL; + static RRDDIM *rd_user = NULL, *rd_system = NULL, *rd_duration = NULL; + + // ---------------------------------------------------------------- + + struct rusage thread; + getrusage(RUSAGE_THREAD, &thread); + + if (unlikely(!stcpu_thread)) { + stcpu_thread = rrdset_create_localhost( + "netdata", + "plugin_timex", + NULL, + "timex", + NULL, + "Netdata Timex Plugin CPU usage", + "milliseconds/s", + PLUGIN_TIMEX_NAME, + NULL, + NETDATA_CHART_PRIO_NETDATA_TIMEX, + update_every, + RRDSET_TYPE_STACKED); + + rd_user = rrddim_add(stcpu_thread, "user", NULL, 1, USEC_PER_MS, RRD_ALGORITHM_INCREMENTAL); + rd_system = rrddim_add(stcpu_thread, "system", NULL, 1, USEC_PER_MS, RRD_ALGORITHM_INCREMENTAL); + } else { + rrdset_next(stcpu_thread); + } + + rrddim_set_by_pointer(stcpu_thread, rd_user, thread.ru_utime.tv_sec * USEC_PER_SEC + thread.ru_utime.tv_usec); + rrddim_set_by_pointer( + stcpu_thread, rd_system, thread.ru_stime.tv_sec * USEC_PER_SEC + thread.ru_stime.tv_usec); + rrdset_done(stcpu_thread); + + // ---------------------------------------------------------------- + + if (unlikely(!st_duration)) { + st_duration = rrdset_create_localhost( + "netdata", + "plugin_timex_dt", + NULL, + "timex", + NULL, + "Netdata Timex Plugin Duration", + "milliseconds/run", + PLUGIN_TIMEX_NAME, + NULL, + NETDATA_CHART_PRIO_NETDATA_TIMEX + 1, + update_every, + RRDSET_TYPE_AREA); + + rd_duration = rrddim_add(st_duration, "duration", NULL, 1, USEC_PER_MS, RRD_ALGORITHM_ABSOLUTE); + } else { + rrdset_next(st_duration); + } + + rrddim_set_by_pointer(st_duration, rd_duration, duration); + rrdset_done(st_duration); + } + } + +exit: + netdata_thread_cleanup_pop(1); + return NULL; +} diff --git a/collectors/timex.plugin/plugin_timex.h b/collectors/timex.plugin/plugin_timex.h new file mode 100644 index 000000000..6025641a3 --- /dev/null +++ b/collectors/timex.plugin/plugin_timex.h @@ -0,0 +1,29 @@ +// SPDX-License-Identifier: GPL-3.0-or-later + +#ifndef NETDATA_PLUGIN_TIMEX_H +#define NETDATA_PLUGIN_TIMEX_H + +#include "../../daemon/common.h" + +#if (TARGET_OS == OS_LINUX) + +#define NETDATA_PLUGIN_HOOK_LINUX_TIMEX \ + { \ + .name = "PLUGIN[timex]", \ + .config_section = CONFIG_SECTION_PLUGINS, \ + .config_name = "timex", \ + .enabled = 1, \ + .thread = NULL, \ + .init_routine = NULL, \ + .start_routine = timex_main \ + }, + +extern void *timex_main(void *ptr); + +#else // (TARGET_OS == OS_LINUX) + +#define NETDATA_PLUGIN_HOOK_LINUX_TIMEX + +#endif // (TARGET_OS == OS_LINUX) + +#endif //NETDATA_PLUGIN_TIMEX_H |