
diff options
| author | Daniel Baumann <daniel.baumann@progress-linux.org> | 2022-04-14 18:12:14 +0000 |
|---|---|---|
| committer | Daniel Baumann <daniel.baumann@progress-linux.org> | 2022-04-14 18:12:14 +0000 |
| commit | bb50acdcb8073654ea667b8c0272e335bd43f844 (patch) | |
| tree | 1e00c8a29871426f8182658928dcb62e42d57ce8 /collectors | |
| parent | Releasing debian version 1.33.1-1. (diff) | |
| download | netdata-bb50acdcb8073654ea667b8c0272e335bd43f844.tar.xz netdata-bb50acdcb8073654ea667b8c0272e335bd43f844.zip | |
Merging upstream version 1.34.0.
Signed-off-by: Daniel Baumann <daniel.baumann@progress-linux.org>
Diffstat (limited to 'collectors')
174 files changed, 3292 insertions, 3605 deletions
diff --git a/collectors/COLLECTORS.md b/collectors/COLLECTORS.md index 19790c424..6b95228f9 100644 --- a/collectors/COLLECTORS.md +++ b/collectors/COLLECTORS.md @@ -219,8 +219,6 @@ configure any of these collectors according to your setup and infrastructure. accounting statistics from the `status server` using the `radclient` tool. - [Libreswan](/collectors/charts.d.plugin/libreswan/README.md): Collect bytes-in, bytes-out, and uptime metrics. - [Icecast](/collectors/python.d.plugin/icecast/README.md): Monitor the number of listeners for active sources. -- [ISC BIND](/collectors/node.d.plugin/named/README.md): Collect nameserver summary performance statistics via a web - interface (`statistics-channels` feature). - [ISC Bind (RDNC)](/collectors/python.d.plugin/bind_rndc/README.md): Collect nameserver summary performance statistics using the `rndc` tool. - [ISC DHCP (Go)](https://learn.netdata.cloud/docs/agent/collectors/go.d.plugin/modules/isc_dhcpd): Reads a @@ -267,13 +265,8 @@ configure any of these collectors according to your setup and infrastructure. blockchain indexes, memory usage, network usage, and transactions of wallet instances. - [Energi Core (Python)](/collectors/python.d.plugin/energid/README.md): Monitor blockchain, memory, network, and unspent transactions statistics. -- [Fronius Symo](/collectors/node.d.plugin/fronius/README.md): Collect power, consumption, autonomy, energy, and inverter - statistics. - [UPS/PDU](/collectors/charts.d.plugin/nut/README.md): Read the status of UPS/PDU devices using the `upsc` tool. -- [SMA Sunny WebBox](/collectors/node.d.plugin/sma_webbox/README.md): Collect power statistics. - [SNMP devices](/collectors/node.d.plugin/snmp/README.md): Gather data using the SNMP protocol. -- [Stiebel Eltron ISG](/collectors/node.d.plugin/stiebeleltron/README.md): Collect metrics from heat pump and hot - water installations. - [1-Wire sensors](/collectors/python.d.plugin/w1sensor/README.md): Monitor sensor temperature. ### Search @@ -540,4 +533,4 @@ default. To use a third-party collector, visit their GitHub/documentation page a - [charts.d example](charts.d.plugin/example/README.md): An example `charts.d` collector. - [python.d example](python.d.plugin/example/README.md): An example `python.d` collector. -[](<>) + diff --git a/collectors/README.md b/collectors/README.md index e9cce42b3..3b76e1624 100644 --- a/collectors/README.md +++ b/collectors/README.md @@ -40,10 +40,8 @@ our [collectors' configuration reference](/collectors/REFERENCE.md). **[Dashboards](/web/README.md)**: Visualize your newly-collect metrics in real-time using Netdata's [built-in dashboard](/web/gui/README.md). -**[Backends](/backends/README.md)**: Extend our built-in [database engine](/database/engine/README.md), which supports -long-term metrics storage, by archiving metrics to like Graphite, Prometheus, MongoDB, TimescaleDB, and more. +**[Exporting](/exporting/README.md)**: Extend our built-in [database engine](/database/engine/README.md), which supports +long-term metrics storage, by archiving metrics to external databases like Graphite, Prometheus, MongoDB, TimescaleDB, and more. +It can export metrics to multiple databases simultaneously. -**[Exporting](/exporting/README.md)**: An experimental refactoring of our backends system with a modular system and -support for exporting metrics to multiple systems simultaneously. -[](<>) diff --git a/collectors/REFERENCE.md b/collectors/REFERENCE.md index fc9ed366d..bd267c5c6 100644 --- a/collectors/REFERENCE.md +++ b/collectors/REFERENCE.md @@ -179,4 +179,3 @@ through this, is to examine what other similar plugins do. You can add custom collectors by following the [external plugins documentation](/collectors/plugins.d/README.md). -[]() diff --git a/collectors/all.h b/collectors/all.h index 100a6b090..61f3c01bf 100644 --- a/collectors/all.h +++ b/collectors/all.h @@ -30,6 +30,7 @@ #define NETDATA_CHART_PRIO_SYSTEM_IP 501 #define NETDATA_CHART_PRIO_SYSTEM_IPV6 502 #define NETDATA_CHART_PRIO_SYSTEM_PROCESSES 600 +#define NETDATA_CHART_PRIO_SYSTEM_PROCESS_STATES 601 #define NETDATA_CHART_PRIO_SYSTEM_FORKS 700 #define NETDATA_CHART_PRIO_SYSTEM_ACTIVE_PROCESSES 750 #define NETDATA_CHART_PRIO_SYSTEM_CTXT 800 @@ -43,6 +44,7 @@ #define NETDATA_CHART_PRIO_SYSTEM_ENTROPY 1000 #define NETDATA_CHART_PRIO_SYSTEM_UPTIME 1000 #define NETDATA_CHART_PRIO_CLOCK_SYNC_STATE 1100 +#define NETDATA_CHART_PRIO_CLOCK_STATUS 1105 #define NETDATA_CHART_PRIO_CLOCK_SYNC_OFFSET 1110 #define NETDATA_CHART_PRIO_SYSTEM_IPC_MSQ_QUEUES 1200 // freebsd only #define NETDATA_CHART_PRIO_SYSTEM_IPC_MSQ_MESSAGES 1201 diff --git a/collectors/apps.plugin/README.md b/collectors/apps.plugin/README.md index a85c07898..76821695a 100644 --- a/collectors/apps.plugin/README.md +++ b/collectors/apps.plugin/README.md @@ -396,4 +396,4 @@ if you sum the CPU utilization of all processes, you might have more CPU time th total cpu time of the system. Netdata solves this, by adapting the per process cpu utilization to the total of the system. [Netdata adds charts that document this normalization](https://london.my-netdata.io/default.html#menu_netdata_submenu_apps_plugin). -[](<>) + diff --git a/collectors/apps.plugin/apps_groups.conf b/collectors/apps.plugin/apps_groups.conf index a36cae50b..f4824cd9d 100644 --- a/collectors/apps.plugin/apps_groups.conf +++ b/collectors/apps.plugin/apps_groups.conf @@ -169,6 +169,7 @@ nfs: rpcbind rpc.* nfs* zfs: spl_* z_* txg_* zil_* arc_* l2arc* btrfs: btrfs* iscsi: iscsid iscsi_eh +afp: netatalk afpd cnid_dbd cnid_metad # ----------------------------------------------------------------------------- # kubernetes @@ -338,3 +339,15 @@ filecoin: lotus* lotus-miner* lotus-worker* solana: solana* web3: *hardhat* *ganache* *truffle* *brownie* *waffle* terra: terra* mantle* + +# ----------------------------------------------------------------------------- +# chaos engineering tools + +stress: stress stress-ng* +gremlin: gremlin* + +# ----------------------------------------------------------------------------- +# load testing tools + +locust: locust + diff --git a/collectors/apps.plugin/apps_plugin.c b/collectors/apps.plugin/apps_plugin.c index 5555f157b..6924b2bf4 100644 --- a/collectors/apps.plugin/apps_plugin.c +++ b/collectors/apps.plugin/apps_plugin.c @@ -6,6 +6,7 @@ * Released under GPL v3+ */ +#include "collectors/all.h" #include "libnetdata/libnetdata.h" #include "libnetdata/required_dummies.h" @@ -107,6 +108,25 @@ static int static char *user_config_dir = CONFIG_DIR; static char *stock_config_dir = LIBCONFIG_DIR; +// some variables for keeping track of processes count by states +typedef enum { + PROC_STATUS_RUNNING = 0, + PROC_STATUS_SLEEPING_D, // uninterruptible sleep + PROC_STATUS_SLEEPING, // interruptible sleep + PROC_STATUS_ZOMBIE, + PROC_STATUS_STOPPED, + PROC_STATUS_END, //place holder for ending enum fields +} proc_state; + +static proc_state proc_state_count[PROC_STATUS_END]; +static const char *proc_states[] = { + [PROC_STATUS_RUNNING] = "running", + [PROC_STATUS_SLEEPING] = "sleeping_interruptible", + [PROC_STATUS_SLEEPING_D] = "sleeping_uninterruptible", + [PROC_STATUS_ZOMBIE] = "zombie", + [PROC_STATUS_STOPPED] = "stopped", + }; + // ---------------------------------------------------------------------------- // internal flags // handled in code (automatically set) @@ -286,7 +306,7 @@ struct pid_stat { uint32_t log_thrown; - // char state; + char state; int32_t ppid; // int32_t pgrp; // int32_t session; @@ -1234,6 +1254,28 @@ void arl_callback_status_rssshmem(const char *name, uint32_t hash, const char *v } #endif // !__FreeBSD__ +static void update_proc_state_count(char proc_state) { + switch (proc_state) { + case 'S': + proc_state_count[PROC_STATUS_SLEEPING] += 1; + break; + case 'R': + proc_state_count[PROC_STATUS_RUNNING] += 1; + break; + case 'D': + proc_state_count[PROC_STATUS_SLEEPING_D] += 1; + break; + case 'Z': + proc_state_count[PROC_STATUS_ZOMBIE] += 1; + break; + case 'T': + proc_state_count[PROC_STATUS_STOPPED] += 1; + break; + default: + break; + } +} + static inline int read_proc_pid_status(struct pid_stat *p, void *ptr) { p->status_vmsize = 0; p->status_vmrss = 0; @@ -1268,6 +1310,7 @@ static inline int read_proc_pid_status(struct pid_stat *p, void *ptr) { arl_expect_custom(p->status_arl, "VmSwap", arl_callback_status_vmswap, &arl_ptr); } + if(unlikely(!p->status_filename)) { char filename[FILENAME_MAX + 1]; snprintfz(filename, FILENAME_MAX, "%s/proc/%d/status", netdata_configured_host_prefix, p->pid); @@ -1313,7 +1356,6 @@ static inline int read_proc_pid_stat(struct pid_stat *p, void *ptr) { #ifdef __FreeBSD__ struct kinfo_proc *proc_info = (struct kinfo_proc *)ptr; - if (unlikely(proc_info->ki_tdflags & TDF_IDLETD)) goto cleanup; #else @@ -1348,7 +1390,7 @@ static inline int read_proc_pid_stat(struct pid_stat *p, void *ptr) { #else // p->pid = str2pid_t(procfile_lineword(ff, 0, 0)); char *comm = procfile_lineword(ff, 0, 1); - // p->state = *(procfile_lineword(ff, 0, 2)); + p->state = *(procfile_lineword(ff, 0, 2)); p->ppid = (int32_t)str2pid_t(procfile_lineword(ff, 0, 3)); // p->pgrp = (int32_t)str2pid_t(procfile_lineword(ff, 0, 4)); // p->session = (int32_t)str2pid_t(procfile_lineword(ff, 0, 5)); @@ -1356,7 +1398,6 @@ static inline int read_proc_pid_stat(struct pid_stat *p, void *ptr) { // p->tpgid = (int32_t)str2pid_t(procfile_lineword(ff, 0, 7)); // p->flags = str2uint64_t(procfile_lineword(ff, 0, 8)); #endif - if(strcmp(p->comm, comm) != 0) { if(unlikely(debug_enabled)) { if(p->comm[0]) @@ -1454,7 +1495,7 @@ static inline int read_proc_pid_stat(struct pid_stat *p, void *ptr) { p->cstime = 0; p->cgtime = 0; } - + update_proc_state_count(p->state); return 1; cleanup: @@ -2534,6 +2575,8 @@ static inline int collect_data_for_pid(pid_t pid, void *ptr) { static int collect_data_for_all_processes(void) { struct pid_stat *p = NULL; + // clear process state counter + memset(proc_state_count, 0, sizeof proc_state_count); #ifdef __FreeBSD__ int i, procnum; @@ -2608,8 +2651,9 @@ static int collect_data_for_all_processes(void) { // we forward read all running processes // collect_data_for_pid() is smart enough, // not to read the same pid twice per iteration - for(slc = 0; slc < all_pids_count; slc++) + for(slc = 0; slc < all_pids_count; slc++) { collect_data_for_pid(all_pids_sortlist[slc], NULL); + } } #endif } @@ -2666,7 +2710,6 @@ static int collect_data_for_all_processes(void) { // we do this by collecting the ownership of process // if we manage to get the ownership, the process still runs process_exited_processes(); - return 1; } @@ -3470,14 +3513,14 @@ static void send_collected_data_to_netdata(struct target *root, const char *type send_BEGIN(type, "threads", dt); for (w = root; w ; w = w->next) { - if(unlikely(w->exposed && w->processes)) + if(unlikely(w->exposed)) send_SET(w->name, w->num_threads); } send_END(); send_BEGIN(type, "processes", dt); for (w = root; w ; w = w->next) { - if(unlikely(w->exposed && w->processes)) + if(unlikely(w->exposed)) send_SET(w->name, w->processes); } send_END(); @@ -3640,7 +3683,7 @@ static void send_charts_updates_to_netdata(struct target *root, const char *type debug_log_int("%s just added - regenerating charts.", w->name); } } - + // nothing more to show if(!newly_added && show_guest_time == show_guest_time_old) return; @@ -3806,6 +3849,29 @@ static void send_charts_updates_to_netdata(struct target *root, const char *type } } +static void send_proc_states_count(usec_t dt) +{ + static bool chart_added = false; + // create chart for count of processes in different states + if (!chart_added) { + fprintf( + stdout, + "CHART system.processes_state '' 'System Processes State' 'processes' processes system.processes_state line %d %d\n", + NETDATA_CHART_PRIO_SYSTEM_PROCESS_STATES, + update_every); + for (proc_state i = PROC_STATUS_RUNNING; i < PROC_STATUS_END; i++) { + fprintf(stdout, "DIMENSION %s '' absolute 1 1\n", proc_states[i]); + } + chart_added = true; + } + + // send process state count + send_BEGIN("system", "processes_state", dt); + for (proc_state i = PROC_STATUS_RUNNING; i < PROC_STATUS_END; i++) { + send_SET(proc_states[i], proc_state_count[i]); + } + send_END(); +} // ---------------------------------------------------------------------------- // parse command line arguments @@ -4182,9 +4248,12 @@ int main(int argc, char **argv) { send_resource_usage_to_netdata(dt); +#ifndef __FreeBSD__ + send_proc_states_count(dt); +#endif + // this is smart enough to show only newly added apps, when needed send_charts_updates_to_netdata(apps_groups_root_target, "apps", "Apps"); - if(likely(enable_users_charts)) send_charts_updates_to_netdata(users_root_target, "users", "Users"); diff --git a/collectors/cgroups.plugin/README.md b/collectors/cgroups.plugin/README.md index 86776d6e0..d74ef000e 100644 --- a/collectors/cgroups.plugin/README.md +++ b/collectors/cgroups.plugin/README.md @@ -284,4 +284,4 @@ So, when a network interface or container stops, Netdata might log a few errors Network interfaces are monitored by means of the [proc plugin](/collectors/proc.plugin/README.md#monitored-network-interface-metrics). -[](<>) + diff --git a/collectors/cgroups.plugin/sys_fs_cgroup.c b/collectors/cgroups.plugin/sys_fs_cgroup.c index 92aa22c77..8efb68cf0 100644 --- a/collectors/cgroups.plugin/sys_fs_cgroup.c +++ b/collectors/cgroups.plugin/sys_fs_cgroup.c @@ -13,6 +13,7 @@ static long system_page_size = 4096; // system will be queried via sysconf() in static int cgroup_enable_cpuacct_stat = CONFIG_BOOLEAN_AUTO; static int cgroup_enable_cpuacct_usage = CONFIG_BOOLEAN_AUTO; +static int cgroup_enable_cpuacct_cpu_throttling = CONFIG_BOOLEAN_YES; static int cgroup_enable_memory = CONFIG_BOOLEAN_AUTO; static int cgroup_enable_detailed_memory = CONFIG_BOOLEAN_AUTO; static int cgroup_enable_memory_failcnt = CONFIG_BOOLEAN_AUTO; @@ -72,6 +73,12 @@ static uint32_t Read_hash = 0; static uint32_t Write_hash = 0; static uint32_t user_hash = 0; static uint32_t system_hash = 0; +static uint32_t user_usec_hash = 0; +static uint32_t system_usec_hash = 0; +static uint32_t nr_periods_hash = 0; +static uint32_t nr_throttled_hash = 0; +static uint32_t throttled_time_hash = 0; +static uint32_t throttled_usec_hash = 0; enum cgroups_type { CGROUPS_AUTODETECT_FAIL, CGROUPS_V1, CGROUPS_V2 }; @@ -116,21 +123,41 @@ static enum cgroups_systemd_setting cgroups_detect_systemd(const char *exec) if (!f) return retval; - while (fgets(buf, MAXSIZE_PROC_CMDLINE, f) != NULL) { - if ((begin = strstr(buf, SYSTEMD_HIERARCHY_STRING))) { - end = begin = begin + strlen(SYSTEMD_HIERARCHY_STRING); - if (!*begin) - break; - while (isalpha(*end)) - end++; - *end = 0; - for (int i = 0; cgroups_systemd_options[i].name; i++) { - if (!strcmp(begin, cgroups_systemd_options[i].name)) { - retval = cgroups_systemd_options[i].setting; + fd_set rfds; + struct timeval timeout; + int fd = fileno(f); + int ret = -1; + + FD_ZERO(&rfds); + FD_SET(fd, &rfds); + timeout.tv_sec = 3; + timeout.tv_usec = 0; + + if (fd != -1) { + ret = select(fd + 1, &rfds, NULL, NULL, &timeout); + } + + if (ret == -1) { + error("Failed to get the output of \"%s\"", exec); + } else if (ret == 0) { + info("Cannot get the output of \"%s\" within %"PRId64" seconds", exec, (int64_t)timeout.tv_sec); + } else { + while (fgets(buf, MAXSIZE_PROC_CMDLINE, f) != NULL) { + if ((begin = strstr(buf, SYSTEMD_HIERARCHY_STRING))) { + end = begin = begin + strlen(SYSTEMD_HIERARCHY_STRING); + if (!*begin) break; + while (isalpha(*end)) + end++; + *end = 0; + for (int i = 0; cgroups_systemd_options[i].name; i++) { + if (!strcmp(begin, cgroups_systemd_options[i].name)) { + retval = cgroups_systemd_options[i].setting; + break; + } } + break; } - break; } } @@ -213,6 +240,14 @@ static enum cgroups_type cgroups_try_detect_version() return CGROUPS_V2; } +void set_cgroup_base_path(char *filename, char *path) { + if (strncmp(netdata_configured_host_prefix, path, strlen(netdata_configured_host_prefix)) == 0) { + snprintfz(filename, FILENAME_MAX, "%s", path); + } else { + snprintfz(filename, FILENAME_MAX, "%s%s", netdata_configured_host_prefix, path); + } +} + void read_cgroup_plugin_configuration() { system_page_size = sysconf(_SC_PAGESIZE); @@ -220,6 +255,12 @@ void read_cgroup_plugin_configuration() { Write_hash = simple_hash("Write"); user_hash = simple_hash("user"); system_hash = simple_hash("system"); + user_usec_hash = simple_hash("user_usec"); + system_usec_hash = simple_hash("system_usec"); + nr_periods_hash = simple_hash("nr_periods"); + nr_throttled_hash = simple_hash("nr_throttled"); + throttled_time_hash = simple_hash("throttled_time"); + throttled_usec_hash = simple_hash("throttled_usec"); cgroup_update_every = (int)config_get_number("plugin:cgroups", "update every", localhost->rrd_update_every); if(cgroup_update_every < localhost->rrd_update_every) @@ -241,6 +282,7 @@ void read_cgroup_plugin_configuration() { cgroup_enable_cpuacct_stat = config_get_boolean_ondemand("plugin:cgroups", "enable cpuacct stat (total CPU)", cgroup_enable_cpuacct_stat); cgroup_enable_cpuacct_usage = config_get_boolean_ondemand("plugin:cgroups", "enable cpuacct usage (per core CPU)", cgroup_enable_cpuacct_usage); + cgroup_enable_cpuacct_cpu_throttling = config_get_boolean_ondemand("plugin:cgroups", "enable cpuacct cpu throttling", cgroup_enable_cpuacct_cpu_throttling); cgroup_enable_memory = config_get_boolean_ondemand("plugin:cgroups", "enable memory", cgroup_enable_memory); cgroup_enable_detailed_memory = config_get_boolean_ondemand("plugin:cgroups", "enable detailed memory", cgroup_enable_detailed_memory); @@ -285,7 +327,7 @@ void read_cgroup_plugin_configuration() { s = "/sys/fs/cgroup/cpuacct"; } else s = mi->mount_point; - snprintfz(filename, FILENAME_MAX, "%s%s", netdata_configured_host_prefix, s); + set_cgroup_base_path(filename, s); cgroup_cpuacct_base = config_get("plugin:cgroups", "path to /sys/fs/cgroup/cpuacct", filename); mi = mountinfo_find_by_filesystem_super_option(root, "cgroup", "cpuset"); @@ -295,7 +337,7 @@ void read_cgroup_plugin_configuration() { s = "/sys/fs/cgroup/cpuset"; } else s = mi->mount_point; - snprintfz(filename, FILENAME_MAX, "%s%s", netdata_configured_host_prefix, s); + set_cgroup_base_path(filename, s); cgroup_cpuset_base = config_get("plugin:cgroups", "path to /sys/fs/cgroup/cpuset", filename); mi = mountinfo_find_by_filesystem_super_option(root, "cgroup", "blkio"); @@ -305,7 +347,7 @@ void read_cgroup_plugin_configuration() { s = "/sys/fs/cgroup/blkio"; } else s = mi->mount_point; - snprintfz(filename, FILENAME_MAX, "%s%s", netdata_configured_host_prefix, s); + set_cgroup_base_path(filename, s); cgroup_blkio_base = config_get("plugin:cgroups", "path to /sys/fs/cgroup/blkio", filename); mi = mountinfo_find_by_filesystem_super_option(root, "cgroup", "memory"); @@ -315,7 +357,7 @@ void read_cgroup_plugin_configuration() { s = "/sys/fs/cgroup/memory"; } else s = mi->mount_point; - snprintfz(filename, FILENAME_MAX, "%s%s", netdata_configured_host_prefix, s); + set_cgroup_base_path(filename, s); cgroup_memory_base = config_get("plugin:cgroups", "path to /sys/fs/cgroup/memory", filename); mi = mountinfo_find_by_filesystem_super_option(root, "cgroup", "devices"); @@ -325,7 +367,7 @@ void read_cgroup_plugin_configuration() { s = "/sys/fs/cgroup/devices"; } else s = mi->mount_point; - snprintfz(filename, FILENAME_MAX, "%s%s", netdata_configured_host_prefix, s); + set_cgroup_base_path(filename, s); cgroup_devices_base = config_get("plugin:cgroups", "path to /sys/fs/cgroup/devices", filename); } else { @@ -357,7 +399,7 @@ void read_cgroup_plugin_configuration() { s = "/sys/fs/cgroup"; } else s = mi->mount_point; - snprintfz(filename, FILENAME_MAX, "%s%s", netdata_configured_host_prefix, s); + set_cgroup_base_path(filename, s); cgroup_unified_base = config_get("plugin:cgroups", "path to unified cgroups", filename); debug(D_CGROUP, "using cgroup root: '%s'", cgroup_unified_base); } @@ -395,7 +437,7 @@ void read_cgroup_plugin_configuration() { " !*.user " " !/ " " !/docker " - " !/libvirt " + " !*/libvirt " " !/lxc " " !/lxc/*/* " // #1397 #2649 " !/lxc.monitor* " @@ -630,12 +672,12 @@ struct memory { // https://www.kernel.org/doc/Documentation/cgroup-v1/cpuacct.txt struct cpuacct_stat { int updated; - int enabled; // CONFIG_BOOLEAN_YES or CONFIG_BOOLEAN_AUTO + int enabled; // CONFIG_BOOLEAN_YES or CONFIG_BOOLEAN_AUTO char *filename; - unsigned long long user; - unsigned long long system; + unsigned long long user; // v1, v2(user_usec) + unsigned long long system; // v1, v2(system_usec) }; // https://www.kernel.org/doc/Documentation/cgroup-v1/cpuacct.txt @@ -649,6 +691,20 @@ struct cpuacct_usage { unsigned long long *cpu_percpu; }; +// represents cpuacct/cpu.stat, for v2 'cpuacct_stat' is used for 'user_usec', 'system_usec' +struct cpuacct_cpu_throttling { + int updated; + int enabled; // CONFIG_BOOLEAN_YES or CONFIG_BOOLEAN_AUTO + + char *filename; + + unsigned long long nr_periods; + unsigned long long nr_throttled; + unsigned long long throttled_time; + + unsigned long long nr_throttled_perc; +}; + struct cgroup_network_interface { const char *host_device; const char *container_device; @@ -677,6 +733,7 @@ struct cgroup { struct cpuacct_stat cpuacct_stat; struct cpuacct_usage cpuacct_usage; + struct cpuacct_cpu_throttling cpuacct_cpu_throttling; struct memory memory; @@ -699,6 +756,9 @@ struct cgroup { RRDSET *st_cpu; RRDSET *st_cpu_limit; RRDSET *st_cpu_per_core; + RRDSET *st_cpu_nr_throttled; + RRDSET *st_cpu_throttled_time; + RRDSET *st_mem; RRDSET *st_mem_utilization; RRDSET *st_writeback; @@ -707,6 +767,7 @@ struct cgroup { RRDSET *st_mem_usage; RRDSET *st_mem_usage_limit; RRDSET *st_mem_failcnt; + RRDSET *st_io; RRDSET *st_serviced_ops; RRDSET *st_throttle_io; @@ -782,6 +843,22 @@ struct discovery_thread { } discovery_thread; // ---------------------------------------------------------------------------- + +static unsigned long long calc_delta(unsigned long long curr, unsigned long long prev) { + if (prev > curr) { + return 0; + } + return curr - prev; +} + +static unsigned long long calc_percentage(unsigned long long value, unsigned long long total) { + if (total == 0) { + return 0; + } + return (calculated_number)value / (calculated_number)total * 100; +} + +// ---------------------------------------------------------------------------- // read values from /sys static inline void cgroup_read_cpuacct_stat(struct cpuacct_stat *cp) { @@ -829,40 +906,126 @@ static inline void cgroup_read_cpuacct_stat(struct cpuacct_stat *cp) { } } -static inline void cgroup2_read_cpuacct_stat(struct cpuacct_stat *cp) { +static inline void cgroup_read_cpuacct_cpu_stat(struct cpuacct_cpu_throttling *cp) { + if (unlikely(!cp->filename)) { + return; + } + static procfile *ff = NULL; + ff = procfile_reopen(ff, cp->filename, NULL, PROCFILE_FLAG_DEFAULT); + if (unlikely(!ff)) { + cp->updated = 0; + cgroups_check = 1; + return; + } - if(likely(cp->filename)) { - ff = procfile_reopen(ff, cp->filename, NULL, PROCFILE_FLAG_DEFAULT); - if(unlikely(!ff)) { - cp->updated = 0; - cgroups_check = 1; - return; - } + ff = procfile_readall(ff); + if (unlikely(!ff)) { + cp->updated = 0; + cgroups_check = 1; + return; + } - ff = procfile_readall(ff); - if(unlikely(!ff)) { - cp->updated = 0; - cgroups_check = 1; - return; + unsigned long lines = procfile_lines(ff); + if (unlikely(lines < 3)) { + error("CGROUP: file '%s' should have 3 lines.", cp->filename); + cp->updated = 0; + return; + } + + unsigned long long nr_periods_last = cp->nr_periods; + unsigned long long nr_throttled_last = cp->nr_throttled; + + for (unsigned long i = 0; i < lines; i++) { + char *s = procfile_lineword(ff, i, 0); + uint32_t hash = simple_hash(s); + + if (unlikely(hash == nr_periods_hash && !strcmp(s, "nr_periods"))) { + cp->nr_periods = str2ull(procfile_lineword(ff, i, 1)); + } else if (unlikely(hash == nr_throttled_hash && !strcmp(s, "nr_throttled"))) { + cp->nr_throttled = str2ull(procfile_lineword(ff, i, 1)); + } else if (unlikely(hash == throttled_time_hash && !strcmp(s, "throttled_time"))) { + cp->throttled_time = str2ull(procfile_lineword(ff, i, 1)); } + } + cp->nr_throttled_perc = + calc_percentage(calc_delta(cp->nr_throttled, nr_throttled_last), calc_delta(cp->nr_periods, nr_periods_last)); - unsigned long lines = procfile_lines(ff); + cp->updated = 1; - if(unlikely(lines < 3)) { - error("CGROUP: file '%s' should have 3+ lines.", cp->filename); - cp->updated = 0; - return; + if (unlikely(cp->enabled == CONFIG_BOOLEAN_AUTO)) { + if (likely( + cp->nr_periods || cp->nr_throttled || cp->throttled_time || + netdata_zero_metrics_enabled == CONFIG_BOOLEAN_YES)) { + cp->enabled = CONFIG_BOOLEAN_YES; } + } +} - cp->user = str2ull(procfile_lineword(ff, 1, 1)); - cp->system = str2ull(procfile_lineword(ff, 2, 1)); +static inline void cgroup2_read_cpuacct_cpu_stat(struct cpuacct_stat *cp, struct cpuacct_cpu_throttling *cpt) { + static procfile *ff = NULL; + if (unlikely(!cp->filename)) { + return; + } - cp->updated = 1; + ff = procfile_reopen(ff, cp->filename, NULL, PROCFILE_FLAG_DEFAULT); + if (unlikely(!ff)) { + cp->updated = 0; + cgroups_check = 1; + return; + } - if(unlikely(cp->enabled == CONFIG_BOOLEAN_AUTO && - (cp->user || cp->system || netdata_zero_metrics_enabled == CONFIG_BOOLEAN_YES))) + ff = procfile_readall(ff); + if (unlikely(!ff)) { + cp->updated = 0; + cgroups_check = 1; + return; + } + + unsigned long lines = procfile_lines(ff); + + if (unlikely(lines < 3)) { + error("CGROUP: file '%s' should have at least 3 lines.", cp->filename); + cp->updated = 0; + return; + } + + unsigned long long nr_periods_last = cpt->nr_periods; + unsigned long long nr_throttled_last = cpt->nr_throttled; + + for (unsigned long i = 0; i < lines; i++) { + char *s = procfile_lineword(ff, i, 0); + uint32_t hash = simple_hash(s); + + if (unlikely(hash == user_usec_hash && !strcmp(s, "user_usec"))) { + cp->user = str2ull(procfile_lineword(ff, i, 1)); + } else if (unlikely(hash == system_usec_hash && !strcmp(s, "system_usec"))) { + cp->system = str2ull(procfile_lineword(ff, i, 1)); + } else if (unlikely(hash == nr_periods_hash && !strcmp(s, "nr_periods"))) { + cpt->nr_periods = str2ull(procfile_lineword(ff, i, 1)); + } else if (unlikely(hash == nr_throttled_hash && !strcmp(s, "nr_throttled"))) { + cpt->nr_throttled = str2ull(procfile_lineword(ff, i, 1)); + } else if (unlikely(hash == throttled_usec_hash && !strcmp(s, "throttled_usec"))) { + cpt->throttled_time = str2ull(procfile_lineword(ff, i, 1)) * 1000; // usec -> ns + } + } + cpt->nr_throttled_perc = + calc_percentage(calc_delta(cpt->nr_throttled, nr_throttled_last), calc_delta(cpt->nr_periods, nr_periods_last)); + + cp->updated = 1; + cpt->updated = 1; + + if (unlikely(cp->enabled == CONFIG_BOOLEAN_AUTO)) { + if (likely(cp->user || cp->system || netdata_zero_metrics_enabled == CONFIG_BOOLEAN_YES)) { cp->enabled = CONFIG_BOOLEAN_YES; + } + } + if (unlikely(cpt->enabled == CONFIG_BOOLEAN_AUTO)) { + if (likely( + cpt->nr_periods || cpt->nr_throttled || cpt->throttled_time || + netdata_zero_metrics_enabled == CONFIG_BOOLEAN_YES)) { + cpt->enabled = CONFIG_BOOLEAN_YES; + } } } @@ -1236,6 +1399,7 @@ static inline void cgroup_read(struct cgroup *cg) { if(!(cg->options & CGROUP_OPTIONS_IS_UNIFIED)) { cgroup_read_cpuacct_stat(&cg->cpuacct_stat); cgroup_read_cpuacct_usage(&cg->cpuacct_usage); + cgroup_read_cpuacct_cpu_stat(&cg->cpuacct_cpu_throttling); cgroup_read_memory(&cg->memory, 0); cgroup_read_blkio(&cg->io_service_bytes); cgroup_read_blkio(&cg->io_serviced); @@ -1248,7 +1412,7 @@ static inline void cgroup_read(struct cgroup *cg) { //TODO: io_service_bytes and io_serviced use same file merge into 1 function cgroup2_read_blkio(&cg->io_service_bytes, 0); cgroup2_read_blkio(&cg->io_serviced, 4); - cgroup2_read_cpuacct_stat(&cg->cpuacct_stat); + cgroup2_read_cpuacct_cpu_stat(&cg->cpuacct_stat, &cg->cpuacct_cpu_throttling); cgroup2_read_pressure(&cg->cpu_pressure); cgroup2_read_pressure(&cg->io_pressure); cgroup2_read_pressure(&cg->memory_pressure); @@ -1599,6 +1763,8 @@ static inline void cgroup_free(struct cgroup *cg) { if(cg->st_cpu) rrdset_is_obsolete(cg->st_cpu); if(cg->st_cpu_limit) rrdset_is_obsolete(cg->st_cpu_limit); if(cg->st_cpu_per_core) rrdset_is_obsolete(cg->st_cpu_per_core); + if(cg->st_cpu_nr_throttled) rrdset_is_obsolete(cg->st_cpu_nr_throttled); + if(cg->st_cpu_throttled_time) rrdset_is_obsolete(cg->st_cpu_throttled_time); if(cg->st_mem) rrdset_is_obsolete(cg->st_mem); if(cg->st_writeback) rrdset_is_obsolete(cg->st_writeback); if(cg->st_mem_activity) rrdset_is_obsolete(cg->st_mem_activity); @@ -1626,6 +1792,7 @@ static inline void cgroup_free(struct cgroup *cg) { freez(cg->cpuacct_stat.filename); freez(cg->cpuacct_usage.filename); + freez(cg->cpuacct_cpu_throttling.filename); arl_free(cg->memory.arl_base); freez(cg->memory.filename_detailed); @@ -1842,6 +2009,16 @@ static inline void update_filenames() else debug(D_CGROUP, "cpuacct.usage_percpu file for cgroup '%s': '%s' does not exist.", cg->id, filename); } + if(unlikely(cgroup_enable_cpuacct_cpu_throttling && !cg->cpuacct_cpu_throttling.filename && !(cg->options & CGROUP_OPTIONS_SYSTEM_SLICE_SERVICE))) { + snprintfz(filename, FILENAME_MAX, "%s%s/cpu.stat", cgroup_cpuacct_base, cg->id); + if(likely(stat(filename, &buf) != -1)) { + cg->cpuacct_cpu_throttling.filename = strdupz(filename); + cg->cpuacct_cpu_throttling.enabled = cgroup_enable_cpuacct_cpu_throttling; + debug(D_CGROUP, "cpu.stat filename for cgroup '%s': '%s'", cg->id, cg->cpuacct_cpu_throttling.filename); + } + else + debug(D_CGROUP, "cpu.stat file for cgroup '%s': '%s' does not exist.", cg->id, filename); + } if(unlikely((cgroup_enable_detailed_memory || cgroup_used_memory) && !cg->memory.filename_detailed && (cgroup_used_memory || cgroup_enable_systemd_services_detailed_memory || !(cg->options & CGROUP_OPTIONS_SYSTEM_SLICE_SERVICE)))) { snprintfz(filename, FILENAME_MAX, "%s%s/memory.stat", cgroup_memory_base, cg->id); @@ -1892,69 +2069,118 @@ static inline void update_filenames() } if(unlikely(cgroup_enable_blkio_io && !cg->io_service_bytes.filename)) { - snprintfz(filename, FILENAME_MAX, "%s%s/blkio.io_service_bytes", cgroup_blkio_base, cg->id); - if(likely(stat(filename, &buf) != -1)) { + snprintfz(filename, FILENAME_MAX, "%s%s/blkio.io_service_bytes_recursive", cgroup_blkio_base, cg->id); + if (unlikely(stat(filename, &buf) != -1)) { cg->io_service_bytes.filename = strdupz(filename); cg->io_service_bytes.enabled = cgroup_enable_blkio_io; - debug(D_CGROUP, "io_service_bytes filename for cgroup '%s': '%s'", cg->id, cg->io_service_bytes.filename); + debug(D_CGROUP, "blkio.io_service_bytes_recursive filename for cgroup '%s': '%s'", cg->id, cg->io_service_bytes.filename); + } else { + debug(D_CGROUP, "blkio.io_service_bytes_recursive file for cgroup '%s': '%s' does not exist.", cg->id, filename); + snprintfz(filename, FILENAME_MAX, "%s%s/blkio.io_service_bytes", cgroup_blkio_base, cg->id); + if (likely(stat(filename, &buf) != -1)) { + cg->io_service_bytes.filename = strdupz(filename); + cg->io_service_bytes.enabled = cgroup_enable_blkio_io; + debug(D_CGROUP, "blkio.io_service_bytes filename for cgroup '%s': '%s'", cg->id, cg->io_service_bytes.filename); + } else { + debug(D_CGROUP, "blkio.io_service_bytes file for cgroup '%s': '%s' does not exist.", cg->id, filename); + } } - else - debug(D_CGROUP, "io_service_bytes file for cgroup '%s': '%s' does not exist.", cg->id, filename); } - if(unlikely(cgroup_enable_blkio_ops && !cg->io_serviced.filename)) { - snprintfz(filename, FILENAME_MAX, "%s%s/blkio.io_serviced", cgroup_blkio_base, cg->id); - if(likely(stat(filename, &buf) != -1)) { + if (unlikely(cgroup_enable_blkio_ops && !cg->io_serviced.filename)) { + snprintfz(filename, FILENAME_MAX, "%s%s/blkio.io_serviced_recursive", cgroup_blkio_base, cg->id); + if (unlikely(stat(filename, &buf) != -1)) { cg->io_serviced.filename = strdupz(filename); cg->io_serviced.enabled = cgroup_enable_blkio_ops; - debug(D_CGROUP, "io_serviced filename for cgroup '%s': '%s'", cg->id, cg->io_serviced.filename); + debug(D_CGROUP, "blkio.io_serviced_recursive filename for cgroup '%s': '%s'", cg->id, cg->io_serviced.filename); + } else { + debug(D_CGROUP, "blkio.io_serviced_recursive file for cgroup '%s': '%s' does not exist.", cg->id, filename); + snprintfz(filename, FILENAME_MAX, "%s%s/blkio.io_serviced", cgroup_blkio_base, cg->id); + if (likely(stat(filename, &buf) != -1)) { + cg->io_serviced.filename = strdupz(filename); + cg->io_serviced.enabled = cgroup_enable_blkio_ops; + debug(D_CGROUP, "blkio.io_serviced filename for cgroup '%s': '%s'", cg->id, cg->io_serviced.filename); + } else { + debug(D_CGROUP, "blkio.io_serviced file for cgroup '%s': '%s' does not exist.", cg->id, filename); + } } - else - debug(D_CGROUP, "io_serviced file for cgroup '%s': '%s' does not exist.", cg->id, filename); } - if(unlikely(cgroup_enable_blkio_throttle_io && !cg->throttle_io_service_bytes.filename)) { - snprintfz(filename, FILENAME_MAX, "%s%s/blkio.throttle.io_service_bytes", cgroup_blkio_base, cg->id); - if(likely(stat(filename, &buf) != -1)) { + if (unlikely(cgroup_enable_blkio_throttle_io && !cg->throttle_io_service_bytes.filename)) { + snprintfz(filename, FILENAME_MAX, "%s%s/blkio.throttle.io_service_bytes_recursive", cgroup_blkio_base, cg->id); + if (unlikely(stat(filename, &buf) != -1)) { cg->throttle_io_service_bytes.filename = strdupz(filename); cg->throttle_io_service_bytes.enabled = cgroup_enable_blkio_throttle_io; - debug(D_CGROUP, "throttle_io_service_bytes filename for cgroup '%s': '%s'", cg->id, cg->throttle_io_service_bytes.filename); + debug(D_CGROUP,"blkio.throttle.io_service_bytes_recursive filename for cgroup '%s': '%s'", cg->id, cg->throttle_io_service_bytes.filename); + } else { + debug(D_CGROUP, "blkio.throttle.io_service_bytes_recursive file for cgroup '%s': '%s' does not exist.", cg->id, filename); + snprintfz( + filename, FILENAME_MAX, "%s%s/blkio.throttle.io_service_bytes", cgroup_blkio_base, cg->id); + if (likely(stat(filename, &buf) != -1)) { + cg->throttle_io_service_bytes.filename = strdupz(filename); + cg->throttle_io_service_bytes.enabled = cgroup_enable_blkio_throttle_io; + debug(D_CGROUP, "blkio.throttle.io_service_bytes filename for cgroup '%s': '%s'", cg->id, cg->throttle_io_service_bytes.filename); + } else { + debug(D_CGROUP, "blkio.throttle.io_service_bytes file for cgroup '%s': '%s' does not exist.", cg->id, filename); + } } - else - debug(D_CGROUP, "throttle_io_service_bytes file for cgroup '%s': '%s' does not exist.", cg->id, filename); } - if(unlikely(cgroup_enable_blkio_throttle_ops && !cg->throttle_io_serviced.filename)) { - snprintfz(filename, FILENAME_MAX, "%s%s/blkio.throttle.io_serviced", cgroup_blkio_base, cg->id); - if(likely(stat(filename, &buf) != -1)) { + if (unlikely(cgroup_enable_blkio_throttle_ops && !cg->throttle_io_serviced.filename)) { + snprintfz(filename, FILENAME_MAX, "%s%s/blkio.throttle.io_serviced_recursive", cgroup_blkio_base, cg->id); + if (unlikely(stat(filename, &buf) != -1)) { cg->throttle_io_serviced.filename = strdupz(filename); cg->throttle_io_serviced.enabled = cgroup_enable_blkio_throttle_ops; - debug(D_CGROUP, "throttle_io_serviced filename for cgroup '%s': '%s'", cg->id, cg->throttle_io_serviced.filename); + debug(D_CGROUP, "blkio.throttle.io_serviced_recursive filename for cgroup '%s': '%s'", cg->id, cg->throttle_io_serviced.filename); + } else { + debug(D_CGROUP, "blkio.throttle.io_serviced_recursive file for cgroup '%s': '%s' does not exist.", cg->id, filename); + snprintfz(filename, FILENAME_MAX, "%s%s/blkio.throttle.io_serviced", cgroup_blkio_base, cg->id); + if (likely(stat(filename, &buf) != -1)) { + cg->throttle_io_serviced.filename = strdupz(filename); + cg->throttle_io_serviced.enabled = cgroup_enable_blkio_throttle_ops; + debug(D_CGROUP, "blkio.throttle.io_serviced filename for cgroup '%s': '%s'", cg->id, cg->throttle_io_serviced.filename); + } else { + debug(D_CGROUP, "blkio.throttle.io_serviced file for cgroup '%s': '%s' does not exist.", cg->id, filename); + } } - else - debug(D_CGROUP, "throttle_io_serviced file for cgroup '%s': '%s' does not exist.", cg->id, filename); } - if(unlikely(cgroup_enable_blkio_merged_ops && !cg->io_merged.filename)) { - snprintfz(filename, FILENAME_MAX, "%s%s/blkio.io_merged", cgroup_blkio_base, cg->id); - if(likely(stat(filename, &buf) != -1)) { + if (unlikely(cgroup_enable_blkio_merged_ops && !cg->io_merged.filename)) { + snprintfz(filename, FILENAME_MAX, "%s%s/blkio.io_merged_recursive", cgroup_blkio_base, cg->id); + if (unlikely(stat(filename, &buf) != -1)) { cg->io_merged.filename = strdupz(filename); cg->io_merged.enabled = cgroup_enable_blkio_merged_ops; - debug(D_CGROUP, "io_merged filename for cgroup '%s': '%s'", cg->id, cg->io_merged.filename); + debug(D_CGROUP, "blkio.io_merged_recursive filename for cgroup '%s': '%s'", cg->id, cg->io_merged.filename); + } else { + debug(D_CGROUP, "blkio.io_merged_recursive file for cgroup '%s': '%s' does not exist.", cg->id, filename); + snprintfz(filename, FILENAME_MAX, "%s%s/blkio.io_merged", cgroup_blkio_base, cg->id); + if (likely(stat(filename, &buf) != -1)) { + cg->io_merged.filename = strdupz(filename); + cg->io_merged.enabled = cgroup_enable_blkio_merged_ops; + debug(D_CGROUP, "blkio.io_merged filename for cgroup '%s': '%s'", cg->id, cg->io_merged.filename); + } else { + debug(D_CGROUP, "blkio.io_merged file for cgroup '%s': '%s' does not exist.", cg->id, filename); + } } - else - debug(D_CGROUP, "io_merged file for cgroup '%s': '%s' does not exist.", cg->id, filename); } - if(unlikely(cgroup_enable_blkio_queued_ops && !cg->io_queued.filename)) { - snprintfz(filename, FILENAME_MAX, "%s%s/blkio.io_queued", cgroup_blkio_base, cg->id); - if(likely(stat(filename, &buf) != -1)) { + if (unlikely(cgroup_enable_blkio_queued_ops && !cg->io_queued.filename)) { + snprintfz(filename, FILENAME_MAX, "%s%s/blkio.io_queued_recursive", cgroup_blkio_base, cg->id); + if (unlikely(stat(filename, &buf) != -1)) { cg->io_queued.filename = strdupz(filename); cg->io_queued.enabled = cgroup_enable_blkio_queued_ops; - debug(D_CGROUP, "io_queued filename for cgroup '%s': '%s'", cg->id, cg->io_queued.filename); + debug(D_CGROUP, "blkio.io_queued_recursive filename for cgroup '%s': '%s'", cg->id, cg->io_queued.filename); + } else { + debug(D_CGROUP, "blkio.io_queued_recursive file for cgroup '%s': '%s' does not exist.", cg->id, filename); + snprintfz(filename, FILENAME_MAX, "%s%s/blkio.io_queued", cgroup_blkio_base, cg->id); + if (likely(stat(filename, &buf) != -1)) { + cg->io_queued.filename = strdupz(filename); + cg->io_queued.enabled = cgroup_enable_blkio_queued_ops; + debug(D_CGROUP, "blkio.io_queued filename for cgroup '%s': '%s'", cg->id, cg->io_queued.filename); + } else { + debug(D_CGROUP, "blkio.io_queued file for cgroup '%s': '%s' does not exist.", cg->id, filename); + } } - else - debug(D_CGROUP, "io_queued file for cgroup '%s': '%s' does not exist.", cg->id, filename); } } else if(likely(cgroup_unified_exist)) { @@ -1976,11 +2202,14 @@ static inline void update_filenames() } else debug(D_CGROUP, "io.stat file for unified cgroup '%s': '%s' does not exist.", cg->id, filename); } - if(unlikely(cgroup_enable_cpuacct_stat && !cg->cpuacct_stat.filename)) { + if (unlikely( + (cgroup_enable_cpuacct_stat || cgroup_enable_cpuacct_cpu_throttling) && + !cg->cpuacct_stat.filename)) { snprintfz(filename, FILENAME_MAX, "%s%s/cpu.stat", cgroup_unified_base, cg->id); if(likely(stat(filename, &buf) != -1)) { cg->cpuacct_stat.filename = strdupz(filename); cg->cpuacct_stat.enabled = cgroup_enable_cpuacct_stat; + cg->cpuacct_cpu_throttling.enabled = cgroup_enable_cpuacct_cpu_throttling; cg->filename_cpuset_cpus = NULL; cg->filename_cpu_cfs_period = NULL; snprintfz(filename, FILENAME_MAX, "%s%s/cpu.max", cgroup_unified_base, cg->id); @@ -3359,6 +3588,7 @@ void update_cgroup_charts(int update_every) { rrddim_add(cg->st_cpu_limit, "used", NULL, 1, system_hz, RRD_ALGORITHM_ABSOLUTE); else rrddim_add(cg->st_cpu_limit, "used", NULL, 1, 1000000, RRD_ALGORITHM_ABSOLUTE); + cg->prev_cpu_usage = (calculated_number)(cg->cpuacct_stat.user + cg->cpuacct_stat.system) * 100; } else rrdset_next(cg->st_cpu_limit); @@ -3386,6 +3616,60 @@ void update_cgroup_charts(int update_every) { } } + if (likely(cg->cpuacct_cpu_throttling.updated && cg->cpuacct_cpu_throttling.enabled == CONFIG_BOOLEAN_YES)) { + if (unlikely(!cg->st_cpu_nr_throttled)) { + snprintfz(title, CHART_TITLE_MAX, "CPU Throttled Runnable Periods"); + + cg->st_cpu_nr_throttled = rrdset_create_localhost( + cgroup_chart_type(type, cg->chart_id, RRD_ID_LENGTH_MAX) + , "throttled" + , NULL + , "cpu" + , "cgroup.throttled" + , title + , "percentage" + , PLUGIN_CGROUPS_NAME + , PLUGIN_CGROUPS_MODULE_CGROUPS_NAME + , cgroup_containers_chart_priority + 10 + , update_every + , RRDSET_TYPE_LINE + ); + + rrdset_update_labels(cg->st_cpu_nr_throttled, cg->chart_labels); + rrddim_add(cg->st_cpu_nr_throttled, "throttled", NULL, 1, 1, RRD_ALGORITHM_ABSOLUTE); + } else { + rrdset_next(cg->st_cpu_nr_throttled); + rrddim_set(cg->st_cpu_nr_throttled, "throttled", cg->cpuacct_cpu_throttling.nr_throttled_perc); + rrdset_done(cg->st_cpu_nr_throttled); + } + + if (unlikely(!cg->st_cpu_throttled_time)) { + snprintfz(title, CHART_TITLE_MAX, "CPU Throttled Time Duration"); + + cg->st_cpu_throttled_time = rrdset_create_localhost( + cgroup_chart_type(type, cg->chart_id, RRD_ID_LENGTH_MAX) + , "throttled_duration" + , NULL + , "cpu" + , "cgroup.throttled_duration" + , title + , "ms" + , PLUGIN_CGROUPS_NAME + , PLUGIN_CGROUPS_MODULE_CGROUPS_NAME + , cgroup_containers_chart_priority + 15 + , update_every + , RRDSET_TYPE_LINE + ); + + rrdset_update_labels(cg->st_cpu_throttled_time, cg->chart_labels); + rrddim_add(cg->st_cpu_throttled_time, "duration", NULL, 1, 1000000, RRD_ALGORITHM_INCREMENTAL); + } else { + rrdset_next(cg->st_cpu_throttled_time); + rrddim_set(cg->st_cpu_throttled_time, "duration", cg->cpuacct_cpu_throttling.throttled_time); + rrdset_done(cg->st_cpu_throttled_time); + } + } + if(likely(cg->cpuacct_usage.updated && cg->cpuacct_usage.enabled == CONFIG_BOOLEAN_YES)) { char id[RRD_ID_LENGTH_MAX + 1]; unsigned int i; diff --git a/collectors/charts.d.plugin/README.md b/collectors/charts.d.plugin/README.md index 4a7911a60..06f4af1ec 100644 --- a/collectors/charts.d.plugin/README.md +++ b/collectors/charts.d.plugin/README.md @@ -195,4 +195,4 @@ This is what you need to do: Execute the above in this order, since Netdata will (by default) attempt to start new plugins soon after they are created in `/usr/libexec/netdata/plugins.d/`. -[](<>) + diff --git a/collectors/charts.d.plugin/ap/README.md b/collectors/charts.d.plugin/ap/README.md index 35a00d65d..a7953a541 100644 --- a/collectors/charts.d.plugin/ap/README.md +++ b/collectors/charts.d.plugin/ap/README.md @@ -96,4 +96,4 @@ You can only set `ap_update_every=NUMBER` to change the data collection frequenc The plugin is able to auto-detect if you are running access points on your linux box. -[](<>) + diff --git a/collectors/charts.d.plugin/apcupsd/README.md b/collectors/charts.d.plugin/apcupsd/README.md index b5b41e84d..f1aebf97c 100644 --- a/collectors/charts.d.plugin/apcupsd/README.md +++ b/collectors/charts.d.plugin/apcupsd/README.md @@ -18,4 +18,4 @@ cd /etc/netdata # Replace this path with your Netdata config directory, if dif sudo ./edit-config charts.d/apcupsd.conf ``` -[](<>) + diff --git a/collectors/charts.d.plugin/apcupsd/apcupsd.chart.sh b/collectors/charts.d.plugin/apcupsd/apcupsd.chart.sh index e78d99e7d..b4edc0caf 100644 --- a/collectors/charts.d.plugin/apcupsd/apcupsd.chart.sh +++ b/collectors/charts.d.plugin/apcupsd/apcupsd.chart.sh @@ -50,7 +50,7 @@ apcupsd_check() { local host working=0 failed=0 for host in "${!apcupsd_sources[@]}"; do - run apcupsd_get "${apcupsd_sources[${host}]}" > /dev/null + apcupsd_get "${apcupsd_sources[${host}]}" > /dev/null # shellcheck disable=2181 if [ $? -ne 0 ]; then error "cannot get information for apcupsd server ${host} on ${apcupsd_sources[${host}]}." diff --git a/collectors/charts.d.plugin/example/README.md b/collectors/charts.d.plugin/example/README.md index c3dfd2c00..77446b270 100644 --- a/collectors/charts.d.plugin/example/README.md +++ b/collectors/charts.d.plugin/example/README.md @@ -7,4 +7,4 @@ custom_edit_url: https://github.com/netdata/netdata/edit/master/collectors/chart If you want to understand how charts.d data collector functions, check out the [charts.d example](https://raw.githubusercontent.com/netdata/netdata/master/collectors/charts.d.plugin/example/example.chart.sh). -[](<>) + diff --git a/collectors/charts.d.plugin/libreswan/README.md b/collectors/charts.d.plugin/libreswan/README.md index b1c1f05e4..41c4e24c9 100644 --- a/collectors/charts.d.plugin/libreswan/README.md +++ b/collectors/charts.d.plugin/libreswan/README.md @@ -53,4 +53,4 @@ Make sure the path `/sbin/ipsec` matches your setup (execute `which ipsec` to fi --- -[](<>) + diff --git a/collectors/charts.d.plugin/nut/README.md b/collectors/charts.d.plugin/nut/README.md index 3f9c5f0a2..69d7622cd 100644 --- a/collectors/charts.d.plugin/nut/README.md +++ b/collectors/charts.d.plugin/nut/README.md @@ -71,4 +71,4 @@ nut_update_every=2 --- -[](<>) + diff --git a/collectors/charts.d.plugin/opensips/README.md b/collectors/charts.d.plugin/opensips/README.md index 7575a1dad..b08d19232 100644 --- a/collectors/charts.d.plugin/opensips/README.md +++ b/collectors/charts.d.plugin/opensips/README.md @@ -16,4 +16,4 @@ cd /etc/netdata # Replace this path with your Netdata config directory, if dif sudo ./edit-config charts.d/opensips.conf ``` -[](<>) + diff --git a/collectors/charts.d.plugin/sensors/README.md b/collectors/charts.d.plugin/sensors/README.md index 2a1cdb676..ab7a8b660 100644 --- a/collectors/charts.d.plugin/sensors/README.md +++ b/collectors/charts.d.plugin/sensors/README.md @@ -81,4 +81,4 @@ sensors_excluded=() --- -[](<>) + diff --git a/collectors/charts.d.plugin/sensors/sensors.chart.sh b/collectors/charts.d.plugin/sensors/sensors.chart.sh index bff381f1c..0527e1e7e 100644 --- a/collectors/charts.d.plugin/sensors/sensors.chart.sh +++ b/collectors/charts.d.plugin/sensors/sensors.chart.sh @@ -143,8 +143,8 @@ sensors_create() { files="$(sensors_check_files "$files")" files="$(sensors_check_temp_type "$files")" [ -z "$files" ] && continue - echo "CHART sensors.temp_$id '' '$name Temperature' 'Celsius' 'temperature' 'sensors.temp' line $((sensors_priority + 1)) $sensors_update_every '' '' 'sensors'" - echo >>"$TMP_DIR/sensors.sh" "echo \"BEGIN sensors.temp_$id \$1\"" + echo "CHART 'sensors.temp_${id}_${name}' '' 'Temperature' 'Celsius' 'temperature' 'sensors.temp' line $((sensors_priority + 1)) $sensors_update_every '' '' 'sensors'" + echo >>"$TMP_DIR/sensors.sh" "echo \"BEGIN 'sensors.temp_${id}_${name}' \$1\"" divisor=1000 ;; @@ -152,8 +152,8 @@ sensors_create() { files="$(ls "$path"/in*_input 2>/dev/null)" files="$(sensors_check_files "$files")" [ -z "$files" ] && continue - echo "CHART sensors.volt_$id '' '$name Voltage' 'Volts' 'voltage' 'sensors.volt' line $((sensors_priority + 2)) $sensors_update_every '' '' 'sensors'" - echo >>"$TMP_DIR/sensors.sh" "echo \"BEGIN sensors.volt_$id \$1\"" + echo "CHART 'sensors.volt_${id}_${name}' '' 'Voltage' 'Volts' 'voltage' 'sensors.volt' line $((sensors_priority + 2)) $sensors_update_every '' '' 'sensors'" + echo >>"$TMP_DIR/sensors.sh" "echo \"BEGIN 'sensors.volt_${id}_${name}' \$1\"" divisor=1000 ;; @@ -161,8 +161,8 @@ sensors_create() { files="$(ls "$path"/curr*_input 2>/dev/null)" files="$(sensors_check_files "$files")" [ -z "$files" ] && continue - echo "CHART sensors.curr_$id '' '$name Current' 'Ampere' 'current' 'sensors.curr' line $((sensors_priority + 3)) $sensors_update_every '' '' 'sensors'" - echo >>"$TMP_DIR/sensors.sh" "echo \"BEGIN sensors.curr_$id \$1\"" + echo "CHART 'sensors.curr_${id}_${name}' '' 'Current' 'Ampere' 'current' 'sensors.curr' line $((sensors_priority + 3)) $sensors_update_every '' '' 'sensors'" + echo >>"$TMP_DIR/sensors.sh" "echo \"BEGIN 'sensors.curr_${id}_${name}' \$1\"" divisor=1000 ;; @@ -170,8 +170,8 @@ sensors_create() { files="$(ls "$path"/power*_input 2>/dev/null)" files="$(sensors_check_files "$files")" [ -z "$files" ] && continue - echo "CHART sensors.power_$id '' '$name Power' 'Watt' 'power' 'sensors.power' line $((sensors_priority + 4)) $sensors_update_every '' '' 'sensors'" - echo >>"$TMP_DIR/sensors.sh" "echo \"BEGIN sensors.power_$id \$1\"" + echo "CHART 'sensors.power_${id}_${name}' '' 'Power' 'Watt' 'power' 'sensors.power' line $((sensors_priority + 4)) $sensors_update_every '' '' 'sensors'" + echo >>"$TMP_DIR/sensors.sh" "echo \"BEGIN 'sensors.power_${id}_${name}' \$1\"" divisor=1000000 ;; @@ -179,16 +179,16 @@ sensors_create() { files="$(ls "$path"/fan*_input 2>/dev/null)" files="$(sensors_check_files "$files")" [ -z "$files" ] && continue - echo "CHART sensors.fan_$id '' '$name Fans Speed' 'Rotations / Minute' 'fans' 'sensors.fans' line $((sensors_priority + 5)) $sensors_update_every '' '' 'sensors'" - echo >>"$TMP_DIR/sensors.sh" "echo \"BEGIN sensors.fan_$id \$1\"" + echo "CHART 'sensors.fan_${id}_${name}' '' 'Fans Speed' 'Rotations / Minute' 'fans' 'sensors.fans' line $((sensors_priority + 5)) $sensors_update_every '' '' 'sensors'" + echo >>"$TMP_DIR/sensors.sh" "echo \"BEGIN 'sensors.fan_${id}_${name}' \$1\"" ;; energy) files="$(ls "$path"/energy*_input 2>/dev/null)" files="$(sensors_check_files "$files")" [ -z "$files" ] && continue - echo "CHART sensors.energy_$id '' '$name Energy' 'Joule' 'energy' 'sensors.energy' areastack $((sensors_priority + 6)) $sensors_update_every '' '' 'sensors'" - echo >>"$TMP_DIR/sensors.sh" "echo \"BEGIN sensors.energy_$id \$1\"" + echo "CHART 'sensors.energy_${id}_${name}' '' 'Energy' 'Joule' 'energy' 'sensors.energy' areastack $((sensors_priority + 6)) $sensors_update_every '' '' 'sensors'" + echo >>"$TMP_DIR/sensors.sh" "echo \"BEGIN 'sensors.energy_${id}_${name}' \$1\"" algorithm="incremental" divisor=1000000 ;; @@ -197,8 +197,8 @@ sensors_create() { files="$(ls "$path"/humidity*_input 2>/dev/null)" files="$(sensors_check_files "$files")" [ -z "$files" ] && continue - echo "CHART sensors.humidity_$id '' '$name Humidity' 'Percent' 'humidity' 'sensors.humidity' line $((sensors_priority + 7)) $sensors_update_every '' '' 'sensors'" - echo >>"$TMP_DIR/sensors.sh" "echo \"BEGIN sensors.humidity_$id \$1\"" + echo "CHART 'sensors.humidity_${id}_${name}' '' 'Humidity' 'Percent' 'humidity' 'sensors.humidity' line $((sensors_priority + 7)) $sensors_update_every '' '' 'sensors'" + echo >>"$TMP_DIR/sensors.sh" "echo \"BEGIN 'sensors.humidity_${id}_${name}' \$1\"" divisor=1000 ;; diff --git a/collectors/checks.plugin/README.md b/collectors/checks.plugin/README.md index 5f1a6b912..6e2cf5dea 100644 --- a/collectors/checks.plugin/README.md +++ b/collectors/checks.plugin/README.md @@ -7,4 +7,4 @@ custom_edit_url: https://github.com/netdata/netdata/edit/master/collectors/check A debugging plugin (by default it is disabled) -[](<>) + diff --git a/collectors/cups.plugin/README.md b/collectors/cups.plugin/README.md index 373602dca..e3d2e1661 100644 --- a/collectors/cups.plugin/README.md +++ b/collectors/cups.plugin/README.md @@ -59,4 +59,4 @@ For each destination the plugin provides these charts: At the moment only job status pending, processing, and held are reported because we do not have a method to collect stopped, canceled, aborted and completed jobs which scales. -[]() + diff --git a/collectors/cups.plugin/cups_plugin.c b/collectors/cups.plugin/cups_plugin.c index a4c94d1d6..cc57dbf1f 100644 --- a/collectors/cups.plugin/cups_plugin.c +++ b/collectors/cups.plugin/cups_plugin.c @@ -161,12 +161,12 @@ struct job_metrics *get_job_metrics(char *dest) { reset_job_metrics(&new_job_metrics, NULL); jm = dictionary_set(dict_dest_job_metrics, dest, &new_job_metrics, sizeof(struct job_metrics)); - printf("CHART cups.job_num_%s '' 'Active job number of destination %s' jobs '%s' job_num stacked %i %i\n", dest, dest, dest, netdata_priority++, netdata_update_every); + printf("CHART cups.job_num_%s '' 'Active job number of destination %s' jobs '%s' cups.job_num stacked %i %i\n", dest, dest, dest, netdata_priority++, netdata_update_every); printf("DIMENSION pending '' absolute 1 1\n"); printf("DIMENSION held '' absolute 1 1\n"); printf("DIMENSION processing '' absolute 1 1\n"); - printf("CHART cups.job_size_%s '' 'Active job size of destination %s' KB '%s' job_size stacked %i %i\n", dest, dest, dest, netdata_priority++, netdata_update_every); + printf("CHART cups.job_size_%s '' 'Active job size of destination %s' KB '%s' cups.job_size stacked %i %i\n", dest, dest, dest, netdata_priority++, netdata_update_every); printf("DIMENSION pending '' absolute 1 1\n"); printf("DIMENSION held '' absolute 1 1\n"); printf("DIMENSION processing '' absolute 1 1\n"); @@ -195,12 +195,12 @@ int collect_job_metrics(char *name, void *entry, void *data) { "END\n", name, jm->size_pending, jm->size_held, jm->size_processing); } else { - printf("CHART cups.job_num_%s '' 'Active job number of destination %s' jobs '%s' job_num stacked 1 %i 'obsolete'\n", name, name, name, netdata_update_every); + printf("CHART cups.job_num_%s '' 'Active job number of destination %s' jobs '%s' cups.job_num stacked 1 %i 'obsolete'\n", name, name, name, netdata_update_every); printf("DIMENSION pending '' absolute 1 1\n"); printf("DIMENSION held '' absolute 1 1\n"); printf("DIMENSION processing '' absolute 1 1\n"); - printf("CHART cups.job_size_%s '' 'Active job size of destination %s' KB '%s' job_size stacked 1 %i 'obsolete'\n", name, name, name, netdata_update_every); + printf("CHART cups.job_size_%s '' 'Active job size of destination %s' KB '%s' cups.job_size stacked 1 %i 'obsolete'\n", name, name, name, netdata_update_every); printf("DIMENSION pending '' absolute 1 1\n"); printf("DIMENSION held '' absolute 1 1\n"); printf("DIMENSION processing '' absolute 1 1\n"); @@ -375,22 +375,22 @@ int main(int argc, char **argv) { if (unlikely(!cups_printer_by_option_created)) { cups_printer_by_option_created = 1; - printf("CHART cups.dest_state '' 'Destinations by state' dests overview dests stacked 100000 %i\n", netdata_update_every); + printf("CHART cups.dest_state '' 'Destinations by state' dests overview cups.dests_state stacked 100000 %i\n", netdata_update_every); printf("DIMENSION idle '' absolute 1 1\n"); printf("DIMENSION printing '' absolute 1 1\n"); printf("DIMENSION stopped '' absolute 1 1\n"); - printf("CHART cups.dest_option '' 'Destinations by option' dests overview dests line 100001 %i\n", netdata_update_every); + printf("CHART cups.dest_option '' 'Destinations by option' dests overview cups.dests_option line 100001 %i\n", netdata_update_every); printf("DIMENSION total '' absolute 1 1\n"); printf("DIMENSION acceptingjobs '' absolute 1 1\n"); printf("DIMENSION shared '' absolute 1 1\n"); - printf("CHART cups.job_num '' 'Total active job number' jobs overview job_num stacked 100002 %i\n", netdata_update_every); + printf("CHART cups.job_num '' 'Total active job number' jobs overview cups.job_num stacked 100002 %i\n", netdata_update_every); printf("DIMENSION pending '' absolute 1 1\n"); printf("DIMENSION held '' absolute 1 1\n"); printf("DIMENSION processing '' absolute 1 1\n"); - printf("CHART cups.job_size '' 'Total active job size' KB overview job_size stacked 100003 %i\n", netdata_update_every); + printf("CHART cups.job_size '' 'Total active job size' KB overview cups.job_size stacked 100003 %i\n", netdata_update_every); printf("DIMENSION pending '' absolute 1 1\n"); printf("DIMENSION held '' absolute 1 1\n"); printf("DIMENSION processing '' absolute 1 1\n"); diff --git a/collectors/diskspace.plugin/README.md b/collectors/diskspace.plugin/README.md index a8b41c861..c037a0b16 100644 --- a/collectors/diskspace.plugin/README.md +++ b/collectors/diskspace.plugin/README.md @@ -40,4 +40,4 @@ Charts can be enabled/disabled for every mount separately: > for disks performance monitoring, see the `proc` plugin, [here](/collectors/proc.plugin/README.md#monitoring-disks) -[](<>) + diff --git a/collectors/diskspace.plugin/plugin_diskspace.c b/collectors/diskspace.plugin/plugin_diskspace.c index c148e415a..b6a52c061 100644 --- a/collectors/diskspace.plugin/plugin_diskspace.c +++ b/collectors/diskspace.plugin/plugin_diskspace.c @@ -284,7 +284,7 @@ static inline void do_disk_space_stats(struct mountinfo *mi, int update_every) { m->st_space = rrdset_find_active_bytype_localhost("disk_space", disk); if(unlikely(!m->st_space)) { char title[4096 + 1]; - snprintfz(title, 4096, "Disk Space Usage for %s [%s]", family, mi->mount_source); + snprintfz(title, 4096, "Disk Space Usage"); m->st_space = rrdset_create_localhost( "disk_space" , disk @@ -326,7 +326,7 @@ static inline void do_disk_space_stats(struct mountinfo *mi, int update_every) { m->st_inodes = rrdset_find_active_bytype_localhost("disk_inodes", disk); if(unlikely(!m->st_inodes)) { char title[4096 + 1]; - snprintfz(title, 4096, "Disk Files (inodes) Usage for %s [%s]", family, mi->mount_source); + snprintfz(title, 4096, "Disk Files (inodes) Usage"); m->st_inodes = rrdset_create_localhost( "disk_inodes" , disk diff --git a/collectors/ebpf.plugin/README.md b/collectors/ebpf.plugin/README.md index babcd5206..c32133b1c 100644 --- a/collectors/ebpf.plugin/README.md +++ b/collectors/ebpf.plugin/README.md @@ -8,51 +8,405 @@ sidebar_label: "eBPF" # eBPF monitoring with Netdata -eBPF consists of a wide toolchain that ultimately outputs a set of bytecode that will run inside the eBPF virtual -machine (VM) which lives inside the Linux kernel. The program in particular is executed in response to a [tracepoint -or kprobe](#probes-and-tracepoints) activation. +The Netdata Agent provides many [eBPF](https://ebpf.io/what-is-ebpf/) programs to help you troubleshoot and debug how applications interact with the Linux kernel. The `ebpf.plugin` uses [tracepoints, trampoline, and2 kprobes](#data-collection) to collect a wide array of high value data about the host that would otherwise be impossible to capture. -Netdata has written many eBPF programs, which, when compiled and integrated into the Netdata Agent, are able to collect -a wide array of data about the host that would otherwise be impossible. The data eBPF programs can collect is truly unique, -which gives the Netdata Agent access to data that is high value but normally hard to capture. +> ❗ eBPF monitoring only works on Linux systems and with specific Linux kernels, including all kernels newer than `4.11.0`, and all kernels on CentOS 7.6 or later. For kernels older than `4.11.0`, improved support is in active development. -eBPF monitoring can help you troubleshoot and debug how applications interact with the Linux kernel. See -our [guide on troubleshooting apps with eBPF metrics](/docs/guides/troubleshoot/monitor-debug-applications-ebpf.md) for -configuration and troubleshooting tips. +This document provides comprehensive details about the `ebpf.plugin`. +For hands-on configuration and troubleshooting tips see our [tutorial on troubleshooting apps with eBPF metrics](/docs/guides/troubleshoot/monitor-debug-applications-ebpf.md). <figure> <img src="https://user-images.githubusercontent.com/1153921/74746434-ad6a1e00-5222-11ea-858a-a7882617ae02.png" alt="An example of VFS charts, made possible by the eBPF collector plugin" /> - <figcaption>An example of VFS charts made possible by the eBPF collector plugin.</figcaption> + <figcaption>An example of virtual file system (VFS) charts made possible by the eBPF collector plugin.</figcaption> </figure> -## Probes and Tracepoints +<a id="data-collection"> </a> -The following two features from the Linux kernel are used by Netdata to run eBPF programs: +## How Netdata collects data using probes and tracepoints -- Kprobes and return probes (kretprobe): Probes can insert virtually into any kernel instruction. When eBPF runs in - `entry` mode, it attaches only `kprobes` for internal functions monitoring calls and some arguments every time a - function is called. The user can also change configuration to use [`return`](#global) mode, and this will allow users - to monitor return from these functions and detect possible failures. -- Tracepoints are hooks to call specific functions. Tracepoints are more stable than `kprobes` and are preferred when - both options are available. +Netdata uses the following features from the Linux kernel to run eBPF programs: -In each case, wherever a normal kprobe, kretprobe, or tracepoint would have run its hook function, an eBPF program is -run instead, performing various collection logic before letting the kernel continue its normal control flow. +- Tracepoints are hooks to call specific functions. Tracepoints are more stable than `kprobes` and are preferred when + both options are available. +- Trampolines are bridges between kernel functions, and BPF programs. Netdata uses them by default whenever available. +- Kprobes and return probes (`kretprobe`): Probes can insert virtually into any kernel instruction. When eBPF runs in `entry` mode, it attaches only `kprobes` for internal functions monitoring calls and some arguments every time a function is called. The user can also change configuration to use [`return`](#global) mode, and this will allow users to monitor return from these functions and detect possible failures. -There are more methods by which eBPF programs can be triggered but which are not currently supported, such as via uprobes -which allow hooking into arbitrary user-space functions in a similar manner to kprobes. +In each case, wherever a normal kprobe, kretprobe, or tracepoint would have run its hook function, an eBPF program is run instead, performing various collection logic before letting the kernel continue its normal control flow. -## Manually enable the collector on Linux +There are more methods to trigger eBPF programs, such as uprobes, but currently are not supported. -**The eBPF collector is installed and enabled by default on most new installations of the Agent**. The eBPF collector -does not currently work with [static build installations](/packaging/installer/methods/kickstart.md#static-builds) for kernels older -than `4.11`, but improved support is in active development. +## Configuring ebpf.plugin -eBPF monitoring only works on Linux systems and with specific Linux kernels, including all kernels newer than `4.11.0`, -and all kernels on CentOS 7.6 or later. +The eBPF collector is installed and enabled by default on most new installations of the Agent. +If your Agent is v1.22 or older, you may to enable the collector yourself. -If your Agent is v1.22 or older, you may to enable the collector yourself. See the [configuration](#configuration) -section for details. +### Enable the eBPF collector + +To enable or disable the entire eBPF collector: + +1. Navigate to the [Netdata config directory](/docs/configure/nodes.md#the-netdata-config-directory). + ```bash + cd /etc/netdata + ``` + +2. Use the [`edit-config`](/docs/configure/nodes.md#use-edit-config-to-edit-configuration-files) script to edit `netdata.conf`. + + ```bash + ./edit-config netdata.conf + ``` + +3. Enable the collector by scrolling down to the `[plugins]` section. Uncomment the line `ebpf` (not + `ebpf_process`) and set it to `yes`. + + ```conf + [plugins] + ebpf = yes + ``` + +### Configure the eBPF collector + +You can configure the eBPF collector's behavior to fine-tune which metrics you receive and [optimize performance]\(#performance opimization). + +To edit the `ebpf.d.conf`: + +1. Navigate to the [Netdata config directory](/docs/configure/nodes.md#the-netdata-config-directory). + ```bash + cd /etc/netdata + ``` +2. Use the [`edit-config`](/docs/configure/nodes.md#use-edit-config-to-edit-configuration-files) script to edit [`ebpf.d.conf`](https://github.com/netdata/netdata/blob/master/collectors/ebpf.plugin/ebpf.d.conf). + + ```bash + ./edit-config ebpf.d.conf + ``` + + You can now edit the behavior of the eBPF collector. The following sections describe each configuration option in detail. + +### `[global]` configuration options + +The `[global]` section defines settings for the whole eBPF collector. + +#### eBPF load mode + +The collector uses two different eBPF programs. These programs rely on the same functions inside the kernel, but they +monitor, process, and display different kinds of information. + +By default, this plugin uses the `entry` mode. Changing this mode can create significant overhead on your operating +system, but also offer valuable information if you are developing or debugging software. The `ebpf load mode` option +accepts the following values: + +- `entry`: This is the default mode. In this mode, the eBPF collector only monitors calls for the functions described in + the sections above, and does not show charts related to errors. +- `return`: In the `return` mode, the eBPF collector monitors the same kernel functions as `entry`, but also creates new + charts for the return of these functions, such as errors. Monitoring function returns can help in debugging software, + such as failing to close file descriptors or creating zombie processes. +- `update every`: Number of seconds used for eBPF to send data for Netdata. +- `pid table size`: Defines the maximum number of PIDs stored inside the application hash table. + +#### Integration with `apps.plugin` + +The eBPF collector also creates charts for each running application through an integration with the +[`apps.plugin`](/collectors/apps.plugin/README.md). This integration helps you understand how specific applications +interact with the Linux kernel. + +If you want to _disable_ the integration with `apps.plugin` along with the above charts, change the setting `apps` to +`no`. + +```conf +[global] + apps = yes +``` + +When the integration is enabled, eBPF collector allocates memory for each process running. The total allocated memory +has direct relationship with the kernel version. When the eBPF plugin is running on kernels newer than `4.15`, it uses +per-cpu maps to speed up the update of hash tables. This also implies storing data for the same PID for each processor +it runs. + +#### Integration with `cgroups.plugin` + +The eBPF collector also creates charts for each cgroup through an integration with the +[`cgroups.plugin`](/collectors/cgroups.plugin/README.md). This integration helps you understand how a specific cgroup +interacts with the Linux kernel. + +The integration with `cgroups.plugin` is disabled by default to avoid creating overhead on your system. If you want to +_enable_ the integration with `cgroups.plugin`, change the `cgroups` setting to `yes`. + +```conf +[global] + cgroups = yes +``` + +If you do not need to monitor specific metrics for your `cgroups`, you can enable `cgroups` inside +`ebpf.d.conf`, and then disable the plugin for a specific `thread` by following the steps in the +[Configuration](#configuration) section. + +#### Integration Dashboard Elements + +When an integration is enabled, your dashboard will also show the following cgroups and apps charts using low-level +Linux metrics: + +> Note: The parenthetical accompanying each bulleted item provides the chart name. + +- mem + - Number of processes killed due out of memory. (`oomkills`) +- process + - Number of processes created with `do_fork`. (`process_create`) + - Number of threads created with `do_fork` or `clone (2)`, depending on your system's kernel + version. (`thread_create`) + - Number of times that a process called `do_exit`. (`task_exit`) + - Number of times that a process called `release_task`. (`task_close`) + - Number of times that an error happened to create thread or process. (`task_error`) +- swap + - Number of calls to `swap_readpage`. (`swap_read_call`) + - Number of calls to `swap_writepage`. (`swap_write_call`) +- network + - Number of outbound connections using TCP/IPv4. (`outbound_conn_ipv4`) + - Number of outbound connections using TCP/IPv6. (`outbound_conn_ipv6`) + - Number of bytes sent. (`total_bandwidth_sent`) + - Number of bytes received. (`total_bandwidth_recv`) + - Number of calls to `tcp_sendmsg`. (`bandwidth_tcp_send`) + - Number of calls to `tcp_cleanup_rbuf`. (`bandwidth_tcp_recv`) + - Number of calls to `tcp_retransmit_skb`. (`bandwidth_tcp_retransmit`) + - Number of calls to `udp_sendmsg`. (`bandwidth_udp_send`) + - Number of calls to `udp_recvmsg`. (`bandwidth_udp_recv`) +- file access + - Number of calls to open files. (`file_open`) + - Number of calls to open files that returned errors. (`open_error`) + - Number of files closed. (`file_closed`) + - Number of calls to close files that returned errors. (`file_error_closed`) +- vfs + - Number of calls to `vfs_unlink`. (`file_deleted`) + - Number of calls to `vfs_write`. (`vfs_write_call`) + - Number of calls to write a file that returned errors. (`vfs_write_error`) + - Number of calls to `vfs_read`. (`vfs_read_call`) + - - Number of calls to read a file that returned errors. (`vfs_read_error`) + - Number of bytes written with `vfs_write`. (`vfs_write_bytes`) + - Number of bytes read with `vfs_read`. (`vfs_read_bytes`) + - Number of calls to `vfs_fsync`. (`vfs_fsync`) + - Number of calls to sync file that returned errors. (`vfs_fsync_error`) + - Number of calls to `vfs_open`. (`vfs_open`) + - Number of calls to open file that returned errors. (`vfs_open_error`) + - Number of calls to `vfs_create`. (`vfs_create`) + - Number of calls to open file that returned errors. (`vfs_create_error`) +- page cache + - Ratio of pages accessed. (`cachestat_ratio`) + - Number of modified pages ("dirty"). (`cachestat_dirties`) + - Number of accessed pages. (`cachestat_hits`) + - Number of pages brought from disk. (`cachestat_misses`) +- directory cache + - Ratio of files available in directory cache. (`dc_hit_ratio`) + - Number of files accessed. (`dc_reference`) + - Number of files accessed that were not in cache. (`dc_not_cache`) + - Number of files not found. (`dc_not_found`) +- ipc shm + - Number of calls to `shm_get`. (`shmget_call`) + - Number of calls to `shm_at`. (`shmat_call`) + - Number of calls to `shm_dt`. (`shmdt_call`) + - Number of calls to `shm_ctl`. (`shmctl_call`) + +### `[ebpf programs]` configuration options + +The eBPF collector enables and runs the following eBPF programs by default: + +- `fd` : This eBPF program creates charts that show information about calls to open files. +- `mount`: This eBPF program creates charts that show calls to syscalls mount(2) and umount(2). +- `shm`: This eBPF program creates charts that show calls to syscalls shmget(2), shmat(2), shmdt(2) and shmctl(2). +- `sync`: Monitor calls to syscalls sync(2), fsync(2), fdatasync(2), syncfs(2), msync(2), and sync_file_range(2). +- `network viewer`: This eBPF program creates charts with information about `TCP` and `UDP` functions, including the + bandwidth consumed by each. +- `vfs`: This eBPF program creates charts that show information about VFS (Virtual File System) functions. +- `process`: This eBPF program creates charts that show information about process life. When in `return` mode, it also + creates charts showing errors when these operations are executed. +- `hardirq`: This eBPF program creates charts that show information about time spent servicing individual hardware + interrupt requests (hard IRQs). +- `softirq`: This eBPF program creates charts that show information about time spent servicing individual software + interrupt requests (soft IRQs). +- `oomkill`: This eBPF program creates a chart that shows OOM kills for all applications recognized via + the `apps.plugin` integration. Note that this program will show application charts regardless of whether apps + integration is turned on or off. + +You can also enable the following eBPF programs: + +- `cachestat`: Netdata's eBPF data collector creates charts about the memory page cache. When the integration with + [`apps.plugin`](/collectors/apps.plugin/README.md) is enabled, this collector creates charts for the whole host _and_ + for each application. +- `dcstat` : This eBPF program creates charts that show information about file access using directory cache. It appends + `kprobes` for `lookup_fast()` and `d_lookup()` to identify if files are inside directory cache, outside and files are + not found. +- `disk` : This eBPF program creates charts that show information about disk latency independent of filesystem. +- `filesystem` : This eBPF program creates charts that show information about some filesystem latency. +- `swap` : This eBPF program creates charts that show information about swap access. +- `mdflush`: This eBPF program creates charts that show information about + multi-device software flushes. + +### Configuring eBPF threads + +You can configure each thread of the eBPF data collector. This allows you to overwrite global options defined in `/etc/netdata/ebpf.d.conf` and configure specific options for each thread. + +To configure an eBPF thread: + +1. Navigate to the [Netdata config directory](/docs/configure/nodes.md#the-netdata-config-directory). + ```bash + cd /etc/netdata + ``` +2. Use the [`edit-config`](/docs/configure/nodes.md#use-edit-config-to-edit-configuration-files) script to edit a thread configuration file. The following configuration files are available: + + - `network.conf`: Configuration for the [`network` thread](#network-configuration). This config file overwrites the global options and also + lets you specify which network the eBPF collector monitors. + - `process.conf`: Configuration for the [`process` thread](#sync-configuration). + - `cachestat.conf`: Configuration for the `cachestat` thread(#filesystem-configuration). + - `dcstat.conf`: Configuration for the `dcstat` thread. + - `disk.conf`: Configuration for the `disk` thread. + - `fd.conf`: Configuration for the `file descriptor` thread. + - `filesystem.conf`: Configuration for the `filesystem` thread. + - `hardirq.conf`: Configuration for the `hardirq` thread. + - `softirq.conf`: Configuration for the `softirq` thread. + - `sync.conf`: Configuration for the `sync` thread. + - `vfs.conf`: Configuration for the `vfs` thread. + + ```bash + ./edit-config FILE.conf + ``` + +### Network configuration + +The network configuration has specific options to configure which network(s) the eBPF collector monitors. These options +are divided in the following sections: + +#### `[network connections]` + +You can configure the information shown on `outbound` and `inbound` charts with the settings in this section. + +```conf +[network connections] + maximum dimensions = 500 + resolve hostname ips = no + ports = 1-1024 !145 !domain + hostnames = !example.com + ips = !127.0.0.1/8 10.0.0.0/8 172.16.0.0/12 192.168.0.0/16 fc00::/7 +``` + +When you define a `ports` setting, Netdata will collect network metrics for that specific port. For example, if you +write `ports = 19999`, Netdata will collect only connections for itself. The `hostnames` setting accepts +[simple patterns](/libnetdata/simple_pattern/README.md). The `ports`, and `ips` settings accept negation (`!`) to deny +specific values or asterisk alone to define all values. + +In the above example, Netdata will collect metrics for all ports between 1 and 443, with the exception of 53 (domain) +and 145. + +The following options are available: + +- `ports`: Define the destination ports for Netdata to monitor. +- `hostnames`: The list of hostnames that can be resolved to an IP address. +- `ips`: The IP or range of IPs that you want to monitor. You can use IPv4 or IPv6 addresses, use dashes to define a + range of IPs, or use CIDR values. By default, only data for private IP addresses is collected, but this can + be changed with the `ips` setting. + +By default, Netdata displays up to 500 dimensions on network connection charts. If there are more possible dimensions, +they will be bundled into the `other` dimension. You can increase the number of shown dimensions by changing +the `maximum dimensions` setting. + +The dimensions for the traffic charts are created using the destination IPs of the sockets by default. This can be +changed setting `resolve hostname ips = yes` and restarting Netdata, after this Netdata will create dimensions using +the `hostnames` every time that is possible to resolve IPs to their hostnames. + +#### `[service name]` + +Netdata uses the list of services in `/etc/services` to plot network connection charts. If this file does not contain +the name for a particular service you use in your infrastructure, you will need to add it to the `[service name]` +section. + +For example, Netdata's default port (`19999`) is not listed in `/etc/services`. To associate that port with the Netdata +service in network connection charts, and thus see the name of the service instead of its port, define it: + +```conf +[service name] + 19999 = Netdata +``` + +### Sync configuration + +The sync configuration has specific options to disable monitoring for syscalls. All syscalls are monitored by default. + +```conf +[syscalls] + sync = yes + msync = yes + fsync = yes + fdatasync = yes + syncfs = yes + sync_file_range = yes +``` + +### Filesystem configuration + +The filesystem configuration has specific options to disable monitoring for filesystems; by default, all filesystems are +monitored. + +```conf +[filesystem] + btrfsdist = yes + ext4dist = yes + nfsdist = yes + xfsdist = yes + zfsdist = yes +``` + +The ebpf program `nfsdist` monitors only `nfs` mount points. + +## Troubleshooting + +If the eBPF collector does not work, you can troubleshoot it by running the `ebpf.plugin` command and investigating its +output. + +```bash +cd /usr/libexec/netdata/plugins.d/ +sudo su -s /bin/bash ./ebpf.plugin +``` + +You can also use `grep` to search the Agent's `error.log` for messages related to eBPF monitoring. + +```bash +grep -i ebpf /var/log/netdata/error.log +``` + +### Confirm kernel compatibility + +The eBPF collector only works on Linux systems and with specific Linux kernels. We support all kernels more recent than +`4.11.0`, and all kernels on CentOS 7.6 or later. + +You can run our helper script to determine whether your system can support eBPF monitoring. If it returns no output, your system is ready to compile and run the eBPF collector. + +```bash +curl -sSL https://raw.githubusercontent.com/netdata/kernel-collector/master/tools/check-kernel-config.sh | sudo bash +``` + + +If you see a warning about a missing kernel +configuration (`KPROBES KPROBES_ON_FTRACE HAVE_KPROBES BPF BPF_SYSCALL BPF_JIT`), you will need to recompile your kernel +to support this configuration. The process of recompiling Linux kernels varies based on your distribution and version. +Read the documentation for your system's distribution to learn more about the specific workflow for recompiling the +kernel, ensuring that you set all the necessary + +- [Ubuntu](https://wiki.ubuntu.com/Kernel/BuildYourOwnKernel) +- [Debian](https://kernel-team.pages.debian.net/kernel-handbook/ch-common-tasks.html#s-common-official) +- [Fedora](https://fedoraproject.org/wiki/Building_a_custom_kernel) +- [CentOS](https://wiki.centos.org/HowTos/Custom_Kernel) +- [Arch Linux](https://wiki.archlinux.org/index.php/Kernel/Traditional_compilation) +- [Slackware](https://docs.slackware.com/howtos:slackware_admin:kernelbuilding) + +### Mount `debugfs` and `tracefs` + +The eBPF collector also requires both the `tracefs` and `debugfs` filesystems. Try mounting the `tracefs` and `debugfs` +filesystems using the commands below: + +```bash +sudo mount -t debugfs nodev /sys/kernel/debug +sudo mount -t tracefs nodev /sys/kernel/tracing +``` + +If they are already mounted, you will see an error. You can also configure your system's `/etc/fstab` configuration to +mount these filesystems on startup. More information can be found in +the [ftrace documentation](https://www.kernel.org/doc/Documentation/trace/ftrace.txt). ## Charts @@ -64,8 +418,7 @@ collected in the previous and current seconds. ### System overview -Not all charts within the System Overview menu are enabled by default, because they add around 100ns overhead for each -function call, this number is small for a human perspective, but the functions are called many times creating an impact +Not all charts within the System Overview menu are enabled by default. Charts that rely on `kprobes` are disabled by default because they add around 100ns overhead for each function call. This is a small number from a human's perspective, but the functions are called many times and create an impact on host. See the [configuration](#configuration) section for details about how to enable them. #### Processes @@ -74,12 +427,12 @@ Internally, the Linux kernel treats both processes and threads as `tasks`. To cr system calls: `fork(2)`, `vfork(2)`, and `clone(2)`. To generate this chart, the eBPF collector uses the following `tracepoints` and `kprobe`: -- `sched/sched_process_fork`: Tracepoint called after a call for `fork (2)`, `vfork (2)` and `clone (2)`. -- `sched/sched_process_exec`: Tracepoint called after a exec-family syscall. -- `kprobe/kernel_clone`: This is the main [`fork()`](https://elixir.bootlin.com/linux/v5.10/source/kernel/fork.c#L2415) - routine since kernel `5.10.0` was released. -- `kprobe/_do_fork`: Like `kernel_clone`, but this was the main function between kernels `4.2.0` and `5.9.16` -- `kprobe/do_fork`: This was the main function before kernel `4.2.0`. +- `sched/sched_process_fork`: Tracepoint called after a call for `fork (2)`, `vfork (2)` and `clone (2)`. +- `sched/sched_process_exec`: Tracepoint called after a exec-family syscall. +- `kprobe/kernel_clone`: This is the main [`fork()`](https://elixir.bootlin.com/linux/v5.10/source/kernel/fork.c#L2415) + routine since kernel `5.10.0` was released. +- `kprobe/_do_fork`: Like `kernel_clone`, but this was the main function between kernels `4.2.0` and `5.9.16` +- `kprobe/do_fork`: This was the main function before kernel `4.2.0`. #### Process Exit @@ -88,9 +441,9 @@ system that the task is finishing its work. The second step is to release the ke function `release_task`. The difference between the two dimensions can help you discover [zombie processes](https://en.wikipedia.org/wiki/Zombie_process). To get the metrics, the collector uses: -- `sched/sched_process_exit`: Tracepoint called after a task exits. -- `kprobe/release_task`: This function is called when a process exits, as the kernel still needs to remove the process - descriptor. +- `sched/sched_process_exit`: Tracepoint called after a task exits. +- `kprobe/release_task`: This function is called when a process exits, as the kernel still needs to remove the process + descriptor. #### Task error @@ -100,7 +453,7 @@ process and thread creation only. #### Swap Inside the swap submenu the eBPF plugin creates the chart `swapcalls`; this chart is displaying when processes are -calling functions [`swap_readpage` and `swap_writepage`](https://hzliu123.github.io/linux-kernel/Page%20Cache%20in%20Linux%202.6.pdf ), +calling functions [`swap_readpage` and `swap_writepage`](https://hzliu123.github.io/linux-kernel/Page%20Cache%20in%20Linux%202.6.pdf), which are functions responsible for doing IO in swap memory. To collect the exact moment that an access to swap happens, the collector attaches `kprobes` for cited functions. @@ -108,91 +461,108 @@ the collector attaches `kprobes` for cited functions. The following `tracepoints` are used to measure time usage for soft IRQs: -- [`irq/softirq_entry`](https://www.kernel.org/doc/html/latest/core-api/tracepoint.html#c.trace_softirq_entry): Called - before softirq handler -- [`irq/softirq_exit`](https://www.kernel.org/doc/html/latest/core-api/tracepoint.html#c.trace_softirq_exit): Called when - softirq handler returns. +- [`irq/softirq_entry`](https://www.kernel.org/doc/html/latest/core-api/tracepoint.html#c.trace_softirq_entry): Called + before softirq handler +- [`irq/softirq_exit`](https://www.kernel.org/doc/html/latest/core-api/tracepoint.html#c.trace_softirq_exit): Called when + softirq handler returns. #### Hard IRQ The following tracepoints are used to measure the latency of servicing a hardware interrupt request (hard IRQ). -- [`irq/irq_handler_entry`](https://www.kernel.org/doc/html/latest/core-api/tracepoint.html#c.trace_irq_handler_entry): - Called immediately before the IRQ action handler. -- [`irq/irq_handler_exit`](https://www.kernel.org/doc/html/latest/core-api/tracepoint.html#c.trace_irq_handler_exit): - Called immediately after the IRQ action handler returns. -- `irq_vectors`: These are traces from `irq_handler_entry` and - `irq_handler_exit` when an IRQ is handled. The following elements from vector - are triggered: - - `irq_vectors/local_timer_entry` - - `irq_vectors/local_timer_exit` - - `irq_vectors/reschedule_entry` - - `irq_vectors/reschedule_exit` - - `irq_vectors/call_function_entry` - - `irq_vectors/call_function_exit` - - `irq_vectors/call_function_single_entry` - - `irq_vectors/call_function_single_xit` - - `irq_vectors/irq_work_entry` - - `irq_vectors/irq_work_exit` - - `irq_vectors/error_apic_entry` - - `irq_vectors/error_apic_exit` - - `irq_vectors/thermal_apic_entry` - - `irq_vectors/thermal_apic_exit` - - `irq_vectors/threshold_apic_entry` - - `irq_vectors/threshold_apic_exit` - - `irq_vectors/deferred_error_entry` - - `irq_vectors/deferred_error_exit` - - `irq_vectors/spurious_apic_entry` - - `irq_vectors/spurious_apic_exit` - - `irq_vectors/x86_platform_ipi_entry` - - `irq_vectors/x86_platform_ipi_exit` +- [`irq/irq_handler_entry`](https://www.kernel.org/doc/html/latest/core-api/tracepoint.html#c.trace_irq_handler_entry): + Called immediately before the IRQ action handler. +- [`irq/irq_handler_exit`](https://www.kernel.org/doc/html/latest/core-api/tracepoint.html#c.trace_irq_handler_exit): + Called immediately after the IRQ action handler returns. +- `irq_vectors`: These are traces from `irq_handler_entry` and + `irq_handler_exit` when an IRQ is handled. The following elements from vector + are triggered: + - `irq_vectors/local_timer_entry` + - `irq_vectors/local_timer_exit` + - `irq_vectors/reschedule_entry` + - `irq_vectors/reschedule_exit` + - `irq_vectors/call_function_entry` + - `irq_vectors/call_function_exit` + - `irq_vectors/call_function_single_entry` + - `irq_vectors/call_function_single_xit` + - `irq_vectors/irq_work_entry` + - `irq_vectors/irq_work_exit` + - `irq_vectors/error_apic_entry` + - `irq_vectors/error_apic_exit` + - `irq_vectors/thermal_apic_entry` + - `irq_vectors/thermal_apic_exit` + - `irq_vectors/threshold_apic_entry` + - `irq_vectors/threshold_apic_exit` + - `irq_vectors/deferred_error_entry` + - `irq_vectors/deferred_error_exit` + - `irq_vectors/spurious_apic_entry` + - `irq_vectors/spurious_apic_exit` + - `irq_vectors/x86_platform_ipi_entry` + - `irq_vectors/x86_platform_ipi_exit` #### IPC shared memory -To monitor shared memory system call counts, the following `kprobes` are used: +To monitor shared memory system call counts, Netdata attaches tracing in the following functions: -- `shmget`: Runs when [`shmget`](https://man7.org/linux/man-pages/man2/shmget.2.html) is called. -- `shmat`: Runs when [`shmat`](https://man7.org/linux/man-pages/man2/shmat.2.html) is called. -- `shmdt`: Runs when [`shmdt`](https://man7.org/linux/man-pages/man2/shmat.2.html) is called. -- `shmctl`: Runs when [`shmctl`](https://man7.org/linux/man-pages/man2/shmctl.2.html) is called. +- `shmget`: Runs when [`shmget`](https://man7.org/linux/man-pages/man2/shmget.2.html) is called. +- `shmat`: Runs when [`shmat`](https://man7.org/linux/man-pages/man2/shmat.2.html) is called. +- `shmdt`: Runs when [`shmdt`](https://man7.org/linux/man-pages/man2/shmat.2.html) is called. +- `shmctl`: Runs when [`shmctl`](https://man7.org/linux/man-pages/man2/shmctl.2.html) is called. ### Memory In the memory submenu the eBPF plugin creates two submenus **page cache** and **synchronization** with the following organization: -* Page Cache - * Page cache ratio - * Dirty pages - * Page cache hits - * Page cache misses -* Synchronization - * File sync - * Memory map sync - * File system sync - * File range sync +- Page Cache + - Page cache ratio + - Dirty pages + - Page cache hits + - Page cache misses +- Synchronization + - File sync + - Memory map sync + - File system sync + - File range sync -#### Page cache ratio +#### Page cache hits -The chart `cachestat_ratio` shows how processes are accessing page cache. In a normal scenario, we expect values around -100%, which means that the majority of the work on the machine is processed in memory. To calculate the ratio, Netdata -attaches `kprobes` for kernel functions: +When the processor needs to read or write a location in main memory, it checks for a corresponding entry in the page cache. + If the entry is there, a page cache hit has occurred and the read is from the cache. -- `add_to_page_cache_lru`: Page addition. -- `mark_page_accessed`: Access to cache. -- `account_page_dirtied`: Dirty (modified) pages. -- `mark_buffer_dirty`: Writes to page cache. +A page cache hit is when the page cache is successfully accessed with a read operation. We do not count pages that were +added relatively recently. #### Dirty pages +A "dirty page" is a page in the page cache that was modified after being created. Since non-dirty pages in the page cache + have identical copies in secondary storage (e.g. hard disk drive or solid-state drive), discarding and reusing their space + is much quicker than paging out application memory, and is often preferred over flushing the dirty pages into secondary storage + and reusing their space. + On `cachestat_dirties` Netdata demonstrates the number of pages that were modified. This chart shows the number of calls to the function `mark_buffer_dirty`. -#### Page cache hits +#### Page cache ratio -A page cache hit is when the page cache is successfully accessed with a read operation. We do not count pages that were -added relatively recently. +When the processor needs to read or write in a specific memory address, it checks for a corresponding entry in the page cache. +If the processor hits a page cache (`page cache hit`), it reads the entry from the cache. If there is no entry (`page cache miss`), + the kernel allocates a new entry and copies data from the disk. Netdata calculates the percentage of accessed files that are cached on + memory. The ratio is calculated counting the accessed cached pages + (without counting [dirty pages](#dirty-pages) and pages added because of read misses) divided by total access without dirty pages. + +> \_\_**\_\_\_\_**<ins>Number of accessed cached pages</ins>\***\*\_\_\*\***<br/> +> Number of total accessed pages - dirty pages - missed pages + +The chart `cachestat_ratio` shows how processes are accessing page cache. In a normal scenario, we expect values around +100%, which means that the majority of the work on the machine is processed in memory. To calculate the ratio, Netdata +attaches `kprobes` for kernel functions: + +- `add_to_page_cache_lru`: Page addition. +- `mark_page_accessed`: Access to cache. +- `account_page_dirtied`: Dirty (modified) pages. +- `mark_buffer_dirty`: Writes to page cache. #### Page cache misses @@ -213,7 +583,7 @@ changes to a file that was mapped into memory using [`mmap(2)`](https://man7.org #### File system sync -This chart monitors calls demonstrating commits from filesystem caches to disk. Netdata attaches `kprobes` for +This chart monitors calls demonstrating commits from filesystem caches to disk. Netdata attaches `tracing` for [`sync(2)`](https://man7.org/linux/man-pages/man2/sync.2.html), and [`syncfs(2)`](https://man7.org/linux/man-pages/man2/sync.2.html). #### File range sync @@ -240,23 +610,35 @@ By default, MD flush is disabled. To enable it, configure your To collect data related to Linux multi-device (MD) flushing, the following kprobe is used: -- `kprobe/md_flush_request`: called whenever a request for flushing multi-device data is made. +- `kprobe/md_flush_request`: called whenever a request for flushing multi-device data is made. ### Disk -The eBPF plugin also shows a chart in the Disk section when the `disk` thread is enabled. This will create the -chart `disk_latency_io` for each disk on the host. The following tracepoints are used: +The eBPF plugin also shows a chart in the Disk section when the `disk` thread is enabled. + +#### Disk Latency + +This will create the chart `disk_latency_io` for each disk on the host. The following tracepoints are used: -- [`block/block_rq_issue`](https://www.kernel.org/doc/html/latest/core-api/tracepoint.html#c.trace_block_rq_issue): - IO request operation to a device drive. -- [`block/block_rq_complete`](https://www.kernel.org/doc/html/latest/core-api/tracepoint.html#c.trace_block_rq_complete): - IO operation completed by device. +- [`block/block_rq_issue`](https://www.kernel.org/doc/html/latest/core-api/tracepoint.html#c.trace_block_rq_issue): + IO request operation to a device drive. +- [`block/block_rq_complete`](https://www.kernel.org/doc/html/latest/core-api/tracepoint.html#c.trace_block_rq_complete): + IO operation completed by device. + +Disk Latency is the single most important metric to focus on when it comes to storage performance, under most circumstances. +For hard drives, an average latency somewhere between 10 to 20 ms can be considered acceptable. For SSD (Solid State Drives), +in most cases, workloads experience less than 1 ms latency numbers, but workloads should never reach higher than 3 ms. +The dimensions refer to time intervals. ### Filesystem -This group has charts demonstrating how applications interact with the Linux -kernel to open and close file descriptors. It also brings latency charts for -several different filesystems. +This group has charts demonstrating how applications interact with the Linux kernel to open and close file descriptors. +It also brings latency charts for several different filesystems. + +#### Latency Algorithm + +We calculate the difference between the calling and return times, spanning disk I/O, file system operations (lock, I/O), +run queue latency and all events related to the monitored action. #### ext4 @@ -265,10 +647,10 @@ To measure the latency of executing some actions in an collector needs to attach `kprobes` and `kretprobes` for each of the following functions: -- `ext4_file_read_iter`: Function used to measure read latency. -- `ext4_file_write_iter`: Function used to measure write latency. -- `ext4_file_open`: Function used to measure open latency. -- `ext4_sync_file`: Function used to measure sync latency. +- `ext4_file_read_iter`: Function used to measure read latency. +- `ext4_file_write_iter`: Function used to measure write latency. +- `ext4_file_open`: Function used to measure open latency. +- `ext4_sync_file`: Function used to measure sync latency. #### ZFS @@ -276,10 +658,10 @@ To measure the latency of executing some actions in a zfs filesystem, the collector needs to attach `kprobes` and `kretprobes` for each of the following functions: -- `zpl_iter_read`: Function used to measure read latency. -- `zpl_iter_write`: Function used to measure write latency. -- `zpl_open`: Function used to measure open latency. -- `zpl_fsync`: Function used to measure sync latency. +- `zpl_iter_read`: Function used to measure read latency. +- `zpl_iter_write`: Function used to measure write latency. +- `zpl_open`: Function used to measure open latency. +- `zpl_fsync`: Function used to measure sync latency. #### XFS @@ -288,10 +670,10 @@ To measure the latency of executing some actions in an collector needs to attach `kprobes` and `kretprobes` for each of the following functions: -- `xfs_file_read_iter`: Function used to measure read latency. -- `xfs_file_write_iter`: Function used to measure write latency. -- `xfs_file_open`: Function used to measure open latency. -- `xfs_file_fsync`: Function used to measure sync latency. +- `xfs_file_read_iter`: Function used to measure read latency. +- `xfs_file_write_iter`: Function used to measure write latency. +- `xfs_file_open`: Function used to measure open latency. +- `xfs_file_fsync`: Function used to measure sync latency. #### NFS @@ -300,11 +682,11 @@ To measure the latency of executing some actions in an collector needs to attach `kprobes` and `kretprobes` for each of the following functions: -- `nfs_file_read`: Function used to measure read latency. -- `nfs_file_write`: Function used to measure write latency. -- `nfs_file_open`: Functions used to measure open latency. -- `nfs4_file_open`: Functions used to measure open latency for NFS v4. -- `nfs_getattr`: Function used to measure sync latency. +- `nfs_file_read`: Function used to measure read latency. +- `nfs_file_write`: Function used to measure write latency. +- `nfs_file_open`: Functions used to measure open latency. +- `nfs4_file_open`: Functions used to measure open latency for NFS v4. +- `nfs_getattr`: Function used to measure sync latency. #### btrfs @@ -312,26 +694,26 @@ To measure the latency of executing some actions in a [btrfs](https://elixir.boo filesystem, the collector needs to attach `kprobes` and `kretprobes` for each of the following functions: > Note: We are listing two functions used to measure `read` latency, but we use either `btrfs_file_read_iter` or -`generic_file_read_iter`, depending on kernel version. +> `generic_file_read_iter`, depending on kernel version. -- `btrfs_file_read_iter`: Function used to measure read latency since kernel `5.10.0`. -- `generic_file_read_iter`: Like `btrfs_file_read_iter`, but this function was used before kernel `5.10.0`. -- `btrfs_file_write_iter`: Function used to write data. -- `btrfs_file_open`: Function used to open files. -- `btrfs_sync_file`: Function used to synchronize data to filesystem. +- `btrfs_file_read_iter`: Function used to measure read latency since kernel `5.10.0`. +- `generic_file_read_iter`: Like `btrfs_file_read_iter`, but this function was used before kernel `5.10.0`. +- `btrfs_file_write_iter`: Function used to write data. +- `btrfs_file_open`: Function used to open files. +- `btrfs_sync_file`: Function used to synchronize data to filesystem. #### File descriptor To give metrics related to `open` and `close` events, instead of attaching kprobes for each syscall used to do these events, the collector attaches `kprobes` for the common function used for syscalls: -- [`do_sys_open`](https://0xax.gitbooks.io/linux-insides/content/SysCall/linux-syscall-5.html ): Internal function used to - open files. -- [`do_sys_openat2`](https://elixir.bootlin.com/linux/v5.6/source/fs/open.c#L1162): - Function called from `do_sys_open` since version `5.6.0`. -- [`close_fd`](https://www.mail-archive.com/linux-kernel@vger.kernel.org/msg2271761.html): Function used to close file - descriptor since kernel `5.11.0`. -- `__close_fd`: Function used to close files before version `5.11.0`. +- [`do_sys_open`](https://0xax.gitbooks.io/linux-insides/content/SysCall/linux-syscall-5.html): Internal function used to + open files. +- [`do_sys_openat2`](https://elixir.bootlin.com/linux/v5.6/source/fs/open.c#L1162): + Function called from `do_sys_open` since version `5.6.0`. +- [`close_fd`](https://www.mail-archive.com/linux-kernel@vger.kernel.org/msg2271761.html): Function used to close file + descriptor since kernel `5.11.0`. +- `__close_fd`: Function used to close files before version `5.11.0`. #### File error @@ -351,22 +733,22 @@ To measure the latency and total quantity of executing some VFS-level functions, ebpf.plugin needs to attach kprobes and kretprobes for each of the following functions: -- `vfs_write`: Function used monitoring the number of successful & failed - filesystem write calls, as well as the total number of written bytes. -- `vfs_writev`: Same function as `vfs_write` but for vector writes (i.e. a - single write operation using a group of buffers rather than 1). -- `vfs_read`: Function used for monitoring the number of successful & failed - filesystem read calls, as well as the total number of read bytes. -- `vfs_readv` Same function as `vfs_read` but for vector reads (i.e. a single - read operation using a group of buffers rather than 1). -- `vfs_unlink`: Function used for monitoring the number of successful & failed - filesystem unlink calls. -- `vfs_fsync`: Function used for monitoring the number of successful & failed - filesystem fsync calls. -- `vfs_open`: Function used for monitoring the number of successful & failed - filesystem open calls. -- `vfs_create`: Function used for monitoring the number of successful & failed - filesystem create calls. +- `vfs_write`: Function used monitoring the number of successful & failed + filesystem write calls, as well as the total number of written bytes. +- `vfs_writev`: Same function as `vfs_write` but for vector writes (i.e. a + single write operation using a group of buffers rather than 1). +- `vfs_read`: Function used for monitoring the number of successful & failed + filesystem read calls, as well as the total number of read bytes. +- `vfs_readv` Same function as `vfs_read` but for vector reads (i.e. a single + read operation using a group of buffers rather than 1). +- `vfs_unlink`: Function used for monitoring the number of successful & failed + filesystem unlink calls. +- `vfs_fsync`: Function used for monitoring the number of successful & failed + filesystem fsync calls. +- `vfs_open`: Function used for monitoring the number of successful & failed + filesystem open calls. +- `vfs_create`: Function used for monitoring the number of successful & failed + filesystem create calls. ##### VFS Deleted objects @@ -406,30 +788,49 @@ Metrics for directory cache are collected using kprobe for `lookup_fast`, becaus times this function is accessed. On the other hand, for `d_lookup` we are not only interested in the number of times it is accessed, but also in possible errors, so we need to attach a `kretprobe`. For this reason, the following is used: -- [`lookup_fast`](https://lwn.net/Articles/649115/): Called to look at data inside the directory cache. -- [`d_lookup`](https://git.kernel.org/pub/scm/linux/kernel/git/torvalds/linux.git/tree/fs/dcache.c?id=052b398a43a7de8c68c13e7fa05d6b3d16ce6801#n2223): - Called when the desired file is not inside the directory cache. +- [`lookup_fast`](https://lwn.net/Articles/649115/): Called to look at data inside the directory cache. +- [`d_lookup`](https://git.kernel.org/pub/scm/linux/kernel/git/torvalds/linux.git/tree/fs/dcache.c?id=052b398a43a7de8c68c13e7fa05d6b3d16ce6801#n2223): + Called when the desired file is not inside the directory cache. + +##### Directory Cache Interpretation + +When directory cache is showing 100% that means that every accessed file was present in the directory cache. +If files are not present in the directory cache, they are either not present in the file system or the files were not +accessed before. ### Mount Points -The following `kprobes` are used to collect `mount` & `unmount` call counts: +The following `tracing` are used to collect `mount` & `unmount` call counts: -- [`mount`](https://man7.org/linux/man-pages/man2/mount.2.html): mount filesystem on host. -- [`umount`](https://man7.org/linux/man-pages/man2/umount.2.html): umount filesystem on host. +- [`mount`](https://man7.org/linux/man-pages/man2/mount.2.html): mount filesystem on host. +- [`umount`](https://man7.org/linux/man-pages/man2/umount.2.html): umount filesystem on host. ### Networking Stack -Netdata monitors socket bandwidth attaching `kprobes` for internal functions. +Netdata monitors socket bandwidth attaching `tracing` for internal functions. + +#### TCP outbound connections + +This chart demonstrates calls to `tcp_v4_connection` and `tcp_v6_connection` that start connections for IPV4 and IPV6, respectively. -#### TCP functions +#### TCP inbound connections + +This chart demonstrates TCP and UDP connections that the host receives. +To collect this information, netdata attaches a tracing to `inet_csk_accept`. + +#### TCP bandwidth functions This chart demonstrates calls to functions `tcp_sendmsg`, `tcp_cleanup_rbuf`, and `tcp_close`; these functions are used to send & receive data and to close connections when `TCP` protocol is used. #### TCP bandwidth -Like the previous chart, this one also monitors `tcp_sendmsg` and `tcp_cleanup_rbuf`, but instead of showing the number -of calls, it demonstrates the number of bytes sent and received. +This chart demonstrates calls to functions: + +- `tcp_sendmsg`: Function responsible to send data for a specified destination. +- `tcp_cleanup_rbuf`: We use this function instead of `tcp_recvmsg`, because the last one misses `tcp_read_sock` traffic + and we would also need to add more `tracing` to get the socket and package size. +- `tcp_close`: Function responsible to close connection. #### TCP retransmit @@ -452,359 +853,11 @@ calls, it monitors the number of bytes sent and received. These are tracepoints related to [OOM](https://en.wikipedia.org/wiki/Out_of_memory) killing processes. -- `oom/mark_victim`: Monitors when an oomkill event happens. - -## Configuration - -Enable or disable the entire eBPF collector by editing `netdata.conf`. - -```bash -cd /etc/netdata/ # Replace with your Netdata configuration directory, if not /etc/netdata/ -./edit-config netdata.conf -``` - -To enable the collector, scroll down to the `[plugins]` section ensure the relevant line references `ebpf` (not -`ebpf_process`), is uncommented, and is set to `yes`. - -```conf -[plugins] - ebpf = yes -``` - -You can also configure the eBPF collector's behavior by editing `ebpf.d.conf`. - -```bash -cd /etc/netdata/ # Replace with your Netdata configuration directory, if not /etc/netdata/ -./edit-config ebpf.d.conf -``` - -### `[global]` - -The `[global]` section defines settings for the whole eBPF collector. - -#### eBPF load mode - -The collector has two different eBPF programs. These programs monitor the same functions inside the kernel, but they -monitor, process, and display different kinds of information. - -By default, this plugin uses the `entry` mode. Changing this mode can create significant overhead on your operating -system, but also offer valuable information if you are developing or debugging software. The `ebpf load mode` option -accepts the following values: - -- `entry`: This is the default mode. In this mode, the eBPF collector only monitors calls for the functions described in - the sections above, and does not show charts related to errors. -- `return`: In the `return` mode, the eBPF collector monitors the same kernel functions as `entry`, but also creates new - charts for the return of these functions, such as errors. Monitoring function returns can help in debugging software, - such as failing to close file descriptors or creating zombie processes. -- `update every`: Number of seconds used for eBPF to send data for Netdata. -- `pid table size`: Defines the maximum number of PIDs stored inside the application hash table. - -#### Integration with `apps.plugin` - -The eBPF collector also creates charts for each running application through an integration with the -[`apps.plugin`](/collectors/apps.plugin/README.md). This integration helps you understand how specific applications -interact with the Linux kernel. - -If you want to _disable_ the integration with `apps.plugin` along with the above charts, change the setting `apps` to -`no`. - -```conf -[global] - apps = yes -``` - -When the integration is enabled, eBPF collector allocates memory for each process running. The total allocated memory -has direct relationship with the kernel version. When the eBPF plugin is running on kernels newer than `4.15`, it uses -per-cpu maps to speed up the update of hash tables. This also implies storing data for the same PID for each processor -it runs. - -#### Integration with `cgroups.plugin` - -The eBPF collector also creates charts for each cgroup through an integration with the -[`cgroups.plugin`](/collectors/cgroups.plugin/README.md). This integration helps you understand how a specific cgroup -interacts with the Linux kernel. - -The integration with `cgroups.plugin` is disabled by default to avoid creating overhead on your system. If you want to -_enable_ the integration with `cgroups.plugin`, change the `cgroups` setting to `yes`. - -```conf -[global] - cgroups = yes -``` - -If you do not need to monitor specific metrics for your `cgroups`, you can enable `cgroups` inside -`ebpf.d.conf`, and then disable the plugin for a specific `thread` by following the steps in the -[Configuration](#configuration) section. - -#### Integration Dashboard Elements - -When an integration is enabled, your dashboard will also show the following cgroups and apps charts using low-level -Linux metrics: - -> Note: The parenthetical accompanying each bulleted item provides the chart name. - -- mem - - Number of processes killed due out of memory. (`oomkills`) -- process - - Number of processes created with `do_fork`. (`process_create`) - - Number of threads created with `do_fork` or `clone (2)`, depending on your system's kernel - version. (`thread_create`) - - Number of times that a process called `do_exit`. (`task_exit`) - - Number of times that a process called `release_task`. (`task_close`) - - Number of times that an error happened to create thread or process. (`task_error`) -- swap - - Number of calls to `swap_readpage`. (`swap_read_call`) - - Number of calls to `swap_writepage`. (`swap_write_call`) -- network - - Number of bytes sent. (`total_bandwidth_sent`) - - Number of bytes received. (`total_bandwidth_recv`) - - Number of calls to `tcp_sendmsg`. (`bandwidth_tcp_send`) - - Number of calls to `tcp_cleanup_rbuf`. (`bandwidth_tcp_recv`) - - Number of calls to `tcp_retransmit_skb`. (`bandwidth_tcp_retransmit`) - - Number of calls to `udp_sendmsg`. (`bandwidth_udp_send`) - - Number of calls to `udp_recvmsg`. (`bandwidth_udp_recv`) -- file access - - Number of calls to open files. (`file_open`) - - Number of calls to open files that returned errors. (`open_error`) - - Number of files closed. (`file_closed`) - - Number of calls to close files that returned errors. (`file_error_closed`) -- vfs - - Number of calls to `vfs_unlink`. (`file_deleted`) - - Number of calls to `vfs_write`. (`vfs_write_call`) - - Number of calls to write a file that returned errors. (`vfs_write_error`) - - Number of calls to `vfs_read`. (`vfs_read_call`) - - Number of bytes written with `vfs_write`. (`vfs_write_bytes`) - - Number of bytes read with `vfs_read`. (`vfs_read_bytes`) - - Number of calls to read a file that returned errors. (`vfs_read_error`) - - Number of calls to `vfs_fsync`. (`vfs_fsync`) - - Number of calls to sync file that returned errors. (`vfs_fsync_error`) - - Number of calls to `vfs_open`. (`vfs_open`) - - Number of calls to open file that returned errors. (`vfs_open_error`) - - Number of calls to `vfs_create`. (`vfs_create`) - - Number of calls to open file that returned errors. (`vfs_create_error`) -- page cache - - Ratio of pages accessed. (`cachestat_ratio`) - - Number of modified pages ("dirty"). (`cachestat_dirties`) - - Number of accessed pages. (`cachestat_hits`) - - Number of pages brought from disk. (`cachestat_misses`) -- directory cache - - Ratio of files available in directory cache. (`dc_hit_ratio`) - - Number of files accessed. (`dc_reference`) - - Number of files accessed that were not in cache. (`dc_not_cache`) - - Number of files not found. (`dc_not_found`) -- ipc shm - - Number of calls to `shm_get`. (`shmget_call`) - - Number of calls to `shm_at`. (`shmat_call`) - - Number of calls to `shm_dt`. (`shmdt_call`) - - Number of calls to `shm_ctl`. (`shmctl_call`) - -### `[ebpf programs]` - -The eBPF collector enables and runs the following eBPF programs by default: - -- `fd` : This eBPF program creates charts that show information about calls to open files. -- `mount`: This eBPF program creates charts that show calls to syscalls mount(2) and umount(2). -- `shm`: This eBPF program creates charts that show calls to syscalls shmget(2), shmat(2), shmdt(2) and shmctl(2). -- `sync`: Monitor calls to syscalls sync(2), fsync(2), fdatasync(2), syncfs(2), msync(2), and sync_file_range(2). -- `network viewer`: This eBPF program creates charts with information about `TCP` and `UDP` functions, including the - bandwidth consumed by each. -- `vfs`: This eBPF program creates charts that show information about VFS (Virtual File System) functions. -- `process`: This eBPF program creates charts that show information about process life. When in `return` mode, it also - creates charts showing errors when these operations are executed. -- `hardirq`: This eBPF program creates charts that show information about time spent servicing individual hardware - interrupt requests (hard IRQs). -- `softirq`: This eBPF program creates charts that show information about time spent servicing individual software - interrupt requests (soft IRQs). -- `oomkill`: This eBPF program creates a chart that shows OOM kills for all applications recognized via - the `apps.plugin` integration. Note that this program will show application charts regardless of whether apps - integration is turned on or off. - -You can also enable the following eBPF programs: - -- `cachestat`: Netdata's eBPF data collector creates charts about the memory page cache. When the integration with - [`apps.plugin`](/collectors/apps.plugin/README.md) is enabled, this collector creates charts for the whole host _and_ - for each application. -- `dcstat` : This eBPF program creates charts that show information about file access using directory cache. It appends - `kprobes` for `lookup_fast()` and `d_lookup()` to identify if files are inside directory cache, outside and files are - not found. -- `disk` : This eBPF program creates charts that show information about disk latency independent of filesystem. -- `filesystem` : This eBPF program creates charts that show information about some filesystem latency. -- `swap` : This eBPF program creates charts that show information about swap access. -- `mdflush`: This eBPF program creates charts that show information about - multi-device software flushes. - -## Thread configuration - -You can configure each thread of the eBPF data collector by editing either the `cachestat.conf`, `process.conf`, -or `network.conf` files. Use [`edit-config`](/docs/configure/nodes.md) from your Netdata config directory: - -```bash -cd /etc/netdata/ # Replace with your Netdata configuration directory, if not /etc/netdata/ -./edit-config ebpf.d/process.conf -``` - -### Configuration files - -The following configuration files are available: - -- `cachestat.conf`: Configuration for the `cachestat` thread. -- `dcstat.conf`: Configuration for the `dcstat` thread. -- `disk.conf`: Configuration for the `disk` thread. -- `fd.conf`: Configuration for the `file descriptor` thread. -- `filesystem.conf`: Configuration for the `filesystem` thread. -- `hardirq.conf`: Configuration for the `hardirq` thread. -- `process.conf`: Configuration for the `process` thread. -- `network.conf`: Configuration for the `network viewer` thread. This config file overwrites the global options and also - lets you specify which network the eBPF collector monitors. -- `softirq.conf`: Configuration for the `softirq` thread. -- `sync.conf`: Configuration for the `sync` thread. -- `vfs.conf`: Configuration for the `vfs` thread. - -### Network configuration - -The network configuration has specific options to configure which network(s) the eBPF collector monitors. These options -are divided in the following sections: - -#### `[network connections]` - -You can configure the information shown on `outbound` and `inbound` charts with the settings in this section. - -```conf -[network connections] - maximum dimensions = 500 - resolve hostname ips = no - ports = 1-1024 !145 !domain - hostnames = !example.com - ips = !127.0.0.1/8 10.0.0.0/8 172.16.0.0/12 192.168.0.0/16 fc00::/7 -``` - -When you define a `ports` setting, Netdata will collect network metrics for that specific port. For example, if you -write `ports = 19999`, Netdata will collect only connections for itself. The `hostnames` setting accepts -[simple patterns](/libnetdata/simple_pattern/README.md). The `ports`, and `ips` settings accept negation (`!`) to deny -specific values or asterisk alone to define all values. - -In the above example, Netdata will collect metrics for all ports between 1 and 443, with the exception of 53 (domain) -and 145. - -The following options are available: - -- `ports`: Define the destination ports for Netdata to monitor. -- `hostnames`: The list of hostnames that can be resolved to an IP address. -- `ips`: The IP or range of IPs that you want to monitor. You can use IPv4 or IPv6 addresses, use dashes to define a - range of IPs, or use CIDR values. The default behavior is to only collect data for private IP addresses, but this can - be changed with the `ips` setting. - -By default, Netdata displays up to 500 dimensions on network connection charts. If there are more possible dimensions, -they will be bundled into the `other` dimension. You can increase the number of shown dimensions by changing -the `maximum dimensions` setting. - -The dimensions for the traffic charts are created using the destination IPs of the sockets by default. This can be -changed setting `resolve hostname ips = yes` and restarting Netdata, after this Netdata will create dimensions using -the `hostnames` every time that is possible to resolve IPs to their hostnames. - -#### `[service name]` - -Netdata uses the list of services in `/etc/services` to plot network connection charts. If this file does not contain -the name for a particular service you use in your infrastructure, you will need to add it to the `[service name]` -section. - -For example, Netdata's default port (`19999`) is not listed in `/etc/services`. To associate that port with the Netdata -service in network connection charts, and thus see the name of the service instead of its port, define it: - -```conf -[service name] - 19999 = Netdata -``` - -### Sync configuration - -The sync configuration has specific options to disable monitoring for syscalls, as default option all syscalls are -monitored. - -```conf -[syscalls] - sync = yes - msync = yes - fsync = yes - fdatasync = yes - syncfs = yes - sync_file_range = yes -``` - -### Filesystem configuration - -The filesystem configuration has specific options to disable monitoring for filesystems, by default all filesystems are -monitored. - -```conf -[filesystem] - btrfsdist = yes - ext4dist = yes - nfsdist = yes - xfsdist = yes - zfsdist = yes -``` - -The ebpf program `nfsdist` monitors only `nfs` mount points. - -## Troubleshooting - -If the eBPF collector does not work, you can troubleshoot it by running the `ebpf.plugin` command and investigating its -output. - -```bash -cd /usr/libexec/netdata/plugins.d/ -sudo su -s /bin/bash netdata -./ebpf.plugin -``` - -You can also use `grep` to search the Agent's `error.log` for messages related to eBPF monitoring. - -```bash -grep -i ebpf /var/log/netdata/error.log -``` +- `oom/mark_victim`: Monitors when an oomkill event happens. -### Confirm kernel compatibility +## Known issues -The eBPF collector only works on Linux systems and with specific Linux kernels. We support all kernels more recent than -`4.11.0`, and all kernels on CentOS 7.6 or later. - -You can run our helper script to determine whether your system can support eBPF monitoring. - -```bash -curl -sSL https://raw.githubusercontent.com/netdata/kernel-collector/master/tools/check-kernel-config.sh | sudo bash -``` - -If this script returns no output, your system is ready to compile and run the eBPF collector. - -If you see a warning about a missing kernel -configuration (`KPROBES KPROBES_ON_FTRACE HAVE_KPROBES BPF BPF_SYSCALL BPF_JIT`), you will need to recompile your kernel -to support this configuration. The process of recompiling Linux kernels varies based on your distribution and version. -Read the documentation for your system's distribution to learn more about the specific workflow for recompiling the -kernel, ensuring that you set all the necessary - -- [Ubuntu](https://wiki.ubuntu.com/Kernel/BuildYourOwnKernel) -- [Debian](https://kernel-team.pages.debian.net/kernel-handbook/ch-common-tasks.html#s-common-official) -- [Fedora](https://fedoraproject.org/wiki/Building_a_custom_kernel) -- [CentOS](https://wiki.centos.org/HowTos/Custom_Kernel) -- [Arch Linux](https://wiki.archlinux.org/index.php/Kernel/Traditional_compilation) -- [Slackware](https://docs.slackware.com/howtos:slackware_admin:kernelbuilding) - -### Mount `debugfs` and `tracefs` - -The eBPF collector also requires both the `tracefs` and `debugfs` filesystems. Try mounting the `tracefs` and `debugfs` -filesystems using the commands below: - -```bash -sudo mount -t debugfs nodev /sys/kernel/debug -sudo mount -t tracefs nodev /sys/kernel/tracing -``` - -If they are already mounted, you will see an error. You can also configure your system's `/etc/fstab` configuration to -mount these filesystems on startup. More information can be found in -the [ftrace documentation](https://www.kernel.org/doc/Documentation/trace/ftrace.txt). - -## Performance +### Performance opimization eBPF monitoring is complex and produces a large volume of metrics. We've discovered scenarios where the eBPF plugin significantly increases kernel memory usage by several hundred MB. @@ -817,7 +870,7 @@ usage (see the `system.ram` chart) has dropped significantly. Beginning with `v1.31`, kernel memory usage is configurable via the [`pid table size` setting](#ebpf-load-mode) in `ebpf.conf`. -## SELinux +### SELinux When [SELinux](https://www.redhat.com/en/topics/linux/what-is-selinux) is enabled, it may prevent `ebpf.plugin` from starting correctly. Check the Agent's `error.log` file for errors like the ones below: @@ -837,7 +890,7 @@ ess.pl" exe="/usr/libexec/netdata/plugins.d/ebpf.plugin" subj=system_u:system_r: If you see similar errors, you will have to adjust SELinux's policies to enable the eBPF collector. -### Creation of bpf policies +#### Creation of bpf policies To enable `ebpf.plugin` to run on a distribution with SELinux enabled, it will be necessary to take the following actions. @@ -883,14 +936,14 @@ Finally, you can load the new policy and start the Netdata agent again: # systemctl start netdata ``` -## Lockdown +### Linux kernel lockdown Beginning with [version 5.4](https://www.zdnet.com/article/linux-to-get-kernel-lockdown-feature/), the Linux kernel has a feature called "lockdown," which may affect `ebpf.plugin` depending how the kernel was compiled. The following table shows how the lockdown module impacts `ebpf.plugin` based on the selected options: | Enforcing kernel lockdown | Enable lockdown LSM early in init | Default lockdown mode | Can `ebpf.plugin` run with this? | -|:------------------------- |:--------------------------------- |:--------------------- |:-------------------------------- | +| :------------------------ | :-------------------------------- | :-------------------- | :------------------------------- | | YES | NO | NO | YES | | YES | Yes | None | YES | | YES | Yes | Integrity | YES | @@ -898,5 +951,3 @@ shows how the lockdown module impacts `ebpf.plugin` based on the selected option If you or your distribution compiled the kernel with the last combination, your system cannot load shared libraries required to run `ebpf.plugin`. - -[](<>) diff --git a/collectors/ebpf.plugin/ebpf.c b/collectors/ebpf.plugin/ebpf.c index d51d378bd..b93c2dfd7 100644 --- a/collectors/ebpf.plugin/ebpf.c +++ b/collectors/ebpf.plugin/ebpf.c @@ -51,14 +51,15 @@ ebpf_module_t ebpf_modules[] = { .pid_map_size = ND_EBPF_DEFAULT_PID_SIZE, .names = NULL, .cfg = &socket_config, .config_file = NETDATA_NETWORK_CONFIG_FILE, .kernels = NETDATA_V3_10 | NETDATA_V4_14 | NETDATA_V4_16 | NETDATA_V4_18 | NETDATA_V5_4, - .load = EBPF_LOAD_LEGACY, .targets = NULL}, + .load = EBPF_LOAD_LEGACY, .targets = socket_targets}, { .thread_name = "cachestat", .config_name = "cachestat", .enabled = 0, .start_routine = ebpf_cachestat_thread, .update_every = EBPF_DEFAULT_UPDATE_EVERY, .global_charts = 1, .apps_charts = CONFIG_BOOLEAN_NO, .cgroup_charts = CONFIG_BOOLEAN_NO, .mode = MODE_ENTRY, .optional = 0, .apps_routine = ebpf_cachestat_create_apps_charts, .maps = NULL, .pid_map_size = ND_EBPF_DEFAULT_PID_SIZE, .names = NULL, .cfg = &cachestat_config, .config_file = NETDATA_CACHESTAT_CONFIG_FILE, - .kernels = NETDATA_V3_10 | NETDATA_V4_14 | NETDATA_V4_16 | NETDATA_V4_18 | NETDATA_V5_4 | NETDATA_V5_15, + .kernels = NETDATA_V3_10 | NETDATA_V4_14 | NETDATA_V4_16 | NETDATA_V4_18| + NETDATA_V5_4 | NETDATA_V5_15 | NETDATA_V5_16, .load = EBPF_LOAD_LEGACY, .targets = NULL}, { .thread_name = "sync", .config_name = "sync", .enabled = 0, .start_routine = ebpf_sync_thread, .update_every = EBPF_DEFAULT_UPDATE_EVERY, .global_charts = 1, .apps_charts = CONFIG_BOOLEAN_NO, @@ -67,7 +68,7 @@ ebpf_module_t ebpf_modules[] = { .config_file = NETDATA_SYNC_CONFIG_FILE, // All syscalls have the same kernels .kernels = NETDATA_V3_10 | NETDATA_V4_14 | NETDATA_V4_16 | NETDATA_V4_18 | NETDATA_V5_4, - .load = EBPF_LOAD_LEGACY, .targets = NULL}, + .load = EBPF_LOAD_LEGACY, .targets = sync_targets}, { .thread_name = "dc", .config_name = "dc", .enabled = 0, .start_routine = ebpf_dcstat_thread, .update_every = EBPF_DEFAULT_UPDATE_EVERY, .global_charts = 1, .apps_charts = CONFIG_BOOLEAN_NO, .cgroup_charts = CONFIG_BOOLEAN_NO, .mode = MODE_ENTRY, .optional = 0, @@ -112,7 +113,7 @@ ebpf_module_t ebpf_modules[] = { .pid_map_size = ND_EBPF_DEFAULT_PID_SIZE, .names = NULL, .cfg = &mount_config, .config_file = NETDATA_MOUNT_CONFIG_FILE, .kernels = NETDATA_V3_10 | NETDATA_V4_14 | NETDATA_V4_16 | NETDATA_V4_18 | NETDATA_V5_4, - .load = EBPF_LOAD_LEGACY, .targets = NULL}, + .load = EBPF_LOAD_LEGACY, .targets = mount_targets}, { .thread_name = "fd", .config_name = "fd", .enabled = 0, .start_routine = ebpf_fd_thread, .update_every = EBPF_DEFAULT_UPDATE_EVERY, .global_charts = 1, .apps_charts = CONFIG_BOOLEAN_NO, .cgroup_charts = CONFIG_BOOLEAN_NO, .mode = MODE_ENTRY, .optional = 0, @@ -150,7 +151,7 @@ ebpf_module_t ebpf_modules[] = { .pid_map_size = ND_EBPF_DEFAULT_PID_SIZE, .names = NULL, .cfg = &shm_config, .config_file = NETDATA_DIRECTORY_SHM_CONFIG_FILE, .kernels = NETDATA_V3_10 | NETDATA_V4_14 | NETDATA_V4_16 | NETDATA_V4_18 | NETDATA_V5_4, - .load = EBPF_LOAD_LEGACY, .targets = NULL}, + .load = EBPF_LOAD_LEGACY, .targets = shm_targets}, { .thread_name = "mdflush", .config_name = "mdflush", .enabled = 0, .start_routine = ebpf_mdflush_thread, .update_every = EBPF_DEFAULT_UPDATE_EVERY, .global_charts = 1, .apps_charts = CONFIG_BOOLEAN_NO, .cgroup_charts = CONFIG_BOOLEAN_NO, .mode = MODE_ENTRY, .optional = 0, .apps_routine = NULL, .maps = NULL, @@ -180,6 +181,11 @@ ebpf_network_viewer_options_t network_viewer_opt; ebpf_plugin_stats_t plugin_statistics = {.core = 0, .legacy = 0, .running = 0, .threads = 0, .tracepoints = 0, .probes = 0, .retprobes = 0, .trampolines = 0}; +#ifdef LIBBPF_MAJOR_VERSION +struct btf *default_btf = NULL; +#endif +char *btf_path = NULL; + /***************************************************************** * * FUNCTIONS USED TO CLEAN MEMORY AND OPERATE SYSTEM FILES @@ -206,6 +212,7 @@ void clean_loaded_events() static void ebpf_exit(int sig) { close_ebpf_plugin = 1; + static int remove_pid = 0; // When both threads were not finished case I try to go in front this address, the collector will crash if (!thread_finished) { @@ -289,6 +296,21 @@ static void ebpf_exit(int sig) } */ +#ifdef LIBBPF_MAJOR_VERSION + if (default_btf) { + btf__free(default_btf); + default_btf = NULL; + } +#endif + + if (!remove_pid) { + remove_pid = 1; + char filename[FILENAME_MAX + 1]; + ebpf_pid_file(filename, FILENAME_MAX); + if (unlink(filename)) + error("Cannot remove PID file %s", filename); + } + exit(sig); } @@ -957,6 +979,7 @@ static void read_local_ports(char *filename, uint8_t proto) return; size_t lines = procfile_lines(ff), l; + netdata_passive_connection_t values = {.counter = 0, .tgid = 0, .pid = 0}; for(l = 0; l < lines ;l++) { size_t words = procfile_linewords(ff, l); // This is header or end of file @@ -970,7 +993,7 @@ static void read_local_ports(char *filename, uint8_t proto) // Read local port uint16_t port = (uint16_t)strtol(procfile_lineword(ff, l, 2), NULL, 16); - update_listen_table(htons(port), proto); + update_listen_table(htons(port), proto, &values); } procfile_close(ff); @@ -1115,6 +1138,56 @@ static void ebpf_update_table_size() } } +/** + * Set Load mode + * + * @param load default load mode. + */ +static inline void ebpf_set_load_mode(netdata_ebpf_load_mode_t load) +{ +#ifdef LIBBPF_MAJOR_VERSION + if (load == EBPF_LOAD_CORE || load == EBPF_LOAD_PLAY_DICE) { + load = (!default_btf) ? EBPF_LOAD_LEGACY : EBPF_LOAD_CORE; + } +#else + load = EBPF_LOAD_LEGACY; +#endif + + int i; + for (i = 0; ebpf_modules[i].thread_name; i++) { + // TO DO: Use `load` variable after we change all threads. + ebpf_modules[i].load = EBPF_LOAD_LEGACY; // load ; + } +} + +/** + * Update mode + * + * @param str value read from configuration file. + */ +static inline void epbf_update_load_mode(char *str) +{ + netdata_ebpf_load_mode_t load = epbf_convert_string_to_load_mode(str); + + ebpf_set_load_mode(load); +} + +#ifdef LIBBPF_MAJOR_VERSION +/** + * Set default btf file + * + * Load the default BTF file on environment. + */ +static void ebpf_set_default_btf_file() +{ + char path[PATH_MAX + 1]; + snprintfz(path, PATH_MAX, "%s/vmlinux", btf_path); + default_btf = ebpf_parse_btf_file(path); + if (!default_btf) + info("Your environment does not have BTF file %s/vmlinux. The plugin will work with 'legacy' code.", + btf_path); +} +#endif /** * Read collector values @@ -1136,6 +1209,17 @@ static void read_collector_values(int *disable_apps, int *disable_cgroups, int u how_to_load(value); + btf_path = appconfig_get(&collector_config, EBPF_GLOBAL_SECTION, EBPF_CFG_PROGRAM_PATH, + EBPF_DEFAULT_BTF_FILE); + +#ifdef LIBBPF_MAJOR_VERSION + ebpf_set_default_btf_file(); +#endif + + value = appconfig_get(&collector_config, EBPF_GLOBAL_SECTION, EBPF_CFG_TYPE_FORMAT, EBPF_CFG_DEFAULT_PROGRAM); + + epbf_update_load_mode(value); + ebpf_update_interval(update_every); ebpf_update_table_size(); @@ -1372,19 +1456,6 @@ static inline void ebpf_load_thread_config() } /** - * Set Load mode - * - * @param load default load mode. - */ -static inline void ebpf_set_load_mode(netdata_ebpf_load_mode_t load) -{ - int i; - for (i = 0; ebpf_modules[i].thread_name; i++) { - ebpf_modules[i].load = load; - } -} - -/** * Parse arguments given from user. * * @param argc the number of arguments @@ -1772,6 +1843,19 @@ static void ebpf_kill_previous_process(char *filename, pid_t pid) } /** + * PID file + * + * Write the filename for PID inside the given vector. + * + * @param filename vector where we will store the name. + * @param length number of bytes available in filename vector + */ +void ebpf_pid_file(char *filename, size_t length) +{ + snprintfz(filename, length, "%s%s/ebpf.d/ebpf.pid", netdata_configured_host_prefix, ebpf_plugin_dir); +} + +/** * Manage PID * * This function kills another instance of eBPF whether it is necessary and update the file content. @@ -1781,7 +1865,7 @@ static void ebpf_kill_previous_process(char *filename, pid_t pid) static void ebpf_manage_pid(pid_t pid) { char filename[FILENAME_MAX + 1]; - snprintfz(filename, FILENAME_MAX, "%s%s/ebpf.d/ebpf.pid", netdata_configured_host_prefix, ebpf_plugin_dir); + ebpf_pid_file(filename, FILENAME_MAX); ebpf_kill_previous_process(filename, pid); ebpf_update_pid_file(filename, pid); @@ -1841,6 +1925,10 @@ int main(int argc, char **argv) ebpf_allocate_common_vectors(); +#ifdef LIBBPF_MAJOR_VERSION + libbpf_set_strict_mode(LIBBPF_STRICT_ALL); +#endif + read_local_addresses(); read_local_ports("/proc/net/tcp", IPPROTO_TCP); read_local_ports("/proc/net/tcp6", IPPROTO_TCP); diff --git a/collectors/ebpf.plugin/ebpf.d/mount.conf b/collectors/ebpf.plugin/ebpf.d/mount.conf index 9d3174755..fdd82f220 100644 --- a/collectors/ebpf.plugin/ebpf.d/mount.conf +++ b/collectors/ebpf.plugin/ebpf.d/mount.conf @@ -3,6 +3,17 @@ # `return : In the `return` mode, the eBPF collector monitors the same kernel functions as `entry`, but also creates # new charts for the return of these functions, such as errors. # -#[global] +# The `ebpf type format` option accepts the following values : +# `auto` : The eBPF collector will investigate hardware and select between the two next options. +# `legacy`: The eBPF collector will load the legacy code. Note: This has a bigger overload. +# `co-re` : The eBPF collector will use latest tracing method. Note: This is not available on all platforms. +# +# The `ebpf co-re tracing` option accepts the following values: +# `trampoline`: This is the default mode used by the eBPF collector, due the small overhead added to host. +# `tracepoint`: When available, the eBPF collector will use kernel tracepoint to monitor syscall. +# `probe` : This is the same as legacy code. +[global] # ebpf load mode = entry # update every = 1 + ebpf type format = auto + ebpf co-re tracing = trampoline diff --git a/collectors/ebpf.plugin/ebpf.d/network.conf b/collectors/ebpf.plugin/ebpf.d/network.conf index e692622a9..d939d8e1f 100644 --- a/collectors/ebpf.plugin/ebpf.d/network.conf +++ b/collectors/ebpf.plugin/ebpf.d/network.conf @@ -14,6 +14,16 @@ # `ipv6 connection table size`: Maximum number of IPV6 connections monitored # `udp connection table size`: Maximum number of UDP connections monitored # +# The `ebpf type format` option accepts the following values : +# `auto` : The eBPF collector will investigate hardware and select between the two next options. +# `legacy`: The eBPF collector will load the legacy code. Note: This has a bigger overload. +# `co-re` : The eBPF collector will use latest tracing method. Note: This is not available on all platforms. +# +# The `ebpf co-re tracing` option accepts the following values: +# `trampoline`: This is the default mode used by the eBPF collector, due the small overhead added to host. +# `tracepoint`: When available, the eBPF collector will use kernel tracepoint to monitor syscall. +# `probe` : This is the same as legacy code. +# [global] # ebpf load mode = entry # apps = yes @@ -23,6 +33,8 @@ ipv4 connection table size = 16384 ipv6 connection table size = 16384 udp connection table size = 4096 + ebpf type format = auto + ebpf co-re tracing = trampoline # # Network Connection diff --git a/collectors/ebpf.plugin/ebpf.d/shm.conf b/collectors/ebpf.plugin/ebpf.d/shm.conf index c0a10c98e..23ab96da4 100644 --- a/collectors/ebpf.plugin/ebpf.d/shm.conf +++ b/collectors/ebpf.plugin/ebpf.d/shm.conf @@ -8,13 +8,25 @@ # If you want to disable the integration with `apps.plugin` or `cgroups.plugin` along with the above charts, change # the setting `apps` and `cgroups` to 'no'. # +# The `ebpf type format` option accepts the following values : +# `auto` : The eBPF collector will investigate hardware and select between the two next options. +# `legacy`: The eBPF collector will load the legacy code. Note: This has a bigger overload. +# `co-re` : The eBPF collector will use latest tracing method. Note: This is not available on all platforms. +# +# The `ebpf co-re tracing` option accepts the following values: +# `trampoline`: This is the default mode used by the eBPF collector, due the small overhead added to host. +# `tracepoint`: When available, the eBPF collector will use kernel tracepoint to monitor syscall. +# `probe` : This is the same as legacy code. +# # Uncomment lines to define specific options for thread. -#[global] +[global] # ebpf load mode = entry # apps = yes # cgroups = no # update every = 10 # pid table size = 32768 + ebpf type format = auto + ebpf co-re tracing = trampoline # List of monitored syscalls [syscalls] diff --git a/collectors/ebpf.plugin/ebpf.d/sync.conf b/collectors/ebpf.plugin/ebpf.d/sync.conf index 03c469f68..ebec5d38e 100644 --- a/collectors/ebpf.plugin/ebpf.d/sync.conf +++ b/collectors/ebpf.plugin/ebpf.d/sync.conf @@ -8,12 +8,23 @@ # If you want to disable the integration with `apps.plugin` or `cgroups.plugin` along with the above charts, change # the setting `apps` and `cgroups` to 'no'. # +# The `ebpf type format` option accepts the following values : +# `auto` : The eBPF collector will investigate hardware and select between the two next options. +# `legacy`: The eBPF collector will load the legacy code. Note: This has a bigger overload. +# `co-re` : The eBPF collector will use latest tracing method. Note: This is not available on all platforms. +# +# The `ebpf co-re tracing` option accepts the following values: +# `trampoline`: This is the default mode used by the eBPF collector, due the small overhead added to host. +# `tracepoint`: When available, the eBPF collector will use kernel tracepoint to monitor syscall. +# `probe` : This is the same as legacy code. # -#[global] +[global] # ebpf load mode = entry # apps = yes # cgroups = no # update every = 10 + ebpf type format = auto + ebpf co-re tracing = trampoline # List of monitored syscalls [syscalls] diff --git a/collectors/ebpf.plugin/ebpf.h b/collectors/ebpf.plugin/ebpf.h index 165a6bf36..337e4f471 100644 --- a/collectors/ebpf.plugin/ebpf.h +++ b/collectors/ebpf.plugin/ebpf.h @@ -238,10 +238,13 @@ extern int ebpf_enable_tracepoint(ebpf_tracepoint_t *tp); extern int ebpf_disable_tracepoint(ebpf_tracepoint_t *tp); extern uint32_t ebpf_enable_tracepoints(ebpf_tracepoint_t *tps); +extern void ebpf_pid_file(char *filename, size_t length); + #define EBPF_PROGRAMS_SECTION "ebpf programs" #define EBPF_COMMON_DIMENSION_PERCENTAGE "%" #define EBPF_COMMON_DIMENSION_CALL "calls/s" +#define EBPF_COMMON_DIMENSION_CONNECTIONS "connections/s" #define EBPF_COMMON_DIMENSION_BITS "kilobits/s" #define EBPF_COMMON_DIMENSION_BYTES "bytes/s" #define EBPF_COMMON_DIMENSION_DIFFERENCE "difference" @@ -264,6 +267,7 @@ extern pthread_mutex_t mutex_cgroup_shm; extern size_t all_pids_count; extern uint32_t finalized_threads; extern ebpf_plugin_stats_t plugin_statistics; +extern struct btf *default_btf; // Socket functions and variables // Common functions diff --git a/collectors/ebpf.plugin/ebpf_apps.c b/collectors/ebpf.plugin/ebpf_apps.c index 015d1bf21..abc112642 100644 --- a/collectors/ebpf.plugin/ebpf_apps.c +++ b/collectors/ebpf.plugin/ebpf_apps.c @@ -275,7 +275,7 @@ int ebpf_read_apps_groups_conf(struct target **agdt, struct target **agrt, const // ---------------------------------------- - procfile *ff = procfile_open(filename, " :\t", PROCFILE_FLAG_DEFAULT); + procfile *ff = procfile_open_no_log(filename, " :\t", PROCFILE_FLAG_DEFAULT); if (!ff) return -1; diff --git a/collectors/ebpf.plugin/ebpf_apps.h b/collectors/ebpf.plugin/ebpf_apps.h index 0c72b8782..259e642ad 100644 --- a/collectors/ebpf.plugin/ebpf_apps.h +++ b/collectors/ebpf.plugin/ebpf_apps.h @@ -379,6 +379,10 @@ typedef struct ebpf_bandwidth { uint64_t retransmit; // Number of times tcp_retransmit was called uint64_t call_udp_sent; // Number of times udp_sendmsg was called uint64_t call_udp_received; // Number of times udp_recvmsg was called + uint64_t close; // Number of times tcp_close was called + uint64_t drop; // THIS IS NOT USED FOR WHILE, we are in groom section + uint32_t tcp_v4_connection; // Number of times tcp_v4_connection was called. + uint32_t tcp_v6_connection; // Number of times tcp_v6_connection was called. } ebpf_bandwidth_t; /** diff --git a/collectors/ebpf.plugin/ebpf_cachestat.c b/collectors/ebpf.plugin/ebpf_cachestat.c index 0cc16234b..ed4c14288 100644 --- a/collectors/ebpf.plugin/ebpf_cachestat.c +++ b/collectors/ebpf.plugin/ebpf_cachestat.c @@ -327,7 +327,7 @@ void ebpf_cachestat_create_apps_charts(struct ebpf_module *em, void *ptr) { struct target *root = ptr; ebpf_create_charts_on_apps(NETDATA_CACHESTAT_HIT_RATIO_CHART, - "The ratio is calculated dividing the Hit pages per total cache accesses without counting dirties.", + "Hit ratio", EBPF_COMMON_DIMENSION_PERCENTAGE, NETDATA_CACHESTAT_SUBMENU, NETDATA_EBPF_CHART_TYPE_LINE, @@ -336,7 +336,7 @@ void ebpf_cachestat_create_apps_charts(struct ebpf_module *em, void *ptr) root, em->update_every, NETDATA_EBPF_MODULE_NAME_CACHESTAT); ebpf_create_charts_on_apps(NETDATA_CACHESTAT_DIRTY_CHART, - "Number of pages marked as dirty. When a page is called dirty, this means that the data stored inside the page needs to be written to devices.", + "Number of dirty pages", EBPF_CACHESTAT_DIMENSION_PAGE, NETDATA_CACHESTAT_SUBMENU, NETDATA_EBPF_CHART_TYPE_STACKED, @@ -345,7 +345,7 @@ void ebpf_cachestat_create_apps_charts(struct ebpf_module *em, void *ptr) root, em->update_every, NETDATA_EBPF_MODULE_NAME_CACHESTAT); ebpf_create_charts_on_apps(NETDATA_CACHESTAT_HIT_CHART, - "Number of cache access without counting dirty pages and page additions.", + "Number of accessed files", EBPF_CACHESTAT_DIMENSION_HITS, NETDATA_CACHESTAT_SUBMENU, NETDATA_EBPF_CHART_TYPE_STACKED, @@ -354,7 +354,7 @@ void ebpf_cachestat_create_apps_charts(struct ebpf_module *em, void *ptr) root, em->update_every, NETDATA_EBPF_MODULE_NAME_CACHESTAT); ebpf_create_charts_on_apps(NETDATA_CACHESTAT_MISSES_CHART, - "Page caches added without counting dirty pages", + "Files out of page cache", EBPF_CACHESTAT_DIMENSION_MISSES, NETDATA_CACHESTAT_SUBMENU, NETDATA_EBPF_CHART_TYPE_STACKED, @@ -599,7 +599,7 @@ void ebpf_cachestat_calc_chart_values() static void ebpf_create_systemd_cachestat_charts(int update_every) { ebpf_create_charts_on_systemd(NETDATA_CACHESTAT_HIT_RATIO_CHART, - "Hit is calculating using total cache added without dirties per total added because of red misses.", + "Hit ratio", EBPF_COMMON_DIMENSION_PERCENTAGE, NETDATA_CACHESTAT_SUBMENU, NETDATA_EBPF_CHART_TYPE_LINE, 21100, ebpf_algorithms[NETDATA_EBPF_ABSOLUTE_IDX], @@ -607,21 +607,21 @@ static void ebpf_create_systemd_cachestat_charts(int update_every) update_every); ebpf_create_charts_on_systemd(NETDATA_CACHESTAT_DIRTY_CHART, - "Number of dirty pages added to the page cache.", + "Number of dirty pages", EBPF_CACHESTAT_DIMENSION_PAGE, NETDATA_CACHESTAT_SUBMENU, NETDATA_EBPF_CHART_TYPE_LINE, 21101, ebpf_algorithms[NETDATA_EBPF_ABSOLUTE_IDX], NETDATA_SYSTEMD_CACHESTAT_MODIFIED_CACHE_CONTEXT, NETDATA_EBPF_MODULE_NAME_CACHESTAT, update_every); - ebpf_create_charts_on_systemd(NETDATA_CACHESTAT_HIT_CHART, "Hits are function calls that Netdata counts.", + ebpf_create_charts_on_systemd(NETDATA_CACHESTAT_HIT_CHART, "Number of accessed files", EBPF_CACHESTAT_DIMENSION_HITS, NETDATA_CACHESTAT_SUBMENU, NETDATA_EBPF_CHART_TYPE_LINE, 21102, ebpf_algorithms[NETDATA_EBPF_ABSOLUTE_IDX], NETDATA_SYSTEMD_CACHESTAT_HIT_FILE_CONTEXT, NETDATA_EBPF_MODULE_NAME_CACHESTAT, update_every); - ebpf_create_charts_on_systemd(NETDATA_CACHESTAT_MISSES_CHART, "Misses are function calls that Netdata counts.", + ebpf_create_charts_on_systemd(NETDATA_CACHESTAT_MISSES_CHART, "Files out of page cache", EBPF_CACHESTAT_DIMENSION_MISSES, NETDATA_CACHESTAT_SUBMENU, NETDATA_EBPF_CHART_TYPE_LINE, 21103, ebpf_algorithms[NETDATA_EBPF_ABSOLUTE_IDX], @@ -713,7 +713,7 @@ static void ebpf_send_specific_cachestat_data(char *type, netdata_publish_caches static void ebpf_create_specific_cachestat_charts(char *type, int update_every) { ebpf_create_chart(type, NETDATA_CACHESTAT_HIT_RATIO_CHART, - "Hit is calculating using total cache added without dirties per total added because of red misses.", + "Hit ratio", EBPF_COMMON_DIMENSION_PERCENTAGE, NETDATA_CACHESTAT_CGROUP_SUBMENU, NETDATA_CGROUP_CACHESTAT_HIT_RATIO_CONTEXT, NETDATA_EBPF_CHART_TYPE_LINE, NETDATA_CHART_PRIO_CGROUPS_CONTAINERS + 5200, @@ -721,7 +721,7 @@ static void ebpf_create_specific_cachestat_charts(char *type, int update_every) cachestat_counter_publish_aggregated, 1, update_every, NETDATA_EBPF_MODULE_NAME_CACHESTAT); ebpf_create_chart(type, NETDATA_CACHESTAT_DIRTY_CHART, - "Number of dirty pages added to the page cache.", + "Number of dirty pages", EBPF_CACHESTAT_DIMENSION_PAGE, NETDATA_CACHESTAT_CGROUP_SUBMENU, NETDATA_CGROUP_CACHESTAT_MODIFIED_CACHE_CONTEXT, NETDATA_EBPF_CHART_TYPE_LINE, NETDATA_CHART_PRIO_CGROUPS_CONTAINERS + 5201, @@ -730,7 +730,7 @@ static void ebpf_create_specific_cachestat_charts(char *type, int update_every) update_every, NETDATA_EBPF_MODULE_NAME_CACHESTAT); ebpf_create_chart(type, NETDATA_CACHESTAT_HIT_CHART, - "Hits are function calls that Netdata counts.", + "Number of accessed files", EBPF_CACHESTAT_DIMENSION_HITS, NETDATA_CACHESTAT_CGROUP_SUBMENU, NETDATA_CGROUP_CACHESTAT_HIT_FILES_CONTEXT, NETDATA_EBPF_CHART_TYPE_LINE, NETDATA_CHART_PRIO_CGROUPS_CONTAINERS + 5202, @@ -739,7 +739,7 @@ static void ebpf_create_specific_cachestat_charts(char *type, int update_every) update_every, NETDATA_EBPF_MODULE_NAME_CACHESTAT); ebpf_create_chart(type, NETDATA_CACHESTAT_MISSES_CHART, - "Misses are function calls that Netdata counts.", + "Files out of page cache", EBPF_CACHESTAT_DIMENSION_MISSES, NETDATA_CACHESTAT_CGROUP_SUBMENU, NETDATA_CGROUP_CACHESTAT_MISS_FILES_CONTEXT, NETDATA_EBPF_CHART_TYPE_LINE, NETDATA_CHART_PRIO_CGROUPS_CONTAINERS + 5203, @@ -759,25 +759,25 @@ static void ebpf_create_specific_cachestat_charts(char *type, int update_every) static void ebpf_obsolete_specific_cachestat_charts(char *type, int update_every) { ebpf_write_chart_obsolete(type, NETDATA_CACHESTAT_HIT_RATIO_CHART, - "Hit is calculating using total cache added without dirties per total added because of red misses.", + "Hit ratio", EBPF_COMMON_DIMENSION_PERCENTAGE, NETDATA_CACHESTAT_SUBMENU, NETDATA_EBPF_CHART_TYPE_LINE, NETDATA_CGROUP_CACHESTAT_HIT_RATIO_CONTEXT, NETDATA_CHART_PRIO_CGROUPS_CONTAINERS + 5200, update_every); ebpf_write_chart_obsolete(type, NETDATA_CACHESTAT_DIRTY_CHART, - "Number of dirty pages added to the page cache.", + "Number of dirty pages", EBPF_CACHESTAT_DIMENSION_PAGE, NETDATA_CACHESTAT_SUBMENU, NETDATA_EBPF_CHART_TYPE_LINE, NETDATA_CGROUP_CACHESTAT_MODIFIED_CACHE_CONTEXT, NETDATA_CHART_PRIO_CGROUPS_CONTAINERS + 5201, update_every); ebpf_write_chart_obsolete(type, NETDATA_CACHESTAT_HIT_CHART, - "Hits are function calls that Netdata counts.", + "Number of accessed files", EBPF_CACHESTAT_DIMENSION_HITS, NETDATA_CACHESTAT_SUBMENU, NETDATA_EBPF_CHART_TYPE_LINE, NETDATA_CGROUP_CACHESTAT_HIT_FILES_CONTEXT, NETDATA_CHART_PRIO_CGROUPS_CONTAINERS + 5202, update_every); ebpf_write_chart_obsolete(type, NETDATA_CACHESTAT_MISSES_CHART, - "Misses are function calls that Netdata counts.", + "Files out of page cache", EBPF_CACHESTAT_DIMENSION_MISSES, NETDATA_CACHESTAT_SUBMENU, NETDATA_EBPF_CHART_TYPE_LINE, NETDATA_CGROUP_CACHESTAT_MISS_FILES_CONTEXT, NETDATA_CHART_PRIO_CGROUPS_CONTAINERS + 5203, update_every); @@ -892,7 +892,7 @@ static void cachestat_collector(ebpf_module_t *em) static void ebpf_create_memory_charts(ebpf_module_t *em) { ebpf_create_chart(NETDATA_EBPF_MEMORY_GROUP, NETDATA_CACHESTAT_HIT_RATIO_CHART, - "Hit is calculating using total cache added without dirties per total added because of red misses.", + "Hit ratio", EBPF_COMMON_DIMENSION_PERCENTAGE, NETDATA_CACHESTAT_SUBMENU, NULL, NETDATA_EBPF_CHART_TYPE_LINE, @@ -901,7 +901,7 @@ static void ebpf_create_memory_charts(ebpf_module_t *em) cachestat_counter_publish_aggregated, 1, em->update_every, NETDATA_EBPF_MODULE_NAME_CACHESTAT); ebpf_create_chart(NETDATA_EBPF_MEMORY_GROUP, NETDATA_CACHESTAT_DIRTY_CHART, - "Number of dirty pages added to the page cache.", + "Number of dirty pages", EBPF_CACHESTAT_DIMENSION_PAGE, NETDATA_CACHESTAT_SUBMENU, NULL, NETDATA_EBPF_CHART_TYPE_LINE, @@ -911,7 +911,7 @@ static void ebpf_create_memory_charts(ebpf_module_t *em) em->update_every, NETDATA_EBPF_MODULE_NAME_CACHESTAT); ebpf_create_chart(NETDATA_EBPF_MEMORY_GROUP, NETDATA_CACHESTAT_HIT_CHART, - "Hits are function calls that Netdata counts.", + "Number of accessed files", EBPF_CACHESTAT_DIMENSION_HITS, NETDATA_CACHESTAT_SUBMENU, NULL, NETDATA_EBPF_CHART_TYPE_LINE, @@ -921,7 +921,7 @@ static void ebpf_create_memory_charts(ebpf_module_t *em) em->update_every, NETDATA_EBPF_MODULE_NAME_CACHESTAT); ebpf_create_chart(NETDATA_EBPF_MEMORY_GROUP, NETDATA_CACHESTAT_MISSES_CHART, - "Misses are function calls that Netdata counts.", + "Files out of page cache", EBPF_CACHESTAT_DIMENSION_MISSES, NETDATA_CACHESTAT_SUBMENU, NULL, NETDATA_EBPF_CHART_TYPE_LINE, diff --git a/collectors/ebpf.plugin/ebpf_cgroup.c b/collectors/ebpf.plugin/ebpf_cgroup.c index ecdc46c0b..e6b483baf 100644 --- a/collectors/ebpf.plugin/ebpf_cgroup.c +++ b/collectors/ebpf.plugin/ebpf_cgroup.c @@ -242,7 +242,7 @@ static ebpf_cgroup_target_t * ebpf_cgroup_find_or_create(netdata_ebpf_cgroup_shm */ static void ebpf_update_pid_link_list(ebpf_cgroup_target_t *ect, char *path) { - procfile *ff = procfile_open(path, " \t:", PROCFILE_FLAG_DEFAULT); + procfile *ff = procfile_open_no_log(path, " \t:", PROCFILE_FLAG_DEFAULT); if (!ff) return; diff --git a/collectors/ebpf.plugin/ebpf_dcstat.c b/collectors/ebpf.plugin/ebpf_dcstat.c index 820e24e39..fba87007f 100644 --- a/collectors/ebpf.plugin/ebpf_dcstat.c +++ b/collectors/ebpf.plugin/ebpf_dcstat.c @@ -160,7 +160,7 @@ void ebpf_dcstat_create_apps_charts(struct ebpf_module *em, void *ptr) { struct target *root = ptr; ebpf_create_charts_on_apps(NETDATA_DC_HIT_CHART, - "Percentage of files listed inside directory cache", + "Percentage of files inside directory cache", EBPF_COMMON_DIMENSION_PERCENTAGE, NETDATA_DIRECTORY_CACHE_SUBMENU, NETDATA_EBPF_CHART_TYPE_LINE, @@ -169,7 +169,7 @@ void ebpf_dcstat_create_apps_charts(struct ebpf_module *em, void *ptr) root, em->update_every, NETDATA_EBPF_MODULE_NAME_DCSTAT); ebpf_create_charts_on_apps(NETDATA_DC_REFERENCE_CHART, - "Count file access.", + "Count file access", EBPF_COMMON_DIMENSION_FILES, NETDATA_DIRECTORY_CACHE_SUBMENU, NETDATA_EBPF_CHART_TYPE_STACKED, @@ -178,7 +178,7 @@ void ebpf_dcstat_create_apps_charts(struct ebpf_module *em, void *ptr) root, em->update_every, NETDATA_EBPF_MODULE_NAME_DCSTAT); ebpf_create_charts_on_apps(NETDATA_DC_REQUEST_NOT_CACHE_CHART, - "Access to files that were not present inside directory cache.", + "Files not present inside directory cache", EBPF_COMMON_DIMENSION_FILES, NETDATA_DIRECTORY_CACHE_SUBMENU, NETDATA_EBPF_CHART_TYPE_STACKED, @@ -187,7 +187,7 @@ void ebpf_dcstat_create_apps_charts(struct ebpf_module *em, void *ptr) root, em->update_every, NETDATA_EBPF_MODULE_NAME_DCSTAT); ebpf_create_charts_on_apps(NETDATA_DC_REQUEST_NOT_FOUND_CHART, - "Number of requests for files that were not found on filesystem.", + "Files not found", EBPF_COMMON_DIMENSION_FILES, NETDATA_DIRECTORY_CACHE_SUBMENU, NETDATA_EBPF_CHART_TYPE_STACKED, @@ -520,14 +520,14 @@ static void dcstat_send_global(netdata_publish_dcstat_t *publish) */ static void ebpf_create_specific_dc_charts(char *type, int update_every) { - ebpf_create_chart(type, NETDATA_DC_HIT_CHART, "Percentage of files listed inside directory cache.", + ebpf_create_chart(type, NETDATA_DC_HIT_CHART, "Percentage of files inside directory cache", EBPF_COMMON_DIMENSION_PERCENTAGE, NETDATA_DIRECTORY_CACHE_SUBMENU, NETDATA_CGROUP_DC_HIT_RATIO_CONTEXT, NETDATA_EBPF_CHART_TYPE_LINE, NETDATA_CHART_PRIO_CGROUPS_CONTAINERS + 5700, ebpf_create_global_dimension, dcstat_counter_publish_aggregated, 1, update_every, NETDATA_EBPF_MODULE_NAME_DCSTAT); - ebpf_create_chart(type, NETDATA_DC_REFERENCE_CHART, "Count file access.", + ebpf_create_chart(type, NETDATA_DC_REFERENCE_CHART, "Count file access", EBPF_COMMON_DIMENSION_FILES, NETDATA_DIRECTORY_CACHE_SUBMENU, NETDATA_CGROUP_DC_REFERENCE_CONTEXT, NETDATA_EBPF_CHART_TYPE_LINE, NETDATA_CHART_PRIO_CGROUPS_CONTAINERS + 5701, @@ -536,7 +536,7 @@ static void ebpf_create_specific_dc_charts(char *type, int update_every) update_every, NETDATA_EBPF_MODULE_NAME_DCSTAT); ebpf_create_chart(type, NETDATA_DC_REQUEST_NOT_CACHE_CHART, - "Access to files that were not present inside directory cache.", + "Files not present inside directory cache", EBPF_COMMON_DIMENSION_FILES, NETDATA_DIRECTORY_CACHE_SUBMENU, NETDATA_CGROUP_DC_NOT_CACHE_CONTEXT, NETDATA_EBPF_CHART_TYPE_LINE, NETDATA_CHART_PRIO_CGROUPS_CONTAINERS + 5702, @@ -545,7 +545,7 @@ static void ebpf_create_specific_dc_charts(char *type, int update_every) update_every, NETDATA_EBPF_MODULE_NAME_DCSTAT); ebpf_create_chart(type, NETDATA_DC_REQUEST_NOT_FOUND_CHART, - "Number of requests for files that were not found on filesystem.", + "Files not found", EBPF_COMMON_DIMENSION_FILES, NETDATA_DIRECTORY_CACHE_SUBMENU, NETDATA_CGROUP_DC_NOT_FOUND_CONTEXT, NETDATA_EBPF_CHART_TYPE_LINE, NETDATA_CHART_PRIO_CGROUPS_CONTAINERS + 5703, @@ -565,25 +565,25 @@ static void ebpf_create_specific_dc_charts(char *type, int update_every) static void ebpf_obsolete_specific_dc_charts(char *type, int update_every) { ebpf_write_chart_obsolete(type, NETDATA_DC_HIT_CHART, - "Percentage of files listed inside directory cache.", + "Percentage of files inside directory cache", EBPF_COMMON_DIMENSION_PERCENTAGE, NETDATA_DIRECTORY_CACHE_SUBMENU, NETDATA_EBPF_CHART_TYPE_LINE, NETDATA_CGROUP_DC_HIT_RATIO_CONTEXT, NETDATA_CHART_PRIO_CGROUPS_CONTAINERS + 5700, update_every); ebpf_write_chart_obsolete(type, NETDATA_DC_REFERENCE_CHART, - "Count file access.", + "Count file access", EBPF_COMMON_DIMENSION_FILES, NETDATA_DIRECTORY_CACHE_SUBMENU, NETDATA_EBPF_CHART_TYPE_LINE, NETDATA_CGROUP_DC_REFERENCE_CONTEXT, NETDATA_CHART_PRIO_CGROUPS_CONTAINERS + 5701, update_every); ebpf_write_chart_obsolete(type, NETDATA_DC_REQUEST_NOT_CACHE_CHART, - "Access to files that were not present inside directory cache.", + "Files not present inside directory cache", EBPF_COMMON_DIMENSION_FILES, NETDATA_DIRECTORY_CACHE_SUBMENU, NETDATA_EBPF_CHART_TYPE_LINE, NETDATA_CGROUP_DC_NOT_CACHE_CONTEXT, NETDATA_CHART_PRIO_CGROUPS_CONTAINERS + 5702, update_every); ebpf_write_chart_obsolete(type, NETDATA_DC_REQUEST_NOT_FOUND_CHART, - "Number of requests for files that were not found on filesystem.", + "Files not found", EBPF_COMMON_DIMENSION_FILES, NETDATA_DIRECTORY_CACHE_SUBMENU, NETDATA_EBPF_CHART_TYPE_LINE, NETDATA_CGROUP_DC_NOT_FOUND_CONTEXT, NETDATA_CHART_PRIO_CGROUPS_CONTAINERS + 5703, update_every); @@ -647,7 +647,7 @@ void ebpf_dc_calc_chart_values() static void ebpf_create_systemd_dc_charts(int update_every) { ebpf_create_charts_on_systemd(NETDATA_DC_HIT_CHART, - "Percentage of files listed inside directory cache.", + "Percentage of files inside directory cache", EBPF_COMMON_DIMENSION_PERCENTAGE, NETDATA_DIRECTORY_CACHE_SUBMENU, NETDATA_EBPF_CHART_TYPE_LINE, @@ -657,7 +657,7 @@ static void ebpf_create_systemd_dc_charts(int update_every) update_every); ebpf_create_charts_on_systemd(NETDATA_DC_REFERENCE_CHART, - "Count file access.", + "Count file access", EBPF_COMMON_DIMENSION_FILES, NETDATA_DIRECTORY_CACHE_SUBMENU, NETDATA_EBPF_CHART_TYPE_LINE, @@ -667,7 +667,7 @@ static void ebpf_create_systemd_dc_charts(int update_every) update_every); ebpf_create_charts_on_systemd(NETDATA_DC_REQUEST_NOT_CACHE_CHART, - "Access to files that were not present inside directory cache.", + "Files not present inside directory cache", EBPF_COMMON_DIMENSION_FILES, NETDATA_DIRECTORY_CACHE_SUBMENU, NETDATA_EBPF_CHART_TYPE_LINE, @@ -677,7 +677,7 @@ static void ebpf_create_systemd_dc_charts(int update_every) update_every); ebpf_create_charts_on_systemd(NETDATA_DC_REQUEST_NOT_FOUND_CHART, - "Number of requests for files that were not found on filesystem.", + "Files not found", EBPF_COMMON_DIMENSION_FILES, NETDATA_DIRECTORY_CACHE_SUBMENU, NETDATA_EBPF_CHART_TYPE_LINE, @@ -890,7 +890,7 @@ static void dcstat_collector(ebpf_module_t *em) static void ebpf_create_filesystem_charts(int update_every) { ebpf_create_chart(NETDATA_FILESYSTEM_FAMILY, NETDATA_DC_HIT_CHART, - "Percentage of files listed inside directory cache", + "Percentage of files inside directory cache", EBPF_COMMON_DIMENSION_PERCENTAGE, NETDATA_DIRECTORY_CACHE_SUBMENU, NULL, NETDATA_EBPF_CHART_TYPE_LINE, diff --git a/collectors/ebpf.plugin/ebpf_mount.c b/collectors/ebpf.plugin/ebpf_mount.c index 666936d86..1ba1e135c 100644 --- a/collectors/ebpf.plugin/ebpf_mount.c +++ b/collectors/ebpf.plugin/ebpf_mount.c @@ -30,6 +30,196 @@ struct netdata_static_thread mount_thread = {"MOUNT KERNEL", NULL, NULL, 1, NULL, NULL, NULL}; +netdata_ebpf_targets_t mount_targets[] = { {.name = "mount", .mode = EBPF_LOAD_TRAMPOLINE}, + {.name = "umount", .mode = EBPF_LOAD_TRAMPOLINE}, + {.name = NULL, .mode = EBPF_LOAD_TRAMPOLINE}}; + +#ifdef LIBBPF_MAJOR_VERSION +#include "includes/mount.skel.h" // BTF code + +static struct mount_bpf *bpf_obj = NULL; + +/***************************************************************** + * + * BTF FUNCTIONS + * + *****************************************************************/ + +/* + * Disable probe + * + * Disable all probes to use exclusively another method. + * + * @param obj is the main structure for bpf objects. + */ +static inline void ebpf_mount_disable_probe(struct mount_bpf *obj) +{ + bpf_program__set_autoload(obj->progs.netdata_mount_probe, false); + bpf_program__set_autoload(obj->progs.netdata_umount_probe, false); + + bpf_program__set_autoload(obj->progs.netdata_mount_retprobe, false); + bpf_program__set_autoload(obj->progs.netdata_umount_retprobe, false); +} + +/* + * Disable tracepoint + * + * Disable all tracepoints to use exclusively another method. + * + * @param obj is the main structure for bpf objects. + */ +static inline void ebpf_mount_disable_tracepoint(struct mount_bpf *obj) +{ + bpf_program__set_autoload(obj->progs.netdata_mount_exit, false); + bpf_program__set_autoload(obj->progs.netdata_umount_exit, false); +} + +/* + * Disable trampoline + * + * Disable all trampoline to use exclusively another method. + * + * @param obj is the main structure for bpf objects. + */ +static inline void ebpf_mount_disable_trampoline(struct mount_bpf *obj) +{ + bpf_program__set_autoload(obj->progs.netdata_mount_fentry, false); + bpf_program__set_autoload(obj->progs.netdata_umount_fentry, false); + bpf_program__set_autoload(obj->progs.netdata_mount_fexit, false); + bpf_program__set_autoload(obj->progs.netdata_umount_fexit, false); +} + +/** + * Set trampoline target + * + * Set the targets we will monitor. + * + * @param obj is the main structure for bpf objects. + */ +static inline void netdata_set_trampoline_target(struct mount_bpf *obj) +{ + char syscall[NETDATA_EBPF_MAX_SYSCALL_LENGTH + 1]; + ebpf_select_host_prefix(syscall, NETDATA_EBPF_MAX_SYSCALL_LENGTH, + mount_targets[NETDATA_MOUNT_SYSCALL].name, running_on_kernel); + + bpf_program__set_attach_target(obj->progs.netdata_mount_fentry, 0, + syscall); + + bpf_program__set_attach_target(obj->progs.netdata_mount_fexit, 0, + syscall); + + ebpf_select_host_prefix(syscall, NETDATA_EBPF_MAX_SYSCALL_LENGTH, + mount_targets[NETDATA_UMOUNT_SYSCALL].name, running_on_kernel); + + bpf_program__set_attach_target(obj->progs.netdata_umount_fentry, 0, + syscall); + + bpf_program__set_attach_target(obj->progs.netdata_umount_fexit, 0, + syscall); +} + +/** + * Mount Attach Probe + * + * Attach probes to target + * + * @param obj is the main structure for bpf objects. + * + * @return It returns 0 on success and -1 otherwise. + */ +static int ebpf_mount_attach_probe(struct mount_bpf *obj) +{ + char syscall[NETDATA_EBPF_MAX_SYSCALL_LENGTH + 1]; + + ebpf_select_host_prefix(syscall, NETDATA_EBPF_MAX_SYSCALL_LENGTH, + mount_targets[NETDATA_MOUNT_SYSCALL].name, running_on_kernel); + + obj->links.netdata_mount_probe = bpf_program__attach_kprobe(obj->progs.netdata_mount_probe, + false, syscall); + int ret = (int)libbpf_get_error(obj->links.netdata_mount_probe); + if (ret) + return -1; + + obj->links.netdata_mount_retprobe = bpf_program__attach_kprobe(obj->progs.netdata_mount_retprobe, + true, syscall); + ret = (int)libbpf_get_error(obj->links.netdata_mount_retprobe); + if (ret) + return -1; + + ebpf_select_host_prefix(syscall, NETDATA_EBPF_MAX_SYSCALL_LENGTH, + mount_targets[NETDATA_UMOUNT_SYSCALL].name, running_on_kernel); + + obj->links.netdata_umount_probe = bpf_program__attach_kprobe(obj->progs.netdata_umount_probe, + false, syscall); + ret = (int)libbpf_get_error(obj->links.netdata_umount_probe); + if (ret) + return -1; + + obj->links.netdata_umount_retprobe = bpf_program__attach_kprobe(obj->progs.netdata_umount_retprobe, + true, syscall); + ret = (int)libbpf_get_error(obj->links.netdata_umount_retprobe); + if (ret) + return -1; + + return 0; +} + +/** + * Set hash tables + * + * Set the values for maps according the value given by kernel. + * + * @param obj is the main structure for bpf objects. + */ +static void ebpf_mount_set_hash_tables(struct mount_bpf *obj) +{ + mount_maps[NETDATA_KEY_MOUNT_TABLE].map_fd = bpf_map__fd(obj->maps.tbl_mount); +} + +/** + * Load and attach + * + * Load and attach the eBPF code in kernel. + * + * @param obj is the main structure for bpf objects. + * @param em structure with configuration + * + * @return it returns 0 on succes and -1 otherwise + */ +static inline int ebpf_mount_load_and_attach(struct mount_bpf *obj, ebpf_module_t *em) +{ + netdata_ebpf_targets_t *mt = em->targets; + netdata_ebpf_program_loaded_t test = mt[NETDATA_MOUNT_SYSCALL].mode; + + // We are testing only one, because all will have the same behavior + if (test == EBPF_LOAD_TRAMPOLINE ) { + ebpf_mount_disable_probe(obj); + ebpf_mount_disable_tracepoint(obj); + + netdata_set_trampoline_target(obj); + } else if (test == EBPF_LOAD_PROBE || + test == EBPF_LOAD_RETPROBE ) { + ebpf_mount_disable_tracepoint(obj); + ebpf_mount_disable_trampoline(obj); + } else { + ebpf_mount_disable_probe(obj); + ebpf_mount_disable_trampoline(obj); + } + + int ret = mount_bpf__load(obj); + if (!ret) { + if (test != EBPF_LOAD_PROBE && test != EBPF_LOAD_RETPROBE ) + ret = mount_bpf__attach(obj); + else + ret = ebpf_mount_attach_probe(obj); + + if (!ret) + ebpf_mount_set_hash_tables(obj); + } + + return ret; +} +#endif /***************************************************************** * * FUNCTIONS TO CLOSE THE THREAD @@ -59,6 +249,11 @@ static void ebpf_mount_cleanup(void *ptr) } bpf_object__close(objects); } +#ifdef LIBBPF_MAJOR_VERSION + else if (bpf_obj) + mount_bpf__destroy(bpf_obj); +#endif + } /***************************************************************** @@ -191,7 +386,7 @@ static void mount_collector(ebpf_module_t *em) static void ebpf_create_mount_charts(int update_every) { ebpf_create_chart(NETDATA_EBPF_MOUNT_GLOBAL_FAMILY, NETDATA_EBPF_MOUNT_CALLS, - "Calls to mount and umount syscalls.", + "Calls to mount and umount syscalls", EBPF_COMMON_DIMENSION_CALL, NETDATA_EBPF_MOUNT_FAMILY, NULL, NETDATA_EBPF_CHART_TYPE_LINE, @@ -201,7 +396,7 @@ static void ebpf_create_mount_charts(int update_every) update_every, NETDATA_EBPF_MODULE_NAME_MOUNT); ebpf_create_chart(NETDATA_EBPF_MOUNT_GLOBAL_FAMILY, NETDATA_EBPF_MOUNT_ERRORS, - "Errors to mount and umount syscalls.", + "Errors to mount and umount file systems", EBPF_COMMON_DIMENSION_CALL, NETDATA_EBPF_MOUNT_FAMILY, NULL, NETDATA_EBPF_CHART_TYPE_LINE, @@ -219,6 +414,39 @@ static void ebpf_create_mount_charts(int update_every) * *****************************************************************/ +/* + * Load BPF + * + * Load BPF files. + * + * @param em the structure with configuration + */ +static int ebpf_mount_load_bpf(ebpf_module_t *em) +{ + int ret = 0; + if (em->load == EBPF_LOAD_LEGACY) { + probe_links = ebpf_load_program(ebpf_plugin_dir, em, running_on_kernel, isrh, &objects); + if (!probe_links) { + em->enabled = CONFIG_BOOLEAN_NO; + ret = -1; + } + } +#ifdef LIBBPF_MAJOR_VERSION + else { + bpf_obj = mount_bpf__open(); + if (!bpf_obj) + ret = -1; + else + ret = ebpf_mount_load_and_attach(bpf_obj, em); + } +#endif + + if (ret) + error("%s %s", EBPF_DEFAULT_ERROR_MSG, em->thread_name); + + return ret; +} + /** * Mount thread * @@ -238,8 +466,10 @@ void *ebpf_mount_thread(void *ptr) if (!em->enabled) goto endmount; - probe_links = ebpf_load_program(ebpf_plugin_dir, em, running_on_kernel, isrh, &objects); - if (!probe_links) { +#ifdef LIBBPF_MAJOR_VERSION + ebpf_adjust_thread_load(em, default_btf); +#endif + if (ebpf_mount_load_bpf(em)) { em->enabled = CONFIG_BOOLEAN_NO; goto endmount; } diff --git a/collectors/ebpf.plugin/ebpf_mount.h b/collectors/ebpf.plugin/ebpf_mount.h index 700bea13b..d4f48efd1 100644 --- a/collectors/ebpf.plugin/ebpf_mount.h +++ b/collectors/ebpf.plugin/ebpf_mount.h @@ -30,7 +30,15 @@ enum mount_tables { NETDATA_KEY_MOUNT_TABLE }; +enum netdata_mount_syscalls { + NETDATA_MOUNT_SYSCALL, + NETDATA_UMOUNT_SYSCALL, + + NETDATA_MOUNT_SYSCALLS_END +}; + extern struct config mount_config; extern void *ebpf_mount_thread(void *ptr); +extern netdata_ebpf_targets_t mount_targets[]; #endif /* NETDATA_EBPF_MOUNT_H */ diff --git a/collectors/ebpf.plugin/ebpf_oomkill.c b/collectors/ebpf.plugin/ebpf_oomkill.c index 434fc7fd3..f38801875 100644 --- a/collectors/ebpf.plugin/ebpf_oomkill.c +++ b/collectors/ebpf.plugin/ebpf_oomkill.c @@ -120,7 +120,7 @@ static void ebpf_create_specific_oomkill_charts(char *type, int update_every) { ebpf_create_chart(type, NETDATA_OOMKILL_CHART, "OOM kills. This chart is provided by eBPF plugin.", EBPF_COMMON_DIMENSION_KILLS, NETDATA_EBPF_MEMORY_GROUP, - NULL, NETDATA_EBPF_CHART_TYPE_LINE, + NETDATA_CGROUP_OOMKILLS_CONTEXT, NETDATA_EBPF_CHART_TYPE_LINE, NETDATA_CHART_PRIO_CGROUPS_CONTAINERS + 5600, ebpf_create_global_dimension, &oomkill_publish_aggregated, 1, update_every, NETDATA_EBPF_MODULE_NAME_OOMKILL); @@ -194,7 +194,7 @@ static void ebpf_obsolete_specific_oomkill_charts(char *type, int update_every) { ebpf_write_chart_obsolete(type, NETDATA_OOMKILL_CHART, "OOM kills. This chart is provided by eBPF plugin.", EBPF_COMMON_DIMENSION_KILLS, NETDATA_EBPF_MEMORY_GROUP, - NETDATA_EBPF_CHART_TYPE_LINE, NULL, + NETDATA_EBPF_CHART_TYPE_LINE, NETDATA_CGROUP_OOMKILLS_CONTEXT, NETDATA_CHART_PRIO_CGROUPS_CONTAINERS + 5600, update_every); } diff --git a/collectors/ebpf.plugin/ebpf_oomkill.h b/collectors/ebpf.plugin/ebpf_oomkill.h index 86f9463dd..b5f04c74c 100644 --- a/collectors/ebpf.plugin/ebpf_oomkill.h +++ b/collectors/ebpf.plugin/ebpf_oomkill.h @@ -22,6 +22,9 @@ typedef uint8_t oomkill_ebpf_val_t; #define NETDATA_OOMKILL_CHART "oomkills" +// Contexts +#define NETDATA_CGROUP_OOMKILLS_CONTEXT "cgroup.oomkills" + extern struct config oomkill_config; extern void *ebpf_oomkill_thread(void *ptr); extern void ebpf_oomkill_create_apps_charts(struct ebpf_module *em, void *ptr); diff --git a/collectors/ebpf.plugin/ebpf_shm.c b/collectors/ebpf.plugin/ebpf_shm.c index 0cfb3abdc..939741e75 100644 --- a/collectors/ebpf.plugin/ebpf_shm.c +++ b/collectors/ebpf.plugin/ebpf_shm.c @@ -41,6 +41,203 @@ static struct bpf_object *objects = NULL; struct netdata_static_thread shm_threads = {"SHM KERNEL", NULL, NULL, 1, NULL, NULL, NULL}; +netdata_ebpf_targets_t shm_targets[] = { {.name = "shmget", .mode = EBPF_LOAD_TRAMPOLINE}, + {.name = "shmat", .mode = EBPF_LOAD_TRAMPOLINE}, + {.name = "shmdt", .mode = EBPF_LOAD_TRAMPOLINE}, + {.name = "shmctl", .mode = EBPF_LOAD_TRAMPOLINE}, + {.name = NULL, .mode = EBPF_LOAD_TRAMPOLINE}}; + +#ifdef LIBBPF_MAJOR_VERSION +#include "includes/shm.skel.h" + +static struct shm_bpf *bpf_obj = NULL; + +/***************************************************************** + * + * BTF FUNCTIONS + * + *****************************************************************/ + +/* + * Disable tracepoint + * + * Disable all tracepoints to use exclusively another method. + * + * @param obj is the main structure for bpf objects. + */ +static void ebpf_shm_disable_tracepoint(struct shm_bpf *obj) +{ + bpf_program__set_autoload(obj->progs.netdata_syscall_shmget, false); + bpf_program__set_autoload(obj->progs.netdata_syscall_shmat, false); + bpf_program__set_autoload(obj->progs.netdata_syscall_shmdt, false); + bpf_program__set_autoload(obj->progs.netdata_syscall_shmctl, false); +} + +/* + * Disable probe + * + * Disable all probes to use exclusively another method. + * + * @param obj is the main structure for bpf objects. + */ +static void ebpf_disable_probe(struct shm_bpf *obj) +{ + bpf_program__set_autoload(obj->progs.netdata_shmget_probe, false); + bpf_program__set_autoload(obj->progs.netdata_shmat_probe, false); + bpf_program__set_autoload(obj->progs.netdata_shmdt_probe, false); + bpf_program__set_autoload(obj->progs.netdata_shmctl_probe, false); +} + +/* + * Disable trampoline + * + * Disable all trampoline to use exclusively another method. + * + * @param obj is the main structure for bpf objects. + */ +static void ebpf_disable_trampoline(struct shm_bpf *obj) +{ + bpf_program__set_autoload(obj->progs.netdata_shmget_fentry, false); + bpf_program__set_autoload(obj->progs.netdata_shmat_fentry, false); + bpf_program__set_autoload(obj->progs.netdata_shmdt_fentry, false); + bpf_program__set_autoload(obj->progs.netdata_shmctl_fentry, false); +} + +/** + * Set trampoline target + * + * Set the targets we will monitor. + * + * @param obj is the main structure for bpf objects. + */ +static void ebpf_set_trampoline_target(struct shm_bpf *obj) +{ + char syscall[NETDATA_EBPF_MAX_SYSCALL_LENGTH + 1]; + ebpf_select_host_prefix(syscall, NETDATA_EBPF_MAX_SYSCALL_LENGTH, + shm_targets[NETDATA_KEY_SHMGET_CALL].name, running_on_kernel); + + bpf_program__set_attach_target(obj->progs.netdata_shmget_fentry, 0, + syscall); + + ebpf_select_host_prefix(syscall, NETDATA_EBPF_MAX_SYSCALL_LENGTH, + shm_targets[NETDATA_KEY_SHMAT_CALL].name, running_on_kernel); + bpf_program__set_attach_target(obj->progs.netdata_shmat_fentry, 0, + syscall); + + ebpf_select_host_prefix(syscall, NETDATA_EBPF_MAX_SYSCALL_LENGTH, + shm_targets[NETDATA_KEY_SHMDT_CALL].name, running_on_kernel); + bpf_program__set_attach_target(obj->progs.netdata_shmdt_fentry, 0, + syscall); + + ebpf_select_host_prefix(syscall, NETDATA_EBPF_MAX_SYSCALL_LENGTH, + shm_targets[NETDATA_KEY_SHMCTL_CALL].name, running_on_kernel); + bpf_program__set_attach_target(obj->progs.netdata_shmctl_fentry, 0, + syscall); +} + +/** + * SHM Attach Probe + * + * Attach probes to target + * + * @param obj is the main structure for bpf objects. + * + * @return It returns 0 on success and -1 otherwise. + */ +static int ebpf_shm_attach_probe(struct shm_bpf *obj) +{ + char syscall[NETDATA_EBPF_MAX_SYSCALL_LENGTH + 1]; + ebpf_select_host_prefix(syscall, NETDATA_EBPF_MAX_SYSCALL_LENGTH, + shm_targets[NETDATA_KEY_SHMGET_CALL].name, running_on_kernel); + + obj->links.netdata_shmget_probe = bpf_program__attach_kprobe(obj->progs.netdata_shmget_probe, + false, syscall); + int ret = (int)libbpf_get_error(obj->links.netdata_shmget_probe); + if (ret) + return -1; + + ebpf_select_host_prefix(syscall, NETDATA_EBPF_MAX_SYSCALL_LENGTH, + shm_targets[NETDATA_KEY_SHMAT_CALL].name, running_on_kernel); + obj->links.netdata_shmat_probe = bpf_program__attach_kprobe(obj->progs.netdata_shmat_probe, + false, syscall); + ret = (int)libbpf_get_error(obj->links.netdata_shmat_probe); + if (ret) + return -1; + + ebpf_select_host_prefix(syscall, NETDATA_EBPF_MAX_SYSCALL_LENGTH, + shm_targets[NETDATA_KEY_SHMDT_CALL].name, running_on_kernel); + obj->links.netdata_shmdt_probe = bpf_program__attach_kprobe(obj->progs.netdata_shmdt_probe, + false, syscall); + ret = (int)libbpf_get_error(obj->links.netdata_shmdt_probe); + if (ret) + return -1; + + ebpf_select_host_prefix(syscall, NETDATA_EBPF_MAX_SYSCALL_LENGTH, + shm_targets[NETDATA_KEY_SHMCTL_CALL].name, running_on_kernel); + obj->links.netdata_shmctl_probe = bpf_program__attach_kprobe(obj->progs.netdata_shmctl_probe, + false, syscall); + ret = (int)libbpf_get_error(obj->links.netdata_shmctl_probe); + if (ret) + return -1; + + return 0; +} + +/** + * Set hash tables + * + * Set the values for maps according the value given by kernel. + */ +static void ebpf_shm_set_hash_tables(struct shm_bpf *obj) +{ + shm_maps[NETDATA_PID_SHM_TABLE].map_fd = bpf_map__fd(obj->maps.tbl_pid_shm); + shm_maps[NETDATA_SHM_CONTROLLER].map_fd = bpf_map__fd(obj->maps.shm_ctrl); + shm_maps[NETDATA_SHM_GLOBAL_TABLE].map_fd = bpf_map__fd(obj->maps.tbl_shm); +} + +/** + * Load and attach + * + * Load and attach the eBPF code in kernel. + * + * @param obj is the main structure for bpf objects. + * @param em structure with configuration + * + * @return it returns 0 on succes and -1 otherwise + */ +static inline int ebpf_shm_load_and_attach(struct shm_bpf *obj, ebpf_module_t *em) +{ + netdata_ebpf_targets_t *shmt = em->targets; + netdata_ebpf_program_loaded_t test = shmt[NETDATA_KEY_SHMGET_CALL].mode; + + // We are testing only one, because all will have the same behavior + if (test == EBPF_LOAD_TRAMPOLINE ) { + ebpf_shm_disable_tracepoint(obj); + ebpf_disable_probe(obj); + + ebpf_set_trampoline_target(obj); + } else if (test == EBPF_LOAD_PROBE || test == EBPF_LOAD_RETPROBE ) { + ebpf_shm_disable_tracepoint(obj); + ebpf_disable_trampoline(obj); + } else { + ebpf_disable_probe(obj); + ebpf_disable_trampoline(obj); + } + + int ret = shm_bpf__load(obj); + if (!ret) { + if (test != EBPF_LOAD_PROBE && test != EBPF_LOAD_RETPROBE) + shm_bpf__attach(obj); + else + ret = ebpf_shm_attach_probe(obj); + + if (!ret) + ebpf_shm_set_hash_tables(obj); + } + + return ret; +} +#endif /***************************************************************** * FUNCTIONS TO CLOSE THE THREAD *****************************************************************/ @@ -91,6 +288,10 @@ static void ebpf_shm_cleanup(void *ptr) } bpf_object__close(objects); } +#ifdef LIBBPF_MAJOR_VERSION + else if (bpf_obj) + shm_bpf__destroy(bpf_obj); +#endif } /***************************************************************** @@ -787,7 +988,7 @@ static void ebpf_create_shm_charts(int update_every) ebpf_create_chart( NETDATA_EBPF_SYSTEM_GROUP, NETDATA_SHM_GLOBAL_CHART, - "Calls to shared memory system calls.", + "Calls to shared memory system calls", EBPF_COMMON_DIMENSION_CALL, NETDATA_SYSTEM_IPC_SHM_SUBMENU, NULL, @@ -802,6 +1003,40 @@ static void ebpf_create_shm_charts(int update_every) fflush(stdout); } +/* + * Load BPF + * + * Load BPF files. + * + * @param em the structure with configuration + */ +static int ebpf_shm_load_bpf(ebpf_module_t *em) +{ + int ret = 0; + if (em->load == EBPF_LOAD_LEGACY) { + probe_links = ebpf_load_program(ebpf_plugin_dir, em, running_on_kernel, isrh, &objects); + if (!probe_links) { + em->enabled = CONFIG_BOOLEAN_NO; + ret = -1; + } + } +#ifdef LIBBPF_MAJOR_VERSION + else { + bpf_obj = shm_bpf__open(); + if (!bpf_obj) + ret = -1; + else + ret = ebpf_shm_load_and_attach(bpf_obj, em); + } +#endif + + + if (ret) + error("%s %s", EBPF_DEFAULT_ERROR_MSG, em->thread_name); + + return ret; +} + /** * Shared memory thread. * @@ -821,8 +1056,10 @@ void *ebpf_shm_thread(void *ptr) goto endshm; } - probe_links = ebpf_load_program(ebpf_plugin_dir, em, running_on_kernel, isrh, &objects); - if (!probe_links) { +#ifdef LIBBPF_MAJOR_VERSION + ebpf_adjust_thread_load(em, default_btf); +#endif + if (ebpf_shm_load_bpf(em)) { em->enabled = CONFIG_BOOLEAN_NO; goto endshm; } diff --git a/collectors/ebpf.plugin/ebpf_shm.h b/collectors/ebpf.plugin/ebpf_shm.h index 4e7e183a7..f0559e431 100644 --- a/collectors/ebpf.plugin/ebpf_shm.h +++ b/collectors/ebpf.plugin/ebpf_shm.h @@ -57,6 +57,7 @@ extern netdata_publish_shm_t **shm_pid; extern void *ebpf_shm_thread(void *ptr); extern void ebpf_shm_create_apps_charts(struct ebpf_module *em, void *ptr); extern void clean_shm_pid_structures(); +extern netdata_ebpf_targets_t shm_targets[]; extern struct config shm_config; diff --git a/collectors/ebpf.plugin/ebpf_socket.c b/collectors/ebpf.plugin/ebpf_socket.c index b59367f58..da42f0a49 100644 --- a/collectors/ebpf.plugin/ebpf_socket.c +++ b/collectors/ebpf.plugin/ebpf_socket.c @@ -12,9 +12,13 @@ *****************************************************************/ static char *socket_dimension_names[NETDATA_MAX_SOCKET_VECTOR] = { "received", "sent", "close", - "received", "sent", "retransmitted" }; + "received", "sent", "retransmitted", + "connected_V4", "connected_V6", "connected_tcp", + "connected_udp"}; static char *socket_id_names[NETDATA_MAX_SOCKET_VECTOR] = { "tcp_cleanup_rbuf", "tcp_sendmsg", "tcp_close", - "udp_recvmsg", "udp_sendmsg", "tcp_retransmit_skb" }; + "udp_recvmsg", "udp_sendmsg", "tcp_retransmit_skb", + "tcp_connect_v4", "tcp_connect_v6", "inet_csk_accept_tcp", + "inet_csk_accept_udp" }; static ebpf_local_maps_t socket_maps[] = {{.name = "tbl_bandwidth", .internal_input = NETDATA_COMPILED_CONNECTIONS_ALLOWED, @@ -77,6 +81,349 @@ struct config socket_config = { .first_section = NULL, .index = { .avl_tree = { .root = NULL, .compar = appconfig_section_compare }, .rwlock = AVL_LOCK_INITIALIZER } }; +netdata_ebpf_targets_t socket_targets[] = { {.name = "inet_csk_accept", .mode = EBPF_LOAD_TRAMPOLINE}, + {.name = "tcp_retransmit_skb", .mode = EBPF_LOAD_TRAMPOLINE}, + {.name = "tcp_cleanup_rbuf", .mode = EBPF_LOAD_TRAMPOLINE}, + {.name = "tcp_close", .mode = EBPF_LOAD_TRAMPOLINE}, + {.name = "udp_recvmsg", .mode = EBPF_LOAD_TRAMPOLINE}, + {.name = "tcp_sendmsg", .mode = EBPF_LOAD_TRAMPOLINE}, + {.name = "udp_sendmsg", .mode = EBPF_LOAD_TRAMPOLINE}, + {.name = "tcp_v4_connect", .mode = EBPF_LOAD_TRAMPOLINE}, + {.name = "tcp_v6_connect", .mode = EBPF_LOAD_TRAMPOLINE}, + {.name = NULL, .mode = EBPF_LOAD_TRAMPOLINE}}; + +#ifdef LIBBPF_MAJOR_VERSION +#include "includes/socket.skel.h" // BTF code + +static struct socket_bpf *bpf_obj = NULL; + +/** + * Disable Probe + * + * Disable probes to use trampoline. + * + * @param obj is the main structure for bpf objects. + */ +static void ebpf_socket_disable_probes(struct socket_bpf *obj) +{ + bpf_program__set_autoload(obj->progs.netdata_inet_csk_accept_kretprobe, false); + bpf_program__set_autoload(obj->progs.netdata_tcp_v4_connect_kretprobe, false); + bpf_program__set_autoload(obj->progs.netdata_tcp_v6_connect_kretprobe, false); + bpf_program__set_autoload(obj->progs.netdata_tcp_retransmit_skb_kprobe, false); + bpf_program__set_autoload(obj->progs.netdata_tcp_cleanup_rbuf_kprobe, false); + bpf_program__set_autoload(obj->progs.netdata_tcp_close_kprobe, false); + bpf_program__set_autoload(obj->progs.netdata_udp_recvmsg_kprobe, false); + bpf_program__set_autoload(obj->progs.netdata_udp_recvmsg_kretprobe, false); + bpf_program__set_autoload(obj->progs.netdata_tcp_sendmsg_kretprobe, false); + bpf_program__set_autoload(obj->progs.netdata_tcp_sendmsg_kprobe, false); + bpf_program__set_autoload(obj->progs.netdata_udp_sendmsg_kretprobe, false); + bpf_program__set_autoload(obj->progs.netdata_udp_sendmsg_kprobe, false); + bpf_program__set_autoload(obj->progs.netdata_socket_release_task_kprobe, false); +} + +/** + * Disable Trampoline + * + * Disable trampoline to use probes. + * + * @param obj is the main structure for bpf objects. + */ +static void ebpf_socket_disable_trampoline(struct socket_bpf *obj) +{ + bpf_program__set_autoload(obj->progs.netdata_inet_csk_accept_fentry, false); + bpf_program__set_autoload(obj->progs.netdata_tcp_v4_connect_fexit, false); + bpf_program__set_autoload(obj->progs.netdata_tcp_v6_connect_fexit, false); + bpf_program__set_autoload(obj->progs.netdata_tcp_retransmit_skb_fentry, false); + bpf_program__set_autoload(obj->progs.netdata_tcp_cleanup_rbuf_fentry, false); + bpf_program__set_autoload(obj->progs.netdata_tcp_close_fentry, false); + bpf_program__set_autoload(obj->progs.netdata_udp_recvmsg_fentry, false); + bpf_program__set_autoload(obj->progs.netdata_udp_recvmsg_fexit, false); + bpf_program__set_autoload(obj->progs.netdata_tcp_sendmsg_fentry, false); + bpf_program__set_autoload(obj->progs.netdata_tcp_sendmsg_fexit, false); + bpf_program__set_autoload(obj->progs.netdata_udp_sendmsg_fentry, false); + bpf_program__set_autoload(obj->progs.netdata_udp_sendmsg_fexit, false); + bpf_program__set_autoload(obj->progs.netdata_socket_release_task_fentry, false); +} + +/** + * Set trampoline target. + * + * @param obj is the main structure for bpf objects. + */ +static void ebpf_set_trampoline_target(struct socket_bpf *obj) +{ + bpf_program__set_attach_target(obj->progs.netdata_inet_csk_accept_fentry, 0, + socket_targets[NETDATA_FCNT_INET_CSK_ACCEPT].name); + + bpf_program__set_attach_target(obj->progs.netdata_tcp_v4_connect_fexit, 0, + socket_targets[NETDATA_FCNT_TCP_V4_CONNECT].name); + + bpf_program__set_attach_target(obj->progs.netdata_tcp_v6_connect_fexit, 0, + socket_targets[NETDATA_FCNT_TCP_V6_CONNECT].name); + + bpf_program__set_attach_target(obj->progs.netdata_tcp_retransmit_skb_fentry, 0, + socket_targets[NETDATA_FCNT_TCP_RETRANSMIT].name); + + bpf_program__set_attach_target(obj->progs.netdata_tcp_cleanup_rbuf_fentry, 0, + socket_targets[NETDATA_FCNT_CLEANUP_RBUF].name); + + bpf_program__set_attach_target(obj->progs.netdata_tcp_close_fentry, 0, socket_targets[NETDATA_FCNT_TCP_CLOSE].name); + + bpf_program__set_attach_target(obj->progs.netdata_udp_recvmsg_fentry, 0, + socket_targets[NETDATA_FCNT_UDP_RECEVMSG].name); + + bpf_program__set_attach_target(obj->progs.netdata_udp_recvmsg_fexit, 0, + socket_targets[NETDATA_FCNT_UDP_RECEVMSG].name); + + bpf_program__set_attach_target(obj->progs.netdata_tcp_sendmsg_fentry, 0, + socket_targets[NETDATA_FCNT_TCP_SENDMSG].name); + + bpf_program__set_attach_target(obj->progs.netdata_tcp_sendmsg_fexit, 0, + socket_targets[NETDATA_FCNT_TCP_SENDMSG].name); + + bpf_program__set_attach_target(obj->progs.netdata_udp_sendmsg_fentry, 0, + socket_targets[NETDATA_FCNT_UDP_SENDMSG].name); + + bpf_program__set_attach_target(obj->progs.netdata_udp_sendmsg_fexit, 0, + socket_targets[NETDATA_FCNT_UDP_SENDMSG].name); + + bpf_program__set_attach_target(obj->progs.netdata_socket_release_task_fentry, 0, EBPF_COMMON_FNCT_CLEAN_UP); +} + + +/** + * Disable specific trampoline + * + * Disable specific trampoline to match user selection. + * + * @param obj is the main structure for bpf objects. + * @param sel option selected by user. + */ +static inline void ebpf_socket_disable_specific_trampoline(struct socket_bpf *obj, netdata_run_mode_t sel) +{ + if (sel == MODE_RETURN) { + bpf_program__set_autoload(obj->progs.netdata_tcp_sendmsg_fentry, false); + bpf_program__set_autoload(obj->progs.netdata_udp_sendmsg_fentry, false); + } else { + bpf_program__set_autoload(obj->progs.netdata_tcp_sendmsg_fexit, false); + bpf_program__set_autoload(obj->progs.netdata_udp_sendmsg_fexit, false); + } +} + +/** + * Disable specific probe + * + * Disable specific probe to match user selection. + * + * @param obj is the main structure for bpf objects. + * @param sel option selected by user. + */ +static inline void ebpf_socket_disable_specific_probe(struct socket_bpf *obj, netdata_run_mode_t sel) +{ + if (sel == MODE_RETURN) { + bpf_program__set_autoload(obj->progs.netdata_tcp_sendmsg_kprobe, false); + bpf_program__set_autoload(obj->progs.netdata_udp_sendmsg_kprobe, false); + } else { + bpf_program__set_autoload(obj->progs.netdata_tcp_sendmsg_kretprobe, false); + bpf_program__set_autoload(obj->progs.netdata_udp_sendmsg_kretprobe, false); + } +} + +/** + * Attach probes + * + * Attach probes to targets. + * + * @param obj is the main structure for bpf objects. + * @param sel option selected by user. + */ +static int ebpf_socket_attach_probes(struct socket_bpf *obj, netdata_run_mode_t sel) +{ + obj->links.netdata_inet_csk_accept_kretprobe = bpf_program__attach_kprobe(obj->progs.netdata_inet_csk_accept_kretprobe, + true, + socket_targets[NETDATA_FCNT_INET_CSK_ACCEPT].name); + int ret = libbpf_get_error(obj->links.netdata_inet_csk_accept_kretprobe); + if (ret) + return -1; + + obj->links.netdata_tcp_v4_connect_kretprobe = bpf_program__attach_kprobe(obj->progs.netdata_tcp_v4_connect_kretprobe, + true, + socket_targets[NETDATA_FCNT_TCP_V4_CONNECT].name); + ret = libbpf_get_error(obj->links.netdata_tcp_v4_connect_kretprobe); + if (ret) + return -1; + + obj->links.netdata_tcp_v6_connect_kretprobe = bpf_program__attach_kprobe(obj->progs.netdata_tcp_v6_connect_kretprobe, + true, + socket_targets[NETDATA_FCNT_TCP_V6_CONNECT].name); + ret = libbpf_get_error(obj->links.netdata_tcp_v6_connect_kretprobe); + if (ret) + return -1; + + obj->links.netdata_tcp_retransmit_skb_kprobe = bpf_program__attach_kprobe(obj->progs.netdata_tcp_retransmit_skb_kprobe, + false, + socket_targets[NETDATA_FCNT_TCP_RETRANSMIT].name); + ret = libbpf_get_error(obj->links.netdata_tcp_retransmit_skb_kprobe); + if (ret) + return -1; + + obj->links.netdata_tcp_cleanup_rbuf_kprobe = bpf_program__attach_kprobe(obj->progs.netdata_tcp_cleanup_rbuf_kprobe, + false, + socket_targets[NETDATA_FCNT_CLEANUP_RBUF].name); + ret = libbpf_get_error(obj->links.netdata_tcp_cleanup_rbuf_kprobe); + if (ret) + return -1; + + obj->links.netdata_tcp_close_kprobe = bpf_program__attach_kprobe(obj->progs.netdata_tcp_close_kprobe, + false, + socket_targets[NETDATA_FCNT_TCP_CLOSE].name); + ret = libbpf_get_error(obj->links.netdata_tcp_close_kprobe); + if (ret) + return -1; + + obj->links.netdata_udp_recvmsg_kprobe = bpf_program__attach_kprobe(obj->progs.netdata_udp_recvmsg_kprobe, + false, + socket_targets[NETDATA_FCNT_UDP_RECEVMSG].name); + ret = libbpf_get_error(obj->links.netdata_udp_recvmsg_kprobe); + if (ret) + return -1; + + obj->links.netdata_udp_recvmsg_kretprobe = bpf_program__attach_kprobe(obj->progs.netdata_udp_recvmsg_kretprobe, + true, + socket_targets[NETDATA_FCNT_UDP_RECEVMSG].name); + ret = libbpf_get_error(obj->links.netdata_udp_recvmsg_kretprobe); + if (ret) + return -1; + + if (sel == MODE_RETURN) { + obj->links.netdata_tcp_sendmsg_kretprobe = bpf_program__attach_kprobe(obj->progs.netdata_tcp_sendmsg_kretprobe, + true, + socket_targets[NETDATA_FCNT_TCP_SENDMSG].name); + ret = libbpf_get_error(obj->links.netdata_tcp_sendmsg_kretprobe); + if (ret) + return -1; + + obj->links.netdata_udp_sendmsg_kretprobe = bpf_program__attach_kprobe(obj->progs.netdata_udp_sendmsg_kretprobe, + true, + socket_targets[NETDATA_FCNT_UDP_SENDMSG].name); + ret = libbpf_get_error(obj->links.netdata_udp_sendmsg_kretprobe); + if (ret) + return -1; + } else { + obj->links.netdata_tcp_sendmsg_kprobe = bpf_program__attach_kprobe(obj->progs.netdata_tcp_sendmsg_kprobe, + false, + socket_targets[NETDATA_FCNT_TCP_SENDMSG].name); + ret = libbpf_get_error(obj->links.netdata_tcp_sendmsg_kprobe); + if (ret) + return -1; + + obj->links.netdata_udp_sendmsg_kprobe = bpf_program__attach_kprobe(obj->progs.netdata_udp_sendmsg_kprobe, + false, + socket_targets[NETDATA_FCNT_UDP_SENDMSG].name); + ret = libbpf_get_error(obj->links.netdata_udp_sendmsg_kprobe); + if (ret) + return -1; + } + + obj->links.netdata_socket_release_task_kprobe = bpf_program__attach_kprobe(obj->progs.netdata_socket_release_task_kprobe, + false, EBPF_COMMON_FNCT_CLEAN_UP); + ret = libbpf_get_error(obj->links.netdata_socket_release_task_kprobe); + if (ret) + return -1; + + return 0; +} + +/** + * Set hash tables + * + * Set the values for maps according the value given by kernel. + * + * @param obj is the main structure for bpf objects. + */ +static void ebpf_socket_set_hash_tables(struct socket_bpf *obj) +{ + socket_maps[NETDATA_SOCKET_TABLE_BANDWIDTH].map_fd = bpf_map__fd(obj->maps.tbl_bandwidth); + socket_maps[NETDATA_SOCKET_GLOBAL].map_fd = bpf_map__fd(obj->maps.tbl_global_sock); + socket_maps[NETDATA_SOCKET_LPORTS].map_fd = bpf_map__fd(obj->maps.tbl_lports); + socket_maps[NETDATA_SOCKET_TABLE_IPV4].map_fd = bpf_map__fd(obj->maps.tbl_conn_ipv4); + socket_maps[NETDATA_SOCKET_TABLE_IPV6].map_fd = bpf_map__fd(obj->maps.tbl_conn_ipv6); + socket_maps[NETDATA_SOCKET_TABLE_UDP].map_fd = bpf_map__fd(obj->maps.tbl_nv_udp); + socket_maps[NETDATA_SOCKET_TABLE_CTRL].map_fd = bpf_map__fd(obj->maps.socket_ctrl); +} + +/** + * Adjust Map Size + * + * Resize maps according input from users. + * + * @param obj is the main structure for bpf objects. + * @param em structure with configuration + */ +static void ebpf_socket_adjust_map_size(struct socket_bpf *obj, ebpf_module_t *em) +{ + ebpf_update_map_size(obj->maps.tbl_bandwidth, &socket_maps[NETDATA_SOCKET_TABLE_BANDWIDTH], + em, bpf_map__name(obj->maps.tbl_bandwidth)); + + ebpf_update_map_size(obj->maps.tbl_conn_ipv4, &socket_maps[NETDATA_SOCKET_TABLE_IPV4], + em, bpf_map__name(obj->maps.tbl_conn_ipv4)); + + ebpf_update_map_size(obj->maps.tbl_conn_ipv6, &socket_maps[NETDATA_SOCKET_TABLE_IPV6], + em, bpf_map__name(obj->maps.tbl_conn_ipv6)); + + ebpf_update_map_size(obj->maps.tbl_nv_udp, &socket_maps[NETDATA_SOCKET_TABLE_UDP], + em, bpf_map__name(obj->maps.tbl_nv_udp)); +} + +/** + * Load and attach + * + * Load and attach the eBPF code in kernel. + * + * @param obj is the main structure for bpf objects. + * @param em structure with configuration + * + * @return it returns 0 on succes and -1 otherwise + */ +static inline int ebpf_socket_load_and_attach(struct socket_bpf *obj, ebpf_module_t *em) +{ + netdata_ebpf_targets_t *mt = em->targets; + netdata_ebpf_program_loaded_t test = mt[NETDATA_FCNT_INET_CSK_ACCEPT].mode; + + if (test == EBPF_LOAD_TRAMPOLINE) { + ebpf_socket_disable_probes(obj); + + ebpf_set_trampoline_target(obj); + ebpf_socket_disable_specific_trampoline(obj, em->mode); + } else { // We are not using tracepoints for this thread. + ebpf_socket_disable_trampoline(obj); + + ebpf_socket_disable_specific_probe(obj, em->mode); + } + + int ret = socket_bpf__load(obj); + if (ret) { + fprintf(stderr, "failed to load BPF object: %d\n", ret); + return ret; + } + + ebpf_socket_adjust_map_size(obj, em); + + if (test == EBPF_LOAD_TRAMPOLINE) { + ret = socket_bpf__attach(obj); + } else { + ret = ebpf_socket_attach_probes(obj, em->mode); + } + + if (!ret) { + ebpf_socket_set_hash_tables(obj); + + ebpf_update_controller(socket_maps[NETDATA_SOCKET_TABLE_CTRL].map_fd, em); + } + + return ret; +} +#endif /***************************************************************** * * PROCESS DATA AND SEND TO NETDATA @@ -294,6 +641,31 @@ static void ebpf_socket_send_nv_data(netdata_vector_plot_t *ptr) } /** + * Send Global Inbound connection + * + * Send number of connections read per protocol. + */ +static void ebpf_socket_send_global_inbound_conn() +{ + uint64_t udp_conn = 0; + uint64_t tcp_conn = 0; + ebpf_network_viewer_port_list_t *move = listen_ports; + while (move) { + if (move->protocol == IPPROTO_TCP) + tcp_conn += move->connections; + else + udp_conn += move->connections; + + move = move->next; + } + + write_begin_chart(NETDATA_EBPF_IP_FAMILY, NETDATA_INBOUND_CONNECTIONS); + write_chart_dimension(socket_publish_aggregated[NETDATA_IDX_INCOMING_CONNECTION_TCP].name, (long long) tcp_conn); + write_chart_dimension(socket_publish_aggregated[NETDATA_IDX_INCOMING_CONNECTION_UDP].name, (long long) udp_conn); + write_end_chart(); +} + +/** * Send data to Netdata calling auxiliary functions. * * @param em the structure with thread information @@ -304,6 +676,10 @@ static void ebpf_socket_send_data(ebpf_module_t *em) netdata_publish_vfs_common_t common_udp; ebpf_update_global_publish(socket_publish_aggregated, &common_tcp, &common_udp, socket_aggregated_data); + ebpf_socket_send_global_inbound_conn(); + write_count_chart(NETDATA_TCP_OUTBOUND_CONNECTIONS, NETDATA_EBPF_IP_FAMILY, + &socket_publish_aggregated[NETDATA_IDX_TCP_CONNECTION_V4], 2); + // We read bytes from function arguments, but bandwidth is given in bits, // so we need to multiply by 8 to convert for the final value. write_count_chart(NETDATA_TCP_FUNCTION_COUNT, NETDATA_EBPF_IP_FAMILY, socket_publish_aggregated, 3); @@ -367,6 +743,26 @@ void ebpf_socket_send_apps_data(ebpf_module_t *em, struct target *root) struct target *w; collected_number value; + write_begin_chart(NETDATA_APPS_FAMILY, NETDATA_NET_APPS_CONNECTION_TCP_V4); + for (w = root; w; w = w->next) { + if (unlikely(w->exposed && w->processes)) { + value = ebpf_socket_sum_values_for_pids(w->root_pid, offsetof(ebpf_socket_publish_apps_t, + call_tcp_v4_connection)); + write_chart_dimension(w->name, value); + } + } + write_end_chart(); + + write_begin_chart(NETDATA_APPS_FAMILY, NETDATA_NET_APPS_CONNECTION_TCP_V6); + for (w = root; w; w = w->next) { + if (unlikely(w->exposed && w->processes)) { + value = ebpf_socket_sum_values_for_pids(w->root_pid, offsetof(ebpf_socket_publish_apps_t, + call_tcp_v6_connection)); + write_chart_dimension(w->name, value); + } + } + write_end_chart(); + write_begin_chart(NETDATA_APPS_FAMILY, NETDATA_NET_APPS_BANDWIDTH_SENT); for (w = root; w; w = w->next) { if (unlikely(w->exposed && w->processes)) { @@ -456,6 +852,32 @@ void ebpf_socket_send_apps_data(ebpf_module_t *em, struct target *root) */ static void ebpf_create_global_charts(ebpf_module_t *em) { + int order = 21070; + ebpf_create_chart(NETDATA_EBPF_IP_FAMILY, + NETDATA_INBOUND_CONNECTIONS, + "Inbound connections.", + EBPF_COMMON_DIMENSION_CONNECTIONS, + NETDATA_SOCKET_KERNEL_FUNCTIONS, + NULL, + NETDATA_EBPF_CHART_TYPE_LINE, + order++, + ebpf_create_global_dimension, + &socket_publish_aggregated[NETDATA_IDX_INCOMING_CONNECTION_TCP], + 2, em->update_every, NETDATA_EBPF_MODULE_NAME_SOCKET); + + ebpf_create_chart(NETDATA_EBPF_IP_FAMILY, + NETDATA_TCP_OUTBOUND_CONNECTIONS, + "TCP outbound connections.", + EBPF_COMMON_DIMENSION_CONNECTIONS, + NETDATA_SOCKET_KERNEL_FUNCTIONS, + NULL, + NETDATA_EBPF_CHART_TYPE_LINE, + order++, + ebpf_create_global_dimension, + &socket_publish_aggregated[NETDATA_IDX_TCP_CONNECTION_V4], + 2, em->update_every, NETDATA_EBPF_MODULE_NAME_SOCKET); + + ebpf_create_chart(NETDATA_EBPF_IP_FAMILY, NETDATA_TCP_FUNCTION_COUNT, "Calls to internal functions", @@ -463,7 +885,7 @@ static void ebpf_create_global_charts(ebpf_module_t *em) NETDATA_SOCKET_KERNEL_FUNCTIONS, NULL, NETDATA_EBPF_CHART_TYPE_LINE, - 21070, + order++, ebpf_create_global_dimension, socket_publish_aggregated, 3, em->update_every, NETDATA_EBPF_MODULE_NAME_SOCKET); @@ -473,7 +895,7 @@ static void ebpf_create_global_charts(ebpf_module_t *em) NETDATA_SOCKET_KERNEL_FUNCTIONS, NULL, NETDATA_EBPF_CHART_TYPE_LINE, - 21071, + order++, ebpf_create_global_dimension, socket_publish_aggregated, 2, em->update_every, NETDATA_EBPF_MODULE_NAME_SOCKET); @@ -486,7 +908,7 @@ static void ebpf_create_global_charts(ebpf_module_t *em) NETDATA_SOCKET_KERNEL_FUNCTIONS, NULL, NETDATA_EBPF_CHART_TYPE_LINE, - 21072, + order++, ebpf_create_global_dimension, socket_publish_aggregated, 2, em->update_every, NETDATA_EBPF_MODULE_NAME_SOCKET); @@ -499,7 +921,7 @@ static void ebpf_create_global_charts(ebpf_module_t *em) NETDATA_SOCKET_KERNEL_FUNCTIONS, NULL, NETDATA_EBPF_CHART_TYPE_LINE, - 21073, + order++, ebpf_create_global_dimension, &socket_publish_aggregated[NETDATA_IDX_TCP_RETRANSMIT], 1, em->update_every, NETDATA_EBPF_MODULE_NAME_SOCKET); @@ -511,7 +933,7 @@ static void ebpf_create_global_charts(ebpf_module_t *em) NETDATA_SOCKET_KERNEL_FUNCTIONS, NULL, NETDATA_EBPF_CHART_TYPE_LINE, - 21074, + order++, ebpf_create_global_dimension, &socket_publish_aggregated[NETDATA_IDX_UDP_RECVBUF], 2, em->update_every, NETDATA_EBPF_MODULE_NAME_SOCKET); @@ -521,7 +943,7 @@ static void ebpf_create_global_charts(ebpf_module_t *em) NETDATA_SOCKET_KERNEL_FUNCTIONS, NULL, NETDATA_EBPF_CHART_TYPE_LINE, - 21075, + order++, ebpf_create_global_dimension, &socket_publish_aggregated[NETDATA_IDX_UDP_RECVBUF], 2, em->update_every, NETDATA_EBPF_MODULE_NAME_SOCKET); @@ -534,7 +956,7 @@ static void ebpf_create_global_charts(ebpf_module_t *em) NETDATA_SOCKET_KERNEL_FUNCTIONS, NULL, NETDATA_EBPF_CHART_TYPE_LINE, - 21076, + order++, ebpf_create_global_dimension, &socket_publish_aggregated[NETDATA_IDX_UDP_RECVBUF], 2, em->update_every, NETDATA_EBPF_MODULE_NAME_SOCKET); @@ -551,12 +973,29 @@ static void ebpf_create_global_charts(ebpf_module_t *em) */ void ebpf_socket_create_apps_charts(struct ebpf_module *em, void *ptr) { - struct target *root = ptr;; + struct target *root = ptr; + int order = 20080; + ebpf_create_charts_on_apps(NETDATA_NET_APPS_CONNECTION_TCP_V4, + "Calls to tcp_v4_connection", EBPF_COMMON_DIMENSION_CONNECTIONS, + NETDATA_APPS_NET_GROUP, + NETDATA_EBPF_CHART_TYPE_STACKED, + order++, + ebpf_algorithms[NETDATA_EBPF_INCREMENTAL_IDX], + root, em->update_every, NETDATA_EBPF_MODULE_NAME_SOCKET); + + ebpf_create_charts_on_apps(NETDATA_NET_APPS_CONNECTION_TCP_V6, + "Calls to tcp_v6_connection", EBPF_COMMON_DIMENSION_CONNECTIONS, + NETDATA_APPS_NET_GROUP, + NETDATA_EBPF_CHART_TYPE_STACKED, + order++, + ebpf_algorithms[NETDATA_EBPF_INCREMENTAL_IDX], + root, em->update_every, NETDATA_EBPF_MODULE_NAME_SOCKET); + ebpf_create_charts_on_apps(NETDATA_NET_APPS_BANDWIDTH_SENT, "Bytes sent", EBPF_COMMON_DIMENSION_BITS, NETDATA_APPS_NET_GROUP, NETDATA_EBPF_CHART_TYPE_STACKED, - 20080, + order++, ebpf_algorithms[NETDATA_EBPF_INCREMENTAL_IDX], root, em->update_every, NETDATA_EBPF_MODULE_NAME_SOCKET); @@ -564,7 +1003,7 @@ void ebpf_socket_create_apps_charts(struct ebpf_module *em, void *ptr) "bytes received", EBPF_COMMON_DIMENSION_BITS, NETDATA_APPS_NET_GROUP, NETDATA_EBPF_CHART_TYPE_STACKED, - 20081, + order++, ebpf_algorithms[NETDATA_EBPF_INCREMENTAL_IDX], root, em->update_every, NETDATA_EBPF_MODULE_NAME_SOCKET); @@ -573,7 +1012,7 @@ void ebpf_socket_create_apps_charts(struct ebpf_module *em, void *ptr) EBPF_COMMON_DIMENSION_CALL, NETDATA_APPS_NET_GROUP, NETDATA_EBPF_CHART_TYPE_STACKED, - 20082, + order++, ebpf_algorithms[NETDATA_EBPF_INCREMENTAL_IDX], root, em->update_every, NETDATA_EBPF_MODULE_NAME_SOCKET); @@ -582,7 +1021,7 @@ void ebpf_socket_create_apps_charts(struct ebpf_module *em, void *ptr) EBPF_COMMON_DIMENSION_CALL, NETDATA_APPS_NET_GROUP, NETDATA_EBPF_CHART_TYPE_STACKED, - 20083, + order++, ebpf_algorithms[NETDATA_EBPF_INCREMENTAL_IDX], root, em->update_every, NETDATA_EBPF_MODULE_NAME_SOCKET); @@ -591,7 +1030,7 @@ void ebpf_socket_create_apps_charts(struct ebpf_module *em, void *ptr) EBPF_COMMON_DIMENSION_CALL, NETDATA_APPS_NET_GROUP, NETDATA_EBPF_CHART_TYPE_STACKED, - 20084, + order++, ebpf_algorithms[NETDATA_EBPF_INCREMENTAL_IDX], root, em->update_every, NETDATA_EBPF_MODULE_NAME_SOCKET); @@ -600,7 +1039,7 @@ void ebpf_socket_create_apps_charts(struct ebpf_module *em, void *ptr) EBPF_COMMON_DIMENSION_CALL, NETDATA_APPS_NET_GROUP, NETDATA_EBPF_CHART_TYPE_STACKED, - 20085, + order++, ebpf_algorithms[NETDATA_EBPF_INCREMENTAL_IDX], root, em->update_every, NETDATA_EBPF_MODULE_NAME_SOCKET); @@ -609,7 +1048,7 @@ void ebpf_socket_create_apps_charts(struct ebpf_module *em, void *ptr) EBPF_COMMON_DIMENSION_CALL, NETDATA_APPS_NET_GROUP, NETDATA_EBPF_CHART_TYPE_STACKED, - 20086, + order++, ebpf_algorithms[NETDATA_EBPF_INCREMENTAL_IDX], root, em->update_every, NETDATA_EBPF_MODULE_NAME_SOCKET); @@ -1295,11 +1734,10 @@ netdata_vector_plot_t * select_vector_to_store(uint32_t *direction, netdata_sock * * @param values the values used to calculate the data. * @param key the key to store data. - * @param removesock check if this socket must be removed . * @param family the connection family * @param end the values size. */ -static void hash_accumulator(netdata_socket_t *values, netdata_socket_idx_t *key, int *removesock, int family, int end) +static void hash_accumulator(netdata_socket_t *values, netdata_socket_idx_t *key, int family, int end) { uint64_t bsent = 0, brecv = 0, psent = 0, precv = 0; uint16_t retransmit = 0; @@ -1320,8 +1758,6 @@ static void hash_accumulator(netdata_socket_t *values, netdata_socket_idx_t *key if (w->ct > ct) ct = w->ct; - - *removesock += (int)w->removeme; } values[0].recv_packets += precv; @@ -1329,7 +1765,6 @@ static void hash_accumulator(netdata_socket_t *values, netdata_socket_idx_t *key values[0].recv_bytes += brecv; values[0].sent_bytes += bsent; values[0].retransmit += retransmit; - values[0].removeme += (uint8_t)*removesock; values[0].protocol = (!protocol)?IPPROTO_TCP:protocol; values[0].ct = ct; @@ -1357,8 +1792,6 @@ static void read_socket_hash_table(int fd, int family, int network_connection) netdata_socket_idx_t key = {}; netdata_socket_idx_t next_key = {}; - netdata_socket_idx_t removeme; - int removesock = 0; netdata_socket_t *values = socket_values; size_t length = ebpf_nprocs*sizeof(netdata_socket_t); @@ -1375,35 +1808,41 @@ static void read_socket_hash_table(int fd, int family, int network_connection) continue; } - if (removesock) - bpf_map_delete_elem(fd, &removeme); - if (network_connection) { - removesock = 0; - hash_accumulator(values, &key, &removesock, family, end); + hash_accumulator(values, &key, family, end); } - if (removesock) - removeme = key; - key = next_key; } - if (removesock) - bpf_map_delete_elem(fd, &removeme); - test = bpf_map_lookup_elem(fd, &next_key, values); if (test < 0) { return; } if (network_connection) { - removesock = 0; - hash_accumulator(values, &next_key, &removesock, family, end); + hash_accumulator(values, &next_key, family, end); } +} - if (removesock) - bpf_map_delete_elem(fd, &next_key); +/** + * Fill Network Viewer Port list + * + * Fill the strcture with values read from /proc or hash table. + * + * @param out the structure where we will store data. + * @param value the ports we are listen to. + * @param proto the protocol used for this connection. + * @param in the strcuture with values read form different sources. + */ +static inline void fill_nv_port_list(ebpf_network_viewer_port_list_t *out, uint16_t value, uint16_t proto, + netdata_passive_connection_t *in) +{ + out->first = value; + out->protocol = proto; + out->pid = in->pid; + out->tgid = in->tgid; + out->connections = in->counter; } /** @@ -1413,31 +1852,33 @@ static void read_socket_hash_table(int fd, int family, int network_connection) * * @param value the ports we are listen to. * @param proto the protocol used with port connection. + * @param in the strcuture with values read form different sources. */ -void update_listen_table(uint16_t value, uint8_t proto) +void update_listen_table(uint16_t value, uint16_t proto, netdata_passive_connection_t *in) { ebpf_network_viewer_port_list_t *w; if (likely(listen_ports)) { ebpf_network_viewer_port_list_t *move = listen_ports, *store = listen_ports; while (move) { - if (move->protocol == proto && move->first == value) + if (move->protocol == proto && move->first == value) { + move->pid = in->pid; + move->tgid = in->tgid; + move->connections = in->counter; return; + } store = move; move = move->next; } w = callocz(1, sizeof(ebpf_network_viewer_port_list_t)); - w->first = value; - w->protocol = proto; store->next = w; } else { w = callocz(1, sizeof(ebpf_network_viewer_port_list_t)); - w->first = value; - w->protocol = proto; listen_ports = w; } + fill_nv_port_list(w, value, proto, in); #ifdef NETDATA_INTERNAL_CHECKS info("The network viewer is monitoring inbound connections for port %u", ntohs(value)); @@ -1451,11 +1892,11 @@ void update_listen_table(uint16_t value, uint8_t proto) */ static void read_listen_table() { - uint16_t key = 0; - uint16_t next_key = 0; + netdata_passive_connection_idx_t key = {}; + netdata_passive_connection_idx_t next_key = {}; int fd = socket_maps[NETDATA_SOCKET_LPORTS].map_fd; - uint8_t value; + netdata_passive_connection_t value = {}; while (bpf_map_get_next_key(fd, &key, &next_key) == 0) { int test = bpf_map_lookup_elem(fd, &key, &value); if (test < 0) { @@ -1464,14 +1905,15 @@ static void read_listen_table() } // The correct protocol must come from kernel - update_listen_table(htons(key), (key == 53)?IPPROTO_UDP:IPPROTO_TCP); + update_listen_table(key.port, key.protocol, &value); key = next_key; + memset(&value, 0, sizeof(value)); } - if (next_key) { + if (next_key.port && value.pid) { // The correct protocol must come from kernel - update_listen_table(htons(next_key), (key == 53)?IPPROTO_UDP:IPPROTO_TCP); + update_listen_table(next_key.port, next_key.protocol, &value); } } @@ -1542,11 +1984,15 @@ static void read_hash_global_tables() socket_aggregated_data[NETDATA_IDX_UDP_RECVBUF].call = res[NETDATA_KEY_CALLS_UDP_RECVMSG]; socket_aggregated_data[NETDATA_IDX_UDP_SENDMSG].call = res[NETDATA_KEY_CALLS_UDP_SENDMSG]; socket_aggregated_data[NETDATA_IDX_TCP_RETRANSMIT].call = res[NETDATA_KEY_TCP_RETRANSMIT]; + socket_aggregated_data[NETDATA_IDX_TCP_CONNECTION_V4].call = res[NETDATA_KEY_CALLS_TCP_CONNECT_IPV4]; + socket_aggregated_data[NETDATA_IDX_TCP_CONNECTION_V6].call = res[NETDATA_KEY_CALLS_TCP_CONNECT_IPV6]; socket_aggregated_data[NETDATA_IDX_TCP_SENDMSG].ecall = res[NETDATA_KEY_ERROR_TCP_SENDMSG]; socket_aggregated_data[NETDATA_IDX_TCP_CLEANUP_RBUF].ecall = res[NETDATA_KEY_ERROR_TCP_CLEANUP_RBUF]; socket_aggregated_data[NETDATA_IDX_UDP_RECVBUF].ecall = res[NETDATA_KEY_ERROR_UDP_RECVMSG]; socket_aggregated_data[NETDATA_IDX_UDP_SENDMSG].ecall = res[NETDATA_KEY_ERROR_UDP_SENDMSG]; + socket_aggregated_data[NETDATA_IDX_TCP_CONNECTION_V4].ecall = res[NETDATA_KEY_ERROR_TCP_CONNECT_IPV4]; + socket_aggregated_data[NETDATA_IDX_TCP_CONNECTION_V6].ecall = res[NETDATA_KEY_ERROR_TCP_CONNECT_IPV6]; socket_aggregated_data[NETDATA_IDX_TCP_SENDMSG].bytes = res[NETDATA_KEY_BYTES_TCP_SENDMSG]; socket_aggregated_data[NETDATA_IDX_TCP_CLEANUP_RBUF].bytes = res[NETDATA_KEY_BYTES_TCP_CLEANUP_RBUF]; @@ -1575,6 +2021,9 @@ void ebpf_socket_fill_publish_apps(uint32_t current_pid, ebpf_bandwidth_t *eb) curr->retransmit = eb->retransmit; curr->call_udp_sent = eb->call_udp_sent; curr->call_udp_received = eb->call_udp_received; + curr->call_close = eb->close; + curr->call_tcp_v4_connection = eb->tcp_v4_connection; + curr->call_tcp_v6_connection = eb->tcp_v6_connection; } /** @@ -1595,6 +2044,9 @@ void ebpf_socket_bandwidth_accumulator(ebpf_bandwidth_t *out) total->retransmit += move->retransmit; total->call_udp_sent += move->call_udp_sent; total->call_udp_received += move->call_udp_received; + total->close += move->close; + total->tcp_v4_connection += move->tcp_v4_connection; + total->tcp_v6_connection += move->tcp_v6_connection; } } @@ -1652,6 +2104,9 @@ static void ebpf_update_socket_cgroup() publish->retransmit = in->retransmit; publish->call_udp_sent = in->call_udp_sent; publish->call_udp_received = in->call_udp_received; + publish->call_close = in->call_close; + publish->call_tcp_v4_connection = in->call_tcp_v4_connection; + publish->call_tcp_v6_connection = in->call_tcp_v6_connection; } else { if (!bpf_map_lookup_elem(fd, &pid, eb)) { ebpf_socket_bandwidth_accumulator(eb); @@ -1665,6 +2120,9 @@ static void ebpf_update_socket_cgroup() publish->retransmit = out->retransmit; publish->call_udp_sent = out->call_udp_sent; publish->call_udp_received = out->call_udp_received; + publish->call_close = out->close; + publish->call_tcp_v4_connection = out->tcp_v4_connection; + publish->call_tcp_v6_connection = out->tcp_v6_connection; } } } @@ -1695,6 +2153,9 @@ static void ebpf_socket_sum_cgroup_pids(ebpf_socket_publish_apps_t *socket, stru accumulator.retransmit += w->retransmit; accumulator.call_udp_received += w->call_udp_received; accumulator.call_udp_sent += w->call_udp_sent; + accumulator.call_close += w->close; + accumulator.call_tcp_v4_connection += w->tcp_v4_connection; + accumulator.call_tcp_v6_connection += w->tcp_v6_connection; pids = pids->next; } @@ -1706,6 +2167,11 @@ static void ebpf_socket_sum_cgroup_pids(ebpf_socket_publish_apps_t *socket, stru socket->retransmit = (accumulator.retransmit >= socket->retransmit) ? accumulator.retransmit : socket->retransmit; socket->call_udp_sent = (accumulator.call_udp_sent >= socket->call_udp_sent) ? accumulator.call_udp_sent : socket->call_udp_sent; socket->call_udp_received = (accumulator.call_udp_received >= socket->call_udp_received) ? accumulator.call_udp_received : socket->call_udp_received; + socket->call_close = (accumulator.call_close >= socket->call_close) ? accumulator.call_close : socket->call_close; + socket->call_tcp_v4_connection = (accumulator.call_tcp_v4_connection >= socket->call_tcp_v4_connection) ? + accumulator.call_tcp_v4_connection : socket->call_tcp_v4_connection; + socket->call_tcp_v6_connection = (accumulator.call_tcp_v6_connection >= socket->call_tcp_v6_connection) ? + accumulator.call_tcp_v6_connection : socket->call_tcp_v6_connection; } /** @@ -1718,75 +2184,96 @@ static void ebpf_socket_sum_cgroup_pids(ebpf_socket_publish_apps_t *socket, stru */ static void ebpf_create_specific_socket_charts(char *type, int update_every) { + int order_basis = 5300; + ebpf_create_chart(type, NETDATA_NET_APPS_CONNECTION_TCP_V4, + "Calls to tcp_v4_connection", + EBPF_COMMON_DIMENSION_CONNECTIONS, NETDATA_CGROUP_NET_GROUP, + NETDATA_CGROUP_TCP_V4_CONN_CONTEXT, + NETDATA_EBPF_CHART_TYPE_LINE, + NETDATA_CHART_PRIO_CGROUPS_CONTAINERS + order_basis++, + ebpf_create_global_dimension, + &socket_publish_aggregated[NETDATA_IDX_TCP_CONNECTION_V4], 1, + update_every, NETDATA_EBPF_MODULE_NAME_SOCKET); + + ebpf_create_chart(type, NETDATA_NET_APPS_CONNECTION_TCP_V6, + "Calls to tcp_v6_connection", + EBPF_COMMON_DIMENSION_CONNECTIONS, NETDATA_CGROUP_NET_GROUP, + NETDATA_CGROUP_TCP_V6_CONN_CONTEXT, + NETDATA_EBPF_CHART_TYPE_LINE, + NETDATA_CHART_PRIO_CGROUPS_CONTAINERS + order_basis++, + ebpf_create_global_dimension, + &socket_publish_aggregated[NETDATA_IDX_TCP_CONNECTION_V6], 1, + update_every, NETDATA_EBPF_MODULE_NAME_SOCKET); + ebpf_create_chart(type, NETDATA_NET_APPS_BANDWIDTH_RECV, "Bytes received", EBPF_COMMON_DIMENSION_CALL, NETDATA_CGROUP_NET_GROUP, NETDATA_CGROUP_SOCKET_BYTES_RECV_CONTEXT, NETDATA_EBPF_CHART_TYPE_LINE, - NETDATA_CHART_PRIO_CGROUPS_CONTAINERS + 5300, + NETDATA_CHART_PRIO_CGROUPS_CONTAINERS + order_basis++, ebpf_create_global_dimension, &socket_publish_aggregated[NETDATA_IDX_TCP_CLEANUP_RBUF], 1, - update_every, NETDATA_EBPF_MODULE_NAME_SWAP); + update_every, NETDATA_EBPF_MODULE_NAME_SOCKET); ebpf_create_chart(type, NETDATA_NET_APPS_BANDWIDTH_SENT, "Bytes sent", EBPF_COMMON_DIMENSION_CALL, NETDATA_CGROUP_NET_GROUP, NETDATA_CGROUP_SOCKET_BYTES_SEND_CONTEXT, NETDATA_EBPF_CHART_TYPE_LINE, - NETDATA_CHART_PRIO_CGROUPS_CONTAINERS + 5301, + NETDATA_CHART_PRIO_CGROUPS_CONTAINERS + order_basis++, ebpf_create_global_dimension, socket_publish_aggregated, 1, - update_every, NETDATA_EBPF_MODULE_NAME_SWAP); + update_every, NETDATA_EBPF_MODULE_NAME_SOCKET); ebpf_create_chart(type, NETDATA_NET_APPS_BANDWIDTH_TCP_RECV_CALLS, "Calls to tcp_cleanup_rbuf.", EBPF_COMMON_DIMENSION_CALL, NETDATA_CGROUP_NET_GROUP, NETDATA_CGROUP_SOCKET_TCP_RECV_CONTEXT, NETDATA_EBPF_CHART_TYPE_LINE, - NETDATA_CHART_PRIO_CGROUPS_CONTAINERS + 5302, + NETDATA_CHART_PRIO_CGROUPS_CONTAINERS + order_basis++, ebpf_create_global_dimension, &socket_publish_aggregated[NETDATA_IDX_TCP_CLEANUP_RBUF], 1, - update_every, NETDATA_EBPF_MODULE_NAME_SWAP); + update_every, NETDATA_EBPF_MODULE_NAME_SOCKET); ebpf_create_chart(type, NETDATA_NET_APPS_BANDWIDTH_TCP_SEND_CALLS, "Calls to tcp_sendmsg.", EBPF_COMMON_DIMENSION_CALL, NETDATA_CGROUP_NET_GROUP, NETDATA_CGROUP_SOCKET_TCP_SEND_CONTEXT, NETDATA_EBPF_CHART_TYPE_LINE, - NETDATA_CHART_PRIO_CGROUPS_CONTAINERS + 5303, + NETDATA_CHART_PRIO_CGROUPS_CONTAINERS + order_basis++, ebpf_create_global_dimension, socket_publish_aggregated, 1, - update_every, NETDATA_EBPF_MODULE_NAME_SWAP); + update_every, NETDATA_EBPF_MODULE_NAME_SOCKET); ebpf_create_chart(type, NETDATA_NET_APPS_BANDWIDTH_TCP_RETRANSMIT, "Calls to tcp_retransmit.", EBPF_COMMON_DIMENSION_CALL, NETDATA_CGROUP_NET_GROUP, NETDATA_CGROUP_SOCKET_TCP_RETRANSMIT_CONTEXT, NETDATA_EBPF_CHART_TYPE_LINE, - NETDATA_CHART_PRIO_CGROUPS_CONTAINERS + 5304, + NETDATA_CHART_PRIO_CGROUPS_CONTAINERS + order_basis++, ebpf_create_global_dimension, &socket_publish_aggregated[NETDATA_IDX_TCP_RETRANSMIT], 1, - update_every, NETDATA_EBPF_MODULE_NAME_SWAP); + update_every, NETDATA_EBPF_MODULE_NAME_SOCKET); ebpf_create_chart(type, NETDATA_NET_APPS_BANDWIDTH_UDP_SEND_CALLS, "Calls to udp_sendmsg", EBPF_COMMON_DIMENSION_CALL, NETDATA_CGROUP_NET_GROUP, NETDATA_CGROUP_SOCKET_UDP_SEND_CONTEXT, NETDATA_EBPF_CHART_TYPE_LINE, - NETDATA_CHART_PRIO_CGROUPS_CONTAINERS + 5305, + NETDATA_CHART_PRIO_CGROUPS_CONTAINERS + order_basis++, ebpf_create_global_dimension, &socket_publish_aggregated[NETDATA_IDX_UDP_SENDMSG], 1, - update_every, NETDATA_EBPF_MODULE_NAME_SWAP); + update_every, NETDATA_EBPF_MODULE_NAME_SOCKET); ebpf_create_chart(type, NETDATA_NET_APPS_BANDWIDTH_UDP_RECV_CALLS, "Calls to udp_recvmsg", EBPF_COMMON_DIMENSION_CALL, NETDATA_CGROUP_NET_GROUP, NETDATA_CGROUP_SOCKET_UDP_RECV_CONTEXT, NETDATA_EBPF_CHART_TYPE_LINE, - NETDATA_CHART_PRIO_CGROUPS_CONTAINERS + 5306, + NETDATA_CHART_PRIO_CGROUPS_CONTAINERS + order_basis++, ebpf_create_global_dimension, &socket_publish_aggregated[NETDATA_IDX_UDP_RECVBUF], 1, - update_every, NETDATA_EBPF_MODULE_NAME_SWAP); + update_every, NETDATA_EBPF_MODULE_NAME_SOCKET); } /** @@ -1799,40 +2286,51 @@ static void ebpf_create_specific_socket_charts(char *type, int update_every) */ static void ebpf_obsolete_specific_socket_charts(char *type, int update_every) { + int order_basis = 5300; + ebpf_write_chart_obsolete(type, NETDATA_NET_APPS_CONNECTION_TCP_V4, "Calls to tcp_v4_connection", + EBPF_COMMON_DIMENSION_CONNECTIONS, NETDATA_APPS_NET_GROUP, + NETDATA_EBPF_CHART_TYPE_LINE, NETDATA_SERVICES_SOCKET_TCP_V4_CONN_CONTEXT, + NETDATA_CHART_PRIO_CGROUPS_CONTAINERS + order_basis++, update_every); + + ebpf_write_chart_obsolete(type, NETDATA_NET_APPS_CONNECTION_TCP_V6,"Calls to tcp_v6_connection", + EBPF_COMMON_DIMENSION_CONNECTIONS, NETDATA_APPS_NET_GROUP, + NETDATA_EBPF_CHART_TYPE_LINE, NETDATA_SERVICES_SOCKET_TCP_V6_CONN_CONTEXT, + NETDATA_CHART_PRIO_CGROUPS_CONTAINERS + order_basis++, update_every); + ebpf_write_chart_obsolete(type, NETDATA_NET_APPS_BANDWIDTH_RECV, "Bytes received", EBPF_COMMON_DIMENSION_CALL, NETDATA_APPS_NET_GROUP, NETDATA_EBPF_CHART_TYPE_LINE, NETDATA_SERVICES_SOCKET_BYTES_RECV_CONTEXT, - NETDATA_CHART_PRIO_CGROUPS_CONTAINERS + 5300, update_every); + NETDATA_CHART_PRIO_CGROUPS_CONTAINERS + order_basis++, update_every); ebpf_write_chart_obsolete(type, NETDATA_NET_APPS_BANDWIDTH_SENT,"Bytes sent", EBPF_COMMON_DIMENSION_CALL, NETDATA_APPS_NET_GROUP, NETDATA_EBPF_CHART_TYPE_LINE, NETDATA_SERVICES_SOCKET_BYTES_SEND_CONTEXT, - NETDATA_CHART_PRIO_CGROUPS_CONTAINERS + 5301, update_every); + NETDATA_CHART_PRIO_CGROUPS_CONTAINERS + order_basis++, update_every); ebpf_write_chart_obsolete(type, NETDATA_NET_APPS_BANDWIDTH_TCP_RECV_CALLS, "Calls to tcp_cleanup_rbuf.", EBPF_COMMON_DIMENSION_CALL, NETDATA_APPS_NET_GROUP, NETDATA_EBPF_CHART_TYPE_LINE, NETDATA_SERVICES_SOCKET_TCP_RECV_CONTEXT, - NETDATA_CHART_PRIO_CGROUPS_CONTAINERS + 5302, update_every); + NETDATA_CHART_PRIO_CGROUPS_CONTAINERS + order_basis++, update_every); ebpf_write_chart_obsolete(type, NETDATA_NET_APPS_BANDWIDTH_TCP_SEND_CALLS, "Calls to tcp_sendmsg.", EBPF_COMMON_DIMENSION_CALL, NETDATA_APPS_NET_GROUP, NETDATA_EBPF_CHART_TYPE_LINE, NETDATA_SERVICES_SOCKET_TCP_SEND_CONTEXT, - NETDATA_CHART_PRIO_CGROUPS_CONTAINERS + 5303, update_every); + NETDATA_CHART_PRIO_CGROUPS_CONTAINERS + order_basis++, update_every); ebpf_write_chart_obsolete(type, NETDATA_NET_APPS_BANDWIDTH_TCP_RETRANSMIT, "Calls to tcp_retransmit.", EBPF_COMMON_DIMENSION_CALL, NETDATA_APPS_NET_GROUP, NETDATA_EBPF_CHART_TYPE_LINE, NETDATA_SERVICES_SOCKET_TCP_RETRANSMIT_CONTEXT, - NETDATA_CHART_PRIO_CGROUPS_CONTAINERS + 5304, update_every); + NETDATA_CHART_PRIO_CGROUPS_CONTAINERS + order_basis++, update_every); ebpf_write_chart_obsolete(type, NETDATA_NET_APPS_BANDWIDTH_UDP_SEND_CALLS, "Calls to udp_sendmsg", EBPF_COMMON_DIMENSION_CALL, NETDATA_APPS_NET_GROUP, NETDATA_EBPF_CHART_TYPE_LINE, NETDATA_SERVICES_SOCKET_UDP_SEND_CONTEXT, - NETDATA_CHART_PRIO_CGROUPS_CONTAINERS + 5305, update_every); + NETDATA_CHART_PRIO_CGROUPS_CONTAINERS + order_basis++, update_every); ebpf_write_chart_obsolete(type, NETDATA_NET_APPS_BANDWIDTH_UDP_RECV_CALLS, "Calls to udp_recvmsg", EBPF_COMMON_DIMENSION_CALL, NETDATA_APPS_NET_GROUP, NETDATA_EBPF_CHART_TYPE_LINE, NETDATA_SERVICES_SOCKET_UDP_RECV_CONTEXT, - NETDATA_CHART_PRIO_CGROUPS_CONTAINERS + 5306, update_every); + NETDATA_CHART_PRIO_CGROUPS_CONTAINERS + order_basis++, update_every); } /* @@ -1845,6 +2343,16 @@ static void ebpf_obsolete_specific_socket_charts(char *type, int update_every) */ static void ebpf_send_specific_socket_data(char *type, ebpf_socket_publish_apps_t *values) { + write_begin_chart(type, NETDATA_NET_APPS_CONNECTION_TCP_V4); + write_chart_dimension(socket_publish_aggregated[NETDATA_IDX_TCP_CONNECTION_V4].name, + (long long) values->call_tcp_v4_connection); + write_end_chart(); + + write_begin_chart(type, NETDATA_NET_APPS_CONNECTION_TCP_V6); + write_chart_dimension(socket_publish_aggregated[NETDATA_IDX_TCP_CONNECTION_V6].name, + (long long) values->call_tcp_v6_connection); + write_end_chart(); + write_begin_chart(type, NETDATA_NET_APPS_BANDWIDTH_SENT); write_chart_dimension(socket_publish_aggregated[NETDATA_IDX_TCP_SENDMSG].name, (long long) values->bytes_sent); @@ -1890,11 +2398,30 @@ static void ebpf_send_specific_socket_data(char *type, ebpf_socket_publish_apps_ **/ static void ebpf_create_systemd_socket_charts(int update_every) { + int order = 20080; + ebpf_create_charts_on_systemd(NETDATA_NET_APPS_CONNECTION_TCP_V4, + "Calls to tcp_v4_connection", EBPF_COMMON_DIMENSION_CONNECTIONS, + NETDATA_APPS_NET_GROUP, + NETDATA_EBPF_CHART_TYPE_STACKED, + order++, + ebpf_algorithms[NETDATA_EBPF_INCREMENTAL_IDX], + NETDATA_SERVICES_SOCKET_TCP_V4_CONN_CONTEXT, NETDATA_EBPF_MODULE_NAME_SOCKET, + update_every); + + ebpf_create_charts_on_systemd(NETDATA_NET_APPS_CONNECTION_TCP_V6, + "Calls to tcp_v6_connection", EBPF_COMMON_DIMENSION_CONNECTIONS, + NETDATA_APPS_NET_GROUP, + NETDATA_EBPF_CHART_TYPE_STACKED, + order++, + ebpf_algorithms[NETDATA_EBPF_INCREMENTAL_IDX], + NETDATA_SERVICES_SOCKET_TCP_V6_CONN_CONTEXT, NETDATA_EBPF_MODULE_NAME_SOCKET, + update_every); + ebpf_create_charts_on_systemd(NETDATA_NET_APPS_BANDWIDTH_RECV, "Bytes received", EBPF_COMMON_DIMENSION_BITS, NETDATA_APPS_NET_GROUP, NETDATA_EBPF_CHART_TYPE_STACKED, - 20080, + order++, ebpf_algorithms[NETDATA_EBPF_INCREMENTAL_IDX], NETDATA_SERVICES_SOCKET_BYTES_RECV_CONTEXT, NETDATA_EBPF_MODULE_NAME_SOCKET, update_every); @@ -1903,7 +2430,7 @@ static void ebpf_create_systemd_socket_charts(int update_every) "Bytes sent", EBPF_COMMON_DIMENSION_BITS, NETDATA_APPS_NET_GROUP, NETDATA_EBPF_CHART_TYPE_STACKED, - 20081, + order++, ebpf_algorithms[NETDATA_EBPF_INCREMENTAL_IDX], NETDATA_SERVICES_SOCKET_BYTES_SEND_CONTEXT, NETDATA_EBPF_MODULE_NAME_SOCKET, update_every); @@ -1913,7 +2440,7 @@ static void ebpf_create_systemd_socket_charts(int update_every) EBPF_COMMON_DIMENSION_CALL, NETDATA_APPS_NET_GROUP, NETDATA_EBPF_CHART_TYPE_STACKED, - 20082, + order++, ebpf_algorithms[NETDATA_EBPF_INCREMENTAL_IDX], NETDATA_SERVICES_SOCKET_TCP_RECV_CONTEXT, NETDATA_EBPF_MODULE_NAME_SOCKET, update_every); @@ -1923,7 +2450,7 @@ static void ebpf_create_systemd_socket_charts(int update_every) EBPF_COMMON_DIMENSION_CALL, NETDATA_APPS_NET_GROUP, NETDATA_EBPF_CHART_TYPE_STACKED, - 20083, + order++, ebpf_algorithms[NETDATA_EBPF_INCREMENTAL_IDX], NETDATA_SERVICES_SOCKET_TCP_SEND_CONTEXT, NETDATA_EBPF_MODULE_NAME_SOCKET, update_every); @@ -1933,7 +2460,7 @@ static void ebpf_create_systemd_socket_charts(int update_every) EBPF_COMMON_DIMENSION_CALL, NETDATA_APPS_NET_GROUP, NETDATA_EBPF_CHART_TYPE_STACKED, - 20084, + order++, ebpf_algorithms[NETDATA_EBPF_INCREMENTAL_IDX], NETDATA_SERVICES_SOCKET_TCP_RETRANSMIT_CONTEXT, NETDATA_EBPF_MODULE_NAME_SOCKET, update_every); @@ -1943,7 +2470,7 @@ static void ebpf_create_systemd_socket_charts(int update_every) EBPF_COMMON_DIMENSION_CALL, NETDATA_APPS_NET_GROUP, NETDATA_EBPF_CHART_TYPE_STACKED, - 20085, + order++, ebpf_algorithms[NETDATA_EBPF_INCREMENTAL_IDX], NETDATA_SERVICES_SOCKET_UDP_SEND_CONTEXT, NETDATA_EBPF_MODULE_NAME_SOCKET, update_every); @@ -1953,7 +2480,7 @@ static void ebpf_create_systemd_socket_charts(int update_every) EBPF_COMMON_DIMENSION_CALL, NETDATA_APPS_NET_GROUP, NETDATA_EBPF_CHART_TYPE_STACKED, - 20086, + order++, ebpf_algorithms[NETDATA_EBPF_INCREMENTAL_IDX], NETDATA_SERVICES_SOCKET_UDP_RECV_CONTEXT, NETDATA_EBPF_MODULE_NAME_SOCKET, update_every); @@ -1971,6 +2498,24 @@ static int ebpf_send_systemd_socket_charts() { int ret = 1; ebpf_cgroup_target_t *ect; + write_begin_chart(NETDATA_SERVICE_FAMILY, NETDATA_NET_APPS_CONNECTION_TCP_V4); + for (ect = ebpf_cgroup_pids; ect ; ect = ect->next) { + if (unlikely(ect->systemd) && unlikely(ect->updated)) { + write_chart_dimension(ect->name, (long long)ect->publish_socket.call_tcp_v4_connection); + } else + ret = 0; + } + write_end_chart(); + + write_begin_chart(NETDATA_SERVICE_FAMILY, NETDATA_NET_APPS_CONNECTION_TCP_V6); + for (ect = ebpf_cgroup_pids; ect ; ect = ect->next) { + if (unlikely(ect->systemd) && unlikely(ect->updated)) { + write_chart_dimension(ect->name, (long long)ect->publish_socket.call_tcp_v6_connection); + } else + ret = 0; + } + write_end_chart(); + write_begin_chart(NETDATA_SERVICE_FAMILY, NETDATA_NET_APPS_BANDWIDTH_SENT); for (ect = ebpf_cgroup_pids; ect ; ect = ect->next) { if (unlikely(ect->systemd) && unlikely(ect->updated)) { @@ -3334,6 +3879,40 @@ void parse_table_size_options(struct config *cfg) EBPF_CONFIG_UDP_SIZE, NETDATA_MAXIMUM_UDP_CONNECTIONS_ALLOWED); } +/* + * Load BPF + * + * Load BPF files. + * + * @param em the structure with configuration + */ +static int ebpf_socket_load_bpf(ebpf_module_t *em) +{ + int ret = 0; + + if (em->load == EBPF_LOAD_LEGACY) { + probe_links = ebpf_load_program(ebpf_plugin_dir, em, running_on_kernel, isrh, &objects); + if (!probe_links) { + ret = -1; + } + } +#ifdef LIBBPF_MAJOR_VERSION + else { + bpf_obj = socket_bpf__open(); + if (!bpf_obj) + ret = -1; + else + ret = ebpf_socket_load_and_attach(bpf_obj, em); + } +#endif + + if (ret) { + error("%s %s", EBPF_DEFAULT_ERROR_MSG, em->thread_name); + } + + return ret; +} + /** * Socket thread * @@ -3375,8 +3954,10 @@ void *ebpf_socket_thread(void *ptr) if (running_on_kernel < NETDATA_EBPF_KERNEL_5_0) em->mode = MODE_ENTRY; - probe_links = ebpf_load_program(ebpf_plugin_dir, em, running_on_kernel, isrh, &objects); - if (!probe_links) { +#ifdef LIBBPF_MAJOR_VERSION + ebpf_adjust_thread_load(em, default_btf); +#endif + if (ebpf_socket_load_bpf(em)) { em->enabled = CONFIG_BOOLEAN_NO; pthread_mutex_unlock(&lock); goto endsocket; diff --git a/collectors/ebpf.plugin/ebpf_socket.h b/collectors/ebpf.plugin/ebpf_socket.h index e3c000c76..672001301 100644 --- a/collectors/ebpf.plugin/ebpf_socket.h +++ b/collectors/ebpf.plugin/ebpf_socket.h @@ -43,11 +43,27 @@ enum ebpf_socket_publish_index { NETDATA_IDX_UDP_RECVBUF, NETDATA_IDX_UDP_SENDMSG, NETDATA_IDX_TCP_RETRANSMIT, + NETDATA_IDX_TCP_CONNECTION_V4, + NETDATA_IDX_TCP_CONNECTION_V6, + NETDATA_IDX_INCOMING_CONNECTION_TCP, + NETDATA_IDX_INCOMING_CONNECTION_UDP, // Keep this as last and don't skip numbers as it is used as element counter NETDATA_MAX_SOCKET_VECTOR }; +enum socket_functions { + NETDATA_FCNT_INET_CSK_ACCEPT, + NETDATA_FCNT_TCP_RETRANSMIT, + NETDATA_FCNT_CLEANUP_RBUF, + NETDATA_FCNT_TCP_CLOSE, + NETDATA_FCNT_UDP_RECEVMSG, + NETDATA_FCNT_TCP_SENDMSG, + NETDATA_FCNT_UDP_SENDMSG, + NETDATA_FCNT_TCP_V4_CONNECT, + NETDATA_FCNT_TCP_V6_CONNECT +}; + typedef enum ebpf_socket_idx { NETDATA_KEY_CALLS_TCP_SENDMSG, NETDATA_KEY_ERROR_TCP_SENDMSG, @@ -69,6 +85,12 @@ typedef enum ebpf_socket_idx { NETDATA_KEY_TCP_RETRANSMIT, + NETDATA_KEY_CALLS_TCP_CONNECT_IPV4, + NETDATA_KEY_ERROR_TCP_CONNECT_IPV4, + + NETDATA_KEY_CALLS_TCP_CONNECT_IPV6, + NETDATA_KEY_ERROR_TCP_CONNECT_IPV6, + // Keep this as last and don't skip numbers as it is used as element counter NETDATA_SOCKET_COUNTER } ebpf_socket_index_t; @@ -78,6 +100,8 @@ typedef enum ebpf_socket_idx { #define NETDATA_CGROUP_NET_GROUP "network (eBPF)" // Global chart name +#define NETDATA_TCP_OUTBOUND_CONNECTIONS "tcp_outbound_conn" +#define NETDATA_INBOUND_CONNECTIONS "inbound_conn" #define NETDATA_TCP_FUNCTION_COUNT "tcp_functions" #define NETDATA_TCP_FUNCTION_BITS "total_tcp_bandwidth" #define NETDATA_TCP_FUNCTION_ERROR "tcp_error" @@ -87,6 +111,8 @@ typedef enum ebpf_socket_idx { #define NETDATA_UDP_FUNCTION_ERROR "udp_error" // Charts created on Apps submenu +#define NETDATA_NET_APPS_CONNECTION_TCP_V4 "outbound_conn_v4" +#define NETDATA_NET_APPS_CONNECTION_TCP_V6 "outbound_conn_v6" #define NETDATA_NET_APPS_BANDWIDTH_SENT "total_bandwidth_sent" #define NETDATA_NET_APPS_BANDWIDTH_RECV "total_bandwidth_recv" #define NETDATA_NET_APPS_BANDWIDTH_TCP_SEND_CALLS "bandwidth_tcp_send" @@ -114,6 +140,8 @@ typedef enum ebpf_socket_idx { #define NETDATA_MAXIMUM_IPV4_CIDR 32 // Contexts +#define NETDATA_CGROUP_TCP_V4_CONN_CONTEXT "cgroup.net_conn_ipv4" +#define NETDATA_CGROUP_TCP_V6_CONN_CONTEXT "cgroup.net_conn_ipv6" #define NETDATA_CGROUP_SOCKET_BYTES_RECV_CONTEXT "cgroup.net_bytes_recv" #define NETDATA_CGROUP_SOCKET_BYTES_SEND_CONTEXT "cgroup.net_bytes_send" #define NETDATA_CGROUP_SOCKET_TCP_RECV_CONTEXT "cgroup.net_tcp_recv" @@ -122,6 +150,8 @@ typedef enum ebpf_socket_idx { #define NETDATA_CGROUP_SOCKET_UDP_RECV_CONTEXT "cgroup.net_udp_recv" #define NETDATA_CGROUP_SOCKET_UDP_SEND_CONTEXT "cgroup.net_udp_send" +#define NETDATA_SERVICES_SOCKET_TCP_V4_CONN_CONTEXT "services.net_conn_ipv4" +#define NETDATA_SERVICES_SOCKET_TCP_V6_CONN_CONTEXT "services.net_conn_ipv6" #define NETDATA_SERVICES_SOCKET_BYTES_RECV_CONTEXT "services.net_bytes_recv" #define NETDATA_SERVICES_SOCKET_BYTES_SEND_CONTEXT "services.net_bytes_send" #define NETDATA_SERVICES_SOCKET_TCP_RECV_CONTEXT "services.net_tcp_recv" @@ -132,22 +162,16 @@ typedef enum ebpf_socket_idx { typedef struct ebpf_socket_publish_apps { // Data read - uint64_t bytes_sent; // Bytes sent - uint64_t bytes_received; // Bytes received - uint64_t call_tcp_sent; // Number of times tcp_sendmsg was called - uint64_t call_tcp_received; // Number of times tcp_cleanup_rbuf was called - uint64_t retransmit; // Number of times tcp_retransmit was called - uint64_t call_udp_sent; // Number of times udp_sendmsg was called - uint64_t call_udp_received; // Number of times udp_recvmsg was called - - // Publish information. - uint64_t publish_sent_bytes; - uint64_t publish_received_bytes; - uint64_t publish_tcp_sent; - uint64_t publish_tcp_received; - uint64_t publish_retransmit; - uint64_t publish_udp_sent; - uint64_t publish_udp_received; + uint64_t bytes_sent; // Bytes sent + uint64_t bytes_received; // Bytes received + uint64_t call_tcp_sent; // Number of times tcp_sendmsg was called + uint64_t call_tcp_received; // Number of times tcp_cleanup_rbuf was called + uint64_t retransmit; // Number of times tcp_retransmit was called + uint64_t call_udp_sent; // Number of times udp_sendmsg was called + uint64_t call_udp_received; // Number of times udp_recvmsg was called + uint64_t call_close; // Number of times tcp_close was called + uint64_t call_tcp_v4_connection;// Number of times tcp_v4_connect was called + uint64_t call_tcp_v6_connection;// Number of times tcp_v6_connect was called } ebpf_socket_publish_apps_t; typedef struct ebpf_network_viewer_dimension_names { @@ -169,10 +193,24 @@ typedef struct ebpf_network_viewer_port_list { uint16_t cmp_first; uint16_t cmp_last; - uint8_t protocol; + uint16_t protocol; + uint32_t pid; + uint32_t tgid; + uint64_t connections; struct ebpf_network_viewer_port_list *next; } ebpf_network_viewer_port_list_t; +typedef struct netdata_passive_connection { + uint32_t tgid; + uint32_t pid; + uint64_t counter; +} netdata_passive_connection_t; + +typedef struct netdata_passive_connection_idx { + uint16_t protocol; + uint16_t port; +} netdata_passive_connection_idx_t; + /** * Union used to store ip addresses */ @@ -238,20 +276,18 @@ typedef struct netdata_socket { uint64_t sent_bytes; uint64_t first; // First timestamp uint64_t ct; // Current timestamp - uint16_t retransmit; // It is never used with UDP - uint8_t protocol; - uint8_t removeme; - uint32_t reserved; + uint32_t retransmit; // It is never used with UDP + uint16_t protocol; + uint16_t reserved; } netdata_socket_t __attribute__((__aligned__(8))); - typedef struct netdata_plot_values { // Values used in the previous iteration uint64_t recv_packets; uint64_t sent_packets; uint64_t recv_bytes; uint64_t sent_bytes; - uint16_t retransmit; + uint32_t retransmit; uint64_t last_time; @@ -322,7 +358,7 @@ typedef struct netdata_vector_plot { extern void clean_port_structure(ebpf_network_viewer_port_list_t **clean); extern ebpf_network_viewer_port_list_t *listen_ports; -extern void update_listen_table(uint16_t value, uint8_t proto); +extern void update_listen_table(uint16_t value, uint16_t proto, netdata_passive_connection_t *values); extern void parse_network_viewer_section(struct config *cfg); extern void fill_ip_list(ebpf_network_viewer_ip_list_t **out, ebpf_network_viewer_ip_list_t *in, char *table); extern void parse_service_name_section(struct config *cfg); @@ -330,5 +366,6 @@ extern void clean_socket_apps_structures(); extern ebpf_socket_publish_apps_t **socket_bandwidth_curr; extern struct config socket_config; +extern netdata_ebpf_targets_t socket_targets[]; #endif diff --git a/collectors/ebpf.plugin/ebpf_swap.c b/collectors/ebpf.plugin/ebpf_swap.c index 82eb9db88..906c83da5 100644 --- a/collectors/ebpf.plugin/ebpf_swap.c +++ b/collectors/ebpf.plugin/ebpf_swap.c @@ -644,7 +644,7 @@ static void ebpf_swap_allocate_global_vectors(int apps) static void ebpf_create_swap_charts(int update_every) { ebpf_create_chart(NETDATA_EBPF_SYSTEM_GROUP, NETDATA_MEM_SWAP_CHART, - "Calls to internal functions used to access swap.", + "Calls to access swap memory", EBPF_COMMON_DIMENSION_CALL, NETDATA_SYSTEM_SWAP_SUBMENU, NULL, NETDATA_EBPF_CHART_TYPE_LINE, diff --git a/collectors/ebpf.plugin/ebpf_sync.c b/collectors/ebpf.plugin/ebpf_sync.c index b3f1b6524..233c34a5b 100644 --- a/collectors/ebpf.plugin/ebpf_sync.c +++ b/collectors/ebpf.plugin/ebpf_sync.c @@ -44,21 +44,179 @@ struct config sync_config = { .first_section = NULL, .rwlock = AVL_LOCK_INITIALIZER } }; ebpf_sync_syscalls_t local_syscalls[] = { - {.syscall = "sync", .enabled = CONFIG_BOOLEAN_YES, .objects = NULL, .probe_links = NULL}, - {.syscall = "syncfs", .enabled = CONFIG_BOOLEAN_YES, .objects = NULL, .probe_links = NULL}, - {.syscall = "msync", .enabled = CONFIG_BOOLEAN_YES, .objects = NULL, .probe_links = NULL}, - {.syscall = "fsync", .enabled = CONFIG_BOOLEAN_YES, .objects = NULL, .probe_links = NULL}, - {.syscall = "fdatasync", .enabled = CONFIG_BOOLEAN_YES, .objects = NULL, .probe_links = NULL}, - {.syscall = "sync_file_range", .enabled = CONFIG_BOOLEAN_YES, .objects = NULL, .probe_links = NULL}, + {.syscall = NETDATA_SYSCALLS_SYNC, .enabled = CONFIG_BOOLEAN_YES, .objects = NULL, .probe_links = NULL}, + {.syscall = NETDATA_SYSCALLS_SYNCFS, .enabled = CONFIG_BOOLEAN_YES, .objects = NULL, .probe_links = NULL}, + {.syscall = NETDATA_SYSCALLS_MSYNC, .enabled = CONFIG_BOOLEAN_YES, .objects = NULL, .probe_links = NULL}, + {.syscall = NETDATA_SYSCALLS_FSYNC, .enabled = CONFIG_BOOLEAN_YES, .objects = NULL, .probe_links = NULL}, + {.syscall = NETDATA_SYSCALLS_FDATASYNC, .enabled = CONFIG_BOOLEAN_YES, .objects = NULL, .probe_links = NULL}, + {.syscall = NETDATA_SYSCALLS_SYNC_FILE_RANGE, .enabled = CONFIG_BOOLEAN_YES, .objects = NULL, .probe_links = NULL}, {.syscall = NULL, .enabled = CONFIG_BOOLEAN_NO, .objects = NULL, .probe_links = NULL} }; +netdata_ebpf_targets_t sync_targets[] = { {.name = NETDATA_SYSCALLS_SYNC, .mode = EBPF_LOAD_TRAMPOLINE}, + {.name = NETDATA_SYSCALLS_SYNCFS, .mode = EBPF_LOAD_TRAMPOLINE}, + {.name = NETDATA_SYSCALLS_MSYNC, .mode = EBPF_LOAD_TRAMPOLINE}, + {.name = NETDATA_SYSCALLS_FSYNC, .mode = EBPF_LOAD_TRAMPOLINE}, + {.name = NETDATA_SYSCALLS_FDATASYNC, .mode = EBPF_LOAD_TRAMPOLINE}, + {.name = NETDATA_SYSCALLS_SYNC_FILE_RANGE, .mode = EBPF_LOAD_TRAMPOLINE}, + {.name = NULL, .mode = EBPF_LOAD_TRAMPOLINE}}; + + +#ifdef LIBBPF_MAJOR_VERSION +/***************************************************************** + * + * BTF FUNCTIONS + * + *****************************************************************/ + +/** + * Disable probe + * + * Disable kprobe to use another method. + * + * @param obj is the main structure for bpf objects. + */ +static inline void ebpf_sync_disable_probe(struct sync_bpf *obj) +{ + bpf_program__set_autoload(obj->progs.netdata_sync_kprobe, false); +} + +/** + * Disable tramppoline + * + * Disable trampoline to use another method. + * + * @param obj is the main structure for bpf objects. + */ +static inline void ebpf_sync_disable_trampoline(struct sync_bpf *obj) +{ + bpf_program__set_autoload(obj->progs.netdata_sync_fentry, false); +} + +/** + * Disable tracepoint + * + * Disable tracepoints according information given. + * + * @param obj object loaded + * @param idx Which syscall will not be disabled + */ +void ebpf_sync_disable_tracepoints(struct sync_bpf *obj, sync_syscalls_index_t idx) +{ + if (idx != NETDATA_SYNC_SYNC_IDX) + bpf_program__set_autoload(obj->progs.netdata_sync_entry, false); + + if (idx != NETDATA_SYNC_SYNCFS_IDX) + bpf_program__set_autoload(obj->progs.netdata_syncfs_entry, false); + + if (idx != NETDATA_SYNC_MSYNC_IDX) + bpf_program__set_autoload(obj->progs.netdata_msync_entry, false); + + if (idx != NETDATA_SYNC_FSYNC_IDX) + bpf_program__set_autoload(obj->progs.netdata_fsync_entry, false); + + if (idx != NETDATA_SYNC_FDATASYNC_IDX) + bpf_program__set_autoload(obj->progs.netdata_fdatasync_entry, false); + + if (idx != NETDATA_SYNC_SYNC_FILE_RANGE_IDX) + bpf_program__set_autoload(obj->progs.netdata_sync_file_range_entry, false); +} + +/** + * Set hash tables + * + * Set the values for maps according the value given by kernel. + * + * @param obj is the main structure for bpf objects. + * @param idx the index for the main structure + */ +static void ebpf_sync_set_hash_tables(struct sync_bpf *obj, sync_syscalls_index_t idx) +{ + sync_maps[idx].map_fd = bpf_map__fd(obj->maps.tbl_sync); +} + +/** + * Load and attach + * + * Load and attach the eBPF code in kernel. + * + * @param obj is the main structure for bpf objects. + * @param em the structure with configuration + * @param target the syscall that we are attaching a tracer. + * @param idx the index for the main structure + * + * @return it returns 0 on succes and -1 otherwise + */ +static inline int ebpf_sync_load_and_attach(struct sync_bpf *obj, ebpf_module_t *em, char *target, + sync_syscalls_index_t idx) +{ + netdata_ebpf_targets_t *synct = em->targets; + netdata_ebpf_program_loaded_t test = synct[NETDATA_SYNC_SYNC_IDX].mode; + + if (test == EBPF_LOAD_TRAMPOLINE) { + ebpf_sync_disable_probe(obj); + ebpf_sync_disable_tracepoints(obj, NETDATA_SYNC_IDX_END); + + bpf_program__set_attach_target(obj->progs.netdata_sync_fentry, 0, + target); + } else if (test == EBPF_LOAD_PROBE || + test == EBPF_LOAD_RETPROBE) { + ebpf_sync_disable_tracepoints(obj, NETDATA_SYNC_IDX_END); + ebpf_sync_disable_trampoline(obj); + } else { + ebpf_sync_disable_probe(obj); + ebpf_sync_disable_trampoline(obj); + + ebpf_sync_disable_tracepoints(obj, idx); + } + + int ret = sync_bpf__load(obj); + if (!ret) { + if (test != EBPF_LOAD_PROBE && test != EBPF_LOAD_RETPROBE) { + ret = sync_bpf__attach(obj); + } else { + obj->links.netdata_sync_kprobe = bpf_program__attach_kprobe(obj->progs.netdata_sync_kprobe, + false, target); + ret = (int)libbpf_get_error(obj->links.netdata_sync_kprobe); + } + + if (!ret) + ebpf_sync_set_hash_tables(obj, idx); + } + + return ret; +} +#endif + /***************************************************************** * * INITIALIZE THREAD * *****************************************************************/ +/** + * Load Legacy + * + * Load legacy code. + * + * @param w is the sync output structure with pointers to objects loaded. + * @param em is structure with configuration + * + * @return 0 on success and -1 otherwise. + */ +static int ebpf_sync_load_legacy(ebpf_sync_syscalls_t *w, ebpf_module_t *em) +{ + em->thread_name = w->syscall; + if (!w->probe_links) { + w->probe_links = ebpf_load_program(ebpf_plugin_dir, em, running_on_kernel, isrh, &w->objects); + if (!w->probe_links) { + return -1; + } + } + + return 0; +} + /* * Initialize Syscalls * @@ -70,15 +228,33 @@ static int ebpf_sync_initialize_syscall(ebpf_module_t *em) { int i; const char *saved_name = em->thread_name; + sync_syscalls_index_t errors = 0; for (i = 0; local_syscalls[i].syscall; i++) { ebpf_sync_syscalls_t *w = &local_syscalls[i]; - if (!w->probe_links && w->enabled) { - em->thread_name = w->syscall; - w->probe_links = ebpf_load_program(ebpf_plugin_dir, em, running_on_kernel, isrh, &w->objects); - if (!w->probe_links) { + if (w->enabled) { + if (em->load == EBPF_LOAD_LEGACY) { + if (ebpf_sync_load_legacy(w, em)) + errors++; + em->thread_name = saved_name; - return -1; } +#ifdef LIBBPF_MAJOR_VERSION + else { + char syscall[NETDATA_EBPF_MAX_SYSCALL_LENGTH]; + ebpf_select_host_prefix(syscall, NETDATA_EBPF_MAX_SYSCALL_LENGTH, w->syscall, running_on_kernel); + w->sync_obj = sync_bpf__open(); + if (!w->sync_obj) { + errors++; + } else { + if (ebpf_sync_load_and_attach(w->sync_obj, em, syscall, i)) { + if (ebpf_sync_load_legacy(w, em)) + errors++; + + em->thread_name = saved_name; + } + } + } +#endif } } em->thread_name = saved_name; @@ -254,6 +430,10 @@ void ebpf_sync_cleanup_objects() } bpf_object__close(w->objects); } +#ifdef LIBBPF_MAJOR_VERSION + else if (w->sync_obj) + sync_bpf__destroy(w->sync_obj); +#endif } } @@ -386,6 +566,9 @@ void *ebpf_sync_thread(void *ptr) if (!em->enabled) goto endsync; +#ifdef LIBBPF_MAJOR_VERSION + ebpf_adjust_thread_load(em, default_btf); +#endif if (ebpf_sync_initialize_syscall(em)) { em->enabled = CONFIG_BOOLEAN_NO; goto endsync; diff --git a/collectors/ebpf.plugin/ebpf_sync.h b/collectors/ebpf.plugin/ebpf_sync.h index e40c77a3f..2bc18c544 100644 --- a/collectors/ebpf.plugin/ebpf_sync.h +++ b/collectors/ebpf.plugin/ebpf_sync.h @@ -3,6 +3,10 @@ #ifndef NETDATA_EBPF_SYNC_H #define NETDATA_EBPF_SYNC_H 1 +#ifdef LIBBPF_MAJOR_VERSION +#include "includes/sync.skel.h" +#endif + // Module name #define NETDATA_EBPF_MODULE_NAME_SYNC "sync" @@ -13,13 +17,20 @@ #define NETDATA_EBPF_FILE_SEGMENT_CHART "file_segment" #define NETDATA_EBPF_SYNC_SUBMENU "synchronization (eBPF)" +#define NETDATA_SYSCALLS_SYNC "sync" +#define NETDATA_SYSCALLS_SYNCFS "syncfs" +#define NETDATA_SYSCALLS_MSYNC "msync" +#define NETDATA_SYSCALLS_FSYNC "fsync" +#define NETDATA_SYSCALLS_FDATASYNC "fdatasync" +#define NETDATA_SYSCALLS_SYNC_FILE_RANGE "sync_file_range" + #define NETDATA_EBPF_SYNC_SLEEP_MS 800000ULL // configuration file #define NETDATA_SYNC_CONFIG_FILE "sync.conf" #define NETDATA_SYNC_CONFIG_NAME "syscalls" -enum sync_syscalls_index { +typedef enum sync_syscalls_index { NETDATA_SYNC_SYNC_IDX, NETDATA_SYNC_SYNCFS_IDX, NETDATA_SYNC_MSYNC_IDX, @@ -28,15 +39,23 @@ enum sync_syscalls_index { NETDATA_SYNC_SYNC_FILE_RANGE_IDX, NETDATA_SYNC_IDX_END -}; +} sync_syscalls_index_t; typedef struct ebpf_sync_syscalls { char *syscall; int enabled; uint32_t flags; + // BTF structure struct bpf_object *objects; struct bpf_link **probe_links; + + // BPF structure +#ifdef LIBBPF_MAJOR_VERSION + struct sync_bpf *sync_obj; +#else + void *sync_obj; +#endif } ebpf_sync_syscalls_t; enum netdata_sync_charts { @@ -52,5 +71,6 @@ enum netdata_sync_table { extern void *ebpf_sync_thread(void *ptr); extern struct config sync_config; +extern netdata_ebpf_targets_t sync_targets[]; #endif /* NETDATA_EBPF_SYNC_H */ diff --git a/collectors/ebpf.plugin/ebpf_vfs.c b/collectors/ebpf.plugin/ebpf_vfs.c index d1c418f85..e14165fb7 100644 --- a/collectors/ebpf.plugin/ebpf_vfs.c +++ b/collectors/ebpf.plugin/ebpf_vfs.c @@ -670,42 +670,42 @@ static void ebpf_create_specific_vfs_charts(char *type, ebpf_module_t *em) 1, em->update_every, NETDATA_EBPF_MODULE_NAME_SWAP); ebpf_create_chart(type, NETDATA_SYSCALL_APPS_VFS_FSYNC, "Calls for <code>vfs_fsync</code>", - EBPF_COMMON_DIMENSION_CALL, NETDATA_VFS_CGROUP_GROUP, NULL, + EBPF_COMMON_DIMENSION_CALL, NETDATA_VFS_CGROUP_GROUP, NETDATA_CGROUP_VFS_FSYNC_CONTEXT, NETDATA_EBPF_CHART_TYPE_LINE, NETDATA_CHART_PRIO_CGROUPS_CONTAINERS + 5507, ebpf_create_global_dimension, &vfs_publish_aggregated[NETDATA_KEY_PUBLISH_VFS_FSYNC], 1, em->update_every, NETDATA_EBPF_MODULE_NAME_SWAP); if (em->mode < MODE_ENTRY) { ebpf_create_chart(type, NETDATA_SYSCALL_APPS_VFS_FSYNC_CALLS_ERROR, "Sync error", - EBPF_COMMON_DIMENSION_CALL, NETDATA_VFS_CGROUP_GROUP, NULL, + EBPF_COMMON_DIMENSION_CALL, NETDATA_VFS_CGROUP_GROUP, NETDATA_CGROUP_VFS_FSYNC_ERROR_CONTEXT, NETDATA_EBPF_CHART_TYPE_LINE, NETDATA_CHART_PRIO_CGROUPS_CONTAINERS + 5508, ebpf_create_global_dimension, &vfs_publish_aggregated[NETDATA_KEY_PUBLISH_VFS_FSYNC], 1, em->update_every, NETDATA_EBPF_MODULE_NAME_SWAP); } ebpf_create_chart(type, NETDATA_SYSCALL_APPS_VFS_OPEN, "Calls for <code>vfs_open</code>", - EBPF_COMMON_DIMENSION_CALL, NETDATA_VFS_CGROUP_GROUP, NULL, + EBPF_COMMON_DIMENSION_CALL, NETDATA_VFS_CGROUP_GROUP, NETDATA_CGROUP_VFS_OPEN_CONTEXT, NETDATA_EBPF_CHART_TYPE_LINE, NETDATA_CHART_PRIO_CGROUPS_CONTAINERS + 5509, ebpf_create_global_dimension, &vfs_publish_aggregated[NETDATA_KEY_PUBLISH_VFS_OPEN], 1, em->update_every, NETDATA_EBPF_MODULE_NAME_SWAP); if (em->mode < MODE_ENTRY) { ebpf_create_chart(type, NETDATA_SYSCALL_APPS_VFS_OPEN_CALLS_ERROR, "Open error", - EBPF_COMMON_DIMENSION_CALL, NETDATA_VFS_CGROUP_GROUP, NULL, + EBPF_COMMON_DIMENSION_CALL, NETDATA_VFS_CGROUP_GROUP, NETDATA_CGROUP_VFS_OPEN_ERROR_CONTEXT, NETDATA_EBPF_CHART_TYPE_LINE, NETDATA_CHART_PRIO_CGROUPS_CONTAINERS + 5510, ebpf_create_global_dimension, &vfs_publish_aggregated[NETDATA_KEY_PUBLISH_VFS_OPEN], 1, em->update_every, NETDATA_EBPF_MODULE_NAME_SWAP); } ebpf_create_chart(type, NETDATA_SYSCALL_APPS_VFS_CREATE, "Calls for <code>vfs_create</code>", - EBPF_COMMON_DIMENSION_CALL, NETDATA_VFS_CGROUP_GROUP, NULL, + EBPF_COMMON_DIMENSION_CALL, NETDATA_VFS_CGROUP_GROUP, NETDATA_CGROUP_VFS_CREATE_CONTEXT, NETDATA_EBPF_CHART_TYPE_LINE, NETDATA_CHART_PRIO_CGROUPS_CONTAINERS + 5511, ebpf_create_global_dimension, &vfs_publish_aggregated[NETDATA_KEY_PUBLISH_VFS_CREATE], 1, em->update_every, NETDATA_EBPF_MODULE_NAME_SWAP); if (em->mode < MODE_ENTRY) { ebpf_create_chart(type, NETDATA_SYSCALL_APPS_VFS_CREATE_CALLS_ERROR, "Create error", - EBPF_COMMON_DIMENSION_CALL, NETDATA_VFS_CGROUP_GROUP, NULL, + EBPF_COMMON_DIMENSION_CALL, NETDATA_VFS_CGROUP_GROUP, NETDATA_CGROUP_VFS_CREATE_ERROR_CONTEXT, NETDATA_EBPF_CHART_TYPE_LINE, NETDATA_CHART_PRIO_CGROUPS_CONTAINERS + 5512, ebpf_create_global_dimension, &vfs_publish_aggregated[NETDATA_KEY_PUBLISH_VFS_CREATE], 1, em->update_every, NETDATA_EBPF_MODULE_NAME_SWAP); @@ -763,37 +763,37 @@ static void ebpf_obsolete_specific_vfs_charts(char *type, ebpf_module_t *em) ebpf_write_chart_obsolete(type, NETDATA_SYSCALL_APPS_VFS_FSYNC, "Calls for <code>vfs_fsync</code>", EBPF_COMMON_DIMENSION_CALL, NETDATA_VFS_GROUP, - NETDATA_EBPF_CHART_TYPE_LINE, NULL, + NETDATA_EBPF_CHART_TYPE_LINE, NETDATA_CGROUP_VFS_FSYNC_CONTEXT, NETDATA_CHART_PRIO_CGROUPS_CONTAINERS + 5507, em->update_every); if (em->mode < MODE_ENTRY) { ebpf_write_chart_obsolete(type, NETDATA_SYSCALL_APPS_VFS_FSYNC_CALLS_ERROR, "Sync error", EBPF_COMMON_DIMENSION_CALL, NETDATA_VFS_GROUP, - NETDATA_EBPF_CHART_TYPE_LINE, NULL, + NETDATA_EBPF_CHART_TYPE_LINE, NETDATA_CGROUP_VFS_FSYNC_ERROR_CONTEXT, NETDATA_CHART_PRIO_CGROUPS_CONTAINERS + 5508, em->update_every); } ebpf_write_chart_obsolete(type, NETDATA_SYSCALL_APPS_VFS_OPEN, "Calls for <code>vfs_open</code>", EBPF_COMMON_DIMENSION_CALL, NETDATA_VFS_GROUP, - NETDATA_EBPF_CHART_TYPE_LINE, NULL, + NETDATA_EBPF_CHART_TYPE_LINE, NETDATA_CGROUP_VFS_OPEN_CONTEXT, NETDATA_CHART_PRIO_CGROUPS_CONTAINERS + 5509, em->update_every); if (em->mode < MODE_ENTRY) { ebpf_write_chart_obsolete(type, NETDATA_SYSCALL_APPS_VFS_OPEN_CALLS_ERROR, "Open error", EBPF_COMMON_DIMENSION_CALL, NETDATA_VFS_GROUP, - NETDATA_EBPF_CHART_TYPE_LINE, NULL, + NETDATA_EBPF_CHART_TYPE_LINE, NETDATA_CGROUP_VFS_OPEN_ERROR_CONTEXT, NETDATA_CHART_PRIO_CGROUPS_CONTAINERS + 5510, em->update_every); } ebpf_write_chart_obsolete(type, NETDATA_SYSCALL_APPS_VFS_CREATE, "Calls for <code>vfs_create</code>", EBPF_COMMON_DIMENSION_CALL, NETDATA_VFS_GROUP, - NETDATA_EBPF_CHART_TYPE_LINE, NULL, + NETDATA_EBPF_CHART_TYPE_LINE, NETDATA_CGROUP_VFS_CREATE_CONTEXT, NETDATA_CHART_PRIO_CGROUPS_CONTAINERS + 5511, em->update_every); if (em->mode < MODE_ENTRY) { ebpf_write_chart_obsolete(type, NETDATA_SYSCALL_APPS_VFS_CREATE_CALLS_ERROR, "Create error", EBPF_COMMON_DIMENSION_CALL, NETDATA_VFS_GROUP, - NETDATA_EBPF_CHART_TYPE_LINE, NULL, + NETDATA_EBPF_CHART_TYPE_LINE, NETDATA_CGROUP_VFS_CREATE_ERROR_CONTEXT, NETDATA_CHART_PRIO_CGROUPS_CONTAINERS + 5512, em->update_every); } } @@ -943,41 +943,41 @@ static void ebpf_create_systemd_vfs_charts(ebpf_module_t *em) ebpf_create_charts_on_systemd(NETDATA_SYSCALL_APPS_VFS_FSYNC, "Calls to <code>vfs_fsync</code>", EBPF_COMMON_DIMENSION_CALL, NETDATA_VFS_CGROUP_GROUP, NETDATA_EBPF_CHART_TYPE_STACKED, 20072, - ebpf_algorithms[NETDATA_EBPF_INCREMENTAL_IDX], NULL, + ebpf_algorithms[NETDATA_EBPF_INCREMENTAL_IDX], NETDATA_SYSTEMD_VFS_FSYNC_CONTEXT, NETDATA_EBPF_MODULE_NAME_VFS, em->update_every); if (em->mode < MODE_ENTRY) { ebpf_create_charts_on_systemd(NETDATA_SYSCALL_APPS_VFS_FSYNC_CALLS_ERROR, "Sync error", EBPF_COMMON_DIMENSION_CALL, NETDATA_VFS_CGROUP_GROUP, NETDATA_EBPF_CHART_TYPE_STACKED, 20073, - ebpf_algorithms[NETDATA_EBPF_INCREMENTAL_IDX], NULL, + ebpf_algorithms[NETDATA_EBPF_INCREMENTAL_IDX], NETDATA_SYSTEMD_VFS_FSYNC_ERROR_CONTEXT, NETDATA_EBPF_MODULE_NAME_VFS, em->update_every); } ebpf_create_charts_on_systemd(NETDATA_SYSCALL_APPS_VFS_OPEN, "Calls to <code>vfs_open</code>", EBPF_COMMON_DIMENSION_CALL, NETDATA_VFS_CGROUP_GROUP, NETDATA_EBPF_CHART_TYPE_STACKED, 20074, - ebpf_algorithms[NETDATA_EBPF_INCREMENTAL_IDX], NULL, + ebpf_algorithms[NETDATA_EBPF_INCREMENTAL_IDX], NETDATA_SYSTEMD_VFS_OPEN_CONTEXT, NETDATA_EBPF_MODULE_NAME_VFS, em->update_every); if (em->mode < MODE_ENTRY) { ebpf_create_charts_on_systemd(NETDATA_SYSCALL_APPS_VFS_OPEN_CALLS_ERROR, "Open error", EBPF_COMMON_DIMENSION_CALL, NETDATA_VFS_CGROUP_GROUP, NETDATA_EBPF_CHART_TYPE_STACKED, 20075, - ebpf_algorithms[NETDATA_EBPF_INCREMENTAL_IDX], NULL, + ebpf_algorithms[NETDATA_EBPF_INCREMENTAL_IDX], NETDATA_SYSTEMD_VFS_OPEN_ERROR_CONTEXT, NETDATA_EBPF_MODULE_NAME_VFS, em->update_every); } ebpf_create_charts_on_systemd(NETDATA_SYSCALL_APPS_VFS_CREATE, "Calls to <code>vfs_create</code>", EBPF_COMMON_DIMENSION_CALL, NETDATA_VFS_CGROUP_GROUP, NETDATA_EBPF_CHART_TYPE_STACKED, 20076, - ebpf_algorithms[NETDATA_EBPF_INCREMENTAL_IDX], NULL, + ebpf_algorithms[NETDATA_EBPF_INCREMENTAL_IDX], NETDATA_SYSTEMD_VFS_CREATE_CONTEXT, NETDATA_EBPF_MODULE_NAME_VFS, em->update_every); if (em->mode < MODE_ENTRY) { ebpf_create_charts_on_systemd(NETDATA_SYSCALL_APPS_VFS_CREATE_CALLS_ERROR, "Create error", EBPF_COMMON_DIMENSION_CALL, NETDATA_VFS_CGROUP_GROUP, NETDATA_EBPF_CHART_TYPE_STACKED, 20077, - ebpf_algorithms[NETDATA_EBPF_INCREMENTAL_IDX], NULL, + ebpf_algorithms[NETDATA_EBPF_INCREMENTAL_IDX], NETDATA_SYSTEMD_VFS_CREATE_ERROR_CONTEXT, NETDATA_EBPF_MODULE_NAME_VFS, em->update_every); } } diff --git a/collectors/ebpf.plugin/ebpf_vfs.h b/collectors/ebpf.plugin/ebpf_vfs.h index 0a972c983..67542ad44 100644 --- a/collectors/ebpf.plugin/ebpf_vfs.h +++ b/collectors/ebpf.plugin/ebpf_vfs.h @@ -50,6 +50,12 @@ #define NETDATA_CGROUP_VFS_READ_ERROR_CONTEXT "cgroup.vfs_read_error" #define NETDATA_CGROUP_VFS_WRITE_BYTES_CONTEXT "cgroup.vfs_write_bytes" #define NETDATA_CGROUP_VFS_READ_BYTES_CONTEXT "cgroup.vfs_read_bytes" +#define NETDATA_CGROUP_VFS_CREATE_CONTEXT "cgroup.vfs_create" +#define NETDATA_CGROUP_VFS_CREATE_ERROR_CONTEXT "cgroup.vfs_create_error" +#define NETDATA_CGROUP_VFS_OPEN_CONTEXT "cgroup.vfs_open" +#define NETDATA_CGROUP_VFS_OPEN_ERROR_CONTEXT "cgroup.vfs_open_error" +#define NETDATA_CGROUP_VFS_FSYNC_CONTEXT "cgroup.vfs_fsync" +#define NETDATA_CGROUP_VFS_FSYNC_ERROR_CONTEXT "cgroup.vfs_fsync_error" #define NETDATA_SYSTEMD_VFS_UNLINK_CONTEXT "services.vfs_unlink" #define NETDATA_SYSTEMD_VFS_WRITE_CONTEXT "services.vfs_write" @@ -58,6 +64,12 @@ #define NETDATA_SYSTEMD_VFS_READ_ERROR_CONTEXT "services.vfs_read_error" #define NETDATA_SYSTEMD_VFS_WRITE_BYTES_CONTEXT "services.vfs_write_bytes" #define NETDATA_SYSTEMD_VFS_READ_BYTES_CONTEXT "services.vfs_read_bytes" +#define NETDATA_SYSTEMD_VFS_CREATE_CONTEXT "services.vfs_create" +#define NETDATA_SYSTEMD_VFS_CREATE_ERROR_CONTEXT "services.vfs_create_error" +#define NETDATA_SYSTEMD_VFS_OPEN_CONTEXT "services.vfs_open" +#define NETDATA_SYSTEMD_VFS_OPEN_ERROR_CONTEXT "services.vfs_open_error" +#define NETDATA_SYSTEMD_VFS_FSYNC_CONTEXT "services.vfs_fsync" +#define NETDATA_SYSTEMD_VFS_FSYNC_ERROR_CONTEXT "services.vfs_fsync_error" typedef struct netdata_publish_vfs { uint64_t pid_tgid; diff --git a/collectors/fping.plugin/README.md b/collectors/fping.plugin/README.md index 4aca2a9de..626edf5d0 100644 --- a/collectors/fping.plugin/README.md +++ b/collectors/fping.plugin/README.md @@ -99,4 +99,4 @@ That's it. Netdata will detect the new plugin and start it. You can name the new plugin any name you like. Just make sure the plugin and the configuration file have the same name. -[](<>) + diff --git a/collectors/freebsd.plugin/README.md b/collectors/freebsd.plugin/README.md index 1b519a659..9a97a7ece 100644 --- a/collectors/freebsd.plugin/README.md +++ b/collectors/freebsd.plugin/README.md @@ -9,4 +9,4 @@ Collects resource usage and performance data on FreeBSD systems By default, Netdata will enable monitoring metrics for disks, memory, and network only when they are not zero. If they are constantly zero they are ignored. Metrics that will start having values, after Netdata is started, will be detected and charts will be automatically added to the dashboard (a refresh of the dashboard is needed for them to appear though). Use `yes` instead of `auto` in plugin configuration sections to enable these charts permanently. You can also set the `enable zero metrics` option to `yes` in the `[global]` section which enables charts with zero metrics for all internal Netdata plugins. -[](<>) + diff --git a/collectors/freeipmi.plugin/README.md b/collectors/freeipmi.plugin/README.md index 3ff6f4099..13958784e 100644 --- a/collectors/freeipmi.plugin/README.md +++ b/collectors/freeipmi.plugin/README.md @@ -191,4 +191,4 @@ If you need to disable IPMI for Netdata, edit `/etc/netdata/netdata.conf` and se freeipmi = no ``` -[](<>) + diff --git a/collectors/idlejitter.plugin/README.md b/collectors/idlejitter.plugin/README.md index 40436d33c..5a92d5317 100644 --- a/collectors/idlejitter.plugin/README.md +++ b/collectors/idlejitter.plugin/README.md @@ -29,4 +29,4 @@ idlejitter.plugin generates the idlejitter chart which measures CPU idle jitter This chart is available without any configuration. -[](<>) + diff --git a/collectors/ioping.plugin/README.md b/collectors/ioping.plugin/README.md index 08b0ce8b1..c4c3695c5 100644 --- a/collectors/ioping.plugin/README.md +++ b/collectors/ioping.plugin/README.md @@ -83,4 +83,4 @@ That's it. Netdata will detect the new plugin and start it. You can name the new plugin any name you like. Just make sure the plugin and the configuration file have the same name. -[](<>) + diff --git a/collectors/ioping.plugin/ioping.plugin.in b/collectors/ioping.plugin/ioping.plugin.in index 1a82ef6d0..1d79eb706 100755 --- a/collectors/ioping.plugin/ioping.plugin.in +++ b/collectors/ioping.plugin/ioping.plugin.in @@ -174,16 +174,14 @@ ioping_opts="-T 1000000" # ----------------------------------------------------------------------------- # load the configuration files -for CONFIG in "${NETDATA_STOCK_CONFIG_DIR}/${plugin}.conf" "${NETDATA_USER_CONFIG_DIR}/${plugin}.conf" -do - if [ -f "${CONFIG}" ] - then - info "Loading config file '${CONFIG}'..." - source "${CONFIG}" - [ $? -ne 0 ] && error "Failed to load config file '${CONFIG}'." - else - warning "Cannot find file '${CONFIG}'." - fi +for CONFIG in "${NETDATA_STOCK_CONFIG_DIR}/${plugin}.conf" "${NETDATA_USER_CONFIG_DIR}/${plugin}.conf"; do + if [ -f "${CONFIG}" ]; then + info "Loading config file '${CONFIG}'..." + source "${CONFIG}" + [ $? -ne 0 ] && error "Failed to load config file '${CONFIG}'." + elif [[ $CONFIG =~ ^$NETDATA_USER_CONFIG_DIR ]]; then + warning "Cannot find file '${CONFIG}'." + fi done if [ -z "${destination}" ] diff --git a/collectors/macos.plugin/README.md b/collectors/macos.plugin/README.md index 800eb0e85..92bbf1eb1 100644 --- a/collectors/macos.plugin/README.md +++ b/collectors/macos.plugin/README.md @@ -9,4 +9,4 @@ Collects resource usage and performance data on macOS systems By default, Netdata will enable monitoring metrics for disks, memory, and network only when they are not zero. If they are constantly zero they are ignored. Metrics that will start having values, after Netdata is started, will be detected and charts will be automatically added to the dashboard (a refresh of the dashboard is needed for them to appear though). Use `yes` instead of `auto` in plugin configuration sections to enable these charts permanently. You can also set the `enable zero metrics` option to `yes` in the `[global]` section which enables charts with zero metrics for all internal Netdata plugins. -[](<>) + diff --git a/collectors/macos.plugin/macos_fw.c b/collectors/macos.plugin/macos_fw.c index 1fa2d39c8..08d1ddadd 100644 --- a/collectors/macos.plugin/macos_fw.c +++ b/collectors/macos.plugin/macos_fw.c @@ -35,7 +35,7 @@ int do_macos_iokit(int update_every, usec_t dt) { RRDSET *st; - mach_port_t master_port; + mach_port_t main_port; io_registry_entry_t drive, drive_media; io_iterator_t drive_list; CFDictionaryRef properties, statistics; @@ -73,19 +73,22 @@ int do_macos_iokit(int update_every, usec_t dt) { // NEEDED BY: do_space, do_inodes struct statfs *mntbuf; int mntsize, i; - char mntonname[MNAMELEN + 1]; char title[4096 + 1]; // NEEDED BY: do_bandwidth struct ifaddrs *ifa, *ifap; +#if !defined(MAC_OS_VERSION_12_0) || (MAC_OS_X_VERSION_MIN_REQUIRED < MAC_OS_VERSION_12_0) +#define IOMainPort IOMasterPort +#endif + /* Get ports and services for drive statistics. */ - if (unlikely(IOMasterPort(bootstrap_port, &master_port))) { + if (unlikely(IOMainPort(bootstrap_port, &main_port))) { error("MACOS: IOMasterPort() failed"); do_io = 0; error("DISABLED: system.io"); /* Get the list of all drive objects. */ - } else if (unlikely(IOServiceGetMatchingServices(master_port, IOServiceMatching("IOBlockStorageDriver"), &drive_list))) { + } else if (unlikely(IOServiceGetMatchingServices(main_port, IOServiceMatching("IOBlockStorageDriver"), &drive_list))) { error("MACOS: IOServiceGetMatchingServices() failed"); do_io = 0; error("DISABLED: system.io"); @@ -115,7 +118,7 @@ int do_macos_iokit(int update_every, usec_t dt) { CFRelease(properties); IOObjectRelease(drive_media); - if(unlikely(!diskstat.name || !*diskstat.name)) { + if(unlikely(!*diskstat.name)) { IOObjectRelease(drive); continue; } diff --git a/collectors/macos.plugin/macos_sysctl.c b/collectors/macos.plugin/macos_sysctl.c index b744ebbcc..34d3f0b3e 100644 --- a/collectors/macos.plugin/macos_sysctl.c +++ b/collectors/macos.plugin/macos_sysctl.c @@ -70,11 +70,9 @@ int do_macos_sysctl(int update_every, usec_t dt) { do_uptime = config_get_boolean("plugin:macos:sysctl", "system uptime", 1); } - RRDSET *st; + RRDSET *st = NULL; - int system_pagesize = getpagesize(); // wouldn't it be better to get value directly from hw.pagesize? - int i, n; - int common_error = 0; + int i; size_t size; // NEEDED BY: do_loadavg @@ -96,7 +94,6 @@ int do_macos_sysctl(int update_every, usec_t dt) { // NEEDED BY: do_tcp... struct tcpstat tcpstat; - uint64_t tcps_states[TCP_NSTATES]; // NEEDED BY: do_udp... struct udpstat udpstat; diff --git a/collectors/nfacct.plugin/README.md b/collectors/nfacct.plugin/README.md index 1bd8a46e8..bacc8b70e 100644 --- a/collectors/nfacct.plugin/README.md +++ b/collectors/nfacct.plugin/README.md @@ -9,7 +9,7 @@ custom_edit_url: https://github.com/netdata/netdata/edit/master/collectors/nfacc ## Prerequisites -1. install `libmnl-dev` and `libnetfilter_acct-dev` using the package manager of your system. +1. install `libmnl-dev` and `libnetfilter-acct-dev` using the package manager of your system. 2. re-install Netdata from source. The installer will detect that the required libraries are now available and will also build `netdata.plugin`. @@ -51,4 +51,4 @@ sudo /usr/libexec/netdata/plugins.d/nfacct.plugin 1 debug You will get verbose output on what the plugin does. -[](<>) + diff --git a/collectors/node.d.plugin/Makefile.am b/collectors/node.d.plugin/Makefile.am index c3142d433..1b8281748 100644 --- a/collectors/node.d.plugin/Makefile.am +++ b/collectors/node.d.plugin/Makefile.am @@ -36,11 +36,7 @@ dist_nodeconfig_DATA = \ dist_node_DATA = \ $(NULL) -include fronius/Makefile.inc -include named/Makefile.inc -include sma_webbox/Makefile.inc include snmp/Makefile.inc -include stiebeleltron/Makefile.inc nodemodulesdir=$(nodedir)/node_modules dist_nodemodules_DATA = \ diff --git a/collectors/node.d.plugin/README.md b/collectors/node.d.plugin/README.md index 8db80d85b..4c5f278bd 100644 --- a/collectors/node.d.plugin/README.md +++ b/collectors/node.d.plugin/README.md @@ -233,4 +233,4 @@ The `service` object defines a set of functions to allow you send information to _FIXME: document an operational node.d.plugin data collector - the best example is the [snmp collector](https://raw.githubusercontent.com/netdata/netdata/master/collectors/node.d.plugin/snmp/snmp.node.js)_ -[](<>) + diff --git a/collectors/node.d.plugin/fronius/Makefile.inc b/collectors/node.d.plugin/fronius/Makefile.inc deleted file mode 100644 index da0743a88..000000000 --- a/collectors/node.d.plugin/fronius/Makefile.inc +++ /dev/null @@ -1,13 +0,0 @@ -# SPDX-License-Identifier: GPL-3.0-or-later - -# THIS IS NOT A COMPLETE Makefile -# IT IS INCLUDED BY ITS PARENT'S Makefile.am -# IT IS REQUIRED TO REFERENCE ALL FILES RELATIVE TO THE PARENT - -# install these files -dist_node_DATA += fronius/fronius.node.js -# dist_nodeconfig_DATA += fronius/fronius.conf - -# do not install these files, but include them in the distribution -dist_noinst_DATA += fronius/README.md fronius/Makefile.inc - diff --git a/collectors/node.d.plugin/fronius/README.md b/collectors/node.d.plugin/fronius/README.md deleted file mode 100644 index 746737d0b..000000000 --- a/collectors/node.d.plugin/fronius/README.md +++ /dev/null @@ -1,135 +0,0 @@ -<!-- -title: "Fronius Symo monitoring with Netdata" -custom_edit_url: https://github.com/netdata/netdata/edit/master/collectors/node.d.plugin/fronius/README.md -sidebar_label: "Fronius Symo" ---> - -# Fronius Symo monitoring with Netdata - -Collects metrics from the configured solar power installation from Fronius Symo. - -**Requirements** - -- Configuration file `fronius.conf` in the node.d Netdata config dir (default: `/etc/netdata/node.d/fronius.conf`) -- Fronius Symo with network access (http) - -It produces per server: - -1. **Power** - -- Current power input from the grid (positive values), output to the grid (negative values), in W -- Current power input from the solar panels, in W -- Current power stored in the accumulator (if present), in W (in theory, untested) - -2. **Consumption** - -- Local consumption in W - -3. **Autonomy** - -- Relative autonomy in %. 100 % autonomy means that the solar panels are delivering more power than it is needed by local consumption. -- Relative self consumption in %. The lower the better - -4. **Energy** - -- The energy produced during the current day, in kWh -- The energy produced during the current year, in kWh - -5. **Inverter** - -- The current power output from the connected inverters, in W, one dimension per inverter. At least one is always present. - -## configuration - -Sample: - -```json -{ - "enable_autodetect": false, - "update_every": 5, - "servers": [ - { - "name": "Symo", - "hostname": "symo.ip.or.dns", - "update_every": 5, - "api_path": "/solar_api/v1/GetPowerFlowRealtimeData.fcgi" - } - ] -} -``` - -If no configuration is given, the module will be disabled. Each `update_every` is optional, the default is `5`. - ---- - -[Fronius Symo 8.2](https://www.fronius.com/en/photovoltaics/products/all-products/inverters/fronius-symo/fronius-symo-8-2-3-m) - -The plugin has been tested with a single inverter, namely Fronius Symo 8.2-3-M: - -- Datalogger version: 240.162630 -- Software version: 3.7.4-6 -- Hardware version: 2.4D - -Other products and versions may work, but without any guarantees. - -Example Netdata configuration for node.d/fronius.conf. Copy this section to fronius.conf and change name/ip. -The module supports any number of servers. Sometimes there is a lag when collecting every 3 seconds, so 5 should be okay too. You can modify this per server. - -```json -{ - "enable_autodetect": false, - "update_every": 5, - "servers": [ - { - "name": "solar", - "hostname": "symo.ip.or.dns", - "update_every": 5, - "api_path": "/solar_api/v1/GetPowerFlowRealtimeData.fcgi" - } - ] -} -``` - -The output of /solar_api/v1/GetPowerFlowRealtimeData.fcgi looks like this: - -```json -{ - "Head" : { - "RequestArguments" : {}, - "Status" : { - "Code" : 0, - "Reason" : "", - "UserMessage" : "" - }, - "Timestamp" : "2017-07-05T12:35:12+02:00" - }, - "Body" : { - "Data" : { - "Site" : { - "Mode" : "meter", - "P_Grid" : -6834.549847, - "P_Load" : -1271.450153, - "P_Akku" : null, - "P_PV" : 8106, - "rel_SelfConsumption" : 15.685297, - "rel_Autonomy" : 100, - "E_Day" : 35020, - "E_Year" : 5826076, - "E_Total" : 14788870, - "Meter_Location" : "grid" - }, - "Inverters" : { - "1" : { - "DT" : 123, - "P" : 8106, - "E_Day" : 35020, - "E_Year" : 5826076, - "E_Total" : 14788870 - } - } - } - } -} -``` - -[](<>) diff --git a/collectors/node.d.plugin/fronius/fronius.node.js b/collectors/node.d.plugin/fronius/fronius.node.js deleted file mode 100644 index 436f3a325..000000000 --- a/collectors/node.d.plugin/fronius/fronius.node.js +++ /dev/null @@ -1,400 +0,0 @@ -"use strict"; -// SPDX-License-Identifier: GPL-3.0-or-later - -// This program will connect to one or more Fronius Symo Inverters. -// to get the Solar Power Generated (current, today). - -// example configuration in netdata/conf.d/node.d/fronius.conf.md - -require("url"); -require("http"); -var netdata = require("netdata"); - -netdata.debug("loaded " + __filename + " plugin"); - -var fronius = { - name: "Fronius", - enable_autodetect: false, - update_every: 5, - base_priority: 60000, - charts: {}, - - powerGridId: "p_grid", - powerPvId: "p_pv", - powerAccuId: "p_akku", // not my typo! Using the ID from the AP - consumptionLoadId: "p_load", - autonomyId: "rel_autonomy", - consumptionSelfId: "rel_selfconsumption", - solarConsumptionId: "solar_consumption", - energyTodayId: "e_day", - energyYearId: "e_year", - - createBasicDimension: function (id, name, divisor) { - return { - id: id, // the unique id of the dimension - name: name, // the name of the dimension - algorithm: netdata.chartAlgorithms.absolute,// the id of the netdata algorithm - multiplier: 1, // the multiplier - divisor: divisor, // the divisor - hidden: false // is hidden (boolean) - }; - }, - - // Gets the site power chart. Will be created if not existing. - getSitePowerChart: function (service, suffix) { - var id = this.getChartId(service, suffix); - var chart = fronius.charts[id]; - if (fronius.isDefined(chart)) return chart; - - var dim = {}; - dim[fronius.powerGridId] = this.createBasicDimension(fronius.powerGridId, "grid", 1); - dim[fronius.powerPvId] = this.createBasicDimension(fronius.powerPvId, "photovoltaics", 1); - dim[fronius.powerAccuId] = this.createBasicDimension(fronius.powerAccuId, "accumulator", 1); - - chart = { - id: id, // the unique id of the chart - name: "", // the unique name of the chart - title: service.name + " Current Site Power", // the title of the chart - units: "W", // the units of the chart dimensions - family: "power", // the family of the chart - context: "fronius.power", // the context of the chart - type: netdata.chartTypes.area, // the type of the chart - priority: fronius.base_priority + 1, // the priority relative to others in the same family - update_every: service.update_every, // the expected update frequency of the chart - dimensions: dim - }; - chart = service.chart(id, chart); - fronius.charts[id] = chart; - - return chart; - }, - - // Gets the site consumption chart. Will be created if not existing. - getSiteConsumptionChart: function (service, suffix) { - var id = this.getChartId(service, suffix); - var chart = fronius.charts[id]; - if (fronius.isDefined(chart)) return chart; - var dim = {}; - dim[fronius.consumptionLoadId] = this.createBasicDimension(fronius.consumptionLoadId, "load", 1); - - chart = { - id: id, // the unique id of the chart - name: "", // the unique name of the chart - title: service.name + " Current Load", // the title of the chart - units: "W", // the units of the chart dimensions - family: "consumption", // the family of the chart - context: "fronius.consumption", // the context of the chart - type: netdata.chartTypes.area, // the type of the chart - priority: fronius.base_priority + 2, // the priority relative to others in the same family - update_every: service.update_every, // the expected update frequency of the chart - dimensions: dim - }; - chart = service.chart(id, chart); - fronius.charts[id] = chart; - - return chart; - }, - - // Gets the site consumption chart. Will be created if not existing. - getSiteAutonomyChart: function (service, suffix) { - var id = this.getChartId(service, suffix); - var chart = fronius.charts[id]; - if (fronius.isDefined(chart)) return chart; - var dim = {}; - dim[fronius.autonomyId] = this.createBasicDimension(fronius.autonomyId, "autonomy", 1); - dim[fronius.consumptionSelfId] = this.createBasicDimension(fronius.consumptionSelfId, "self_consumption", 1); - dim[fronius.solarConsumptionId] = this.createBasicDimension(fronius.solarConsumptionId, "solar_consumption", 1); - - chart = { - id: id, // the unique id of the chart - name: "", // the unique name of the chart - title: service.name + " Current Autonomy", // the title of the chart - units: "%", // the units of the chart dimensions - family: "autonomy", // the family of the chart - context: "fronius.autonomy", // the context of the chart - type: netdata.chartTypes.area, // the type of the chart - priority: fronius.base_priority + 3, // the priority relative to others in the same family - update_every: service.update_every, // the expected update frequency of the chart - dimensions: dim - }; - chart = service.chart(id, chart); - fronius.charts[id] = chart; - - return chart; - }, - - // Gets the site energy chart for today. Will be created if not existing. - getSiteEnergyTodayChart: function (service, suffix) { - var chartId = this.getChartId(service, suffix); - var chart = fronius.charts[chartId]; - if (fronius.isDefined(chart)) return chart; - var dim = {}; - dim[fronius.energyTodayId] = this.createBasicDimension(fronius.energyTodayId, "today", 1000); - chart = { - id: chartId, // the unique id of the chart - name: "", // the unique name of the chart - title: service.name + " Energy production for today",// the title of the chart - units: "kWh", // the units of the chart dimensions - family: "energy", // the family of the chart - context: "fronius.energy.today", // the context of the chart - type: netdata.chartTypes.area, // the type of the chart - priority: fronius.base_priority + 4, // the priority relative to others in the same family - update_every: service.update_every, // the expected update frequency of the chart - dimensions: dim - }; - chart = service.chart(chartId, chart); - fronius.charts[chartId] = chart; - - return chart; - }, - - // Gets the site energy chart for today. Will be created if not existing. - getSiteEnergyYearChart: function (service, suffix) { - var chartId = this.getChartId(service, suffix); - var chart = fronius.charts[chartId]; - if (fronius.isDefined(chart)) return chart; - var dim = {}; - dim[fronius.energyYearId] = this.createBasicDimension(fronius.energyYearId, "year", 1000); - chart = { - id: chartId, // the unique id of the chart - name: "", // the unique name of the chart - title: service.name + " Energy production for this year",// the title of the chart - units: "kWh", // the units of the chart dimensions - family: "energy", // the family of the chart - context: "fronius.energy.year", // the context of the chart - type: netdata.chartTypes.area, // the type of the chart - priority: fronius.base_priority + 5, // the priority relative to others in the same family - update_every: service.update_every, // the expected update frequency of the chart - dimensions: dim - }; - chart = service.chart(chartId, chart); - fronius.charts[chartId] = chart; - - return chart; - }, - - // Gets the inverter power chart. Will be created if not existing. - // Needs the array of inverters in order to create a chart with all inverters as dimensions - getInverterPowerChart: function (service, suffix, inverters) { - var chartId = this.getChartId(service, suffix); - var chart = fronius.charts[chartId]; - if (fronius.isDefined(chart)) return chart; - - var dim = {}; - for (var key in inverters) { - if (inverters.hasOwnProperty(key)) { - var name = key; - if (!isNaN(key)) name = "inverter_" + key; - dim[key] = this.createBasicDimension("inverter_" + key, name, 1); - } - } - - chart = { - id: chartId, // the unique id of the chart - name: "", // the unique name of the chart - title: service.name + " Current Inverter Output",// the title of the chart - units: "W", // the units of the chart dimensions - family: "inverters", // the family of the chart - context: "fronius.inverter.output", // the context of the chart - type: netdata.chartTypes.stacked, // the type of the chart - priority: fronius.base_priority + 6, // the priority relative to others in the same family - update_every: service.update_every, // the expected update frequency of the chart - dimensions: dim - }; - chart = service.chart(chartId, chart); - fronius.charts[chartId] = chart; - - return chart; - }, - - processResponse: function (service, content) { - var json = fronius.convertToJson(content); - if (json === null) return; - - // add the service - service.commit(); - - var chartDefinitions = fronius.parseCharts(service, json); - var chartCount = chartDefinitions.length; - while (chartCount--) { - var chartObj = chartDefinitions[chartCount]; - service.begin(chartObj.chart); - var dimCount = chartObj.dimensions.length; - while (dimCount--) { - var dim = chartObj.dimensions[dimCount]; - service.set(dim.name, dim.value); - } - service.end(); - } - }, - - parseCharts: function (service, json) { - var site = json.Body.Data.Site; - return [ - this.parsePowerChart(service, site), - this.parseConsumptionChart(service, site), - this.parseAutonomyChart(service, site), - this.parseEnergyTodayChart(service, site), - this.parseEnergyYearChart(service, site), - this.parseInverterChart(service, json.Body.Data.Inverters) - ]; - }, - - parsePowerChart: function (service, site) { - return this.getChart(this.getSitePowerChart(service, "power"), - [ - this.getDimension(this.powerGridId, Math.round(site.P_Grid)), - this.getDimension(this.powerPvId, Math.round(Math.max(site.P_PV, 0))), - this.getDimension(this.powerAccuId, Math.round(site.P_Akku)) - ] - ); - }, - - parseConsumptionChart: function (service, site) { - return this.getChart(this.getSiteConsumptionChart(service, "consumption"), - [this.getDimension(this.consumptionLoadId, Math.round(Math.abs(site.P_Load)))] - ); - }, - - parseAutonomyChart: function (service, site) { - var selfConsumption = site.rel_SelfConsumption; - var solarConsumption = 0; - var load = Math.abs(site.P_Load); - var power = Math.max(site.P_PV, 0); - if (power <= 0) solarConsumption = 0; - else if (load >= power) solarConsumption = 100; - else solarConsumption = 100 / power * load; - return this.getChart(this.getSiteAutonomyChart(service, "autonomy"), - [ - this.getDimension(this.autonomyId, Math.round(site.rel_Autonomy)), - this.getDimension(this.consumptionSelfId, Math.round(selfConsumption === null ? 100 : selfConsumption)), - this.getDimension(this.solarConsumptionId, Math.round(solarConsumption)) - ] - ); - }, - - parseEnergyTodayChart: function (service, site) { - return this.getChart(this.getSiteEnergyTodayChart(service, "energy.today"), - [this.getDimension(this.energyTodayId, Math.round(Math.max(site.E_Day, 0)))] - ); - }, - - parseEnergyYearChart: function (service, site) { - return this.getChart(this.getSiteEnergyYearChart(service, "energy.year"), - [this.getDimension(this.energyYearId, Math.round(Math.max(site.E_Year, 0)))] - ); - }, - - parseInverterChart: function (service, inverters) { - var dimensions = []; - for (var key in inverters) { - if (inverters.hasOwnProperty(key)) { - dimensions.push(this.getDimension(key, Math.round(inverters[key].P))); - } - } - return this.getChart(this.getInverterPowerChart(service, "inverters.output", inverters), dimensions); - }, - - getDimension: function (name, value) { - return { - name: name, - value: value - }; - }, - - getChart: function (chart, dimensions) { - return { - chart: chart, - dimensions: dimensions - }; - }, - - getChartId: function (service, suffix) { - return "fronius_" + service.name + "." + suffix; - }, - - convertToJson: function (httpBody) { - if (httpBody === null) return null; - var json = httpBody; - // can't parse if it's already a json object, - // the check enables easier testing if the httpBody is already valid JSON. - if (typeof httpBody !== "object") { - try { - json = JSON.parse(httpBody); - } catch (error) { - netdata.error("fronius: Got a response, but it is not valid JSON. Ignoring. Error: " + error.message); - return null; - } - } - return this.isResponseValid(json) ? json : null; - }, - - // some basic validation - isResponseValid: function (json) { - if (this.isUndefined(json.Body)) return false; - if (this.isUndefined(json.Body.Data)) return false; - if (this.isUndefined(json.Body.Data.Site)) return false; - return this.isDefined(json.Body.Data.Inverters); - }, - - // module.serviceExecute() - // this function is called only from this module - // its purpose is to prepare the request and call - // netdata.serviceExecute() - serviceExecute: function (name, uri, update_every) { - netdata.debug(this.name + ": " + name + ": url: " + uri + ", update_every: " + update_every); - - var service = netdata.service({ - name: name, - request: netdata.requestFromURL("http://" + uri), - update_every: update_every, - module: this - }); - service.execute(this.processResponse); - }, - - - configure: function (config) { - if (fronius.isUndefined(config.servers)) return 0; - var added = 0; - var len = config.servers.length; - while (len--) { - var server = config.servers[len]; - if (fronius.isUndefined(server.update_every)) server.update_every = this.update_every; - if (fronius.areUndefined([server.name, server.hostname, server.api_path])) continue; - - var url = server.hostname + server.api_path; - this.serviceExecute(server.name, url, server.update_every); - added++; - } - return added; - }, - - // module.update() - // this is called repeatedly to collect data, by calling - // netdata.serviceExecute() - update: function (service, callback) { - service.execute(function (serv, data) { - service.module.processResponse(serv, data); - callback(); - }); - }, - - isUndefined: function (value) { - return typeof value === "undefined"; - }, - - areUndefined: function (valueArray) { - var i = 0; - for (i; i < valueArray.length; i++) { - if (this.isUndefined(valueArray[i])) return true; - } - return false; - }, - - isDefined: function (value) { - return typeof value !== "undefined"; - } -}; - -module.exports = fronius; diff --git a/collectors/node.d.plugin/named/Makefile.inc b/collectors/node.d.plugin/named/Makefile.inc deleted file mode 100644 index 95f423012..000000000 --- a/collectors/node.d.plugin/named/Makefile.inc +++ /dev/null @@ -1,13 +0,0 @@ -# SPDX-License-Identifier: GPL-3.0-or-later - -# THIS IS NOT A COMPLETE Makefile -# IT IS INCLUDED BY ITS PARENT'S Makefile.am -# IT IS REQUIRED TO REFERENCE ALL FILES RELATIVE TO THE PARENT - -# install these files -dist_node_DATA += named/named.node.js -# dist_nodeconfig_DATA += named/named.conf - -# do not install these files, but include them in the distribution -dist_noinst_DATA += named/README.md named/Makefile.inc - diff --git a/collectors/node.d.plugin/named/README.md b/collectors/node.d.plugin/named/README.md deleted file mode 100644 index acd03f687..000000000 --- a/collectors/node.d.plugin/named/README.md +++ /dev/null @@ -1,348 +0,0 @@ -<!-- -title: "ISC BIND monitoring with Netdata" -custom_edit_url: https://github.com/netdata/netdata/edit/master/collectors/node.d.plugin/named/README.md -sidebar_label: "ISC BIND" ---> - -# ISC BIND monitoring with Netdata - -Monitor one or more ISC Bind servers. - -## Example Netdata charts - -Depending on the number of views your bind has, you may get a large number of charts. -Here this is with just one view: - - - - -## How it works - -The plugin will execute (from within node.js) the equivalent of: - -```sh -curl "http://localhost:8888/json/v1/server" -``` - -Here is a sample of the output this command produces. - -```js -{ - "json-stats-version":"1.0", - "boot-time":"2016-01-31T08:20:48Z", - "config-time":"2016-01-31T09:28:03Z", - "current-time":"2016-02-02T22:22:20Z", - "opcodes":{ - "QUERY":247816, - "IQUERY":0, - "STATUS":0, - "RESERVED3":0, - "NOTIFY":0, - "UPDATE":3813, - "RESERVED6":0, - "RESERVED7":0, - "RESERVED8":0, - "RESERVED9":0, - "RESERVED10":0, - "RESERVED11":0, - "RESERVED12":0, - "RESERVED13":0, - "RESERVED14":0, - "RESERVED15":0 - }, - "qtypes":{ - "A":89519, - "NS":863, - "CNAME":1, - "SOA":1, - "PTR":116779, - "MX":276, - "TXT":198, - "AAAA":39324, - "SRV":850, - "ANY":5 - }, - "nsstats":{ - "Requestv4":251630, - "ReqEdns0":1255, - "ReqTSIG":3813, - "ReqTCP":57, - "AuthQryRej":1455, - "RecQryRej":122, - "Response":245918, - "TruncatedResp":44, - "RespEDNS0":1255, - "RespTSIG":3813, - "QrySuccess":205159, - "QryAuthAns":119495, - "QryNoauthAns":120770, - "QryNxrrset":32711, - "QrySERVFAIL":262, - "QryNXDOMAIN":2395, - "QryRecursion":40885, - "QryDuplicate":5712, - "QryFailure":1577, - "UpdateDone":2514, - "UpdateFail":1299, - "UpdateBadPrereq":1276, - "QryUDP":246194, - "QryTCP":45, - "OtherOpt":101 - }, - "views":{ - "local":{ - "resolver":{ - "stats":{ - "Queryv4":74577, - "Responsev4":67032, - "NXDOMAIN":601, - "SERVFAIL":5, - "FORMERR":7, - "EDNS0Fail":7, - "Truncated":3071, - "Lame":4, - "Retry":11826, - "QueryTimeout":1838, - "GlueFetchv4":6864, - "GlueFetchv4Fail":30, - "QryRTT10":112, - "QryRTT100":42900, - "QryRTT500":23275, - "QryRTT800":534, - "QryRTT1600":97, - "QryRTT1600+":20, - "BucketSize":31, - "REFUSED":13 - }, - "qtypes":{ - "A":64931, - "NS":870, - "CNAME":185, - "PTR":5, - "MX":49, - "TXT":149, - "AAAA":7972, - "SRV":416 - }, - "cache":{ - "A":40356, - "NS":8032, - "CNAME":14477, - "PTR":2, - "MX":21, - "TXT":32, - "AAAA":3301, - "SRV":94, - "DS":237, - "RRSIG":2301, - "NSEC":126, - "!A":52, - "!NS":4, - "!TXT":1, - "!AAAA":3797, - "!SRV":9, - "NXDOMAIN":590 - }, - "cachestats":{ - "CacheHits":1085188, - "CacheMisses":109, - "QueryHits":464755, - "QueryMisses":55624, - "DeleteLRU":0, - "DeleteTTL":42615, - "CacheNodes":5188, - "CacheBuckets":2079, - "TreeMemTotal":2326026, - "TreeMemInUse":1508075, - "HeapMemMax":132096, - "HeapMemTotal":393216, - "HeapMemInUse":132096 - }, - "adb":{ - "nentries":1021, - "entriescnt":3157, - "nnames":1021, - "namescnt":3022 - } - } - }, - "public":{ - "resolver":{ - "stats":{ - "BucketSize":31 - }, - "qtypes":{ - }, - "cache":{ - }, - "cachestats":{ - "CacheHits":0, - "CacheMisses":0, - "QueryHits":0, - "QueryMisses":0, - "DeleteLRU":0, - "DeleteTTL":0, - "CacheNodes":0, - "CacheBuckets":64, - "TreeMemTotal":287392, - "TreeMemInUse":29608, - "HeapMemMax":1024, - "HeapMemTotal":262144, - "HeapMemInUse":1024 - }, - "adb":{ - "nentries":1021, - "nnames":1021 - } - } - }, - "_bind":{ - "resolver":{ - "stats":{ - "BucketSize":31 - }, - "qtypes":{ - }, - "cache":{ - }, - "cachestats":{ - "CacheHits":0, - "CacheMisses":0, - "QueryHits":0, - "QueryMisses":0, - "DeleteLRU":0, - "DeleteTTL":0, - "CacheNodes":0, - "CacheBuckets":64, - "TreeMemTotal":287392, - "TreeMemInUse":29608, - "HeapMemMax":1024, - "HeapMemTotal":262144, - "HeapMemInUse":1024 - }, - "adb":{ - "nentries":1021, - "nnames":1021 - } - } - } - } -} -``` - -From this output it collects: - -- Global Received Requests by IP version (IPv4, IPv6) -- Global Successful Queries -- Current Recursive Clients -- Global Queries by IP Protocol (TCP, UDP) -- Global Queries Analysis -- Global Received Updates -- Global Query Failures -- Global Query Failures Analysis -- Other Global Server Statistics -- Global Incoming Requests by OpCode -- Global Incoming Requests by Query Type -- Global Socket Statistics (will only work if the url is `http://127.0.0.1:8888/json/v1`, i.e. without `/server`, but keep in mind this produces a very long output and probably will account for 0.5% CPU overhead alone, per bind server added) -- Per View Statistics (the following set will be added for each bind view): - - View, Resolver Active Queries - - View, Resolver Statistics - - View, Resolver Round Trip Timings - - View, Requests by Query Type - -## Configuration - -The collector (optionally) reads a configuration file named `/etc/netdata/node.d/named.conf`, with the following contents: - -```js -{ - "enable_autodetect": true, - "update_every": 5, - "servers": [ - { - "name": "bind1", - "url": "http://127.0.0.1:8888/json/v1/server", - "update_every": 1 - }, - { - "name": "bind2", - "url": "http://10.1.2.3:8888/json/v1/server", - "update_every": 2 - } - ] -} -``` - -You can add any number of bind servers. - -If the configuration file is missing, or the key `enable_autodetect` is `true`, the collector will also attempt to fetch `http://localhost:8888/json/v1/server` which, if successful will be added too. - -### XML instead of JSON, from bind - -The collector can also accept bind URLs that return XML output. This might required if you cannot have bind 9.10+ with JSON but you have an version of bind that supports XML statistics v3. Check [this](https://www.isc.org/blogs/bind-9-10-statistics-troubleshooting-and-zone-configuration/) for versions supported. - -In such cases, use a URL like this: - -```sh -curl "http://localhost:8888/xml/v3/server" -``` - -Only `xml` and `v3` has been tested. - -Keep in mind though, that XML parsing is done using javascript code, which requires a triple conversion: - -1. from XML to JSON using a javascript XML parser (**CPU intensive**), -2. which is then transformed to emulate the output of the JSON output of bind (**CPU intensive** - and yes the converted JSON from XML is different to the native JSON - even bind produces different names for various attributes), -3. which is then processed to generate the data for the charts (this will happen even if bind is producing JSON). - -In general, expect XML parsing to be 2 to 3 times more CPU intensive than JSON. - -**So, if you can use the JSON output of bind, prefer it over XML**. Keep also in mind that even bind will use more CPU when generating XML instead of JSON. - -The XML interface of bind is not autodetected. -You will have to provide the config file `/etc/netdata/node.d/named.conf`, like this: - -```js -{ - "enable_autodetect": false, - "update_every": 1, - "servers": [ - { - "name": "local", - "url": "http://localhost:8888/xml/v3/server", - "update_every": 1 - } - ] -} -``` - -Of course, you can monitor more than one bind servers. Each one can be configured with either JSON or XML output. - -## Auto-detection - -Auto-detection is controlled by `enable_autodetect` in the config file. The default is enabled, so that if the collector can connect to `http://localhost:8888/json/v1/server` to receive bind statistics, it will automatically enable it. - -## Bind (named) configuration - -To use this plugin, you have to have bind v9.10+ properly compiled to provide statistics in `JSON` format. - -For more information on how to get your bind installation ready, please refer to the [bind statistics channel developer comments](http://jpmens.net/2013/03/18/json-in-bind-9-s-statistics-server/) and to [bind documentation](https://ftp.isc.org/isc/bind/9.10.3/doc/arm/Bv9ARM.ch06.html#statistics) or [bind Knowledge Base article AA-01123](https://kb.isc.org/article/AA-01123/0). - -Normally, you will need something like this in your `named.conf`: - -``` -statistics-channels { - inet 127.0.0.1 port 8888 allow { 127.0.0.1; }; - inet ::1 port 8888 allow { ::1; }; -}; -``` - -(use the IPv4 or IPv6 line depending on what you are using, you can also use both) - -Verify it works by running the following command (the collector is written in node.js and will query your bind server directly, but if this command works, the collector should be able to work too): - -```sh -curl "http://localhost:8888/json/v1/server" -``` - -[](<>) diff --git a/collectors/node.d.plugin/named/named.node.js b/collectors/node.d.plugin/named/named.node.js deleted file mode 100644 index 668a044c7..000000000 --- a/collectors/node.d.plugin/named/named.node.js +++ /dev/null @@ -1,610 +0,0 @@ -'use strict'; -// SPDX-License-Identifier: GPL-3.0-or-later - -// collect statistics from bind (named) v9.10+ -// -// bind statistics documentation at: -// http://jpmens.net/2013/03/18/json-in-bind-9-s-statistics-server/ -// https://ftp.isc.org/isc/bind/9.10.3/doc/arm/Bv9ARM.ch06.html#statistics - -// example configuration in /etc/netdata/node.d/named.conf -// the module supports auto-detection if bind is running at localhost - -/* -{ - "enable_autodetect": true, - "update_every": 5, - "servers": [ - { - "name": "bind1", - "url": "http://127.0.0.1:8888/json/v1/server", - "update_every": 1 - }, - { - "name": "bind2", - "url": "http://10.0.0.1:8888/xml/v3/server", - "update_every": 2 - } - ] -} -*/ - -// the following is the bind named.conf configuration required - -/* -statistics-channels { - inet 127.0.0.1 port 8888 allow { 127.0.0.1; }; -}; -*/ - -require('url'); -require('http'); -var XML = require('pixl-xml'); -var netdata = require('netdata'); - -if(netdata.options.DEBUG === true) netdata.debug('loaded', __filename, 'plugin'); - -var named = { - name: __filename, - enable_autodetect: true, - update_every: 1, - base_priority: 60000, - charts: {}, - - chartFromMembersCreate: function(service, obj, id, title_suffix, units, family, context, type, priority, algorithm, multiplier, divisor) { - var chart = { - id: id, // the unique id of the chart - name: '', // the unique name of the chart - title: service.name + ' ' + title_suffix, // the title of the chart - units: units, // the units of the chart dimensions - family: family, // the family of the chart - context: context, // the context of the chart - type: type, // the type of the chart - priority: priority, // the priority relative to others in the same family - update_every: service.update_every, // the expected update frequency of the chart - dimensions: {} - }; - - var found = 0; - var dims = Object.keys(obj); - var len = dims.length; - for(var i = 0; i < len ;i++) { - var x = dims[i]; - - if(typeof(obj[x]) !== 'undefined' && obj[x] !== 0) { - found++; - chart.dimensions[x] = { - id: x, // the unique id of the dimension - name: x, // the name of the dimension - algorithm: algorithm, // the id of the netdata algorithm - multiplier: multiplier, // the multiplier - divisor: divisor, // the divisor - hidden: false // is hidden (boolean) - }; - } - } - - if(!found) - return null; - - chart = service.chart(id, chart); - this.charts[id] = chart; - return chart; - }, - - chartFromMembers: function(service, obj, id_suffix, title_suffix, units, family, context, type, priority, algorithm, multiplier, divisor) { - var id = 'named_' + service.name + '.' + id_suffix; - var chart = this.charts[id]; - var dims, len, x, i; - - if(typeof chart === 'undefined') { - chart = this.chartFromMembersCreate(service, obj, id, title_suffix, units, family, context, type, priority, algorithm, multiplier, divisor); - if(chart === null) return false; - } - else { - // check if we need to re-generate the chart - dims = Object.keys(obj); - len = dims.length; - for(i = 0; i < len ;i++) { - x = dims[i]; - if(typeof(chart.dimensions[x]) === 'undefined') { - chart = this.chartFromMembersCreate(service, obj, id, title_suffix, units, family, context, type, priority, algorithm, multiplier, divisor); - if(chart === null) return false; - break; - } - } - } - - service.begin(chart); - - var found = 0; - dims = Object.keys(obj); - len = dims.length; - for(i = 0; i < len ;i++) { - x = dims[i]; - if(typeof(chart.dimensions[x]) !== 'undefined') { - found++; - service.set(x, obj[x]); - } - } - - service.end(); - - return (found > 0); - }, - - // an index to map values to different charts - lookups: { - nsstats: {}, - resolver_stats: {}, - numfetch: {} - }, - - // transform the XML response of bind - // to the JSON response of bind - xml2js: function(service, data_xml) { - var d = XML.parse(data_xml); - if(d === null) return null; - - var a, aa, alen, alen2; - - var data = {}; - var len = d.server.counters.length; - while(len--) { - a = d.server.counters[len]; - if(typeof a.counter === 'undefined') continue; - if(a.type === 'opcode') a.type = 'opcodes'; - else if(a.type === 'qtype') a.type = 'qtypes'; - else if(a.type === 'nsstat') a.type = 'nsstats'; - aa = data[a.type] = {}; - alen = 0; - alen2 = a.counter.length; - while(alen < alen2) { - aa[a.counter[alen].name] = parseInt(a.counter[alen]._Data, 10); - alen++; - } - } - - data.views = {}; - var vlen = d.views.view.length; - while(vlen--) { - var vname = d.views.view[vlen].name; - data.views[vname] = { resolver: {} }; - len = d.views.view[vlen].counters.length; - while(len--) { - a = d.views.view[vlen].counters[len]; - if(typeof a.counter === 'undefined') continue; - if(a.type === 'resstats') a.type = 'stats'; - else if(a.type === 'resqtype') a.type = 'qtypes'; - else if(a.type === 'adbstat') a.type = 'adb'; - aa = data.views[vname].resolver[a.type] = {}; - alen = 0; - alen2 = a.counter.length; - while(alen < alen2) { - aa[a.counter[alen].name] = parseInt(a.counter[alen]._Data, 10); - alen++; - } - } - } - - return data; - }, - - processResponse: function(service, data) { - if(data !== null) { - var r, x, look, id, chart, keys, len; - - // parse XML or JSON - // pepending on the URL given - if(service.request.path.match(/^\/xml/) !== null) - r = named.xml2js(service, data); - else - r = JSON.parse(data); - - if(typeof r === 'undefined' || r === null) { - service.error("Cannot parse these data: " + data.toString()); - return; - } - - if(service.added !== true) - service.commit(); - - if(typeof r.nsstats !== 'undefined') { - // we split the nsstats object to several others - var global_requests = {}, global_requests_enable = false; - var global_failures = {}, global_failures_enable = false; - var global_failures_detail = {}, global_failures_detail_enable = false; - var global_updates = {}, global_updates_enable = false; - var protocol_queries = {}, protocol_queries_enable = false; - var global_queries = {}, global_queries_enable = false; - var global_queries_success = {}, global_queries_success_enable = false; - var default_enable = false; - var RecursClients = 0; - - // RecursClients is an absolute value - if(typeof r.nsstats['RecursClients'] !== 'undefined') { - RecursClients = r.nsstats['RecursClients']; - delete r.nsstats['RecursClients']; - } - - keys = Object.keys(r.nsstats); - len = keys.length; - while(len--) { - x = keys[len]; - - // we maintain an index of the values found - // mapping them to objects split - - look = named.lookups.nsstats[x]; - if(typeof look === 'undefined') { - // a new value, not found in the index - // index it: - if(x === 'Requestv4') { - named.lookups.nsstats[x] = { - name: 'IPv4', - type: 'global_requests' - }; - } - else if(x === 'Requestv6') { - named.lookups.nsstats[x] = { - name: 'IPv6', - type: 'global_requests' - }; - } - else if(x === 'QryFailure') { - named.lookups.nsstats[x] = { - name: 'failures', - type: 'global_failures' - }; - } - else if(x === 'QryUDP') { - named.lookups.nsstats[x] = { - name: 'UDP', - type: 'protocol_queries' - }; - } - else if(x === 'QryTCP') { - named.lookups.nsstats[x] = { - name: 'TCP', - type: 'protocol_queries' - }; - } - else if(x === 'QrySuccess') { - named.lookups.nsstats[x] = { - name: 'queries', - type: 'global_queries_success' - }; - } - else if(x.match(/QryRej$/) !== null) { - named.lookups.nsstats[x] = { - name: x, - type: 'global_failures_detail' - }; - } - else if(x.match(/^Qry/) !== null) { - named.lookups.nsstats[x] = { - name: x, - type: 'global_queries' - }; - } - else if(x.match(/^Update/) !== null) { - named.lookups.nsstats[x] = { - name: x, - type: 'global_updates' - }; - } - else { - // values not mapped, will remain - // in the default map - named.lookups.nsstats[x] = { - name: x, - type: 'default' - }; - } - - look = named.lookups.nsstats[x]; - // netdata.error('lookup nsstats value: ' + x + ' >>> ' + named.lookups.nsstats[x].type); - } - - switch(look.type) { - case 'global_requests': global_requests[look.name] = r.nsstats[x]; delete r.nsstats[x]; global_requests_enable = true; break; - case 'global_queries': global_queries[look.name] = r.nsstats[x]; delete r.nsstats[x]; global_queries_enable = true; break; - case 'global_queries_success': global_queries_success[look.name] = r.nsstats[x]; delete r.nsstats[x]; global_queries_success_enable = true; break; - case 'global_updates': global_updates[look.name] = r.nsstats[x]; delete r.nsstats[x]; global_updates_enable = true; break; - case 'protocol_queries': protocol_queries[look.name] = r.nsstats[x]; delete r.nsstats[x]; protocol_queries_enable = true; break; - case 'global_failures': global_failures[look.name] = r.nsstats[x]; delete r.nsstats[x]; global_failures_enable = true; break; - case 'global_failures_detail': global_failures_detail[look.name] = r.nsstats[x]; delete r.nsstats[x]; global_failures_detail_enable = true; break; - default: default_enable = true; break; - } - } - - if(global_requests_enable === true) - service.module.chartFromMembers(service, global_requests, 'received_requests', 'Bind, Global Received Requests by IP version', 'requests/s', 'requests', 'named.requests', netdata.chartTypes.stacked, named.base_priority + 1, netdata.chartAlgorithms.incremental, 1, 1); - - if(global_queries_success_enable === true) - service.module.chartFromMembers(service, global_queries_success, 'global_queries_success', 'Bind, Global Successful Queries', 'queries/s', 'queries', 'named.queries_success', netdata.chartTypes.line, named.base_priority + 2, netdata.chartAlgorithms.incremental, 1, 1); - - if(protocol_queries_enable === true) - service.module.chartFromMembers(service, protocol_queries, 'protocols_queries', 'Bind, Global Queries by IP Protocol', 'queries/s', 'queries', 'named.protocol_queries', netdata.chartTypes.stacked, named.base_priority + 3, netdata.chartAlgorithms.incremental, 1, 1); - - if(global_queries_enable === true) - service.module.chartFromMembers(service, global_queries, 'global_queries', 'Bind, Global Queries Analysis', 'queries/s', 'queries', 'named.global_queries', netdata.chartTypes.stacked, named.base_priority + 4, netdata.chartAlgorithms.incremental, 1, 1); - - if(global_updates_enable === true) - service.module.chartFromMembers(service, global_updates, 'received_updates', 'Bind, Global Received Updates', 'updates/s', 'updates', 'named.global_updates', netdata.chartTypes.stacked, named.base_priority + 5, netdata.chartAlgorithms.incremental, 1, 1); - - if(global_failures_enable === true) - service.module.chartFromMembers(service, global_failures, 'query_failures', 'Bind, Global Query Failures', 'failures/s', 'failures', 'named.global_failures', netdata.chartTypes.line, named.base_priority + 6, netdata.chartAlgorithms.incremental, 1, 1); - - if(global_failures_detail_enable === true) - service.module.chartFromMembers(service, global_failures_detail, 'query_failures_detail', 'Bind, Global Query Failures Analysis', 'failures/s', 'failures', 'named.global_failures_detail', netdata.chartTypes.stacked, named.base_priority + 7, netdata.chartAlgorithms.incremental, 1, 1); - - if(default_enable === true) - service.module.chartFromMembers(service, r.nsstats, 'nsstats', 'Bind, Other Global Server Statistics', 'operations/s', 'other', 'named.nsstats', netdata.chartTypes.line, named.base_priority + 8, netdata.chartAlgorithms.incremental, 1, 1); - - // RecursClients chart - id = 'named_' + service.name + '.recursive_clients'; - chart = named.charts[id]; - - if(typeof chart === 'undefined') { - chart = { - id: id, // the unique id of the chart - name: '', // the unique name of the chart - title: service.name + ' Bind, Current Recursive Clients', // the title of the chart - units: 'clients', // the units of the chart dimensions - family: 'clients', // the family of the chart - context: 'named.recursive_clients', // the context of the chart - type: netdata.chartTypes.line, // the type of the chart - priority: named.base_priority + 1, // the priority relative to others in the same family - update_every: service.update_every, // the expected update frequency of the chart - dimensions: { - 'clients': { - id: 'clients', // the unique id of the dimension - name: '', // the name of the dimension - algorithm: netdata.chartAlgorithms.absolute,// the id of the netdata algorithm - multiplier: 1, // the multiplier - divisor: 1, // the divisor - hidden: false // is hidden (boolean) - } - } - }; - - chart = service.chart(id, chart); - named.charts[id] = chart; - } - - service.begin(chart); - service.set('clients', RecursClients); - service.end(); - } - - if(typeof r.opcodes !== 'undefined') - service.module.chartFromMembers(service, r.opcodes, 'in_opcodes', 'Bind, Global Incoming Requests by OpCode', 'requests/s', 'requests', 'named.in_opcodes', netdata.chartTypes.stacked, named.base_priority + 9, netdata.chartAlgorithms.incremental, 1, 1); - - if(typeof r.qtypes !== 'undefined') - service.module.chartFromMembers(service, r.qtypes, 'in_qtypes', 'Bind, Global Incoming Requests by Query Type', 'requests/s', 'requests', 'named.in_qtypes', netdata.chartTypes.stacked, named.base_priority + 10, netdata.chartAlgorithms.incremental, 1, 1); - - if(typeof r.sockstats !== 'undefined') - service.module.chartFromMembers(service, r.sockstats, 'in_sockstats', 'Bind, Global Socket Statistics', 'operations/s', 'sockets', 'named.in_sockstats', netdata.chartTypes.line, named.base_priority + 11, netdata.chartAlgorithms.incremental, 1, 1); - - if(typeof r.views !== 'undefined') { - keys = Object.keys(r.views); - len = keys.length; - while(len--) { - x = keys[len]; - var resolver = r.views[x].resolver; - - if(typeof resolver !== 'undefined') { - if(typeof resolver.stats !== 'undefined') { - var NumFetch = 0; - var key = service.name + '.' + x; - var rtt = {}, rtt_enable = false; - default_enable = false; - - // NumFetch is an absolute value - if(typeof resolver.stats['NumFetch'] !== 'undefined') { - named.lookups.numfetch[key] = true; - NumFetch = resolver.stats['NumFetch']; - delete resolver.stats['NumFetch']; - } - if(typeof resolver.stats['BucketSize'] !== 'undefined') { - delete resolver.stats['BucketSize']; - } - - // split the QryRTT* from the main chart - var ykeys = Object.keys(resolver.stats); - var ylen = ykeys.length; - while(ylen--) { - var y = ykeys[ylen]; - - // we maintain an index of the values found - // mapping them to objects split - - look = named.lookups.resolver_stats[y]; - if(typeof look === 'undefined') { - if(y.match(/^QryRTT/) !== null) { - named.lookups.resolver_stats[y] = { - name: y, - type: 'rtt' - }; - } - else { - named.lookups.resolver_stats[y] = { - name: y, - type: 'default' - }; - } - - look = named.lookups.resolver_stats[y]; - // netdata.error('lookup resolver stats value: ' + y + ' >>> ' + look.type); - } - - switch(look.type) { - case 'rtt': rtt[look.name] = resolver.stats[y]; delete resolver.stats[y]; rtt_enable = true; break; - default: default_enable = true; break; - } - } - - if(rtt_enable) - service.module.chartFromMembers(service, rtt, 'view_resolver_rtt_' + x, 'Bind, ' + x + ' View, Resolver Round Trip Timings', 'queries/s', 'view_' + x, 'named.resolver_rtt', netdata.chartTypes.stacked, named.base_priority + 12, netdata.chartAlgorithms.incremental, 1, 1); - - if(default_enable) - service.module.chartFromMembers(service, resolver.stats, 'view_resolver_stats_' + x, 'Bind, ' + x + ' View, Resolver Statistics', 'operations/s', 'view_' + x, 'named.resolver_stats', netdata.chartTypes.line, named.base_priority + 13, netdata.chartAlgorithms.incremental, 1, 1); - - // NumFetch chart - if(typeof named.lookups.numfetch[key] !== 'undefined') { - id = 'named_' + service.name + '.view_resolver_numfetch_' + x; - chart = named.charts[id]; - - if(typeof chart === 'undefined') { - chart = { - id: id, // the unique id of the chart - name: '', // the unique name of the chart - title: service.name + ' Bind, ' + x + ' View, Resolver Active Queries', // the title of the chart - units: 'queries', // the units of the chart dimensions - family: 'view_' + x, // the family of the chart - context: 'named.resolver_active_queries', // the context of the chart - type: netdata.chartTypes.line, // the type of the chart - priority: named.base_priority + 1001, // the priority relative to others in the same family - update_every: service.update_every, // the expected update frequency of the chart - dimensions: { - 'queries': { - id: 'queries', // the unique id of the dimension - name: '', // the name of the dimension - algorithm: netdata.chartAlgorithms.absolute,// the id of the netdata algorithm - multiplier: 1, // the multiplier - divisor: 1, // the divisor - hidden: false // is hidden (boolean) - } - } - }; - - chart = service.chart(id, chart); - named.charts[id] = chart; - } - - service.begin(chart); - service.set('queries', NumFetch); - service.end(); - } - } - } - - if(typeof resolver.qtypes !== 'undefined') - service.module.chartFromMembers(service, resolver.qtypes, 'view_resolver_qtypes_' + x, 'Bind, ' + x + ' View, Requests by Query Type', 'requests/s', 'view_' + x, 'named.resolver_qtypes', netdata.chartTypes.stacked, named.base_priority + 14, netdata.chartAlgorithms.incremental, 1, 1); - - //if(typeof resolver.cache !== 'undefined') - // service.module.chartFromMembers(service, resolver.cache, 'view_resolver_cache_' + x, 'Bind, ' + x + ' View, Cache Entries', 'entries', 'view_' + x, 'named.resolver_cache', netdata.chartTypes.stacked, named.base_priority + 15, netdata.chartAlgorithms.absolute, 1, 1); - - if(typeof resolver.cachestats['CacheHits'] !== 'undefined' && resolver.cachestats['CacheHits'] > 0) { - id = 'named_' + service.name + '.view_resolver_cachehits_' + x; - chart = named.charts[id]; - - if(typeof chart === 'undefined') { - chart = { - id: id, // the unique id of the chart - name: '', // the unique name of the chart - title: service.name + ' Bind, ' + x + ' View, Resolver Cache Hits', // the title of the chart - units: 'operations/s', // the units of the chart dimensions - family: 'view_' + x, // the family of the chart - context: 'named.resolver_cache_hits', // the context of the chart - type: netdata.chartTypes.area, // the type of the chart - priority: named.base_priority + 1100, // the priority relative to others in the same family - update_every: service.update_every, // the expected update frequency of the chart - dimensions: { - 'CacheHits': { - id: 'CacheHits', // the unique id of the dimension - name: 'hits', // the name of the dimension - algorithm: netdata.chartAlgorithms.incremental,// the id of the netdata algorithm - multiplier: 1, // the multiplier - divisor: 1, // the divisor - hidden: false // is hidden (boolean) - }, - 'CacheMisses': { - id: 'CacheMisses', // the unique id of the dimension - name: 'misses', // the name of the dimension - algorithm: netdata.chartAlgorithms.incremental,// the id of the netdata algorithm - multiplier: -1, // the multiplier - divisor: 1, // the divisor - hidden: false // is hidden (boolean) - } - } - }; - - chart = service.chart(id, chart); - named.charts[id] = chart; - } - - service.begin(chart); - service.set('CacheHits', resolver.cachestats['CacheHits']); - service.set('CacheMisses', resolver.cachestats['CacheMisses']); - service.end(); - } - - // this is wrong, it contains many types of info: - // 1. CacheHits, CacheMisses - incremental (added above) - // 2. QueryHits, QueryMisses - incremental - // 3. DeleteLRU, DeleteTTL - incremental - // 4. CacheNodes, CacheBuckets - absolute - // 5. TreeMemTotal, TreeMemInUse - absolute - // 6. HeapMemMax, HeapMemTotal, HeapMemInUse - absolute - //if(typeof resolver.cachestats !== 'undefined') - // service.module.chartFromMembers(service, resolver.cachestats, 'view_resolver_cachestats_' + x, 'Bind, ' + x + ' View, Cache Statistics', 'requests/s', 'view_' + x, 'named.resolver_cache_stats', netdata.chartTypes.line, named.base_priority + 1001, netdata.chartAlgorithms.incremental, 1, 1); - - //if(typeof resolver.adb !== 'undefined') - // service.module.chartFromMembers(service, resolver.adb, 'view_resolver_adb_' + x, 'Bind, ' + x + ' View, ADB Statistics', 'entries', 'view_' + x, 'named.resolver_adb', netdata.chartTypes.line, named.base_priority + 1002, netdata.chartAlgorithms.absolute, 1, 1); - } - } - } - }, - - // module.serviceExecute() - // this function is called only from this module - // its purpose is to prepare the request and call - // netdata.serviceExecute() - serviceExecute: function(name, a_url, update_every) { - if(netdata.options.DEBUG === true) netdata.debug(this.name + ': ' + name + ': url: ' + a_url + ', update_every: ' + update_every); - var service = netdata.service({ - name: name, - request: netdata.requestFromURL(a_url), - update_every: update_every, - module: this - }); - - service.execute(this.processResponse); - }, - - configure: function(config) { - var added = 0; - - if(this.enable_autodetect === true) { - this.serviceExecute('local', 'http://localhost:8888/json/v1/server', this.update_every); - added++; - } - - if(typeof(config.servers) !== 'undefined') { - var len = config.servers.length; - while(len--) { - if(typeof config.servers[len].update_every === 'undefined') - config.servers[len].update_every = this.update_every; - - this.serviceExecute(config.servers[len].name, config.servers[len].url, config.servers[len].update_every); - added++; - } - } - - return added; - }, - - // module.update() - // this is called repeatedly to collect data, by calling - // netdata.serviceExecute() - update: function(service, callback) { - service.execute(function(serv, data) { - service.module.processResponse(serv, data); - callback(); - }); - } -}; - -module.exports = named; diff --git a/collectors/node.d.plugin/node.d.conf b/collectors/node.d.plugin/node.d.conf index 95aec99ce..c79274a5e 100644 --- a/collectors/node.d.plugin/node.d.conf +++ b/collectors/node.d.plugin/node.d.conf @@ -14,12 +14,6 @@ "___help_modules": "Enable/disable the following modules. Give only XXX for node.d/XXX.node.js",
"modules": {
- "named": {
- "enabled": true
- },
- "sma_webbox": {
- "enabled": true
- },
"snmp": {
"enabled": true
}
diff --git a/collectors/node.d.plugin/sma_webbox/Makefile.inc b/collectors/node.d.plugin/sma_webbox/Makefile.inc deleted file mode 100644 index 38f2fe97a..000000000 --- a/collectors/node.d.plugin/sma_webbox/Makefile.inc +++ /dev/null @@ -1,13 +0,0 @@ -# SPDX-License-Identifier: GPL-3.0-or-later - -# THIS IS NOT A COMPLETE Makefile -# IT IS INCLUDED BY ITS PARENT'S Makefile.am -# IT IS REQUIRED TO REFERENCE ALL FILES RELATIVE TO THE PARENT - -# install these files -dist_node_DATA += sma_webbox/sma_webbox.node.js -# dist_nodeconfig_DATA += sma_webbox/sma_webbox.conf - -# do not install these files, but include them in the distribution -dist_noinst_DATA += sma_webbox/README.md sma_webbox/Makefile.inc - diff --git a/collectors/node.d.plugin/sma_webbox/README.md b/collectors/node.d.plugin/sma_webbox/README.md deleted file mode 100644 index 99e093b70..000000000 --- a/collectors/node.d.plugin/sma_webbox/README.md +++ /dev/null @@ -1,33 +0,0 @@ -<!-- -title: "SMA Sunny WebBox monitoring with Netdata" -custom_edit_url: https://github.com/netdata/netdata/edit/master/collectors/node.d.plugin/sma_webbox/README.md -sidebar_label: "SMA Sunny WebBox" ---> - -# SMA Sunny WebBox monitoring with Netdata - -Monitoring for the [SMA Sunny -WebBox](https://www.sma-sunny.com/en/questions-and-answers-on-discontinuation-of-the-sunny-webbox/). - -The module supports any number of name servers: - -```json -{ - "enable_autodetect": false, - "update_every": 5, - "servers": [ - { - "name": "plant1", - "hostname": "10.0.1.1", - "update_every": 10 - }, - { - "name": "plant2", - "hostname": "10.0.2.1", - "update_every": 15 - } - ] -} -``` - -[](<>) diff --git a/collectors/node.d.plugin/sma_webbox/sma_webbox.node.js b/collectors/node.d.plugin/sma_webbox/sma_webbox.node.js deleted file mode 100644 index f32b65714..000000000 --- a/collectors/node.d.plugin/sma_webbox/sma_webbox.node.js +++ /dev/null @@ -1,239 +0,0 @@ -'use strict'; -// SPDX-License-Identifier: GPL-3.0-or-later - -// This program will connect to one or more SMA Sunny Webboxes -// to get the Solar Power Generated (current, today, total). - -// example configuration in /etc/netdata/node.d/sma_webbox.conf -/* -{ - "enable_autodetect": false, - "update_every": 5, - "servers": [ - { - "name": "plant1", - "hostname": "10.0.1.1", - "update_every": 10 - }, - { - "name": "plant2", - "hostname": "10.0.2.1", - "update_every": 15 - } - ] -} -*/ - -require('url'); -require('http'); -var netdata = require('netdata'); - -if(netdata.options.DEBUG === true) netdata.debug('loaded ' + __filename + ' plugin'); - -var webbox = { - name: __filename, - enable_autodetect: true, - update_every: 1, - base_priority: 60000, - charts: {}, - - processResponse: function(service, data) { - if(data !== null) { - var r = JSON.parse(data); - - var d = { - 'GriPwr': { - unit: null, - value: null - }, - 'GriEgyTdy': { - unit: null, - value: null - }, - 'GriEgyTot': { - unit: null, - value: null - } - }; - - // parse the webbox response - // and put it in our d object - var found = 0; - var len = r.result.overview.length; - while(len--) { - var e = r.result.overview[len]; - if(typeof(d[e.meta]) !== 'undefined') { - found++; - d[e.meta].value = e.value; - d[e.meta].unit = e.unit; - } - } - - // add the service - if(found > 0 && service.added !== true) - service.commit(); - - - // Grid Current Power Chart - if(d['GriPwr'].value !== null) { - const id = 'smawebbox_' + service.name + '.current'; - let chart = webbox.charts[id]; - - if(typeof chart === 'undefined') { - chart = { - id: id, // the unique id of the chart - name: '', // the unique name of the chart - title: service.name + ' Current Grid Power', // the title of the chart - units: d['GriPwr'].unit, // the units of the chart dimensions - family: 'now', // the family of the chart - context: 'smawebbox.grid_power', // the context of the chart - type: netdata.chartTypes.area, // the type of the chart - priority: webbox.base_priority + 1, // the priority relative to others in the same family - update_every: service.update_every, // the expected update frequency of the chart - dimensions: { - 'GriPwr': { - id: 'GriPwr', // the unique id of the dimension - name: 'power', // the name of the dimension - algorithm: netdata.chartAlgorithms.absolute,// the id of the netdata algorithm - multiplier: 1, // the multiplier - divisor: 1, // the divisor - hidden: false // is hidden (boolean) - } - } - }; - - chart = service.chart(id, chart); - webbox.charts[id] = chart; - } - - service.begin(chart); - service.set('GriPwr', Math.round(d['GriPwr'].value)); - service.end(); - } - - if(d['GriEgyTdy'].value !== null) { - const id = 'smawebbox_' + service.name + '.today'; - let chart = webbox.charts[id]; - - if(typeof chart === 'undefined') { - chart = { - id: id, // the unique id of the chart - name: '', // the unique name of the chart - title: service.name + ' Today Grid Power', // the title of the chart - units: d['GriEgyTdy'].unit, // the units of the chart dimensions - family: 'today', // the family of the chart - context: 'smawebbox.grid_power_today', // the context of the chart - type: netdata.chartTypes.area, // the type of the chart - priority: webbox.base_priority + 2, // the priority relative to others in the same family - update_every: service.update_every, // the expected update frequency of the chart - dimensions: { - 'GriEgyTdy': { - id: 'GriEgyTdy', // the unique id of the dimension - name: 'power', // the name of the dimension - algorithm: netdata.chartAlgorithms.absolute,// the id of the netdata algorithm - multiplier: 1, // the multiplier - divisor: 1000, // the divisor - hidden: false // is hidden (boolean) - } - } - }; - - chart = service.chart(id, chart); - webbox.charts[id] = chart; - } - - service.begin(chart); - service.set('GriEgyTdy', Math.round(d['GriEgyTdy'].value * 1000)); - service.end(); - } - - if(d['GriEgyTot'].value !== null) { - const id = 'smawebbox_' + service.name + '.total'; - let chart = webbox.charts[id]; - - if(typeof chart === 'undefined') { - chart = { - id: id, // the unique id of the chart - name: '', // the unique name of the chart - title: service.name + ' Total Grid Power', // the title of the chart - units: d['GriEgyTot'].unit, // the units of the chart dimensions - family: 'total', // the family of the chart - context: 'smawebbox.grid_power_total', // the context of the chart - type: netdata.chartTypes.area, // the type of the chart - priority: webbox.base_priority + 3, // the priority relative to others in the same family - update_every: service.update_every, // the expected update frequency of the chart - dimensions: { - 'GriEgyTot': { - id: 'GriEgyTot', // the unique id of the dimension - name: 'power', // the name of the dimension - algorithm: netdata.chartAlgorithms.absolute,// the id of the netdata algorithm - multiplier: 1, // the multiplier - divisor: 1000, // the divisor - hidden: false // is hidden (boolean) - } - } - }; - - chart = service.chart(id, chart); - webbox.charts[id] = chart; - } - - service.begin(chart); - service.set('GriEgyTot', Math.round(d['GriEgyTot'].value * 1000)); - service.end(); - } - } - }, - - // module.serviceExecute() - // this function is called only from this module - // its purpose is to prepare the request and call - // netdata.serviceExecute() - serviceExecute: function(name, hostname, update_every) { - if(netdata.options.DEBUG === true) netdata.debug(this.name + ': ' + name + ': hostname: ' + hostname + ', update_every: ' + update_every); - - var service = netdata.service({ - name: name, - request: netdata.requestFromURL('http://' + hostname + '/rpc'), - update_every: update_every, - module: this - }); - service.postData = 'RPC={"proc":"GetPlantOverview","format":"JSON","version":"1.0","id":"1"}'; - service.request.method = 'POST'; - service.request.headers['Content-Length'] = service.postData.length; - - service.execute(this.processResponse); - }, - - configure: function(config) { - var added = 0; - - if(typeof(config.servers) !== 'undefined') { - var len = config.servers.length; - while(len--) { - if(typeof config.servers[len].update_every === 'undefined') - config.servers[len].update_every = this.update_every; - - if(config.servers[len].update_every < 5) - config.servers[len].update_every = 5; - - this.serviceExecute(config.servers[len].name, config.servers[len].hostname, config.servers[len].update_every); - added++; - } - } - - return added; - }, - - // module.update() - // this is called repeatedly to collect data, by calling - // netdata.serviceExecute() - update: function(service, callback) { - service.execute(function(serv, data) { - service.module.processResponse(serv, data); - callback(); - }); - }, -}; - -module.exports = webbox; diff --git a/collectors/node.d.plugin/snmp/README.md b/collectors/node.d.plugin/snmp/README.md index df6d7eaca..2df94c7b5 100644 --- a/collectors/node.d.plugin/snmp/README.md +++ b/collectors/node.d.plugin/snmp/README.md @@ -442,4 +442,4 @@ This switch has a very slow SNMP processors. To respond, it needs about 8 second } ``` -[](<>) + diff --git a/collectors/node.d.plugin/stiebeleltron/Makefile.inc b/collectors/node.d.plugin/stiebeleltron/Makefile.inc deleted file mode 100644 index 0c6e1e213..000000000 --- a/collectors/node.d.plugin/stiebeleltron/Makefile.inc +++ /dev/null @@ -1,13 +0,0 @@ -# SPDX-License-Identifier: GPL-3.0-or-later - -# THIS IS NOT A COMPLETE Makefile -# IT IS INCLUDED BY ITS PARENT'S Makefile.am -# IT IS REQUIRED TO REFERENCE ALL FILES RELATIVE TO THE PARENT - -# install these files -dist_node_DATA += stiebeleltron/stiebeleltron.node.js -# dist_nodeconfig_DATA += stiebeleltron/stiebeleltron.conf - -# do not install these files, but include them in the distribution -dist_noinst_DATA += stiebeleltron/README.md stiebeleltron/Makefile.inc - diff --git a/collectors/node.d.plugin/stiebeleltron/README.md b/collectors/node.d.plugin/stiebeleltron/README.md deleted file mode 100644 index 59bbf703c..000000000 --- a/collectors/node.d.plugin/stiebeleltron/README.md +++ /dev/null @@ -1,525 +0,0 @@ -<!-- -title: "Stiebel Eltron ISG monitoring with Netdata" -custom_edit_url: https://github.com/netdata/netdata/edit/master/collectors/node.d.plugin/stiebeleltron/README.md -sidebar_label: "Stiebel Eltron ISG" ---> - -# Stiebel Eltron ISG monitoring with Netdata - -Collects metrics from the configured heat pump and hot water installation from Stiebel Eltron ISG web. - -**Requirements** - -- Configuration file `stiebeleltron.conf` in the node.d Netdata config dir (default: `/etc/netdata/node.d/stiebeleltron.conf`) -- Stiebel Eltron ISG web with network access (http), without password login - -The charts are configurable, however, the provided default configuration collects the following: - -1. **General** - - - Outside temperature in C - - Condenser temperature in C - - Heating circuit pressure in bar - - Flow rate in l/min - - Output of water and heat pumps in % - -2. **Heating** - - - Heat circuit 1 temperature in C (set/actual) - - Heat circuit 2 temperature in C (set/actual) - - Flow temperature in C (set/actual) - - Buffer temperature in C (set/actual) - - Pre-flow temperature in C - -3. **Hot Water** - - - Hot water temperature in C (set/actual) - -4. **Room Temperature** - - - Heat circuit 1 room temperature in C (set/actual) - - Heat circuit 2 room temperature in C (set/actual) - -5. **Electric Reheating** - - - Dual Mode Reheating temperature in C (hot water/heating) - -6. **Process Data** - - - Remaining compressor rest time in s - -7. **Runtime** - - - Compressor runtime hours (hot water/heating) - - Reheating runtime hours (reheating 1/reheating 2) - -8. **Energy** - - - Compressor today in kWh (hot water/heating) - - Compressor Total in kWh (hot water/heating) - -## configuration - -If no configuration is given, the module will be disabled. Each `update_every` is optional, the default is `10`. - ---- - -[Stiebel Eltron Heat pump system with ISG](https://www.stiebel-eltron.com/en/home/products-solutions/renewables/controller_energymanagement/internet_servicegateway/isg_web.html) - -Original author: BrainDoctor (github) - -The module supports any metrics that are parsable with RegEx. There is no API that gives direct access to the values (AFAIK), so the "workaround" is to parse the HTML output of the ISG. - -### Testing - -This plugin has been tested within the following environment: - -- ISG version: 8.5.6 -- MFG version: 12 -- Controller version: 9 -- July (summer time, not much activity) -- Interface language: English -- login- and password-less ISG web access (without HTTPS it's useless anyway) -- Heatpump model: WPL 25 I-2 -- Hot water boiler model: 820 WT 1 - -So, if the language is set to english, copy the following configuration into `/etc/netdata/node.d/stiebeleltron.conf` and change the `url`s. - -In my case, the ISG is relatively slow with responding (at least 1s, but also up to 4s). Collecting metrics every 10s is more than enough for me. - -### How to update the config - -- The dimensions support variable digits, the default is `1`. Most of the values printed by ISG are using 1 digit, some use 2. -- The dimensions also support the `multiplier` and `divisor` attributes, however the divisor gets overridden by `digits`, if specified. Default is `1`. -- The test string for the regex is always the whole HTML output from the url. For each parameter you need to have a regular expression that extracts the value from the HTML source in the first capture group. - Recommended: [regexr.com](https://regexr.com/) for testing and matching, [freeformatter.com](https://www.freeformatter.com/json-escape.html) for escaping the newly created regex for the JSON config. - -The charts are being generated using the configuration below. So if your installation is in another language or has other metrics, just adapt the structure or regexes. - -### Configuration template - -```json -{ - "enable_autodetect": false, - "update_every": 10, - "pages": [ - { - "name": "System", - "id": "system", - "url": "http://machine.ip.or.dns/?s=1,0", - "update_every": 10, - "categories": [ - { - "id": "eletricreheating", - "name": "electric reheating", - "charts": [ - { - "title": "Dual Mode Reheating Temperature", - "id": "reheatingtemp", - "unit": "Celsius", - "type": "line", - "prio": 1, - "dimensions": [ - { - "name": "Heating", - "id": "dualmodeheatingtemp", - "regex": "DUAL MODE TEMP HEATING<\\\/td>\\s*<td.*>(-?[0-9]+,[0-9]+).*<\\\/td>" - }, - { - "name": "Hot Water", - "id" : "dualmodehotwatertemp", - "regex": "DUAL MODE TEMP DHW<\\\/td>\\s*<td.*>(-?[0-9]+,[0-9]+).*<\\\/td>" - } - ] - } - ] - }, - { - "id": "roomtemp", - "name": "room temperature", - "charts": [ - { - "title": "Heat Circuit 1", - "id": "hc1", - "unit": "Celsius", - "type": "line", - "prio": 1, - "dimensions": [ - { - "name": "Actual", - "id": "actual", - "regex": "<tr class=\"even\">\\s*<td.*>ACTUAL TEMPERATURE HC 1<\\\/td>\\s*<td.*>(-?[0-9]+,[0-9]+).*<\\\/td>\\s*<\\\/tr>" - }, - { - "name": "Set", - "id" : "set", - "regex": "<tr class=\"odd\">\\s*<td.*>SET TEMPERATURE HC 1<\\\/td>\\s*<td.*>(-?[0-9]+,[0-9]+).*<\\\/td>\\s*<\\\/tr>" - } - ] - }, - { - "title": "Heat Circuit 2", - "id": "hc2", - "unit": "Celsius", - "type": "line", - "prio": 2, - "dimensions": [ - { - "name": "Actual", - "id": "actual", - "regex": "<tr class=\"even\">\\s*<td.*>ACTUAL TEMPERATURE HC 2<\\\/td>\\s*<td.*>(-?[0-9]+,[0-9]+).*<\\\/td>\\s*<\\\/tr>" - }, - { - "name": "Set", - "id" : "set", - "regex": "<tr class=\"odd\">\\s*<td.*>SET TEMPERATURE HC 2<\\\/td>\\s*<td.*>(-?[0-9]+,[0-9]+).*<\\\/td>\\s*<\\\/tr>" - } - ] - } - ] - }, - { - "id": "heating", - "name": "heating", - "charts": [ - { - "title": "Heat Circuit 1", - "id": "hc1", - "unit": "Celsius", - "type": "line", - "prio": 1, - "dimensions": [ - { - "name": "Actual", - "id": "actual", - "regex": "<tr class=\"odd\">\\s*<td.*>ACTUAL TEMPERATURE HC 1<\\\/td>\\s*<td.*>(-?[0-9]+,[0-9]+).*<\\\/td>\\s*<\\\/tr>" - }, - { - "name": "Set", - "id" : "set", - "regex": "<tr class=\"even\">\\s*<td.*>SET TEMPERATURE HC 1<\\\/td>\\s*<td.*>(-?[0-9]+,[0-9]+).*<\\\/td>\\s*<\\\/tr>" - } - ] - }, - { - "title": "Heat Circuit 2", - "id": "hc2", - "unit": "Celsius", - "type": "line", - "prio": 2, - "dimensions": [ - { - "name": "Actual", - "id": "actual", - "regex": "<tr class=\"odd\">\\s*<td.*>ACTUAL TEMPERATURE HC 2<\\\/td>\\s*<td.*>(-?[0-9]+,[0-9]+).*<\\\/td>\\s*<\\\/tr>" - }, - { - "name": "Set", - "id" : "set", - "regex": "<tr class=\"even\">\\s*<td.*>SET TEMPERATURE HC 2<\\\/td>\\s*<td.*>(-?[0-9]+,[0-9]+).*<\\\/td>\\s*<\\\/tr>" - } - ] - }, - { - "title": "Flow Temperature", - "id": "flowtemp", - "unit": "Celsius", - "type": "line", - "prio": 3, - "dimensions": [ - { - "name": "Heating", - "id": "heating", - "regex": "ACTUAL FLOW TEMPERATURE WP<\\\/td>\\s*<td.*>(-?[0-9]+,[0-9]+).*<\\\/td>" - }, - { - "name": "Reheating", - "id" : "reheating", - "regex": "ACTUAL FLOW TEMPERATURE NHZ<\\\/td>\\s*<td.*>(-?[0-9]+,[0-9]+).*<\\\/td>" - } - ] - }, - { - "title": "Buffer Temperature", - "id": "buffertemp", - "unit": "Celsius", - "type": "line", - "prio": 4, - "dimensions": [ - { - "name": "Actual", - "id": "actual", - "regex": "ACTUAL BUFFER TEMPERATURE<\\\/td>\\s*<td.*>(-?[0-9]+,[0-9]+).*<\\\/td>" - }, - { - "name": "Set", - "id" : "set", - "regex": "SET BUFFER TEMPERATURE<\\\/td>\\s*<td.*>(-?[0-9]+,[0-9]+).*<\\\/td>" - } - ] - }, - { - "title": "Fixed Temperature", - "id": "fixedtemp", - "unit": "Celsius", - "type": "line", - "prio": 5, - "dimensions": [ - { - "name": "Set", - "id" : "setfixed", - "regex": "SET FIXED TEMPERATURE<\\\/td>\\s*<td.*>(-?[0-9]+,[0-9]+).*<\\\/td>" - } - ] - }, - { - "title": "Pre-flow Temperature", - "id": "preflowtemp", - "unit": "Celsius", - "type": "line", - "prio": 6, - "dimensions": [ - { - "name": "Actual", - "id": "actualreturn", - "regex": "ACTUAL RETURN TEMPERATURE<\\\/td>\\s*<td.*>(-?[0-9]+,[0-9]+).*<\\\/td>" - } - ] - } - ] - }, - { - "id": "hotwater", - "name": "hot water", - "charts": [ - { - "title": "Hot Water Temperature", - "id": "hotwatertemp", - "unit": "Celsius", - "type": "line", - "prio": 1, - "dimensions": [ - { - "name": "Actual", - "id": "actual", - "regex": "ACTUAL TEMPERATURE<\\\/td>\\s*<td.*>(-?[0-9]+,[0-9]+).*<\\\/td>" - }, - { - "name": "Set", - "id" : "set", - "regex": "SET TEMPERATURE<\\\/td>\\s*<td.*>(-?[0-9]+,[0-9]+).*<\\\/td>" - } - ] - } - ] - }, - { - "id": "general", - "name": "general", - "charts": [ - { - "title": "Outside Temperature", - "id": "outside", - "unit": "Celsius", - "type": "line", - "prio": 1, - "dimensions": [ - { - "name": "Outside temperature", - "id": "outsidetemp", - "regex": "OUTSIDE TEMPERATURE<\\\/td>\\s*<td.*>(-?[0-9]+,[0-9]+).*<\\\/td>\\s*<\\\/tr>" - } - ] - }, - { - "title": "Condenser Temperature", - "id": "condenser", - "unit": "Celsius", - "type": "line", - "prio": 2, - "dimensions": [ - { - "name": "Condenser", - "id": "condenser", - "regex": "CONDENSER TEMP\\.<\\\/td>\\s*<td.*>(-?[0-9]+,[0-9]+).*<\\\/td>" - } - ] - }, - { - "title": "Heating Circuit Pressure", - "id": "heatingcircuit", - "unit": "bar", - "type": "line", - "prio": 3, - "dimensions": [ - { - "name": "Heating Circuit", - "id": "heatingcircuit", - "digits": 2, - "regex": "PRESSURE HTG CIRC<\\\/td>\\s*<td.*>(-?[0-9]+,[0-9]*).*<\\\/td>" - } - ] - }, - { - "title": "Flow Rate", - "id": "flowrate", - "unit": "liters/min", - "type": "line", - "prio": 4, - "dimensions": [ - { - "name": "Flow Rate", - "id": "flowrate", - "digits": 2, - "regex": "FLOW RATE<\\\/td>\\s*<td.*>(-?[0-9]+,[0-9]+).*<\\\/td>" - } - ] - }, - { - "title": "Output", - "id": "output", - "unit": "%", - "type": "line", - "prio": 5, - "dimensions": [ - { - "name": "Heat Pump", - "id": "outputheatpump", - "regex": "OUTPUT HP<\\\/td>\\s*<td.*>(-?[0-9]+,?[0-9]*).*<\\\/td>" - }, - { - "name": "Water Pump", - "id": "intpumprate", - "regex": "INT PUMP RATE<\\\/td>\\s*<td.*>(-?[0-9]+,?[0-9]*).*<\\\/td>" - } - ] - } - ] - } - ] - }, - { - "name": "Heat Pump", - "id": "heatpump", - "url": "http://machine.ip.or.dns/?s=1,1", - "update_every": 10, - "categories": [ - { - "id": "runtime", - "name": "runtime", - "charts": [ - { - "title": "Compressor", - "id": "compressor", - "unit": "h", - "type": "line", - "prio": 1, - "dimensions": [ - { - "name": "Heating", - "id": "heating", - "regex": "RNT COMP 1 HEA<\\\/td>\\s*<td.*>(-?[0-9]+,?[0-9]*)" - }, - { - "name": "Hot Water", - "id" : "hotwater", - "regex": "RNT COMP 1 DHW<\\\/td>\\s*<td.*>(-?[0-9]+,?[0-9]*)" - } - ] - }, - { - "title": "Reheating", - "id": "reheating", - "unit": "h", - "type": "line", - "prio": 2, - "dimensions": [ - { - "name": "Reheating 1", - "id": "rh1", - "regex": "BH 1<\\\/td>\\s*<td.*>(-?[0-9]+,?[0-9]*)" - }, - { - "name": "Reheating 2", - "id" : "rh2", - "regex": "BH 2<\\\/td>\\s*<td.*>(-?[0-9]+,?[0-9]*)" - } - ] - } - ] - }, - { - "id": "processdata", - "name": "process data", - "charts": [ - { - "title": "Remaining Compressor Rest Time", - "id": "remaincomp", - "unit": "s", - "type": "line", - "prio": 1, - "dimensions": [ - { - "name": "Timer", - "id": "timer", - "regex": "COMP DLAY CNTR<\\\/td>\\s*<td.*>(-?[0-9]+,?[0-9]*)" - } - ] - } - ] - }, - { - "id": "energy", - "name": "energy", - "charts": [ - { - "title": "Compressor Today", - "id": "compressorday", - "unit": "kWh", - "type": "line", - "prio": 1, - "dimensions": [ - { - "name": "Heating", - "id": "heating", - "digits": 3, - "regex": "COMPRESSOR HEATING DAY<\\\/td>\\s*<td.*>(-?[0-9]+,?[0-9]*)" - }, - { - "name": "Hot Water", - "id": "hotwater", - "digits": 3, - "regex": "COMPRESSOR DHW DAY<\\\/td>\\s*<td.*>(-?[0-9]+,?[0-9]*)" - } - ] - }, - { - "title": "Compressor Total", - "id": "compressortotal", - "unit": "MWh", - "type": "line", - "prio": 2, - "dimensions": [ - { - "name": "Heating", - "id": "heating", - "digits": 3, - "regex": "COMPRESSOR HEATING TOTAL<\\\/td>\\s*<td.*>(-?[0-9]+,?[0-9]*)" - }, - { - "name": "Hot Water", - "id": "hotwater", - "digits": 3, - "regex": "COMPRESSOR DHW TOTAL<\\\/td>\\s*<td.*>(-?[0-9]+,?[0-9]*)" - } - ] - } - ] - } - ] - } - ] -} -``` - -[](<>) diff --git a/collectors/node.d.plugin/stiebeleltron/stiebeleltron.node.js b/collectors/node.d.plugin/stiebeleltron/stiebeleltron.node.js deleted file mode 100644 index 250c26540..000000000 --- a/collectors/node.d.plugin/stiebeleltron/stiebeleltron.node.js +++ /dev/null @@ -1,197 +0,0 @@ -'use strict'; -// SPDX-License-Identifier: GPL-3.0-or-later - -// This program will connect to one Stiebel Eltron ISG for heatpump heating -// to get the heat pump metrics. - -// example configuration in netdata/conf.d/node.d/stiebeleltron.conf.md - -require("url"); -require("http"); -var netdata = require("netdata"); - -netdata.debug("loaded " + __filename + " plugin"); - -var stiebeleltron = { - name: "Stiebel Eltron", - enable_autodetect: false, - update_every: 10, - base_priority: 60000, - charts: {}, - pages: {}, - - createBasicDimension: function (id, name, multiplier, divisor) { - return { - id: id, // the unique id of the dimension - name: name, // the name of the dimension - algorithm: netdata.chartAlgorithms.absolute,// the id of the netdata algorithm - multiplier: multiplier, // the multiplier - divisor: divisor, // the divisor - hidden: false // is hidden (boolean) - }; - }, - - processResponse: function (service, html) { - if (html === null) return; - - // add the service - service.commit(); - - var page = stiebeleltron.pages[service.name]; - var categories = page.categories; - var categoriesCount = categories.length; - while (categoriesCount--) { - var context = { - html: html, - service: service, - category: categories[categoriesCount], - page: page, - chartDefinition: null, - dimension: null - }; - stiebeleltron.processCategory(context); - - } - }, - - processCategory: function (context) { - var charts = context.category.charts; - var chartCount = charts.length; - while (chartCount--) { - context.chartDefinition = charts[chartCount]; - stiebeleltron.processChart(context); - } - }, - - processChart: function (context) { - var dimensions = context.chartDefinition.dimensions; - var dimensionCount = dimensions.length; - context.service.begin(stiebeleltron.getChartFromContext(context)); - - while (dimensionCount--) { - context.dimension = dimensions[dimensionCount]; - stiebeleltron.processDimension(context); - } - context.service.end(); - }, - - processDimension: function (context) { - var dimension = context.dimension; - var match = new RegExp(dimension.regex).exec(context.html); - if (match === null) return; - var value = match[1].replace(",", "."); - // most values have a single digit by default, which requires the values to be multiplied. can be overridden. - if (stiebeleltron.isDefined(dimension.digits)) { - value *= Math.pow(10, dimension.digits); - } else { - value *= 10; - } - context.service.set(stiebeleltron.getDimensionId(context), value); - }, - - getChartFromContext: function (context) { - var chartId = this.getChartId(context); - var chart = stiebeleltron.charts[chartId]; - if (stiebeleltron.isDefined(chart)) return chart; - - var chartDefinition = context.chartDefinition; - var service = context.service; - var dimensions = {}; - - var dimCount = chartDefinition.dimensions.length; - while (dimCount--) { - var dim = chartDefinition.dimensions[dimCount]; - var multiplier = 1; - var divisor = 10; - if (stiebeleltron.isDefined(dim.digits)) divisor = Math.pow(10, Math.max(0, dim.digits)); - if (stiebeleltron.isDefined(dim.multiplier)) multiplier = dim.multiplier; - if (stiebeleltron.isDefined(dim.divisor)) divisor = dim.divisor; - context.dimension = dim; - var dimId = this.getDimensionId(context); - dimensions[dimId] = this.createBasicDimension(dimId, dim.name, multiplier, divisor); - } - - chart = { - id: chartId, - name: '', - title: chartDefinition.title, - units: chartDefinition.unit, - family: context.category.name, - context: 'stiebeleltron.' + context.category.id + '.' + chartDefinition.id, - type: chartDefinition.type, - priority: stiebeleltron.base_priority + chartDefinition.prio,// the priority relative to others in the same family - update_every: service.update_every, // the expected update frequency of the chart - dimensions: dimensions - }; - chart = service.chart(chartId, chart); - stiebeleltron.charts[chartId] = chart; - - return chart; - }, - - // module.serviceExecute() - // this function is called only from this module - // its purpose is to prepare the request and call - // netdata.serviceExecute() - serviceExecute: function (name, uri, update_every) { - netdata.debug(this.name + ': ' + name + ': url: ' + uri + ', update_every: ' + update_every); - - var service = netdata.service({ - name: name, - request: netdata.requestFromURL(uri), - update_every: update_every, - module: this - }); - service.execute(this.processResponse); - }, - - - configure: function (config) { - if (stiebeleltron.isUndefined(config.pages)) return 0; - var added = 0; - var pageCount = config.pages.length; - while (pageCount--) { - var page = config.pages[pageCount]; - // some validation - if (stiebeleltron.isUndefined(page.categories) || page.categories.length < 1) { - netdata.error("Your Stiebel Eltron config is invalid. Disabling plugin."); - return 0; - } - if (stiebeleltron.isUndefined(page.update_every)) page.update_every = this.update_every; - this.pages[page.name] = page; - this.serviceExecute(page.name, page.url, page.update_every); - added++; - } - return added; - }, - - // module.update() - // this is called repeatedly to collect data, by calling - // netdata.serviceExecute() - update: function (service, callback) { - service.execute(function (serv, data) { - service.module.processResponse(serv, data); - callback(); - }); - }, - - getChartId: function (context) { - return "stiebeleltron_" + context.page.id + - "." + context.category.id + - "." + context.chartDefinition.id; - }, - - getDimensionId: function (context) { - return context.dimension.id; - }, - - isUndefined: function (value) { - return typeof value === 'undefined'; - }, - - isDefined: function (value) { - return typeof value !== 'undefined'; - } -}; - -module.exports = stiebeleltron; diff --git a/collectors/perf.plugin/README.md b/collectors/perf.plugin/README.md index ccd185ced..a7a87aca2 100644 --- a/collectors/perf.plugin/README.md +++ b/collectors/perf.plugin/README.md @@ -77,4 +77,4 @@ sudo /usr/libexec/netdata/plugins.d/perf.plugin 1 all debug You will get verbose output on what the plugin does. -[](<>) + diff --git a/collectors/plugins.d/README.md b/collectors/plugins.d/README.md index c166e11e3..ac838d21d 100644 --- a/collectors/plugins.d/README.md +++ b/collectors/plugins.d/README.md @@ -231,7 +231,7 @@ the template is: - `options` - a space separated list of options, enclosed in quotes. 4 options are currently supported: `obsolete` to mark a chart as obsolete (Netdata will hide it and delete it after some time), `detail` to mark a chart as insignificant (this may be used by dashboards to make the charts smaller, or somehow visualize properly a less important chart), `store_first` to make Netdata store the first collected value, assuming there was an invisible previous value set to zero (this is used by statsd charts - if the first data collected value of incremental dimensions is not zero based, unrealistic spikes will appear with this option set) and `hidden` to perform all operations on a chart, but do not offer it on dashboards (the chart will be send to backends). `CHART` options have been added in Netdata v1.7 and the `hidden` option was added in 1.10. + a space separated list of options, enclosed in quotes. 4 options are currently supported: `obsolete` to mark a chart as obsolete (Netdata will hide it and delete it after some time), `detail` to mark a chart as insignificant (this may be used by dashboards to make the charts smaller, or somehow visualize properly a less important chart), `store_first` to make Netdata store the first collected value, assuming there was an invisible previous value set to zero (this is used by statsd charts - if the first data collected value of incremental dimensions is not zero based, unrealistic spikes will appear with this option set) and `hidden` to perform all operations on a chart, but do not offer it on dashboards (the chart will be send to external databases). `CHART` options have been added in Netdata v1.7 and the `hidden` option was added in 1.10. - `plugin` and `module` @@ -252,7 +252,7 @@ the template is: the `id` of this dimension (it is a text value, not numeric), this will be needed later to add values to the dimension - We suggest to avoid using `.` in dimension ids. Backends expect metrics to be `.` separated and people will get confused if a dimension id contains a dot. + We suggest to avoid using `.` in dimension ids. External databases expect metrics to be `.` separated and people will get confused if a dimension id contains a dot. - `name` @@ -481,4 +481,4 @@ There are a few rules for writing plugins properly: 4. If possible, try to autodetect if your plugin should be enabled, without any configuration. -[](<>) + diff --git a/collectors/plugins.d/plugins_d.c b/collectors/plugins.d/plugins_d.c index 42889fa8c..614e43d58 100644 --- a/collectors/plugins.d/plugins_d.c +++ b/collectors/plugins.d/plugins_d.c @@ -36,7 +36,7 @@ inline int config_isspace(char c) } // split a text into words, respecting quotes -static inline int quoted_strings_splitter(char *str, char **words, int max_words, int (*custom_isspace)(char), char *recover_input, char **recover_location, int max_recover) +inline int quoted_strings_splitter(char *str, char **words, int max_words, int (*custom_isspace)(char), char *recover_input, char **recover_location, int max_recover) { char *s = str, quote = 0; int i = 0, j, rec = 0; diff --git a/collectors/plugins.d/plugins_d.h b/collectors/plugins.d/plugins_d.h index 8f0b02857..e0b8ac570 100644 --- a/collectors/plugins.d/plugins_d.h +++ b/collectors/plugins.d/plugins_d.h @@ -66,5 +66,6 @@ extern int pluginsd_initialize_plugin_directories(); extern int config_isspace(char c); extern int pluginsd_space(char c); +int quoted_strings_splitter(char *str, char **words, int max_words, int (*custom_isspace)(char), char *recover_input, char **recover_location, int max_recover); #endif /* NETDATA_PLUGINS_D_H */ diff --git a/collectors/plugins.d/pluginsd_parser.c b/collectors/plugins.d/pluginsd_parser.c index c0dcedb67..22b77362f 100644 --- a/collectors/plugins.d/pluginsd_parser.c +++ b/collectors/plugins.d/pluginsd_parser.c @@ -132,13 +132,18 @@ PARSER_RC pluginsd_dimension_action(void *user, RRDSET *st, char *id, char *name rrddim_is_obsolete(st, rd); else rrddim_isnot_obsolete(st, rd); - if (strstr(options, "hidden") != NULL) + if (strstr(options, "hidden") != NULL) { rrddim_flag_set(rd, RRDDIM_FLAG_HIDDEN); + (void) sql_set_dimension_option(&rd->state->metric_uuid, "hidden"); + } + else + (void) sql_set_dimension_option(&rd->state->metric_uuid, NULL); if (strstr(options, "noreset") != NULL) rrddim_flag_set(rd, RRDDIM_FLAG_DONT_DETECT_RESETS_OR_OVERFLOWS); if (strstr(options, "nooverflow") != NULL) rrddim_flag_set(rd, RRDDIM_FLAG_DONT_DETECT_RESETS_OR_OVERFLOWS); } else { + (void) sql_set_dimension_option(&rd->state->metric_uuid, NULL); rrddim_isnot_obsolete(st, rd); } return PARSER_RC_OK; diff --git a/collectors/proc.plugin/README.md b/collectors/proc.plugin/README.md index a9ce2dfa5..32e2112af 100644 --- a/collectors/proc.plugin/README.md +++ b/collectors/proc.plugin/README.md @@ -604,4 +604,4 @@ As far as the message queue charts are dynamic, sane limits are applied for the # max dimensions in memory allowed = 50 ``` -[](<>) + diff --git a/collectors/proc.plugin/proc_interrupts.c b/collectors/proc.plugin/proc_interrupts.c index 2db980a03..78883c475 100644 --- a/collectors/proc.plugin/proc_interrupts.c +++ b/collectors/proc.plugin/proc_interrupts.c @@ -210,7 +210,7 @@ int do_proc_interrupts(int update_every, usec_t dt) { snprintfz(id, 50, "cpu%d_interrupts", c); char title[100+1]; - snprintfz(title, 100, "CPU%d Interrupts", c); + snprintfz(title, 100, "CPU Interrupts"); core_st[c] = rrdset_create_localhost( "cpu" , id diff --git a/collectors/proc.plugin/proc_net_dev.c b/collectors/proc.plugin/proc_net_dev.c index e06da69aa..2d1ae93ae 100644 --- a/collectors/proc.plugin/proc_net_dev.c +++ b/collectors/proc.plugin/proc_net_dev.c @@ -75,6 +75,19 @@ static struct netdev { const char *chart_id_net_carrier; const char *chart_id_net_mtu; + const char *chart_ctx_net_bytes; + const char *chart_ctx_net_packets; + const char *chart_ctx_net_errors; + const char *chart_ctx_net_fifo; + const char *chart_ctx_net_events; + const char *chart_ctx_net_drops; + const char *chart_ctx_net_compressed; + const char *chart_ctx_net_speed; + const char *chart_ctx_net_duplex; + const char *chart_ctx_net_operstate; + const char *chart_ctx_net_carrier; + const char *chart_ctx_net_mtu; + const char *chart_family; struct label *chart_labels; @@ -241,6 +254,19 @@ static void netdev_free_chart_strings(struct netdev *d) { freez((void *)d->chart_id_net_carrier); freez((void *)d->chart_id_net_mtu); + freez((void *)d->chart_ctx_net_bytes); + freez((void *)d->chart_ctx_net_compressed); + freez((void *)d->chart_ctx_net_drops); + freez((void *)d->chart_ctx_net_errors); + freez((void *)d->chart_ctx_net_events); + freez((void *)d->chart_ctx_net_fifo); + freez((void *)d->chart_ctx_net_packets); + freez((void *)d->chart_ctx_net_speed); + freez((void *)d->chart_ctx_net_duplex); + freez((void *)d->chart_ctx_net_operstate); + freez((void *)d->chart_ctx_net_carrier); + freez((void *)d->chart_ctx_net_mtu); + freez((void *)d->chart_family); } @@ -384,40 +410,42 @@ static inline void netdev_rename_cgroup(struct netdev *d, struct netdev_rename * snprintfz(buffer, RRD_ID_LENGTH_MAX, "net_%s", r->container_device); d->chart_id_net_bytes = strdupz(buffer); - snprintfz(buffer, RRD_ID_LENGTH_MAX, "net_compressed_%s", r->container_device); d->chart_id_net_compressed = strdupz(buffer); - snprintfz(buffer, RRD_ID_LENGTH_MAX, "net_drops_%s", r->container_device); d->chart_id_net_drops = strdupz(buffer); - snprintfz(buffer, RRD_ID_LENGTH_MAX, "net_errors_%s", r->container_device); d->chart_id_net_errors = strdupz(buffer); - snprintfz(buffer, RRD_ID_LENGTH_MAX, "net_events_%s", r->container_device); d->chart_id_net_events = strdupz(buffer); - snprintfz(buffer, RRD_ID_LENGTH_MAX, "net_fifo_%s", r->container_device); d->chart_id_net_fifo = strdupz(buffer); - snprintfz(buffer, RRD_ID_LENGTH_MAX, "net_packets_%s", r->container_device); d->chart_id_net_packets = strdupz(buffer); - snprintfz(buffer, RRD_ID_LENGTH_MAX, "net_speed_%s", r->container_device); d->chart_id_net_speed = strdupz(buffer); - snprintfz(buffer, RRD_ID_LENGTH_MAX, "net_duplex_%s", r->container_device); d->chart_id_net_duplex = strdupz(buffer); - snprintfz(buffer, RRD_ID_LENGTH_MAX, "net_operstate_%s", r->container_device); d->chart_id_net_operstate = strdupz(buffer); - snprintfz(buffer, RRD_ID_LENGTH_MAX, "net_carrier_%s", r->container_device); d->chart_id_net_carrier = strdupz(buffer); - snprintfz(buffer, RRD_ID_LENGTH_MAX, "net_mtu_%s", r->container_device); d->chart_id_net_mtu = strdupz(buffer); + d->chart_ctx_net_bytes = strdupz("cgroup.net_net"); + d->chart_ctx_net_compressed = strdupz("cgroup.net_compressed"); + d->chart_ctx_net_drops = strdupz("cgroup.net_drops"); + d->chart_ctx_net_errors = strdupz("cgroup.net_errors"); + d->chart_ctx_net_events = strdupz("cgroup.net_events"); + d->chart_ctx_net_fifo = strdupz("cgroup.net_fifo"); + d->chart_ctx_net_packets = strdupz("cgroup.net_packets"); + d->chart_ctx_net_speed = strdupz("cgroup.net_speed"); + d->chart_ctx_net_duplex = strdupz("cgroup.net_duplex"); + d->chart_ctx_net_operstate = strdupz("cgroup.net_operstate"); + d->chart_ctx_net_carrier = strdupz("cgroup.net_carrier"); + d->chart_ctx_net_mtu = strdupz("cgroup.net_mtu"); + snprintfz(buffer, RRD_ID_LENGTH_MAX, "net %s", r->container_device); d->chart_family = strdupz(buffer); @@ -541,6 +569,19 @@ static struct netdev *get_netdev(const char *name) { d->chart_id_net_carrier = strdupz(d->name); d->chart_id_net_mtu = strdupz(d->name); + d->chart_ctx_net_bytes = strdupz("net.net"); + d->chart_ctx_net_compressed = strdupz("net.compressed"); + d->chart_ctx_net_drops = strdupz("net.drops"); + d->chart_ctx_net_errors = strdupz("net.errors"); + d->chart_ctx_net_events = strdupz("net.events"); + d->chart_ctx_net_fifo = strdupz("net.fifo"); + d->chart_ctx_net_packets = strdupz("net.packets"); + d->chart_ctx_net_speed = strdupz("net.speed"); + d->chart_ctx_net_duplex = strdupz("net.duplex"); + d->chart_ctx_net_operstate = strdupz("net.operstate"); + d->chart_ctx_net_carrier = strdupz("net.carrier"); + d->chart_ctx_net_mtu = strdupz("net.mtu"); + d->chart_family = strdupz(d->name); d->priority = NETDATA_CHART_PRIO_FIRST_NET_IFACE; @@ -825,7 +866,7 @@ int do_proc_net_dev(int update_every, usec_t dt) { , d->chart_id_net_bytes , NULL , d->chart_family - , "net.net" + , d->chart_ctx_net_bytes , "Bandwidth" , "kilobits/s" , PLUGIN_PROC_NAME @@ -881,7 +922,7 @@ int do_proc_net_dev(int update_every, usec_t dt) { , d->chart_id_net_speed , NULL , d->chart_family - , "net.speed" + , d->chart_ctx_net_speed , "Interface Speed" , "kilobits/s" , PLUGIN_PROC_NAME @@ -916,7 +957,7 @@ int do_proc_net_dev(int update_every, usec_t dt) { , d->chart_id_net_duplex , NULL , d->chart_family - , "net.duplex" + , d->chart_ctx_net_duplex , "Interface Duplex State" , "state" , PLUGIN_PROC_NAME @@ -947,7 +988,7 @@ int do_proc_net_dev(int update_every, usec_t dt) { , d->chart_id_net_operstate , NULL , d->chart_family - , "net.operstate" + , d->chart_ctx_net_operstate , "Interface Operational State" , "state" , PLUGIN_PROC_NAME @@ -978,7 +1019,7 @@ int do_proc_net_dev(int update_every, usec_t dt) { , d->chart_id_net_carrier , NULL , d->chart_family - , "net.carrier" + , d->chart_ctx_net_carrier , "Interface Physical Link State" , "state" , PLUGIN_PROC_NAME @@ -1009,7 +1050,7 @@ int do_proc_net_dev(int update_every, usec_t dt) { , d->chart_id_net_mtu , NULL , d->chart_family - , "net.mtu" + , d->chart_ctx_net_mtu , "Interface MTU" , "octets" , PLUGIN_PROC_NAME @@ -1045,7 +1086,7 @@ int do_proc_net_dev(int update_every, usec_t dt) { , d->chart_id_net_packets , NULL , d->chart_family - , "net.packets" + , d->chart_ctx_net_packets , "Packets" , "packets/s" , PLUGIN_PROC_NAME @@ -1093,7 +1134,7 @@ int do_proc_net_dev(int update_every, usec_t dt) { , d->chart_id_net_errors , NULL , d->chart_family - , "net.errors" + , d->chart_ctx_net_errors , "Interface Errors" , "errors/s" , PLUGIN_PROC_NAME @@ -1139,7 +1180,7 @@ int do_proc_net_dev(int update_every, usec_t dt) { , d->chart_id_net_drops , NULL , d->chart_family - , "net.drops" + , d->chart_ctx_net_drops , "Interface Drops" , "drops/s" , PLUGIN_PROC_NAME @@ -1185,7 +1226,7 @@ int do_proc_net_dev(int update_every, usec_t dt) { , d->chart_id_net_fifo , NULL , d->chart_family - , "net.fifo" + , d->chart_ctx_net_fifo , "Interface FIFO Buffer Errors" , "errors" , PLUGIN_PROC_NAME @@ -1231,7 +1272,7 @@ int do_proc_net_dev(int update_every, usec_t dt) { , d->chart_id_net_compressed , NULL , d->chart_family - , "net.compressed" + , d->chart_ctx_net_compressed , "Compressed Packets" , "packets/s" , PLUGIN_PROC_NAME @@ -1277,7 +1318,7 @@ int do_proc_net_dev(int update_every, usec_t dt) { , d->chart_id_net_events , NULL , d->chart_family - , "net.events" + , d->chart_ctx_net_events , "Network Interface Events" , "events/s" , PLUGIN_PROC_NAME diff --git a/collectors/proc.plugin/proc_net_softnet_stat.c b/collectors/proc.plugin/proc_net_softnet_stat.c index a29ccccd1..1f704a427 100644 --- a/collectors/proc.plugin/proc_net_softnet_stat.c +++ b/collectors/proc.plugin/proc_net_softnet_stat.c @@ -117,7 +117,7 @@ int do_proc_net_softnet_stat(int update_every, usec_t dt) { st = rrdset_find_active_bytype_localhost("cpu", id); if(unlikely(!st)) { char title[100+1]; - snprintfz(title, 100, "CPU%zu softnet_stat", l); + snprintfz(title, 100, "CPU softnet_stat"); st = rrdset_create_localhost( "cpu" diff --git a/collectors/proc.plugin/proc_softirqs.c b/collectors/proc.plugin/proc_softirqs.c index d68c69bb7..bb14c1596 100644 --- a/collectors/proc.plugin/proc_softirqs.c +++ b/collectors/proc.plugin/proc_softirqs.c @@ -201,7 +201,7 @@ int do_proc_softirqs(int update_every, usec_t dt) { snprintfz(id, 50, "cpu%d_softirqs", c); char title[100 + 1]; - snprintfz(title, 100, "CPU%d softirqs", c); + snprintfz(title, 100, "CPU softirqs"); core_st[c] = rrdset_create_localhost( "cpu" diff --git a/collectors/proc.plugin/sys_fs_btrfs.c b/collectors/proc.plugin/sys_fs_btrfs.c index 4e58a1a4c..e28b60a7a 100644 --- a/collectors/proc.plugin/sys_fs_btrfs.c +++ b/collectors/proc.plugin/sys_fs_btrfs.c @@ -552,7 +552,7 @@ int do_sys_fs_btrfs(int update_every, usec_t dt) { snprintf(id, RRD_ID_LENGTH_MAX, "disk_%s", node->id); snprintf(name, RRD_ID_LENGTH_MAX, "disk_%s", node->label); - snprintf(title, 200, "BTRFS Physical Disk Allocation for %s", node->label); + snprintf(title, 200, "BTRFS Physical Disk Allocation"); netdata_fix_chart_id(id); netdata_fix_chart_name(name); @@ -610,7 +610,7 @@ int do_sys_fs_btrfs(int update_every, usec_t dt) { snprintf(id, RRD_ID_LENGTH_MAX, "data_%s", node->id); snprintf(name, RRD_ID_LENGTH_MAX, "data_%s", node->label); - snprintf(title, 200, "BTRFS Data Allocation for %s", node->label); + snprintf(title, 200, "BTRFS Data Allocation"); netdata_fix_chart_id(id); netdata_fix_chart_name(name); @@ -653,7 +653,7 @@ int do_sys_fs_btrfs(int update_every, usec_t dt) { snprintf(id, RRD_ID_LENGTH_MAX, "metadata_%s", node->id); snprintf(name, RRD_ID_LENGTH_MAX, "metadata_%s", node->label); - snprintf(title, 200, "BTRFS Metadata Allocation for %s", node->label); + snprintf(title, 200, "BTRFS Metadata Allocation"); netdata_fix_chart_id(id); netdata_fix_chart_name(name); @@ -698,7 +698,7 @@ int do_sys_fs_btrfs(int update_every, usec_t dt) { snprintf(id, RRD_ID_LENGTH_MAX, "system_%s", node->id); snprintf(name, RRD_ID_LENGTH_MAX, "system_%s", node->label); - snprintf(title, 200, "BTRFS System Allocation for %s", node->label); + snprintf(title, 200, "BTRFS System Allocation"); netdata_fix_chart_id(id); netdata_fix_chart_name(name); diff --git a/collectors/python.d.plugin/README.md b/collectors/python.d.plugin/README.md index 9170350fb..7c060f811 100644 --- a/collectors/python.d.plugin/README.md +++ b/collectors/python.d.plugin/README.md @@ -16,7 +16,6 @@ custom_edit_url: https://github.com/netdata/netdata/edit/master/collectors/pytho ## Disclaimer -Every module should be compatible with python2 and python3. All third party libraries should be installed system-wide or in `python_modules` directory. Module configurations are written in YAML and **pyYAML is required**. @@ -77,7 +76,6 @@ Writing new python module is simple. You just need to remember to include 5 majo - **CHART** global dictionary - **Service** class - **\_get_data** method -- all code needs to be compatible with Python 2 (**≥ 2.7**) *and* 3 (**≥ 3.1**) If you plan to submit the module in a PR, make sure and go through the [PR checklist for new modules](#pull-request-checklist-for-python-plugins) beforehand to make sure you have updated all the files you need to. @@ -270,4 +268,4 @@ At minimum, to be buildable and testable, the PR needs to include: - Optionally, chart information in `web/gui/dashboard_info.js`. This generally involves specifying a name and icon for the section, and may include descriptions for the section or individual charts. - Optionally, some default alarm configurations for your collector in `health/health.d/<module_name>.conf` and a line adding `<module_name>.conf` in `health/Makefile.am`. -[](<>) + diff --git a/collectors/python.d.plugin/adaptec_raid/README.md b/collectors/python.d.plugin/adaptec_raid/README.md index 4e99508b3..da5d13b16 100644 --- a/collectors/python.d.plugin/adaptec_raid/README.md +++ b/collectors/python.d.plugin/adaptec_raid/README.md @@ -77,4 +77,4 @@ sudo ./edit-config python.d/adaptec_raid.conf --- -[](<>) + diff --git a/collectors/python.d.plugin/alarms/README.md b/collectors/python.d.plugin/alarms/README.md index 3f2a8176e..cd5e1b817 100644 --- a/collectors/python.d.plugin/alarms/README.md +++ b/collectors/python.d.plugin/alarms/README.md @@ -56,5 +56,3 @@ local: ``` It will default to pulling all alarms at each time step from the Netdata rest api at `http://127.0.0.1:19999/api/v1/alarms?all` - -[]() diff --git a/collectors/python.d.plugin/am2320/README.md b/collectors/python.d.plugin/am2320/README.md index 14ddaa735..3503d7c17 100644 --- a/collectors/python.d.plugin/am2320/README.md +++ b/collectors/python.d.plugin/am2320/README.md @@ -51,4 +51,3 @@ Software install: - restart the netdata service. - check the dashboard. -[]() diff --git a/collectors/python.d.plugin/anomalies/README.md b/collectors/python.d.plugin/anomalies/README.md index 3552053ee..32e79a82f 100644 --- a/collectors/python.d.plugin/anomalies/README.md +++ b/collectors/python.d.plugin/anomalies/README.md @@ -241,4 +241,3 @@ If you would like to go deeper on what exactly the anomalies collector is doing - Good [blog post](https://www.anodot.com/blog/what-is-anomaly-detection/) from Anodot on time series anomaly detection. Anodot also have some great whitepapers in this space too that some may find useful. - Novelty and outlier detection in the [scikit-learn documentation](https://scikit-learn.org/stable/modules/outlier_detection.html). -[]() diff --git a/collectors/python.d.plugin/apache/README.md b/collectors/python.d.plugin/apache/README.md index d27525095..c6086835f 100644 --- a/collectors/python.d.plugin/apache/README.md +++ b/collectors/python.d.plugin/apache/README.md @@ -79,4 +79,4 @@ Without configuration, module attempts to connect to `http://localhost/server-st --- -[](<>) + diff --git a/collectors/python.d.plugin/beanstalk/README.md b/collectors/python.d.plugin/beanstalk/README.md index 24315adb4..3b632597e 100644 --- a/collectors/python.d.plugin/beanstalk/README.md +++ b/collectors/python.d.plugin/beanstalk/README.md @@ -130,4 +130,4 @@ If no configuration is given, module will attempt to connect to beanstalkd on `1 --- -[](<>) + diff --git a/collectors/python.d.plugin/beanstalk/beanstalk.conf b/collectors/python.d.plugin/beanstalk/beanstalk.conf index 7586ad26b..6d9773a19 100644 --- a/collectors/python.d.plugin/beanstalk/beanstalk.conf +++ b/collectors/python.d.plugin/beanstalk/beanstalk.conf @@ -43,7 +43,7 @@ # When a plugin sends the obsolete flag, the charts are not deleted # from netdata immediately. # They will be hidden immediately (not offered to dashboard viewer, -# streamed upstream and archived to backends) and deleted one hour +# streamed upstream and archived to external databases) and deleted one hour # later (configurable from netdata.conf). # chart_cleanup: 10 diff --git a/collectors/python.d.plugin/bind_rndc/README.md b/collectors/python.d.plugin/bind_rndc/README.md index 2832575dd..2d747f81b 100644 --- a/collectors/python.d.plugin/bind_rndc/README.md +++ b/collectors/python.d.plugin/bind_rndc/README.md @@ -76,4 +76,4 @@ If no configuration is given, module will attempt to read named.stats file at ` --- -[](<>) + diff --git a/collectors/python.d.plugin/boinc/README.md b/collectors/python.d.plugin/boinc/README.md index bd509c900..4da2d52bf 100644 --- a/collectors/python.d.plugin/boinc/README.md +++ b/collectors/python.d.plugin/boinc/README.md @@ -38,4 +38,4 @@ remote: --- -[](<>) + diff --git a/collectors/python.d.plugin/ceph/README.md b/collectors/python.d.plugin/ceph/README.md index 5d671f2aa..b75ba6d4f 100644 --- a/collectors/python.d.plugin/ceph/README.md +++ b/collectors/python.d.plugin/ceph/README.md @@ -45,4 +45,4 @@ local: --- -[](<>) + diff --git a/collectors/python.d.plugin/changefinder/README.md b/collectors/python.d.plugin/changefinder/README.md index 051639d1e..7ec3a2539 100644 --- a/collectors/python.d.plugin/changefinder/README.md +++ b/collectors/python.d.plugin/changefinder/README.md @@ -215,4 +215,3 @@ sudo su -s /bin/bash netdata - Novelty and outlier detection in the [scikit-learn documentation](https://scikit-learn.org/stable/modules/outlier_detection.html). -[]() diff --git a/collectors/python.d.plugin/chrony/README.md b/collectors/python.d.plugin/chrony/README.md index 4681b4f6d..3093ec3f9 100644 --- a/collectors/python.d.plugin/chrony/README.md +++ b/collectors/python.d.plugin/chrony/README.md @@ -58,4 +58,4 @@ local: Save the file and restart the Netdata Agent with `sudo systemctl restart netdata`, or the [appropriate method](/docs/configure/start-stop-restart.md) for your system, to finish configuring the `chrony` collector. -[](<>) + diff --git a/collectors/python.d.plugin/couchdb/README.md b/collectors/python.d.plugin/couchdb/README.md index 896bbdd31..d359c8f7c 100644 --- a/collectors/python.d.plugin/couchdb/README.md +++ b/collectors/python.d.plugin/couchdb/README.md @@ -50,4 +50,4 @@ local: --- -[](<>) + diff --git a/collectors/python.d.plugin/dns_query_time/README.md b/collectors/python.d.plugin/dns_query_time/README.md index e1fde7471..365e22560 100644 --- a/collectors/python.d.plugin/dns_query_time/README.md +++ b/collectors/python.d.plugin/dns_query_time/README.md @@ -26,4 +26,4 @@ sudo ./edit-config python.d/dns_query_time.conf --- -[](<>) + diff --git a/collectors/python.d.plugin/dnsdist/README.md b/collectors/python.d.plugin/dnsdist/README.md index 7c279efaf..95b2efae0 100644 --- a/collectors/python.d.plugin/dnsdist/README.md +++ b/collectors/python.d.plugin/dnsdist/README.md @@ -69,4 +69,4 @@ localhost: X-API-Key: 'dnsdist-api-key' ``` -[](<>) + diff --git a/collectors/python.d.plugin/dockerd/README.md b/collectors/python.d.plugin/dockerd/README.md index 178bae2cc..6470a7c0b 100644 --- a/collectors/python.d.plugin/dockerd/README.md +++ b/collectors/python.d.plugin/dockerd/README.md @@ -43,4 +43,4 @@ sudo ./edit-config python.d/dockerd.conf --- -[](<>) + diff --git a/collectors/python.d.plugin/dovecot/README.md b/collectors/python.d.plugin/dovecot/README.md index 730b64257..e6bbf0d74 100644 --- a/collectors/python.d.plugin/dovecot/README.md +++ b/collectors/python.d.plugin/dovecot/README.md @@ -102,4 +102,4 @@ If no configuration is given, module will attempt to connect to dovecot using un --- -[](<>) + diff --git a/collectors/python.d.plugin/elasticsearch/README.md b/collectors/python.d.plugin/elasticsearch/README.md index cf1834c5a..a98eddf51 100644 --- a/collectors/python.d.plugin/elasticsearch/README.md +++ b/collectors/python.d.plugin/elasticsearch/README.md @@ -91,4 +91,4 @@ If no configuration is given, module will try to connect to `http://127.0.0.1:92 --- -[](<>) + diff --git a/collectors/python.d.plugin/energid/README.md b/collectors/python.d.plugin/energid/README.md index 60c829fed..73e39ae14 100644 --- a/collectors/python.d.plugin/energid/README.md +++ b/collectors/python.d.plugin/energid/README.md @@ -74,4 +74,4 @@ bitcoin: --- -[](<>) + diff --git a/collectors/python.d.plugin/example/README.md b/collectors/python.d.plugin/example/README.md index b1c21ecbc..0b80aa9ea 100644 --- a/collectors/python.d.plugin/example/README.md +++ b/collectors/python.d.plugin/example/README.md @@ -11,4 +11,4 @@ Netdata provides an [example python data collection module](https://github.com/n If you want to write your own collector, read our [writing a new Python module](/collectors/python.d.plugin/README.md#how-to-write-a-new-module) tutorial. -[](<>) + diff --git a/collectors/python.d.plugin/exim/README.md b/collectors/python.d.plugin/exim/README.md index 240aa7bed..92b2d7a5b 100644 --- a/collectors/python.d.plugin/exim/README.md +++ b/collectors/python.d.plugin/exim/README.md @@ -38,4 +38,4 @@ Configuration is not needed. --- -[](<>) + diff --git a/collectors/python.d.plugin/fail2ban/README.md b/collectors/python.d.plugin/fail2ban/README.md index 90a59dce0..be09e1857 100644 --- a/collectors/python.d.plugin/fail2ban/README.md +++ b/collectors/python.d.plugin/fail2ban/README.md @@ -79,4 +79,4 @@ at `/etc/fail2ban/jail.local`. If conf file is not found default jail is `ssh`. --- -[](<>) + diff --git a/collectors/python.d.plugin/freeradius/README.md b/collectors/python.d.plugin/freeradius/README.md index 2993c8952..d5ec464b5 100644 --- a/collectors/python.d.plugin/freeradius/README.md +++ b/collectors/python.d.plugin/freeradius/README.md @@ -87,4 +87,4 @@ and restart/reload your FREERADIUS server. --- -[](<>) + diff --git a/collectors/python.d.plugin/gearman/README.md b/collectors/python.d.plugin/gearman/README.md index b9fc914bf..34ea584ab 100644 --- a/collectors/python.d.plugin/gearman/README.md +++ b/collectors/python.d.plugin/gearman/README.md @@ -48,4 +48,3 @@ localhost: When no configuration file is found, module tries to connect to TCP/IP socket: `localhost:4730`. -[]() diff --git a/collectors/python.d.plugin/go_expvar/README.md b/collectors/python.d.plugin/go_expvar/README.md index a73610e7a..feb150dd9 100644 --- a/collectors/python.d.plugin/go_expvar/README.md +++ b/collectors/python.d.plugin/go_expvar/README.md @@ -316,4 +316,4 @@ The images below show how do the final charts in Netdata look.  -[](<>) + diff --git a/collectors/python.d.plugin/haproxy/README.md b/collectors/python.d.plugin/haproxy/README.md index 33d34f1ad..4eb962e24 100644 --- a/collectors/python.d.plugin/haproxy/README.md +++ b/collectors/python.d.plugin/haproxy/README.md @@ -64,4 +64,4 @@ If no configuration is given, module will fail to run. --- -[](<>) + diff --git a/collectors/python.d.plugin/hddtemp/README.md b/collectors/python.d.plugin/hddtemp/README.md index aaaf21421..d8aba62d2 100644 --- a/collectors/python.d.plugin/hddtemp/README.md +++ b/collectors/python.d.plugin/hddtemp/README.md @@ -35,4 +35,4 @@ If no configuration is given, module will attempt to connect to hddtemp daemon o --- -[](<>) + diff --git a/collectors/python.d.plugin/hpssa/README.md b/collectors/python.d.plugin/hpssa/README.md index 69c8d8a33..c1d218279 100644 --- a/collectors/python.d.plugin/hpssa/README.md +++ b/collectors/python.d.plugin/hpssa/README.md @@ -81,4 +81,3 @@ ssacli_path: /usr/sbin/ssacli Save the file and restart the Netdata Agent with `sudo systemctl restart netdata`, or the [appropriate method](/docs/configure/start-stop-restart.md) for your system. -[]() diff --git a/collectors/python.d.plugin/hpssa/hpssa.chart.py b/collectors/python.d.plugin/hpssa/hpssa.chart.py index ce1b43009..4da73dc56 100644 --- a/collectors/python.d.plugin/hpssa/hpssa.chart.py +++ b/collectors/python.d.plugin/hpssa/hpssa.chart.py @@ -93,6 +93,7 @@ ignored_sections_regex = re.compile( re.X ) mirror_group_regex = re.compile(r'^Mirror Group \d+:$') +disk_partition_regex = re.compile(r'^Disk Partition Information$') array_regex = re.compile(r'^Array: (?P<id>[A-Z]+)$') drive_regex = re.compile( r''' @@ -242,7 +243,7 @@ class HPSSA(object): } for line in self: - if mirror_group_regex.match(line): + if HPSSA.match_any(line, mirror_group_regex, disk_partition_regex): self.parse_ignored_section() continue diff --git a/collectors/python.d.plugin/httpcheck/README.md b/collectors/python.d.plugin/httpcheck/README.md index 59c60f544..101b96e3e 100644 --- a/collectors/python.d.plugin/httpcheck/README.md +++ b/collectors/python.d.plugin/httpcheck/README.md @@ -56,4 +56,4 @@ server: --- -[](<>) + diff --git a/collectors/python.d.plugin/httpcheck/httpcheck.conf b/collectors/python.d.plugin/httpcheck/httpcheck.conf index 95adba270..3f33bf65c 100644 --- a/collectors/python.d.plugin/httpcheck/httpcheck.conf +++ b/collectors/python.d.plugin/httpcheck/httpcheck.conf @@ -35,7 +35,7 @@ # A chart is marked as obsolete if it has not been updated # 'chart_cleanup' iterations in a row. # They will be hidden immediately (not offered to dashboard viewer, -# streamed upstream and archived to backends) and deleted one hour +# streamed upstream and archived to external databases) and deleted one hour # later (configurable from netdata.conf). # -- For this plugin, cleanup MUST be disabled, otherwise we lose response # time charts diff --git a/collectors/python.d.plugin/icecast/README.md b/collectors/python.d.plugin/icecast/README.md index 90cdaa5dc..c122f76a3 100644 --- a/collectors/python.d.plugin/icecast/README.md +++ b/collectors/python.d.plugin/icecast/README.md @@ -41,4 +41,4 @@ Without configuration, module attempts to connect to `http://localhost:8443/stat --- -[](<>) + diff --git a/collectors/python.d.plugin/ipfs/README.md b/collectors/python.d.plugin/ipfs/README.md index 4d3b0ecbe..3a7c43632 100644 --- a/collectors/python.d.plugin/ipfs/README.md +++ b/collectors/python.d.plugin/ipfs/README.md @@ -48,4 +48,4 @@ remote: --- -[](<>) + diff --git a/collectors/python.d.plugin/isc_dhcpd/README.md b/collectors/python.d.plugin/isc_dhcpd/README.md index 5830bd63e..712943d99 100644 --- a/collectors/python.d.plugin/isc_dhcpd/README.md +++ b/collectors/python.d.plugin/isc_dhcpd/README.md @@ -54,4 +54,4 @@ The module will not work If no configuration is given. --- -[](<>) + diff --git a/collectors/python.d.plugin/litespeed/README.md b/collectors/python.d.plugin/litespeed/README.md index 2225773b7..b58b23d7e 100644 --- a/collectors/python.d.plugin/litespeed/README.md +++ b/collectors/python.d.plugin/litespeed/README.md @@ -69,4 +69,4 @@ If no configuration is given, module will use "/tmp/lshttpd/". --- -[](<>) + diff --git a/collectors/python.d.plugin/logind/README.md b/collectors/python.d.plugin/logind/README.md index 3e2d4c190..442d388d0 100644 --- a/collectors/python.d.plugin/logind/README.md +++ b/collectors/python.d.plugin/logind/README.md @@ -83,4 +83,4 @@ sudo ./edit-config python.d/logind.conf --- -[](<>) + diff --git a/collectors/python.d.plugin/megacli/README.md b/collectors/python.d.plugin/megacli/README.md index e411c4c11..3c99c3de8 100644 --- a/collectors/python.d.plugin/megacli/README.md +++ b/collectors/python.d.plugin/megacli/README.md @@ -83,4 +83,4 @@ do_battery: yes Save the file and restart the Netdata Agent with `sudo systemctl restart netdata`, or the [appropriate method](/docs/configure/start-stop-restart.md) for your system. -[](<>) + diff --git a/collectors/python.d.plugin/memcached/README.md b/collectors/python.d.plugin/memcached/README.md index abd93fd01..19139ee92 100644 --- a/collectors/python.d.plugin/memcached/README.md +++ b/collectors/python.d.plugin/memcached/README.md @@ -96,4 +96,4 @@ If no configuration is given, module will attempt to connect to memcached instan --- -[](<>) + diff --git a/collectors/python.d.plugin/mongodb/README.md b/collectors/python.d.plugin/mongodb/README.md index e122736ac..b6dd9c5f4 100644 --- a/collectors/python.d.plugin/mongodb/README.md +++ b/collectors/python.d.plugin/mongodb/README.md @@ -207,4 +207,4 @@ If no configuration is given, module will attempt to connect to mongodb daemon o --- -[](<>) + diff --git a/collectors/python.d.plugin/monit/README.md b/collectors/python.d.plugin/monit/README.md index fe1389687..13960256b 100644 --- a/collectors/python.d.plugin/monit/README.md +++ b/collectors/python.d.plugin/monit/README.md @@ -49,4 +49,4 @@ If no configuration is given, module will attempt to connect to monit as `http:/ --- -[](<>) + diff --git a/collectors/python.d.plugin/mysql/README.md b/collectors/python.d.plugin/mysql/README.md index 63d2c1e53..1ba794adf 100644 --- a/collectors/python.d.plugin/mysql/README.md +++ b/collectors/python.d.plugin/mysql/README.md @@ -393,4 +393,4 @@ page](https://mariadb.com/kb/en/library/user-statistics/) --- -[](<>) + diff --git a/collectors/python.d.plugin/nginx/README.md b/collectors/python.d.plugin/nginx/README.md index b55b01e7c..34f63cc52 100644 --- a/collectors/python.d.plugin/nginx/README.md +++ b/collectors/python.d.plugin/nginx/README.md @@ -62,4 +62,4 @@ Without configuration, module attempts to connect to `http://localhost/stub_stat --- -[](<>) + diff --git a/collectors/python.d.plugin/nginx_plus/README.md b/collectors/python.d.plugin/nginx_plus/README.md index 2580740c3..489ac9c2a 100644 --- a/collectors/python.d.plugin/nginx_plus/README.md +++ b/collectors/python.d.plugin/nginx_plus/README.md @@ -162,4 +162,4 @@ Without configuration, module fail to start. --- -[](<>) + diff --git a/collectors/python.d.plugin/nsd/README.md b/collectors/python.d.plugin/nsd/README.md index 1e7b240e7..e5183aeb7 100644 --- a/collectors/python.d.plugin/nsd/README.md +++ b/collectors/python.d.plugin/nsd/README.md @@ -65,4 +65,4 @@ Configuration is not needed. --- -[](<>) + diff --git a/collectors/python.d.plugin/ntpd/README.md b/collectors/python.d.plugin/ntpd/README.md index 0b08f12b8..9832707bd 100644 --- a/collectors/python.d.plugin/ntpd/README.md +++ b/collectors/python.d.plugin/ntpd/README.md @@ -87,4 +87,4 @@ If no configuration is given, module will attempt to connect to `ntpd` on `::1:1 --- -[](<>) + diff --git a/collectors/python.d.plugin/nvidia_smi/README.md b/collectors/python.d.plugin/nvidia_smi/README.md index f8ce824df..fb613064c 100644 --- a/collectors/python.d.plugin/nvidia_smi/README.md +++ b/collectors/python.d.plugin/nvidia_smi/README.md @@ -61,4 +61,4 @@ poll_seconds : 1 exclude_zero_memory_users : yes ``` -[](<>) + diff --git a/collectors/python.d.plugin/nvidia_smi/nvidia_smi.chart.py b/collectors/python.d.plugin/nvidia_smi/nvidia_smi.chart.py index 00bc7884d..1913e94e4 100644 --- a/collectors/python.d.plugin/nvidia_smi/nvidia_smi.chart.py +++ b/collectors/python.d.plugin/nvidia_smi/nvidia_smi.chart.py @@ -294,14 +294,13 @@ def get_username_by_pid_safe(pid, passwd_file): try: uid = os.stat(path).st_uid except (OSError, IOError): - return '' - if IS_INSIDE_DOCKER: - try: + return '' + try: + if IS_INSIDE_DOCKER: return passwd_file[uid][0] - except KeyError: - return str(uid) - else: return pwd.getpwuid(uid)[0] + except KeyError: + return str(uid) class GPU: diff --git a/collectors/python.d.plugin/openldap/README.md b/collectors/python.d.plugin/openldap/README.md index 4942d0f39..b0cd1db42 100644 --- a/collectors/python.d.plugin/openldap/README.md +++ b/collectors/python.d.plugin/openldap/README.md @@ -76,4 +76,4 @@ openldap: --- -[](<>) + diff --git a/collectors/python.d.plugin/oracledb/README.md b/collectors/python.d.plugin/oracledb/README.md index d61c7d2ad..88024f8c5 100644 --- a/collectors/python.d.plugin/oracledb/README.md +++ b/collectors/python.d.plugin/oracledb/README.md @@ -94,4 +94,4 @@ remote: All parameters are required. Without them module will fail to start. -[](<>) + diff --git a/collectors/python.d.plugin/ovpn_status_log/README.md b/collectors/python.d.plugin/ovpn_status_log/README.md index 8fa8cb833..374d1910e 100644 --- a/collectors/python.d.plugin/ovpn_status_log/README.md +++ b/collectors/python.d.plugin/ovpn_status_log/README.md @@ -47,4 +47,4 @@ default --- -[](<>) + diff --git a/collectors/python.d.plugin/phpfpm/README.md b/collectors/python.d.plugin/phpfpm/README.md index 9d0dbb580..fe81971b2 100644 --- a/collectors/python.d.plugin/phpfpm/README.md +++ b/collectors/python.d.plugin/phpfpm/README.md @@ -48,4 +48,4 @@ Without configuration, module attempts to connect to `http://localhost/status` --- -[](<>) + diff --git a/collectors/python.d.plugin/portcheck/README.md b/collectors/python.d.plugin/portcheck/README.md index 35521b2ad..845fa5b90 100644 --- a/collectors/python.d.plugin/portcheck/README.md +++ b/collectors/python.d.plugin/portcheck/README.md @@ -49,4 +49,4 @@ server: --- -[](<>) + diff --git a/collectors/python.d.plugin/portcheck/portcheck.conf b/collectors/python.d.plugin/portcheck/portcheck.conf index df67824bd..2b32c0031 100644 --- a/collectors/python.d.plugin/portcheck/portcheck.conf +++ b/collectors/python.d.plugin/portcheck/portcheck.conf @@ -35,7 +35,7 @@ # A chart is marked as obsolete if it has not been updated # 'chart_cleanup' iterations in a row. # They will be hidden immediately (not offered to dashboard viewer, -# streamed upstream and archived to backends) and deleted one hour +# streamed upstream and archived to external databases) and deleted one hour # later (configurable from netdata.conf). # -- For this plugin, cleanup MUST be disabled, otherwise we lose latency chart chart_cleanup: 0 diff --git a/collectors/python.d.plugin/postfix/README.md b/collectors/python.d.plugin/postfix/README.md index 53073ea8d..ac16962a5 100644 --- a/collectors/python.d.plugin/postfix/README.md +++ b/collectors/python.d.plugin/postfix/README.md @@ -24,4 +24,4 @@ Configuration is not needed. --- -[](<>) + diff --git a/collectors/python.d.plugin/postgres/README.md b/collectors/python.d.plugin/postgres/README.md index 0515ec57c..224b76ff5 100644 --- a/collectors/python.d.plugin/postgres/README.md +++ b/collectors/python.d.plugin/postgres/README.md @@ -115,4 +115,4 @@ tcp: --- -[](<>) + diff --git a/collectors/python.d.plugin/powerdns/README.md b/collectors/python.d.plugin/powerdns/README.md index 610a665de..02449e68e 100644 --- a/collectors/python.d.plugin/powerdns/README.md +++ b/collectors/python.d.plugin/powerdns/README.md @@ -101,4 +101,4 @@ local: --- -[](<>) + diff --git a/collectors/python.d.plugin/proxysql/README.md b/collectors/python.d.plugin/proxysql/README.md index f1b369a44..8c6a394f1 100644 --- a/collectors/python.d.plugin/proxysql/README.md +++ b/collectors/python.d.plugin/proxysql/README.md @@ -103,4 +103,4 @@ If no configuration is given, module will fail to run. --- -[](<>) + diff --git a/collectors/python.d.plugin/puppet/README.md b/collectors/python.d.plugin/puppet/README.md index 9b7c0a2c3..1b06d181b 100644 --- a/collectors/python.d.plugin/puppet/README.md +++ b/collectors/python.d.plugin/puppet/README.md @@ -64,4 +64,4 @@ When no configuration is given, module uses `https://fqdn.example.com:8140`. --- -[](<>) + diff --git a/collectors/python.d.plugin/python_modules/bases/charts.py b/collectors/python.d.plugin/python_modules/bases/charts.py index 2526af8ce..54986a937 100644 --- a/collectors/python.d.plugin/python_modules/bases/charts.py +++ b/collectors/python.d.plugin/python_modules/bases/charts.py @@ -23,7 +23,7 @@ DIMENSION_SET = "SET '{id}' = {value}\n" CHART_VARIABLE_SET = "VARIABLE CHART '{id}' = {value}\n" -RUNTIME_CHART_CREATE = "CHART netdata.runtime_{job_name} '' 'Execution time for {job_name}' 'ms' 'python.d' " \ +RUNTIME_CHART_CREATE = "CHART netdata.runtime_{job_name} '' 'Execution time' 'ms' 'python.d' " \ "netdata.pythond_runtime line 145000 {update_every} '' 'python.d.plugin' '{module_name}'\n" \ "DIMENSION run_time 'run time' absolute 1 1\n" diff --git a/collectors/python.d.plugin/rabbitmq/README.md b/collectors/python.d.plugin/rabbitmq/README.md index 2130a7b3a..607e32c7f 100644 --- a/collectors/python.d.plugin/rabbitmq/README.md +++ b/collectors/python.d.plugin/rabbitmq/README.md @@ -113,4 +113,4 @@ socket: --- -[](<>) + diff --git a/collectors/python.d.plugin/redis/README.md b/collectors/python.d.plugin/redis/README.md index 9fab56c33..319827100 100644 --- a/collectors/python.d.plugin/redis/README.md +++ b/collectors/python.d.plugin/redis/README.md @@ -61,4 +61,4 @@ When no configuration file is found, module tries to connect to TCP/IP socket: ` --- -[](<>) + diff --git a/collectors/python.d.plugin/rethinkdbs/README.md b/collectors/python.d.plugin/rethinkdbs/README.md index 85cebd96a..d3fa3553a 100644 --- a/collectors/python.d.plugin/rethinkdbs/README.md +++ b/collectors/python.d.plugin/rethinkdbs/README.md @@ -50,4 +50,4 @@ When no configuration file is found, module tries to connect to `127.0.0.1:28015 --- -[](<>) + diff --git a/collectors/python.d.plugin/retroshare/README.md b/collectors/python.d.plugin/retroshare/README.md index d8bd3a914..297df9fca 100644 --- a/collectors/python.d.plugin/retroshare/README.md +++ b/collectors/python.d.plugin/retroshare/README.md @@ -44,4 +44,4 @@ remote: ``` --- -[](<>) + diff --git a/collectors/python.d.plugin/riakkv/README.md b/collectors/python.d.plugin/riakkv/README.md index d0ea9a137..fe62c6718 100644 --- a/collectors/python.d.plugin/riakkv/README.md +++ b/collectors/python.d.plugin/riakkv/README.md @@ -124,5 +124,3 @@ With no explicit configuration given, the module will attempt to connect to The default update frequency for the plugin is set to 2 seconds as Riak internally updates the metrics every second. If we were to update the metrics every second, the resulting graph would contain odd jitter. - -[]() diff --git a/collectors/python.d.plugin/samba/README.md b/collectors/python.d.plugin/samba/README.md index 04cb7dcf7..767df12de 100644 --- a/collectors/python.d.plugin/samba/README.md +++ b/collectors/python.d.plugin/samba/README.md @@ -118,4 +118,4 @@ sudo ./edit-config python.d/samba.conf --- -[](<>) + diff --git a/collectors/python.d.plugin/sensors/README.md b/collectors/python.d.plugin/sensors/README.md index 5d2934844..149589317 100644 --- a/collectors/python.d.plugin/sensors/README.md +++ b/collectors/python.d.plugin/sensors/README.md @@ -28,4 +28,4 @@ Please join this discussion for help. --- -[](<>) + diff --git a/collectors/python.d.plugin/sensors/sensors.chart.py b/collectors/python.d.plugin/sensors/sensors.chart.py index 8c0cde6bb..f089e147a 100644 --- a/collectors/python.d.plugin/sensors/sensors.chart.py +++ b/collectors/python.d.plugin/sensors/sensors.chart.py @@ -19,43 +19,43 @@ ORDER = [ # This is a prototype of chart definition which is used to dynamically create self.definitions CHARTS = { 'temperature': { - 'options': [None, ' temperature', 'Celsius', 'temperature', 'sensors.temperature', 'line'], + 'options': [None, 'Temperature', 'Celsius', 'temperature', 'sensors.temperature', 'line'], 'lines': [ [None, None, 'absolute', 1, 1000] ] }, 'voltage': { - 'options': [None, ' voltage', 'Volts', 'voltage', 'sensors.voltage', 'line'], + 'options': [None, 'Voltage', 'Volts', 'voltage', 'sensors.voltage', 'line'], 'lines': [ [None, None, 'absolute', 1, 1000] ] }, 'current': { - 'options': [None, ' current', 'Ampere', 'current', 'sensors.current', 'line'], + 'options': [None, 'Current', 'Ampere', 'current', 'sensors.current', 'line'], 'lines': [ [None, None, 'absolute', 1, 1000] ] }, 'power': { - 'options': [None, ' power', 'Watt', 'power', 'sensors.power', 'line'], + 'options': [None, 'Power', 'Watt', 'power', 'sensors.power', 'line'], 'lines': [ [None, None, 'absolute', 1, 1000] ] }, 'fan': { - 'options': [None, ' fans speed', 'Rotations/min', 'fans', 'sensors.fan', 'line'], + 'options': [None, 'Fans speed', 'Rotations/min', 'fans', 'sensors.fan', 'line'], 'lines': [ [None, None, 'absolute', 1, 1000] ] }, 'energy': { - 'options': [None, ' energy', 'Joule', 'energy', 'sensors.energy', 'line'], + 'options': [None, 'Energy', 'Joule', 'energy', 'sensors.energy', 'line'], 'lines': [ [None, None, 'incremental', 1, 1000] ] }, 'humidity': { - 'options': [None, ' humidity', 'Percent', 'humidity', 'sensors.humidity', 'line'], + 'options': [None, 'Humidity', 'Percent', 'humidity', 'sensors.humidity', 'line'], 'lines': [ [None, None, 'absolute', 1, 1000] ] @@ -143,7 +143,6 @@ class Service(SimpleService): if name not in self.order: self.order.append(name) chart_def = list(CHARTS[sensor]['options']) - chart_def[1] = chip_name + chart_def[1] self.definitions[name] = {'options': chart_def} self.definitions[name]['lines'] = [] line = list(CHARTS[sensor]['lines'][0]) diff --git a/collectors/python.d.plugin/smartd_log/README.md b/collectors/python.d.plugin/smartd_log/README.md index a1b41f408..eef34ce43 100644 --- a/collectors/python.d.plugin/smartd_log/README.md +++ b/collectors/python.d.plugin/smartd_log/README.md @@ -122,4 +122,4 @@ If no configuration is given, module will attempt to read log files in `/var/log --- -[](<>) + diff --git a/collectors/python.d.plugin/spigotmc/README.md b/collectors/python.d.plugin/spigotmc/README.md index 9b297f639..06483188b 100644 --- a/collectors/python.d.plugin/spigotmc/README.md +++ b/collectors/python.d.plugin/spigotmc/README.md @@ -35,4 +35,4 @@ By default, a connection to port 25575 on the local system is attempted with an --- -[](<>) + diff --git a/collectors/python.d.plugin/springboot/README.md b/collectors/python.d.plugin/springboot/README.md index f38e8bf05..cdbc9a900 100644 --- a/collectors/python.d.plugin/springboot/README.md +++ b/collectors/python.d.plugin/springboot/README.md @@ -142,4 +142,4 @@ Please check [springboot.conf](https://raw.githubusercontent.com/netdata/netdata/master/collectors/python.d.plugin/springboot/springboot.conf) for more examples. -[](<>) + diff --git a/collectors/python.d.plugin/squid/README.md b/collectors/python.d.plugin/squid/README.md index e3ed4e0df..c29b69a19 100644 --- a/collectors/python.d.plugin/squid/README.md +++ b/collectors/python.d.plugin/squid/README.md @@ -55,4 +55,4 @@ Without any configuration module will try to autodetect where squid presents its --- -[](<>) + diff --git a/collectors/python.d.plugin/tomcat/README.md b/collectors/python.d.plugin/tomcat/README.md index f9f2ffe31..b7525b88a 100644 --- a/collectors/python.d.plugin/tomcat/README.md +++ b/collectors/python.d.plugin/tomcat/README.md @@ -50,4 +50,4 @@ So it will probably fail. --- -[](<>) + diff --git a/collectors/python.d.plugin/tor/README.md b/collectors/python.d.plugin/tor/README.md index 192a86a37..3e7b8997a 100644 --- a/collectors/python.d.plugin/tor/README.md +++ b/collectors/python.d.plugin/tor/README.md @@ -61,4 +61,4 @@ Without configuration, module attempts to connect to `127.0.0.1:9051`. --- -[](<>) + diff --git a/collectors/python.d.plugin/traefik/README.md b/collectors/python.d.plugin/traefik/README.md index 2a1dd77aa..251cdf2e4 100644 --- a/collectors/python.d.plugin/traefik/README.md +++ b/collectors/python.d.plugin/traefik/README.md @@ -71,4 +71,4 @@ Without configuration, module attempts to connect to `http://localhost:8080/heal --- -[](<>) + diff --git a/collectors/python.d.plugin/uwsgi/README.md b/collectors/python.d.plugin/uwsgi/README.md index f564821a1..58db1a41a 100644 --- a/collectors/python.d.plugin/uwsgi/README.md +++ b/collectors/python.d.plugin/uwsgi/README.md @@ -49,4 +49,4 @@ localhost: When no configuration file is found, module tries to connect to TCP/IP socket: `localhost:1717`. -[](<>) + diff --git a/collectors/python.d.plugin/varnish/README.md b/collectors/python.d.plugin/varnish/README.md index cb29738f5..018905f06 100644 --- a/collectors/python.d.plugin/varnish/README.md +++ b/collectors/python.d.plugin/varnish/README.md @@ -62,4 +62,4 @@ The name of the `varnishd` instance to get logs from. If not specified, the host --- -[](<>) + diff --git a/collectors/python.d.plugin/w1sensor/README.md b/collectors/python.d.plugin/w1sensor/README.md index 31facef77..b6d2b2d63 100644 --- a/collectors/python.d.plugin/w1sensor/README.md +++ b/collectors/python.d.plugin/w1sensor/README.md @@ -25,4 +25,4 @@ sudo ./edit-config python.d/w1sensor.conf --- -[](<>) + diff --git a/collectors/python.d.plugin/web_log/README.md b/collectors/python.d.plugin/web_log/README.md index 8bbb9a83a..552d56e90 100644 --- a/collectors/python.d.plugin/web_log/README.md +++ b/collectors/python.d.plugin/web_log/README.md @@ -216,4 +216,4 @@ The column `minimum requests` state the minimum number of requests required for Netdata alarms are user-configurable. Sample config files can be found under directory `health/health.d` of the [Netdata GitHub repository](https://github.com/netdata/netdata/). -[](<>) + diff --git a/collectors/slabinfo.plugin/README.md b/collectors/slabinfo.plugin/README.md index 21d83c999..2f4904660 100644 --- a/collectors/slabinfo.plugin/README.md +++ b/collectors/slabinfo.plugin/README.md @@ -26,4 +26,4 @@ In the following screenshot, you can clearly see a `find` done on a ext4 filesys 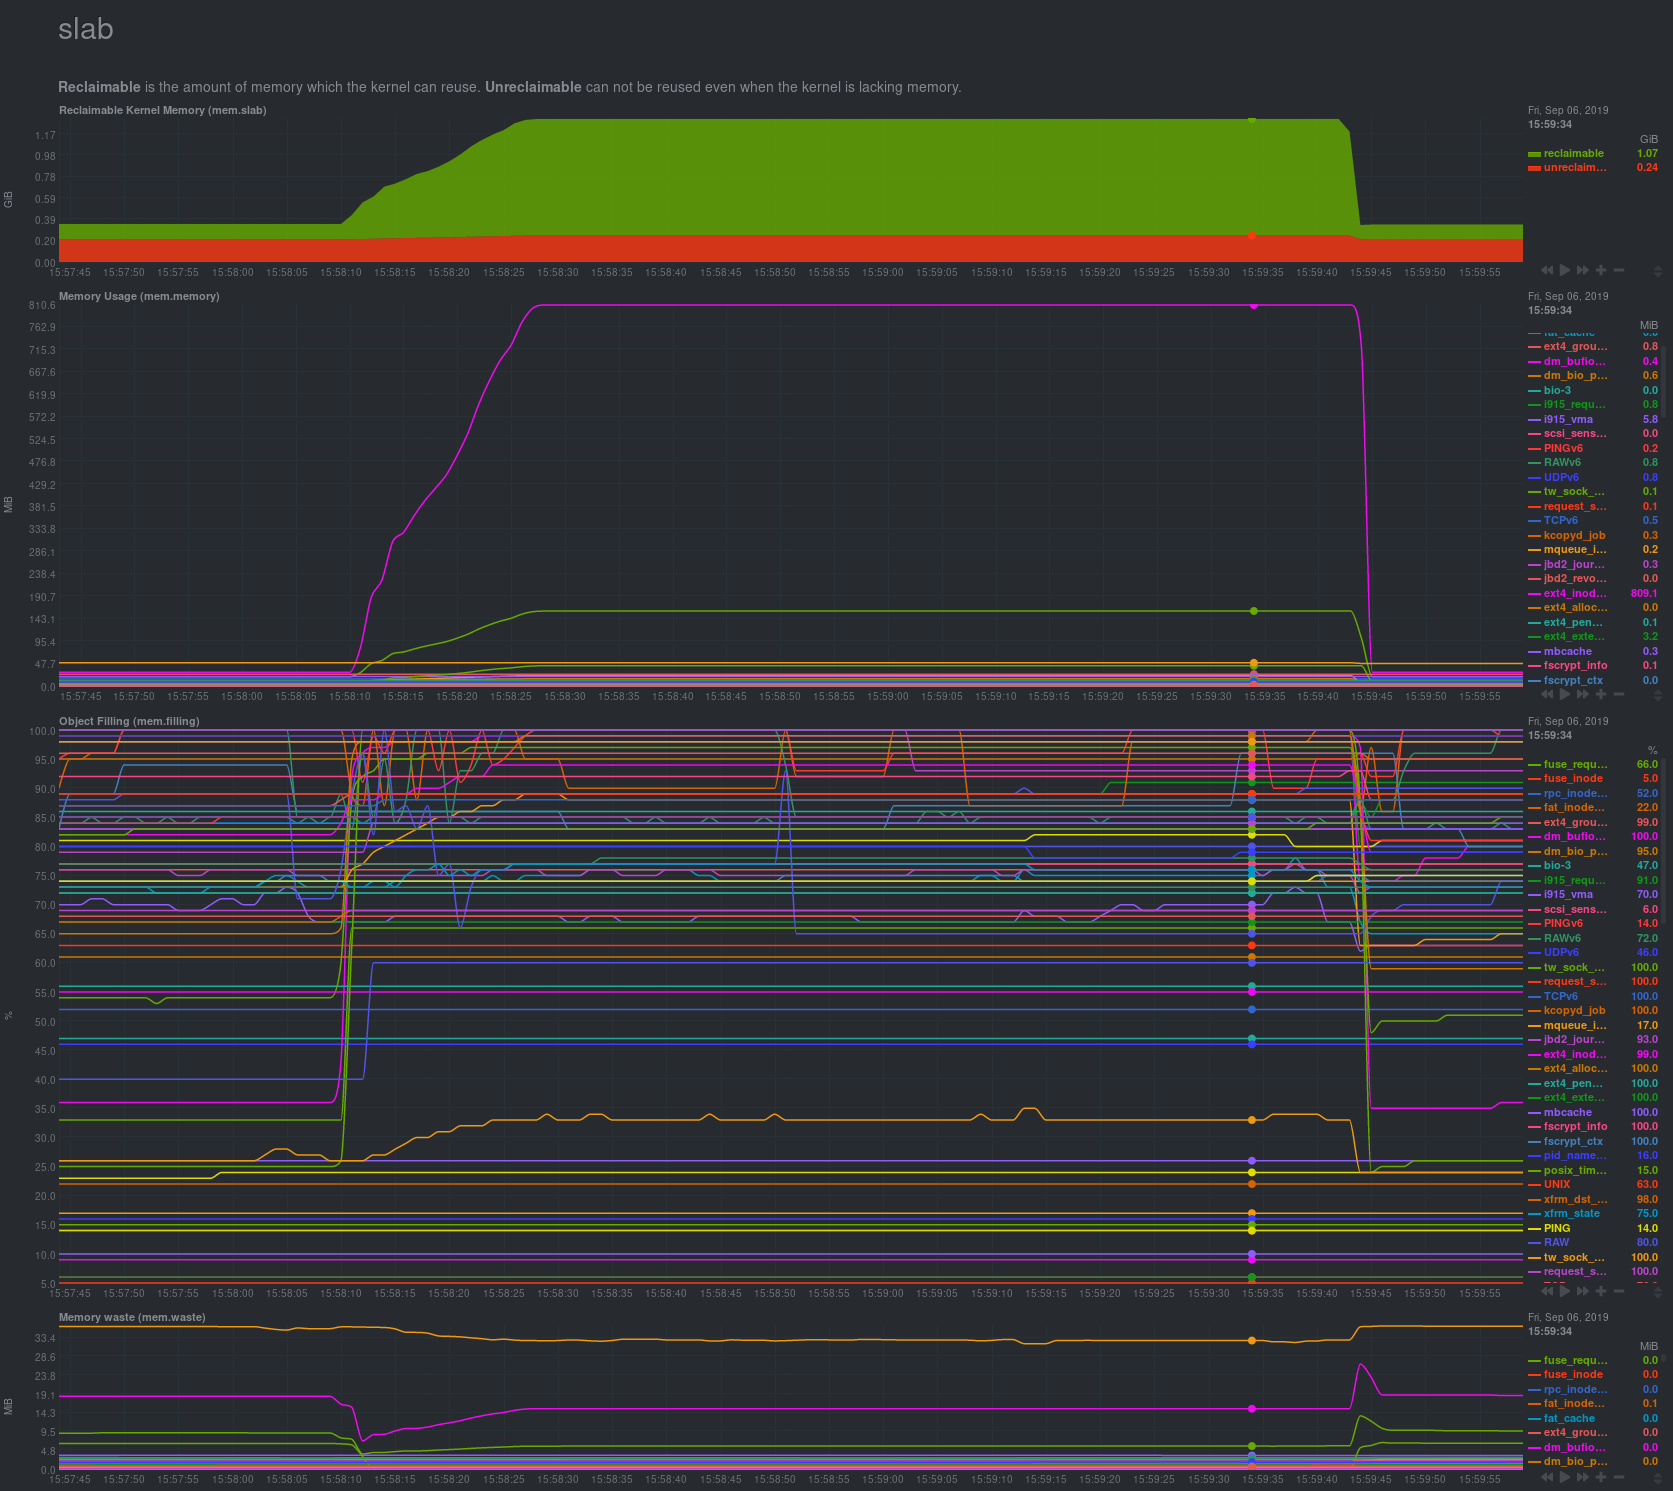 -[](<>) + diff --git a/collectors/statsd.plugin/Makefile.am b/collectors/statsd.plugin/Makefile.am index 71f2d468d..c8144c137 100644 --- a/collectors/statsd.plugin/Makefile.am +++ b/collectors/statsd.plugin/Makefile.am @@ -11,6 +11,7 @@ statsdconfigdir=$(libconfigdir)/statsd.d dist_statsdconfig_DATA = \ example.conf \ k6.conf \ + asterisk.conf \ $(NULL) userstatsdconfigdir=$(configdir)/statsd.d diff --git a/collectors/statsd.plugin/README.md b/collectors/statsd.plugin/README.md index 1d1c8ab70..aadd55bd6 100644 --- a/collectors/statsd.plugin/README.md +++ b/collectors/statsd.plugin/README.md @@ -27,6 +27,10 @@ On these charts, we can have alarms as with any metric and chart. - **Description:** k6 is a developer-centric, free and open-source load testing tool built for making performance testing a productive and enjoyable experience. - [Documentation](/collectors/statsd.plugin/k6.md) - [Configuration](https://github.com/netdata/netdata/blob/master/collectors/statsd.plugin/k6.conf) +- [Asterisk](https://www.asterisk.org/) + - **Description:** Asterisk is an Open Source PBX and telephony toolkit. + - [Documentation](/collectors/statsd.plugin/asterisk.md) + - [Configuration](https://github.com/netdata/netdata/blob/master/collectors/statsd.plugin/asterisk.conf) ## Metrics supported by Netdata @@ -611,4 +615,4 @@ The function is smart enough to call `nc` just once and pass all the metrics to If you have gotten thus far, make sure to check out our [community forums](https://community.netdata.cloud) to share your experience using Netdata with StatsD. -[](<>) + diff --git a/collectors/statsd.plugin/asterisk.conf b/collectors/statsd.plugin/asterisk.conf new file mode 100644 index 000000000..160b80f93 --- /dev/null +++ b/collectors/statsd.plugin/asterisk.conf @@ -0,0 +1,208 @@ +[app] + name = asterisk + metrics = asterisk.* + private charts = yes + gaps when not collected = no + +[dictionary] + # https://www.voip-info.org/asterisk-variable-hangupcause/ + q931.1 = unallocated 1 + q931.2 = no route transit net 2 + q931.3 = no route destination 3 + q931.6 = channel unacceptable 6 + q931.7 = call awarded delivered 7 + q931.16 = normal 16 + q931.17 = busy 17 + q931.18 = no response 18 + q931.19 = no answer 19 + q931.21 = rejected call 21 + q931.22 = number changed 22 + q931.27 = dst out of order 27 + q931.28 = invalid number 28 + q931.29 = rejected facility 29 + q931.30 = response to status 30 + q931.31 = normal unspecified 31 + q931.34 = congestion circuit 34 + q931.38 = net out of order 38 + q931.41 = normal tmp fail 41 + q931.42 = congestion switch 42 + q931.43 = access info discarded 43 + q931.44 = requested chan unavail 44 + q931.45 = pre empted 45 + q931.47 = resource unavailable, unspecified 47 + q931.50 = facility not subscribed 50 + q931.52 = outgoing call barred 52 + q931.54 = incoming call barred 54 + q931.57 = bearer capability not auth 57 + q931.58 = bearer capability not avail 58 + q931.65 = bearer capability not implemented 65 + q931.66 = chan not implemented 66 + q931.69 = facility not implemented 67 + q931.81 = invalid call reference 81 + q931.88 = incompatible destination 88 + q931.95 = invalid msg specified 95 + q931.96 = mandatory ie missing 96 + q931.97 = message type non exist 97 + q931.98 = wrong message 98 + q931.99 = ie non exist 99 + q931.100 = invalid ie contents 100 + q931.101 = wrong call state 101 + q931.102 = recovery on timer expire 102 + q931.103 = mandatory ie length error 103 + q931.111 = protocol error 111 + q931.127 = interworking 127 + + +[channels] + name = channels + title = Active Channels + family = channels + context = asterisk.channels + units = channels + priority = 91000 + type = stacked + dimension = pattern asterisk.channels.count 'channels' last 1 1 + # FIXME: netdata needs to prevent this from going negative + +[endpoints] + name = endpoints + title = Active Endpoints + family = endpoints + context = asterisk.endpoints + units = endpoints + priority = 91005 + type = stacked + dimension = pattern asterisk.endpoints.count 'endpoints' last 1 1 + +[endpoints_by_status] + name = endpoints_by_status + title = Active Endpoints by Status + family = endpoints + context = asterisk.endpoints_by_status + units = endpoints + priority = 91006 + type = stacked + dimension = pattern asterisk.endpoints.state.* '' last 1 1 + +[sip_channels_by_endpoint] + name = sip_channels_by_endpoint + title = Active SIP channels by endpoint + family = channels + context = asterisk.sip_channels_by_endpoint + units = channels + priority = 91110 + type = stacked + dimension = pattern asterisk.endpoints.SIP.*.channels '' last 1 1 + +[pjsip_channels_by_endpoint] + name = pjsip_channels_by_endpoint + title = Active PJSIP channels by endpoint + family = channels + context = asterisk.pjsip_channels_by_endpoint + units = channels + priority = 91111 + type = stacked + dimension = pattern asterisk.endpoints.PJSIP.*.channels '' last 1 1 + +[dialstatuses] + name = dialstatuses + title = Distribution of Dial Statuses + family = dial_statuses + context = asterisk.dialstatus + units = calls + priority = 91150 + type = stacked + dimension = pattern 'asterisk.dialstatus.*' '' last 1 1 + +[calltime] + name = calltime + title = Asterisk Channels Call Duration + family = calltime + context = asterisk.calltime + units = milliseconds + priority = 91160 + type = stacked + dimension = asterisk.channels.calltime 'calltime' average 1 1 + dimension = asterisk.channels.calltime 'sum' sum 1 1 hidden + dimension = asterisk.channels.calltime 'count' events 1 1 hidden + +[hangupcause] + name = hangupcause + title = Distribution of Hangup Causes + family = hangup_causes + context = asterisk.hangupcause + units = calls + priority = 91200 + type = stacked + dimension = pattern 'asterisk.hangupcause.*' 'q931.' last 1 1 + +[hangupcause_answer] + name = hangupcause_answer + title = Distribution of Hangup Causes for ANSWERed calls + family = hangup_causes + context = asterisk.hangupcause_answer + units = calls + priority = 91210 + type = stacked + dimension = pattern 'asterisk.dialhangupcause.ANSWER.*' 'q931.' last 1 1 + +[hangupcause_busy] + name = hangupcause_busy + title = Distribution of Hangup Causes for BUSY calls + family = hangup_causes + context = asterisk.hangupcause_busy + units = calls + priority = 91215 + type = stacked + dimension = pattern 'asterisk.dialhangupcause.BUSY.*' 'q931.' last 1 1 + +[hangupcause_cancel] + name = hangupcause_cancel + title = Distribution of Hangup Causes for CANCELled calls + family = hangup_causes + context = asterisk.hangupcause_cancel + units = calls + priority = 91220 + type = stacked + dimension = pattern 'asterisk.dialhangupcause.CANCEL.*' 'q931.' last 1 1 + +[hangupcause_chanunavail] + name = hangupcause_chanunavail + title = Distribution of Hangup Causes for CHANUNVAILed calls + family = hangup_causes + context = asterisk.hangupcause_chanunavail + units = calls + priority = 91230 + type = stacked + dimension = pattern 'asterisk.dialhangupcause.CHANUNAVAIL.*' 'q931.' last 1 1 + +[hangupcause_congestion] + name = hangupcause_congestion + title = Distribution of Hangup Causes for CONGESTIONed calls + family = hangup_causes + context = asterisk.hangupcause_congestion + units = calls + priority = 91240 + type = stacked + dimension = pattern 'asterisk.dialhangupcause.CONGESTION.*' 'q931.' last 1 1 + +[events] + name = events + title = Asterisk Dialplan Events + family = events + context = asterisk.events + units = events/s + priority = 91400 + type = stacked + dimension = pattern 'asterisk.stasis.message.ast_channel_*_type' '' last 1 1 + +[qualify] + name = qualify + title = Asterisk PJSIP Peers Qualify + family = qualify + context = asterisk.qualify + units = milliseconds + priority = 91500 + type = stacked + dimension = pattern 'asterisk.PJSIP.contacts.*.rtt' '' max 1 1 + # FIXME: netdata needs to set update every = 15 on this diff --git a/collectors/statsd.plugin/asterisk.md b/collectors/statsd.plugin/asterisk.md new file mode 100644 index 000000000..94da94ee2 --- /dev/null +++ b/collectors/statsd.plugin/asterisk.md @@ -0,0 +1,61 @@ +<!-- +title: "Asterisk monitoring with Netdata" +custom_edit_url: https://github.com/netdata/netdata/edit/master/collectors/statsd.plugin/asterisk.md + +sidebar_label: "Asterisk" +--> + +# Asterisk monitoring with Netdata + +Monitors [Asterisk](https://www.asterisk.org/) dialplan application's statistics. + +## Requirements + +- Asterisk [integrated with StatsD](https://www.asterisk.org/integrating-asterisk-with-statsd/). + +## Configuration + +Netdata ships +with [asterisk.conf](https://github.com/netdata/netdata/blob/master/collectors/statsd.plugin/asterisk.conf) with +preconfigured charts. + +To receive Asterisk metrics in Netdata, uncomment the following lines in the `/etc/asterisk/statsd.conf` file: + +```ini +[general] +enabled = yes ; When set to yes, statsd support is enabled +server = 127.0.0.1 ; server[:port] of statsd server to use. + ; If not specified, the port is 8125 +prefix = asterisk ; Prefix to prepend to all metrics +``` + +> See [statsd.conf.sample](https://github.com/asterisk/asterisk/blob/master/configs/samples/statsd.conf.sample) for all available options. + +## Charts and metrics + +<details><summary>Click to see screenshots of the charts.</summary> + + + + +</details> + +Mapping Asterisk StatsD metrics and Netdata charts. + +| Chart | Metrics | +|------------------------------------------------------|--------------------------------------------| +| Active Channels | asterisk.channels.count | +| Active Endpoints | asterisk.endpoints.count | +| Active Endpoints by Status | asterisk.endpoints.state.* | +| Active SIP channels by endpoint | asterisk.endpoints.SIP.*.channels | +| Active PJSIP channels by endpoint | asterisk.endpoints.PJSIP.*.channels | +| Distribution of Dial Statuses | asterisk.dialstatus.* | +| Asterisk Channels Call Duration | asterisk.channels.calltime | +| Distribution of Hangup Causes | asterisk.hangupcause.* | +| Distribution of Hangup Causes for ANSWERed calls | asterisk.dialhangupcause.ANSWER.* | +| Distribution of Hangup Causes for BUSY calls | asterisk.dialhangupcause.BUSY.* | +| Distribution of Hangup Causes for CANCELled calls | asterisk.dialhangupcause.CANCEL.* | +| Distribution of Hangup Causes for CHANUNVAILed calls | asterisk.dialhangupcause.CHANUNAVAIL.* | +| Distribution of Hangup Causes for CONGESTIONed calls | asterisk.dialhangupcause.CONGESTION.* | +| Asterisk Dialplan Events | asterisk.stasis.message.ast_channel_*_type | +| Asterisk PJSIP Peers Qualify | asterisk.PJSIP.contacts.*.rtt | diff --git a/collectors/tc.plugin/README.md b/collectors/tc.plugin/README.md index 480076087..32c20f490 100644 --- a/collectors/tc.plugin/README.md +++ b/collectors/tc.plugin/README.md @@ -202,4 +202,4 @@ Finally, create `/etc/netdata/tc-qos-helper.conf` with this content: Please note, that by default Netdata will enable monitoring metrics only when they are not zero. If they are constantly zero they are ignored. Metrics that will start having values, after Netdata is started, will be detected and charts will be automatically added to the dashboard (a refresh of the dashboard is needed for them to appear though). Set `yes` for a chart instead of `auto` to enable it permanently. You can also set the `enable zero metrics` option to `yes` in the `[global]` section which enables charts with zero metrics for all internal Netdata plugins. -[](<>) + diff --git a/collectors/timex.plugin/README.md b/collectors/timex.plugin/README.md index 79947441f..18665f807 100644 --- a/collectors/timex.plugin/README.md +++ b/collectors/timex.plugin/README.md @@ -6,12 +6,16 @@ custom_edit_url: https://github.com/netdata/netdata/edit/master/collectors/timex # timex.plugin -This plugin monitors the system clock synchronization state on Linux nodes. +This plugin monitors the system kernel clock synchronization state. -This plugin creates two charts: +This plugin creates the following charts: -- System clock synchronization state -- Computed time offset between local system and reference clock +- System clock synchronization state according to the system kernel +- System clock status which gives the value of the `time_status` variable in the kernel +- Computed time offset between local system and reference clock + +This is obtained from the information provided by the [ntp_adjtime()](https://man7.org/linux/man-pages/man2/adjtimex.2.html) system call. +An unsynchronized clock may indicate a hardware clock error, or an issue with UTC synchronization. ## Configuration @@ -19,11 +23,9 @@ Edit the `netdata.conf` configuration file using [`edit-config`](/docs/configure Scroll down to the `[plugin:timex]` section to find the available options: -``` +```ini [plugin:timex] # update every = 1 # clock synchronization state = yes # time offset = yes ``` - -[](<>) diff --git a/collectors/timex.plugin/plugin_timex.c b/collectors/timex.plugin/plugin_timex.c index b69f34292..34a3415a0 100644 --- a/collectors/timex.plugin/plugin_timex.c +++ b/collectors/timex.plugin/plugin_timex.c @@ -1,12 +1,35 @@ // SPDX-License-Identifier: GPL-3.0-or-later #include "daemon/common.h" -#include "sys/timex.h" +#include "libnetdata/os.h" #define PLUGIN_TIMEX_NAME "timex.plugin" #define CONFIG_SECTION_TIMEX "plugin:timex" +struct status_codes { + char *name; + int code; + RRDDIM *rd; +} sta_codes[] = { + // {"pll", STA_PLL, NULL}, + // {"ppsfreq", STA_PPSFREQ, NULL}, + // {"ppstime", STA_PPSTIME, NULL}, + // {"fll", STA_FLL, NULL}, + // {"ins", STA_INS, NULL}, + // {"del", STA_DEL, NULL}, + {"unsync", STA_UNSYNC, NULL}, + // {"freqhold", STA_FREQHOLD, NULL}, + // {"ppssignal", STA_PPSSIGNAL, NULL}, + // {"ppsjitter", STA_PPSJITTER, NULL}, + // {"ppswander", STA_PPSWANDER, NULL}, + // {"ppserror", STA_PPSERROR, NULL}, + {"clockerr", STA_CLOCKERR, NULL}, + // {"nano", STA_NANO, NULL}, + // {"clk", STA_CLK, NULL}, + {NULL, 0, NULL}, +}; + static void timex_main_cleanup(void *ptr) { struct netdata_static_thread *static_thread = (struct netdata_static_thread *)ptr; @@ -44,7 +67,17 @@ void *timex_main(void *ptr) struct timex timex_buf = {}; int sync_state = 0; - sync_state = adjtimex(&timex_buf); + static int prev_sync_state = 0; + + sync_state = ADJUST_TIMEX(&timex_buf); + + int non_seq_failure = (sync_state == -1 && prev_sync_state != -1); + prev_sync_state = sync_state; + + if (non_seq_failure) { + error("Cannot get clock synchronization state"); + continue; + } collected_number divisor = USEC_PER_MS; if (timex_buf.status & STA_NANO) @@ -78,9 +111,39 @@ void *timex_main(void *ptr) rrddim_set_by_pointer(st_sync_state, rd_sync_state, sync_state != TIME_ERROR ? 1 : 0); rrdset_done(st_sync_state); + + static RRDSET *st_clock_status = NULL; + + if (unlikely(!st_clock_status)) { + st_clock_status = rrdset_create_localhost( + "system", + "clock_status", + NULL, + "clock synchronization", + NULL, + "System Clock Status", + "status", + PLUGIN_TIMEX_NAME, + NULL, + NETDATA_CHART_PRIO_CLOCK_STATUS, + update_every, + RRDSET_TYPE_LINE); + + for (int i = 0; sta_codes[i].name != NULL; i++) { + sta_codes[i].rd = + rrddim_add(st_clock_status, sta_codes[i].name, NULL, 1, 1, RRD_ALGORITHM_ABSOLUTE); + } + } else { + rrdset_next(st_clock_status); + } + + for (int i = 0; sta_codes[i].name != NULL; i++) { + rrddim_set_by_pointer(st_clock_status, sta_codes[i].rd, timex_buf.status & sta_codes[i].code ? 1 : 0); + } + rrdset_done(st_clock_status); } - if (do_sync) { + if (do_offset) { static RRDSET *st_offset = NULL; static RRDDIM *rd_offset; @@ -132,13 +195,14 @@ void *timex_main(void *ptr) update_every, RRDSET_TYPE_STACKED); - rd_user = rrddim_add(stcpu_thread, "user", NULL, 1, USEC_PER_MS, RRD_ALGORITHM_INCREMENTAL); + rd_user = rrddim_add(stcpu_thread, "user", NULL, 1, USEC_PER_MS, RRD_ALGORITHM_INCREMENTAL); rd_system = rrddim_add(stcpu_thread, "system", NULL, 1, USEC_PER_MS, RRD_ALGORITHM_INCREMENTAL); } else { rrdset_next(stcpu_thread); } - rrddim_set_by_pointer(stcpu_thread, rd_user, thread.ru_utime.tv_sec * USEC_PER_SEC + thread.ru_utime.tv_usec); + rrddim_set_by_pointer( + stcpu_thread, rd_user, thread.ru_utime.tv_sec * USEC_PER_SEC + thread.ru_utime.tv_usec); rrddim_set_by_pointer( stcpu_thread, rd_system, thread.ru_stime.tv_sec * USEC_PER_SEC + thread.ru_stime.tv_usec); rrdset_done(stcpu_thread); diff --git a/collectors/xenstat.plugin/README.md b/collectors/xenstat.plugin/README.md index 61be271d9..8cbe086fc 100644 --- a/collectors/xenstat.plugin/README.md +++ b/collectors/xenstat.plugin/README.md @@ -50,4 +50,4 @@ sudo /usr/libexec/netdata/plugins.d/xenstat.plugin 1 debug You will get verbose output on what the plugin does. -[](<>) + |