
diff options
| author | Daniel Baumann <daniel.baumann@progress-linux.org> | 2019-10-13 08:37:32 +0000 |
|---|---|---|
| committer | Daniel Baumann <daniel.baumann@progress-linux.org> | 2019-10-13 08:38:18 +0000 |
| commit | ca540a730c0b880922e86074f994a95b8d413bea (patch) | |
| tree | 1364a1b82cfcc68f51aabf9b2545e6a06059d6bb /collectors | |
| parent | Releasing debian version 1.17.1-1. (diff) | |
| download | netdata-ca540a730c0b880922e86074f994a95b8d413bea.tar.xz netdata-ca540a730c0b880922e86074f994a95b8d413bea.zip | |
Merging upstream version 1.18.0.
Signed-off-by: Daniel Baumann <daniel.baumann@progress-linux.org>
Diffstat (limited to 'collectors')
33 files changed, 1500 insertions, 239 deletions
diff --git a/collectors/Makefile.am b/collectors/Makefile.am index fe62ba01d..eaa1a7b8c 100644 --- a/collectors/Makefile.am +++ b/collectors/Makefile.am @@ -22,6 +22,7 @@ SUBDIRS = \ node.d.plugin \ proc.plugin \ python.d.plugin \ + slabinfo.plugin \ statsd.plugin \ tc.plugin \ $(NULL) diff --git a/collectors/README.md b/collectors/README.md index fe6939f63..6cfeb8d23 100644 --- a/collectors/README.md +++ b/collectors/README.md @@ -42,6 +42,7 @@ To minimize the number of processes spawn for data collection, Netdata also supp |[plugins.d](plugins.d/)|`C`|any|internal|-|implements the **external plugins** API and serves external plugins| |[proc.plugin](proc.plugin/)|`C`|linux|internal|yes|collects resource usage and performance data on Linux systems| |[python.d.plugin](python.d.plugin/)|`python` v2+|any|external|yes|a **plugin orchestrator** for data collection modules written in `python` v2 or v3 (both are supported).| +|[slabinfo.plugin](slabinfo.plugin/)|`C`|linux|external|-|collects kernel SLAB details on Linux systems| |[statsd.plugin](statsd.plugin/)|`C`|any|internal|-|implements a high performance **statsd** server for Netdata| |[tc.plugin](tc.plugin/)|`C`|linux|internal|-|collects traffic QoS metrics (`tc`) of Linux network interfaces| diff --git a/collectors/apps.plugin/apps_groups.conf b/collectors/apps.plugin/apps_groups.conf index ab167ddbb..9e3e8d77c 100644 --- a/collectors/apps.plugin/apps_groups.conf +++ b/collectors/apps.plugin/apps_groups.conf @@ -85,6 +85,7 @@ tc-qos-helper: *tc-qos-helper.sh* fping: fping ioping: ioping go.d.plugin: *go.d.plugin* +slabinfo.plugin: slabinfo.plugin # ----------------------------------------------------------------------------- # authentication/authorization related servers diff --git a/collectors/apps.plugin/apps_plugin.c b/collectors/apps.plugin/apps_plugin.c index 29d38bb41..4dcbd38b7 100644 --- a/collectors/apps.plugin/apps_plugin.c +++ b/collectors/apps.plugin/apps_plugin.c @@ -3521,7 +3521,7 @@ static void send_collected_data_to_netdata(struct target *root, const char *type send_BEGIN(type, "uptime_avg", dt); for (w = root; w ; w = w->next) { if(unlikely(w->exposed && w->processes)) - send_SET(w->name, w->processes?(w->uptime_sum / w->processes):0); + send_SET(w->name, w->uptime_sum / w->processes); } send_END(); diff --git a/collectors/cgroups.plugin/cgroup-name.sh.in b/collectors/cgroups.plugin/cgroup-name.sh.in index 784c06042..f7b765bb6 100755 --- a/collectors/cgroups.plugin/cgroup-name.sh.in +++ b/collectors/cgroups.plugin/cgroup-name.sh.in @@ -86,7 +86,7 @@ function k8s_get_name() { if command -v jq >/dev/null 2>&1; then NAME="$( curl -sSk -H "Authorization: Bearer $KUBE_TOKEN" "https://$KUBERNETES_SERVICE_HOST:$KUBERNETES_PORT_443_TCP_PORT/api/v1/pods" | - jq -r '.items[] | "k8s_\(.metadata.namespace)_\(.metadata.name)_\(.metadata.uid)_\(.status.containerStatuses[0].name) \(.status.containerStatuses[0].containerID)"' | + jq -r '.items[] | "k8s_\(.metadata.namespace)_\(.metadata.name)_\(.metadata.uid)_" + (.status.containerStatuses[]? | "\(.name) \(.containerID)")' | grep "$id" | cut -d' ' -f1 )" diff --git a/collectors/cgroups.plugin/cgroup-network.c b/collectors/cgroups.plugin/cgroup-network.c index d4f990061..d01065422 100644 --- a/collectors/cgroups.plugin/cgroup-network.c +++ b/collectors/cgroups.plugin/cgroup-network.c @@ -230,7 +230,6 @@ static struct ns { }; int switch_namespace(const char *prefix, pid_t pid) { - if(!prefix) prefix = ""; #ifdef HAVE_SETNS diff --git a/collectors/charts.d.plugin/apache/README.md b/collectors/charts.d.plugin/apache/README.md index d5c7a80a9..53f02a5b8 100644 --- a/collectors/charts.d.plugin/apache/README.md +++ b/collectors/charts.d.plugin/apache/README.md @@ -26,7 +26,7 @@ It has been tested with apache 2.2 and apache 2.4. The latter also provides conn Apache 2.2 response: ```sh -$ curl "http://127.0.0.1/server-status?auto" +curl "http://127.0.0.1/server-status?auto" Total Accesses: 80057 Total kBytes: 223017 CPULoad: .018287 @@ -42,7 +42,7 @@ Scoreboard: _________________________......................................._W__ Apache 2.4 response: ```sh -$ curl "http://127.0.0.1/server-status?auto" +curl "http://127.0.0.1/server-status?auto" 127.0.0.1 ServerVersion: Apache/2.4.18 (Unix) ServerMPM: event diff --git a/collectors/freebsd.plugin/freebsd_sysctl.c b/collectors/freebsd.plugin/freebsd_sysctl.c index 402813fe0..271547ab3 100644 --- a/collectors/freebsd.plugin/freebsd_sysctl.c +++ b/collectors/freebsd.plugin/freebsd_sysctl.c @@ -470,7 +470,7 @@ int do_dev_cpu_temperature(int update_every, usec_t dt) { pcpu_temperature = reallocz(pcpu_temperature, sizeof(int) * number_of_cpus); mib = reallocz(mib, sizeof(int) * number_of_cpus * 4); if (unlikely(number_of_cpus > old_number_of_cpus)) - memset(&mib[old_number_of_cpus * 4], 0, sizeof(RRDDIM) * (number_of_cpus - old_number_of_cpus)); + memset(&mib[old_number_of_cpus * 4], 0, 4 * (number_of_cpus - old_number_of_cpus)); } for (i = 0; i < number_of_cpus; i++) { if (unlikely(!(mib[i * 4]))) diff --git a/collectors/node.d.plugin/snmp/README.md b/collectors/node.d.plugin/snmp/README.md index 8fd66edb7..c661bac8c 100644 --- a/collectors/node.d.plugin/snmp/README.md +++ b/collectors/node.d.plugin/snmp/README.md @@ -19,7 +19,7 @@ In this example: - the SNMP device is `10.11.12.8`. - the SNMP community is `public`. - we will update the values every 10 seconds (`update_every: 10` under the server `10.11.12.8`). -- we define 2 charts `snmp_switch.bandwidth_port1` and `snmp_switch.bandwidth_port2`, each having 2 dimensions: `in` and `out`. +- we define 2 charts `snmp_switch.bandwidth_port1` and `snmp_switch.bandwidth_port2`, each having 2 dimensions: `in` and `out`. Note that the charts and dimensions must not contain any white space or special characters, other than `.` and `_`. ```json { @@ -96,8 +96,8 @@ In this example: <details markdown="1"><summary><b>Caution: Counter64 metrics do not support `offset` (issue #5028).</b></summary> The SNMP plugin supports Counter64 metrics with the only limitation that the `offset` parameter should not be defined. Due to the way Javascript handles large numbers and the fact that the offset is applied to metrics inside the plugin, the offset will be ignored silently. -</details> -<br> +</details> + If you need to define many charts using incremental OIDs, you can use something like this: ```json @@ -356,8 +356,7 @@ This switch has a very slow SNMP processors. To respond, it needs about 8 second } } } - } - ] + }], } ``` diff --git a/collectors/plugins.d/README.md b/collectors/plugins.d/README.md index 225dfcc99..628e7d5c9 100644 --- a/collectors/plugins.d/README.md +++ b/collectors/plugins.d/README.md @@ -18,6 +18,7 @@ from external processes, thus allowing Netdata to use **external plugins**. |[perf.plugin](../perf.plugin/)|`C`|linux|collects CPU performance metrics using performance monitoring units (PMU).| |[node.d.plugin](../node.d.plugin/)|`node.js`|all|a **plugin orchestrator** for data collection modules written in `node.js`.| |[python.d.plugin](../python.d.plugin/)|`python`|all|a **plugin orchestrator** for data collection modules written in `python` v2 or v3 (both are supported).| +|[slabinfo.plugin](../slabinfo.plugin/)|`C`|linux|collects kernel internal cache objects (SLAB) metrics.| Plugin orchestrators may also be described as **modular plugins**. They are modular since they accept custom made modules to be included. Writing modules for these plugins is easier than accessing the native Netdata API directly. You will find modules already available for each orchestrator under the directory of the particular modular plugin (e.g. under python.d.plugin for the python orchestrator). Each of these modular plugins has each own methods for defining modules. Please check the examples and their documentation. diff --git a/collectors/proc.plugin/proc_mdstat.c b/collectors/proc.plugin/proc_mdstat.c index 5c29d31c7..abfd2ff12 100644 --- a/collectors/proc.plugin/proc_mdstat.c +++ b/collectors/proc.plugin/proc_mdstat.c @@ -197,7 +197,7 @@ int do_proc_mdstat(int update_every, usec_t dt) { }
s++;
}
- if(unlikely(str_total[0] == '\0' || str_inuse[0] == '\0')) {
+ if(unlikely(str_total[0] == '\0' || !str_inuse || str_inuse[0] == '\0')) {
error("Cannot read /proc/mdstat raid health status. Unexpected format.");
continue;
}
diff --git a/collectors/proc.plugin/sys_block_zram.c b/collectors/proc.plugin/sys_block_zram.c index a68a405de..170c72062 100644 --- a/collectors/proc.plugin/sys_block_zram.c +++ b/collectors/proc.plugin/sys_block_zram.c @@ -181,10 +181,14 @@ static inline int read_mm_stat(procfile *ff, MM_STAT *stats) { ff = procfile_readall(ff); if (!ff) return -1; - if (procfile_lines(ff) < 1) + if (procfile_lines(ff) < 1) { + procfile_close(ff); return -1; - if (procfile_linewords(ff, 0) < 7) + } + if (procfile_linewords(ff, 0) < 7) { + procfile_close(ff); return -1; + } stats->orig_data_size = str2ull(procfile_word(ff, 0)); stats->compr_data_size = str2ull(procfile_word(ff, 1)); diff --git a/collectors/proc.plugin/sys_class_power_supply.c b/collectors/proc.plugin/sys_class_power_supply.c index 5e37ad5ab..c558a384d 100644 --- a/collectors/proc.plugin/sys_class_power_supply.c +++ b/collectors/proc.plugin/sys_class_power_supply.c @@ -245,67 +245,75 @@ int do_sys_class_power_supply(int update_every, usec_t dt) { if(unlikely(ps->capacity->fd == -1)) { error("Cannot open file '%s'", ps->capacity->filename); power_supply_free(ps); + ps = NULL; } } - ssize_t r = read(ps->capacity->fd, buffer, 30); - if(unlikely(r < 1)) { - error("Cannot read file '%s'", ps->capacity->filename); - power_supply_free(ps); - } - else { - buffer[r] = '\0'; - ps->capacity->value = str2ull(buffer); - } + if (ps) + { + ssize_t r = read(ps->capacity->fd, buffer, 30); + if(unlikely(r < 1)) { + error("Cannot read file '%s'", ps->capacity->filename); + power_supply_free(ps); + ps = NULL; + } + else { + buffer[r] = '\0'; + ps->capacity->value = str2ull(buffer); - if(unlikely(!keep_fds_open)) { - close(ps->capacity->fd); - ps->capacity->fd = -1; - } - else if(unlikely(lseek(ps->capacity->fd, 0, SEEK_SET) == -1)) { - error("Cannot seek in file '%s'", ps->capacity->filename); - close(ps->capacity->fd); - ps->capacity->fd = -1; + if(unlikely(!keep_fds_open)) { + close(ps->capacity->fd); + ps->capacity->fd = -1; + } + else if(unlikely(lseek(ps->capacity->fd, 0, SEEK_SET) == -1)) { + error("Cannot seek in file '%s'", ps->capacity->filename); + close(ps->capacity->fd); + ps->capacity->fd = -1; + } + } } } // read property files int read_error = 0; struct ps_property *pr; - for(pr = ps->property_root; pr && !read_error; pr = pr->next) { - struct ps_property_dim *pd; - for(pd = pr->property_dim_root; pd; pd = pd->next) { - if(likely(!pd->always_zero)) { - char buffer[30 + 1]; - - if(unlikely(pd->fd == -1)) { - pd->fd = open(pd->filename, O_RDONLY, 0666); + if (ps) + { + for(pr = ps->property_root; pr && !read_error; pr = pr->next) { + struct ps_property_dim *pd; + for(pd = pr->property_dim_root; pd; pd = pd->next) { + if(likely(!pd->always_zero)) { + char buffer[30 + 1]; + if(unlikely(pd->fd == -1)) { - error("Cannot open file '%s'", pd->filename); + pd->fd = open(pd->filename, O_RDONLY, 0666); + if(unlikely(pd->fd == -1)) { + error("Cannot open file '%s'", pd->filename); + read_error = 1; + power_supply_free(ps); + break; + } + } + + ssize_t r = read(pd->fd, buffer, 30); + if(unlikely(r < 1)) { + error("Cannot read file '%s'", pd->filename); read_error = 1; power_supply_free(ps); break; } - } - - ssize_t r = read(pd->fd, buffer, 30); - if(unlikely(r < 1)) { - error("Cannot read file '%s'", pd->filename); - read_error = 1; - power_supply_free(ps); - break; - } - buffer[r] = '\0'; - pd->value = str2ull(buffer); + buffer[r] = '\0'; + pd->value = str2ull(buffer); - if(unlikely(!keep_fds_open)) { - close(pd->fd); - pd->fd = -1; - } - else if(unlikely(lseek(pd->fd, 0, SEEK_SET) == -1)) { - error("Cannot seek in file '%s'", pd->filename); - close(pd->fd); - pd->fd = -1; + if(unlikely(!keep_fds_open)) { + close(pd->fd); + pd->fd = -1; + } + else if(unlikely(lseek(pd->fd, 0, SEEK_SET) == -1)) { + error("Cannot seek in file '%s'", pd->filename); + close(pd->fd); + pd->fd = -1; + } } } } diff --git a/collectors/python.d.plugin/Makefile.am b/collectors/python.d.plugin/Makefile.am index ad72cfaef..7d087fbfd 100644 --- a/collectors/python.d.plugin/Makefile.am +++ b/collectors/python.d.plugin/Makefile.am @@ -54,6 +54,7 @@ include example/Makefile.inc include exim/Makefile.inc include fail2ban/Makefile.inc include freeradius/Makefile.inc +include gearman/Makefile.inc include go_expvar/Makefile.inc include haproxy/Makefile.inc include hddtemp/Makefile.inc diff --git a/collectors/python.d.plugin/README.md b/collectors/python.d.plugin/README.md index d0074a124..f38ab6783 100644 --- a/collectors/python.d.plugin/README.md +++ b/collectors/python.d.plugin/README.md @@ -223,12 +223,12 @@ This is a generic checklist for submitting a new Python plugin for Netdata. It At minimum, to be buildable and testable, the PR needs to include: -- The module itself, following proper naming conventions: `python.d/<module_dir>/<module_name>.chart.py` -- A README.md file for the plugin under `python.d/<module_dir>`. -- The configuration file for the module: `conf.d/python.d/<module_name>.conf`. Python config files are in YAML format, and should include comments describing what options are present. The instructions are also needed in the configuration section of the README.md -- A basic configuration for the plugin in the appropriate global config file: `conf.d/python.d.conf`, which is also in YAML format. Either add a line that reads `# <module_name>: yes` if the module is to be enabled by default, or one that reads `<module_name>: no` if it is to be disabled by default. -- A line for the plugin in `python.d/Makefile.am` under `dist_python_DATA`. -- A line for the plugin configuration file in `conf.d/Makefile.am`, under `dist_pythonconfig_DATA` -- Optionally, chart information in `web/dashboard_info.js`. This generally involves specifying a name and icon for the section, and may include descriptions for the section or individual charts. +- The module itself, following proper naming conventions: `collectors/python.d.plugin/<module_dir>/<module_name>.chart.py` +- A README.md file for the plugin under `collectors/python.d.plugin/<module_dir>`. +- The configuration file for the module: `collectors/python.d.plugin/<module_dir>/<module_name>.conf`. Python config files are in YAML format, and should include comments describing what options are present. The instructions are also needed in the configuration section of the README.md +- A basic configuration for the plugin in the appropriate global config file: `collectors/python.d.plugin/python.d.conf`, which is also in YAML format. Either add a line that reads `# <module_name>: yes` if the module is to be enabled by default, or one that reads `<module_name>: no` if it is to be disabled by default. +- A makefile for the plugin at `collectors/python.d.plugin/<module_dir>/Makefile.inc`. Check an existing plugin for what this should look like. +- A line in `collectors/python.d.plugin/Makefile.am` including the above-mentioned makefile. Place it with the other plugin includes (please keep the includes sorted alphabetically). +- Optionally, chart information in `web/gui/dashboard_info.js`. This generally involves specifying a name and icon for the section, and may include descriptions for the section or individual charts. [](<>) diff --git a/collectors/python.d.plugin/dnsdist/README.md b/collectors/python.d.plugin/dnsdist/README.md index fecf4a5d8..4310fe28a 100644 --- a/collectors/python.d.plugin/dnsdist/README.md +++ b/collectors/python.d.plugin/dnsdist/README.md @@ -1,8 +1,8 @@ # dnsdist -Module monitor dnsdist performance and health metrics. +This module monitors dnsdist performance and health metrics. -Following charts are drawn: +The module draws the following charts: 1. **Response latency** @@ -45,7 +45,7 @@ Following charts are drawn: - servfail-responses - trunc-failures -## configuration +## Configuration ```yaml localhost: @@ -57,6 +57,4 @@ localhost: X-API-Key: 'dnsdist-api-key' ``` ---- - [](<>) diff --git a/collectors/python.d.plugin/elasticsearch/README.md b/collectors/python.d.plugin/elasticsearch/README.md index a719a9431..211dfabfa 100644 --- a/collectors/python.d.plugin/elasticsearch/README.md +++ b/collectors/python.d.plugin/elasticsearch/README.md @@ -1,6 +1,6 @@ # elasticsearch -This module monitors Elasticsearch performance and health metrics. +This module monitors [Elasticsearch](https://www.elastic.co/products/elasticsearch) performance and health metrics. It produces: @@ -51,19 +51,28 @@ It produces: - Store statistics - Indices and shards statistics +9. **Indices** charts (per index statistics, disabled by default): + + - Docs count + - Store size + - Num of replicas + - Health status + ## configuration Sample: ```yaml local: - host : 'ipaddress' # Elasticsearch server ip address or hostname - port : 'port' # Port on which elasticsearch listens - cluster_health : True/False # Calls to cluster health elasticsearch API. Enabled by default. - cluster_stats : True/False # Calls to cluster stats elasticsearch API. Enabled by default. + host : 'ipaddress' # Elasticsearch server ip address or hostname. + port : 'port' # Port on which elasticsearch listens. + node_status : yes/no # Get metrics from "/_nodes/_local/stats". Enabled by default. + cluster_health : yes/no # Get metrics from "/_cluster/health". Enabled by default. + cluster_stats : yes/no # Get metrics from "'/_cluster/stats". Enabled by default. + indices_stats : yes/no # Get metrics from "/_cat/indices". Disabled by default. ``` -If no configuration is given, module will fail to run. +If no configuration is given, module will try to connect to `http://127.0.0.1:9200`. --- diff --git a/collectors/python.d.plugin/elasticsearch/elasticsearch.chart.py b/collectors/python.d.plugin/elasticsearch/elasticsearch.chart.py index 20109c64f..8aaa08583 100644 --- a/collectors/python.d.plugin/elasticsearch/elasticsearch.chart.py +++ b/collectors/python.d.plugin/elasticsearch/elasticsearch.chart.py @@ -168,6 +168,10 @@ ORDER = [ 'cluster_stats_store', 'cluster_stats_indices', 'cluster_stats_shards_total', + 'index_docs_count', + 'index_store_size', + 'index_replica', + 'index_health', ] CHARTS = { @@ -196,7 +200,8 @@ CHARTS = { ] }, 'search_latency': { - 'options': [None, 'Query And Fetch Latency', 'milliseconds', 'search performance', 'elastic.search_latency', 'stacked'], + 'options': [None, 'Query And Fetch Latency', 'milliseconds', 'search performance', 'elastic.search_latency', + 'stacked'], 'lines': [ ['query_latency', 'query', 'absolute', 1, 1000], ['fetch_latency', 'fetch', 'absolute', 1, 1000] @@ -397,9 +402,6 @@ CHARTS = { 'lines': [ ['status_green', 'green', 'absolute'], ['status_red', 'red', 'absolute'], - ['status_foo1', None, 'absolute'], - ['status_foo2', None, 'absolute'], - ['status_foo3', None, 'absolute'], ['status_yellow', 'yellow', 'absolute'] ] }, @@ -483,10 +485,61 @@ CHARTS = { 'lines': [ ['http_current_open', 'opened', 'absolute', 1, 1] ] - } + }, + 'index_docs_count': { + 'options': [None, 'Docs Count', 'count', 'indices', 'elastic.index_docs', 'line'], + 'lines': [] + }, + 'index_store_size': { + 'options': [None, 'Store Size', 'bytes', 'indices', 'elastic.index_store_size', 'line'], + 'lines': [] + }, + 'index_replica': { + 'options': [None, 'Replica', 'count', 'indices', 'elastic.index_replica', 'line'], + 'lines': [] + }, + 'index_health': { + 'options': [None, 'Health', 'status', 'indices', 'elastic.index_health', 'line'], + 'lines': [] + }, } +def convert_index_store_size_to_bytes(size): + # can be b, kb, mb, gb + if size.endswith('kb'): + return round(float(size[:-2]) * 1024) + elif size.endswith('mb'): + return round(float(size[:-2]) * 1024 * 1024) + elif size.endswith('gb'): + return round(float(size[:-2]) * 1024 * 1024 * 1024) + elif size.endswith('b'): + return round(float(size[:-1])) + return -1 + + +def convert_index_health(health): + if health == 'green': + return 0 + elif health == 'yellow': + return 1 + elif health == 'read': + return 2 + return -1 + + +def get_survive_any(method): + def w(*args): + try: + method(*args) + except Exception as error: + self, queue, url = args[0], args[1], args[2] + self.error("error during '{0}' : {1}".format(url, error)) + queue.put(dict()) + + return w + + class Service(UrlService): def __init__(self, configuration=None, name=None): UrlService.__init__(self, configuration=configuration, name=name) @@ -501,34 +554,41 @@ class Service(UrlService): ) self.latency = dict() self.methods = list() + self.collected_indices = set() def check(self): - if not all([self.host, - self.port, - isinstance(self.host, str), - isinstance(self.port, (str, int))]): + if not self.host: self.error('Host is not defined in the module configuration file') return False - # Hostname -> ip address try: self.host = gethostbyname(self.host) except gaierror as error: - self.error(str(error)) + self.error(repr(error)) return False - # Create URL for every Elasticsearch API - self.methods = [METHODS(get_data=self._get_node_stats, - url=self.url + '/_nodes/_local/stats', - run=self.configuration.get('node_stats', True)), - METHODS(get_data=self._get_cluster_health, - url=self.url + '/_cluster/health', - run=self.configuration.get('cluster_health', True)), - METHODS(get_data=self._get_cluster_stats, - url=self.url + '/_cluster/stats', - run=self.configuration.get('cluster_stats', True))] - - # Remove disabled API calls from 'avail methods' + self.methods = [ + METHODS( + get_data=self._get_node_stats, + url=self.url + '/_nodes/_local/stats', + run=self.configuration.get('node_stats', True), + ), + METHODS( + get_data=self._get_cluster_health, + url=self.url + '/_cluster/health', + run=self.configuration.get('cluster_health', True) + ), + METHODS( + get_data=self._get_cluster_stats, + url=self.url + '/_cluster/stats', + run=self.configuration.get('cluster_stats', True), + ), + METHODS( + get_data=self._get_indices, + url=self.url + '/_cat/indices?format=json', + run=self.configuration.get('indices_stats', False), + ), + ] return UrlService.check(self) def _get_data(self): @@ -539,8 +599,11 @@ class Service(UrlService): for method in self.methods: if not method.run: continue - th = threading.Thread(target=method.get_data, - args=(queue, method.url)) + th = threading.Thread( + target=method.get_data, + args=(queue, method.url), + ) + th.daemon = True th.start() threads.append(th) @@ -550,88 +613,128 @@ class Service(UrlService): return result or None - def _get_cluster_health(self, queue, url): - """ - Format data received from http request - :return: dict - """ - + def add_index_to_charts(self, idx_name): + for name in ('index_docs_count', 'index_store_size', 'index_replica', 'index_health'): + chart = self.charts[name] + dim = ['{0}_{1}'.format(idx_name, name), idx_name] + chart.add_dimension(dim) + + @get_survive_any + def _get_indices(self, queue, url): + # [ + # { + # "pri.store.size": "650b", + # "health": "yellow", + # "status": "open", + # "index": "twitter", + # "pri": "5", + # "rep": "1", + # "docs.count": "10", + # "docs.deleted": "3", + # "store.size": "650b" + # } + # ] raw_data = self._get_raw_data(url) - if not raw_data: return queue.put(dict()) - data = self.json_reply(raw_data) - - if not data: + indices = self.json_parse(raw_data) + if not indices: return queue.put(dict()) - to_netdata = fetch_data_(raw_data=data, - metrics=HEALTH_STATS) + charts_initialized = len(self.charts) != 0 + data = dict() + for idx in indices: + try: + name = idx['index'] + is_system_index = name.startswith('.') + if is_system_index: + continue + + v = { + '{0}_index_docs_count'.format(name): idx['docs.count'], + '{0}_index_replica'.format(name): idx['rep'], + '{0}_index_health'.format(name): convert_index_health(idx['health']), + } + size = convert_index_store_size_to_bytes(idx['store.size']) + if size != -1: + v['{0}_index_store_size'.format(name)] = size + except KeyError as error: + self.debug("error on parsing index : {0}".format(repr(error))) + continue - to_netdata.update({'status_green': 0, 'status_red': 0, 'status_yellow': 0, - 'status_foo1': 0, 'status_foo2': 0, 'status_foo3': 0}) - current_status = 'status_' + data['status'] - to_netdata[current_status] = 1 + data.update(v) + if name not in self.collected_indices and charts_initialized: + self.collected_indices.add(name) + self.add_index_to_charts(name) - return queue.put(to_netdata) + return queue.put(data) - def _get_cluster_stats(self, queue, url): - """ - Format data received from http request - :return: dict - """ - - raw_data = self._get_raw_data(url) + @get_survive_any + def _get_cluster_health(self, queue, url): + raw = self._get_raw_data(url) + if not raw: + return queue.put(dict()) - if not raw_data: + parsed = self.json_parse(raw) + if not parsed: return queue.put(dict()) - data = self.json_reply(raw_data) + data = fetch_data(raw_data=parsed, metrics=HEALTH_STATS) + dummy = { + 'status_green': 0, + 'status_red': 0, + 'status_yellow': 0, + } + data.update(dummy) + current_status = 'status_' + parsed['status'] + data[current_status] = 1 - if not data: - return queue.put(dict()) + return queue.put(data) - to_netdata = fetch_data_(raw_data=data, - metrics=CLUSTER_STATS) + @get_survive_any + def _get_cluster_stats(self, queue, url): + raw = self._get_raw_data(url) + if not raw: + return queue.put(dict()) - return queue.put(to_netdata) + parsed = self.json_parse(raw) + if not parsed: + return queue.put(dict()) - def _get_node_stats(self, queue, url): - """ - Format data received from http request - :return: dict - """ + data = fetch_data(raw_data=parsed, metrics=CLUSTER_STATS) - raw_data = self._get_raw_data(url) + return queue.put(data) - if not raw_data: + @get_survive_any + def _get_node_stats(self, queue, url): + raw = self._get_raw_data(url) + if not raw: return queue.put(dict()) - data = self.json_reply(raw_data) - - if not data: + parsed = self.json_parse(raw) + if not parsed: return queue.put(dict()) - node = list(data['nodes'].keys())[0] - to_netdata = fetch_data_(raw_data=data['nodes'][node], - metrics=NODE_STATS) + node = list(parsed['nodes'].keys())[0] + data = fetch_data(raw_data=parsed['nodes'][node], metrics=NODE_STATS) # Search, index, flush, fetch performance latency for key in LATENCY: try: - to_netdata[key] = self.find_avg(total=to_netdata[LATENCY[key]['total']], - spent_time=to_netdata[LATENCY[key]['spent_time']], - key=key) + data[key] = self.find_avg( + total=data[LATENCY[key]['total']], + spent_time=data[LATENCY[key]['spent_time']], + key=key) except KeyError: continue - if 'process_open_file_descriptors' in to_netdata and 'process_max_file_descriptors' in to_netdata: - to_netdata['file_descriptors_used'] = round(float(to_netdata['process_open_file_descriptors']) - / to_netdata['process_max_file_descriptors'] * 1000) + if 'process_open_file_descriptors' in data and 'process_max_file_descriptors' in data: + v = float(data['process_open_file_descriptors']) / data['process_max_file_descriptors'] * 1000 + data['file_descriptors_used'] = round(v) - return queue.put(to_netdata) + return queue.put(data) - def json_reply(self, reply): + def json_parse(self, reply): try: return json.loads(reply) except ValueError as err: @@ -640,20 +743,22 @@ class Service(UrlService): def find_avg(self, total, spent_time, key): if key not in self.latency: - self.latency[key] = dict(total=total, - spent_time=spent_time) + self.latency[key] = dict(total=total, spent_time=spent_time) return 0 + if self.latency[key]['total'] != total: - latency = float(spent_time - self.latency[key]['spent_time'])\ - / float(total - self.latency[key]['total']) * 1000 + spent_diff = spent_time - self.latency[key]['spent_time'] + total_diff = total - self.latency[key]['total'] + latency = float(spent_diff) / float(total_diff) * 1000 self.latency[key]['total'] = total self.latency[key]['spent_time'] = spent_time return latency + self.latency[key]['spent_time'] = spent_time return 0 -def fetch_data_(raw_data, metrics): +def fetch_data(raw_data, metrics): data = dict() for metric in metrics: value = raw_data @@ -661,7 +766,7 @@ def fetch_data_(raw_data, metrics): try: for m in metrics_list: value = value[m] - except KeyError: + except (KeyError, TypeError): continue data['_'.join(metrics_list)] = value return data diff --git a/collectors/python.d.plugin/elasticsearch/elasticsearch.conf b/collectors/python.d.plugin/elasticsearch/elasticsearch.conf index 5d8e746f5..4058debac 100644 --- a/collectors/python.d.plugin/elasticsearch/elasticsearch.conf +++ b/collectors/python.d.plugin/elasticsearch/elasticsearch.conf @@ -61,11 +61,12 @@ # # Additionally to the above, elasticsearch plugin also supports the following: # -# host: 'ipaddress' # Server ip address or hostname. -# port: 'port' # Port on which elasticsearch listen. -# scheme: 'scheme' # URL scheme. Default is 'http'. -# cluster_health: False/True # Calls to cluster health elasticsearch API. Enabled by default. -# cluster_stats: False/True # Calls to cluster stats elasticsearch API. Enabled by default. +# host : 'ipaddress' # Elasticsearch server ip address or hostname. +# port : 'port' # Port on which elasticsearch listens. +# node_status : yes/no # Get metrics from "/_nodes/_local/stats". Enabled by default. +# cluster_health : yes/no # Get metrics from "/_cluster/health". Enabled by default. +# cluster_stats : yes/no # Get metrics from "'/_cluster/stats". Enabled by default. +# indices_stats : yes/no # Get metrics from "/_cat/indices". Disabled by default. # # # if the URL is password protected, the following are supported: diff --git a/collectors/python.d.plugin/gearman/Makefile.inc b/collectors/python.d.plugin/gearman/Makefile.inc new file mode 100644 index 000000000..97ce8d201 --- /dev/null +++ b/collectors/python.d.plugin/gearman/Makefile.inc @@ -0,0 +1,12 @@ +# SPDX-License-Identifier: GPL-3.0-or-later + +# THIS IS NOT A COMPLETE Makefile +# IT IS INCLUDED BY ITS PARENT'S Makefile.am +# IT IS REQUIRED TO REFERENCE ALL FILES RELATIVE TO THE PARENT + +# install these files +dist_python_DATA += gearman/gearman.chart.py +dist_pythonconfig_DATA += gearman/gearman.conf + +# do not install these files, but include them in the distribution +dist_noinst_DATA += gearman/README.md gearman/Makefile.inc diff --git a/collectors/python.d.plugin/gearman/README.md b/collectors/python.d.plugin/gearman/README.md new file mode 100644 index 000000000..cbb4da3e2 --- /dev/null +++ b/collectors/python.d.plugin/gearman/README.md @@ -0,0 +1,39 @@ +# Gearman + +Module monitors Gearman worker statistics. A chart +is shown for each job as well as one showing a summary +of all workers. + +Note: Charts may show as a line graph rather than an area +graph if you load Netdata with no jobs running. To change +this go to "Settings" > "Which dimensions to show?" and +select "All". + +Plugin can obtain data from tcp socket **OR** unix socket. + +**Requirement:** +Socket MUST be readable by netdata user. + +It produces: + + * Workers queued + * Workers idle + * Workers running + +### configuration + +```yaml +localhost: + name : 'local' + host : 'localhost' + port : 4730 + + # TLS information can be provided as well + tls : no + cert : /path/to/cert + key : /path/to/key +``` + +When no configuration file is found, module tries to connect to TCP/IP socket: `localhost:4730`. + +--- diff --git a/collectors/python.d.plugin/gearman/gearman.chart.py b/collectors/python.d.plugin/gearman/gearman.chart.py new file mode 100644 index 000000000..26f3533c4 --- /dev/null +++ b/collectors/python.d.plugin/gearman/gearman.chart.py @@ -0,0 +1,229 @@ +# Description: dovecot netdata python.d module +# Author: Kyle Agronick (agronick) +# SPDX-License-Identifier: GPL-3.0+ + +# Gearman Netdata Plugin + +from bases.FrameworkServices.SocketService import SocketService +from copy import deepcopy + + +CHARTS = { + 'total_workers': { + 'options': [None, 'Total Jobs', 'Jobs', 'Total Jobs', 'gearman.total_jobs', 'line'], + 'lines': [ + ['total_pending', 'Pending', 'absolute'], + ['total_running', 'Running', 'absolute'], + ] + }, +} + + +def job_chart_template(job_name): + return { + 'options': [None, job_name, 'Jobs', 'Activity by Job', 'gearman.single_job', 'stacked'], + 'lines': [ + ['{0}_pending'.format(job_name), 'Pending', 'absolute'], + ['{0}_idle'.format(job_name), 'Idle', 'absolute'], + ['{0}_running'.format(job_name), 'Running', 'absolute'], + ] + } + +def build_result_dict(job): + """ + Get the status for each job + :return: dict + """ + + total, running, available = job['metrics'] + + idle = available - running + pending = total - running + + return { + '{0}_pending'.format(job['job_name']): pending, + '{0}_idle'.format(job['job_name']): idle, + '{0}_running'.format(job['job_name']): running, + } + +def parse_worker_data(job): + job_name = job[0] + job_metrics = job[1:] + + return { + 'job_name': job_name, + 'metrics': job_metrics, + } + + +class GearmanReadException(BaseException): + pass + + +class Service(SocketService): + def __init__(self, configuration=None, name=None): + super(Service, self).__init__(configuration=configuration, name=name) + self.request = "status\n" + self._keep_alive = True + + self.host = self.configuration.get('host', 'localhost') + self.port = self.configuration.get('port', 4730) + + self.tls = self.configuration.get('tls', False) + self.cert = self.configuration.get('cert', None) + self.key = self.configuration.get('key', None) + + self.active_jobs = set() + self.definitions = deepcopy(CHARTS) + self.order = ['total_workers'] + + def _get_data(self): + """ + Format data received from socket + :return: dict + """ + + try: + active_jobs = self.get_active_jobs() + except GearmanReadException: + return None + + found_jobs, job_data = self.process_jobs(active_jobs) + self.remove_stale_jobs(found_jobs) + return job_data + + def get_active_jobs(self): + active_jobs = [] + + for job in self.get_worker_data(): + parsed_job = parse_worker_data(job) + + # Gearman does not clean up old jobs + # We only care about jobs that have + # some relevant data + if not any(parsed_job['metrics']): + continue + + active_jobs.append(parsed_job) + + return active_jobs + + def get_worker_data(self): + """ + Split the data returned from Gearman + into a list of lists + + This returns the same output that you + would get from a gearadmin --status + command. + + Example output returned from + _get_raw_data(): + generic_worker2 78 78 500 + generic_worker3 0 0 760 + generic_worker1 0 0 500 + + :return: list + """ + + try: + raw = self._get_raw_data() + except (ValueError, AttributeError): + raise GearmanReadException() + + if raw is None: + self.debug("Gearman returned no data") + raise GearmanReadException() + + job_lines = raw.splitlines()[:-1] + job_lines = [job.split() for job in sorted(job_lines)] + + for line in job_lines: + line[1:] = map(int, line[1:]) + + return job_lines + + def process_jobs(self, active_jobs): + + output = { + 'total_pending': 0, + 'total_idle': 0, + 'total_running': 0, + } + found_jobs = set() + + for parsed_job in active_jobs: + + job_name = self.add_job(parsed_job) + found_jobs.add(job_name) + job_data = build_result_dict(parsed_job) + + for sum_value in ('pending', 'running', 'idle'): + output['total_{0}'.format(sum_value)] += job_data['{0}_{1}'.format(job_name, sum_value)] + + output.update(job_data) + + return found_jobs, output + + def remove_stale_jobs(self, active_job_list): + """ + Removes jobs that have no workers, pending jobs, + or running jobs + :param active_job_list: The latest list of active jobs + :type active_job_list: iterable + :return: None + """ + + for to_remove in self.active_jobs - active_job_list: + self.remove_job(to_remove) + + def add_job(self, parsed_job): + """ + Adds a job to the list of active jobs + :param parsed_job: A parsed job dict + :type parsed_job: dict + :return: None + """ + + def add_chart(job_name): + """ + Adds a new job chart + :param job_name: The name of the job to add + :type job_name: string + :return: None + """ + + job_key = 'job_{0}'.format(job_name) + template = job_chart_template(job_name) + new_chart = self.charts.add_chart([job_key] + template['options']) + for dimension in template['lines']: + new_chart.add_dimension(dimension) + + if parsed_job['job_name'] not in self.active_jobs: + add_chart(parsed_job['job_name']) + self.active_jobs.add(parsed_job['job_name']) + + return parsed_job['job_name'] + + def remove_job(self, job_name): + """ + Removes a job to the list of active jobs + :param job_name: The name of the job to remove + :type job_name: string + :return: None + """ + + def remove_chart(job_name): + """ + Removes a job chart + :param job_name: The name of the job to remove + :type job_name: string + :return: None + """ + + job_key = 'job_{0}'.format(job_name) + self.charts[job_key].obsolete() + del self.charts[job_key] + + remove_chart(job_name) + self.active_jobs.remove(job_name) diff --git a/collectors/python.d.plugin/gearman/gearman.conf b/collectors/python.d.plugin/gearman/gearman.conf new file mode 100644 index 000000000..c41fd9ffd --- /dev/null +++ b/collectors/python.d.plugin/gearman/gearman.conf @@ -0,0 +1,72 @@ +# netdata python.d.plugin configuration for gearman +# +# This file is in YaML format. Generally the format is: +# +# name: value +# +# There are 2 sections: +# - global variables +# - one or more JOBS +# +# JOBS allow you to collect values from multiple sources. +# Each source will have its own set of charts. +# +# JOB parameters have to be indented (using spaces only, example below). + +# ---------------------------------------------------------------------- +# Global Variables +# These variables set the defaults for all JOBs, however each JOB +# may define its own, overriding the defaults. + +# update_every sets the default data collection frequency. +# If unset, the python.d.plugin default is used. +# update_every: 1 + +# priority controls the order of charts at the netdata dashboard. +# Lower numbers move the charts towards the top of the page. +# If unset, the default for python.d.plugin is used. +# priority: 60000 + +# penalty indicates whether to apply penalty to update_every in case of failures. +# Penalty will increase every 5 failed updates in a row. Maximum penalty is 10 minutes. +# penalty: yes + +# autodetection_retry sets the job re-check interval in seconds. +# The job is not deleted if check fails. +# Attempts to start the job are made once every autodetection_retry. +# This feature is disabled by default. +# autodetection_retry: 0 + +# ---------------------------------------------------------------------- +# JOBS (data collection sources) +# +# The default JOBS share the same *name*. JOBS with the same name +# are mutually exclusive. Only one of them will be allowed running at +# any time. This allows autodetection to try several alternatives and +# pick the one that works. +# +# Any number of jobs is supported. +# +# All python.d.plugin JOBS (for all its modules) support a set of +# predefined parameters. These are: +# +# job_name: +# name: myname # the JOB's name as it will appear at the +# # dashboard (by default is the job_name) +# # JOBs sharing a name are mutually exclusive +# update_every: 1 # the JOB's data collection frequency +# priority: 60000 # the JOB's order on the dashboard +# penalty: yes # the JOB's penalty +# autodetection_retry: 0 # the JOB's re-check interval in seconds +# +# Additionally to the above, gearman also supports the following: +# +# hostname: localhost # The host running the Gearman server +# port: 4730 # Port of the Gearman server +# ---------------------------------------------------------------------- +# AUTO-DETECTION JOB + +localhost: + name : 'local' + host : 'localhost' + port : 4730
\ No newline at end of file diff --git a/collectors/python.d.plugin/mysql/README.md b/collectors/python.d.plugin/mysql/README.md index 45f842d42..037153220 100644 --- a/collectors/python.d.plugin/mysql/README.md +++ b/collectors/python.d.plugin/mysql/README.md @@ -241,12 +241,12 @@ It will produce following charts (if data is available): - sql - io -42. **Replicated Writesets** in writesets/s +42. **Galera Replicated Writesets** in writesets/s - rx - tx -43. **Replicated Bytes** in KiB/s +43. **Galera Replicated Bytes** in KiB/s - rx - tx @@ -256,16 +256,48 @@ It will produce following charts (if data is available): - rx - tx -45. **Replication Conflicts** in transactions +45. **Galera Replication Conflicts** in transactions - bf aborts - cert fails -46. **Flow Control** in ms +46. **Galera Flow Control** in ms - paused -47. **Users CPU time** in percentage +47. **Galera Cluster Status** in status + + - status + +48. **Galera Cluster State** in state + + - state + +49. **Galera Number of Nodes in the Cluster** in num + + - nodes + +50. **Galera Total Weight of the Current Members in the Cluster** in weight + + - weight + +51. **Galera Whether the Node is Connected to the Cluster** in boolean + + - connected + +52. **Galera Whether the Node is Ready to Accept Queries** in boolean + + - ready + +53. **Galera Open Transactions** in num + + - open transactions + +54. **Galera Total Number of WSRep (applier/rollbacker) Threads** in num + + - threads + +55. **Users CPU time** in percentage - users diff --git a/collectors/python.d.plugin/mysql/mysql.chart.py b/collectors/python.d.plugin/mysql/mysql.chart.py index 46d0712fb..f37315479 100644 --- a/collectors/python.d.plugin/mysql/mysql.chart.py +++ b/collectors/python.d.plugin/mysql/mysql.chart.py @@ -117,6 +117,14 @@ GLOBAL_STATS = [ 'Connection_errors_peer_address', 'Connection_errors_select', 'Connection_errors_tcpwrap', + 'Com_delete', + 'Com_insert', + 'Com_select', + 'Com_update', + 'Com_replace' +] + +GALERA_STATS = [ 'wsrep_local_recv_queue', 'wsrep_local_send_queue', 'wsrep_received', @@ -126,11 +134,14 @@ GLOBAL_STATS = [ 'wsrep_local_bf_aborts', 'wsrep_local_cert_failures', 'wsrep_flow_control_paused_ns', - 'Com_delete', - 'Com_insert', - 'Com_select', - 'Com_update', - 'Com_replace' + 'wsrep_cluster_weight', + 'wsrep_cluster_size', + 'wsrep_cluster_status', + 'wsrep_local_state', + 'wsrep_open_transactions', + 'wsrep_connected', + 'wsrep_ready', + 'wsrep_thread_count' ] @@ -216,7 +227,15 @@ ORDER = [ 'galera_queue', 'galera_conflicts', 'galera_flow_control', - 'userstats_cpu' + 'galera_cluster_status', + 'galera_cluster_state', + 'galera_cluster_size', + 'galera_cluster_weight', + 'galera_connected', + 'galera_ready', + 'galera_open_transactions', + 'galera_thread_count', + 'userstats_cpu', ] CHARTS = { @@ -594,6 +613,58 @@ CHARTS = { ['wsrep_flow_control_paused_ns', 'paused', 'incremental', 1, 1000000], ] }, + 'galera_cluster_status': { + 'options': [None, 'Cluster Component Status', 'status', 'galera', 'mysql.galera_cluster_status', 'line'], + 'lines': [ + ['wsrep_cluster_status', 'status', 'absolute'], + ] + }, + 'galera_cluster_state': { + 'options': [None, 'Cluster Component State', 'state', 'galera', 'mysql.galera_cluster_state', 'line'], + 'lines': [ + ['wsrep_local_state', 'state', 'absolute'], + ] + }, + 'galera_cluster_size': { + 'options': [None, 'Number of Nodes in the Cluster', 'num', 'galera', 'mysql.galera_cluster_size', 'line'], + 'lines': [ + ['wsrep_cluster_size', 'nodes', 'absolute'], + ] + }, + 'galera_cluster_weight': { + 'options': [None, 'The Total Weight of the Current Members in the Cluster', 'weight', 'galera', + 'mysql.galera_cluster_weight', 'line'], + 'lines': [ + ['wsrep_cluster_weight', 'weight', 'absolute'], + ] + }, + 'galera_connected': { + 'options': [None, 'Whether the Node is Connected to the Cluster', 'boolean', 'galera', + 'mysql.galera_connected', 'line'], + 'lines': [ + ['wsrep_connected', 'connected', 'absolute'], + ] + }, + 'galera_ready': { + 'options': [None, 'Whether the Node is Ready to Accept Queries', 'boolean', 'galera', + 'mysql.galera_ready', 'line'], + 'lines': [ + ['wsrep_ready', 'ready', 'absolute'], + ] + }, + 'galera_open_transactions': { + 'options': [None, 'Open Transactions', 'num', 'galera', 'mysql.galera_open_transactions', 'line'], + 'lines': [ + ['wsrep_open_transactions', 'open transactions', 'absolute'], + ] + }, + 'galera_thread_count': { + 'options': [None, 'Total Number of WSRep (applier/rollbacker) Threads', 'num', 'galera', + 'mysql.galera_thread_count', 'line'], + 'lines': [ + ['wsrep_thread_count', 'threads', 'absolute'], + ] + }, 'userstats_cpu': { 'options': [None, 'Users CPU time', 'percentage', 'userstats', 'mysql.userstats_cpu', 'stacked'], 'lines': [] @@ -663,6 +734,59 @@ def userstats_chart_template(name): DEFAULT_REPL_CHANNEL = '' +# Write Set REPlication +# https://galeracluster.com/library/documentation/galera-status-variables.html +# https://www.percona.com/doc/percona-xtradb-cluster/LATEST/wsrep-status-index.html +class WSRepDataConverter: + unknown_value = -1 + + def convert(self, key, value): + if key == 'wsrep_connected': + return self.convert_connected(value) + elif key == 'wsrep_ready': + return self.convert_ready(value) + elif key == 'wsrep_cluster_status': + return self.convert_cluster_status(value) + return value + + def convert_connected(self, value): + # https://www.percona.com/doc/percona-xtradb-cluster/LATEST/wsrep-status-index.html#wsrep_connected + if value == 'OFF': + return 0 + if value == 'ON': + return 1 + return self.unknown_value + + def convert_ready(self, value): + # https://www.percona.com/doc/percona-xtradb-cluster/LATEST/wsrep-status-index.html#wsrep_ready + if value == 'OFF': + return 0 + if value == 'ON': + return 1 + return self.unknown_value + + def convert_cluster_status(self, value): + # https://www.percona.com/doc/percona-xtradb-cluster/LATEST/wsrep-status-index.html#wsrep_cluster_status + # https://github.com/codership/wsrep-API/blob/eab2d5d5a31672c0b7d116ef1629ff18392fd7d0/wsrep_api.h + # typedef enum wsrep_view_status { + # WSREP_VIEW_PRIMARY, //!< primary group configuration (quorum present) + # WSREP_VIEW_NON_PRIMARY, //!< non-primary group configuration (quorum lost) + # WSREP_VIEW_DISCONNECTED, //!< not connected to group, retrying. + # WSREP_VIEW_MAX + # } wsrep_view_status_t; + value = value.lower() + if value == 'primary': + return 0 + elif value == 'non-primary': + return 1 + elif value == 'disconnected': + return 2 + return self.unknown_value + + +wsrep_converter = WSRepDataConverter() + + class Service(MySQLService): def __init__(self, configuration=None, name=None): MySQLService.__init__(self, configuration=configuration, name=name) @@ -686,12 +810,9 @@ class Service(MySQLService): data = dict() if 'global_status' in raw_data: - global_status = dict(raw_data['global_status'][0]) - for key in GLOBAL_STATS: - if key in global_status: - data[key] = global_status[key] - if 'Threads_created' in data and 'Connections' in data: - data['Thread_cache_misses'] = round(int(data['Threads_created']) / float(data['Connections']) * 10000) + global_status = self.get_global_status(raw_data['global_status']) + if global_status: + data.update(global_status) if 'slave_status' in raw_data: status = self.get_slave_status(raw_data['slave_status']) @@ -712,6 +833,52 @@ class Service(MySQLService): return data or None + @staticmethod + def convert_wsrep(key, value): + return wsrep_converter.convert(key, value) + + def get_global_status(self, raw_global_status): + # ( + # ( + # ('Aborted_clients', '18'), + # ('Aborted_connects', '33'), + # ('Access_denied_errors', '80'), + # ('Acl_column_grants', '0'), + # ('Acl_database_grants', '0'), + # ('Acl_function_grants', '0'), + # ('wsrep_ready', 'OFF'), + # ('wsrep_rollbacker_thread_count', '0'), + # ('wsrep_thread_count', '0') + # ), + # ( + # ('Variable_name', 253, 60, 64, 64, 0, 0), + # ('Value', 253, 48, 2048, 2048, 0, 0), + # ) + # ) + rows = raw_global_status[0] + if not rows: + return + + global_status = dict(rows) + data = dict() + + for key in GLOBAL_STATS: + if key not in global_status: + continue + value = global_status[key] + data[key] = value + + for key in GALERA_STATS: + if key not in global_status: + continue + value = global_status[key] + value = self.convert_wsrep(key, value) + data[key] = value + + if 'Threads_created' in data and 'Connections' in data: + data['Thread_cache_misses'] = round(int(data['Threads_created']) / float(data['Connections']) * 10000) + return data + def get_slave_status(self, slave_status_data): rows, description = slave_status_data[0], slave_status_data[1] description_keys = [v[0] for v in description] @@ -742,41 +909,39 @@ class Service(MySQLService): self.add_new_charts(slave_status_chart_template, name) def get_userstats(self, raw_data): - # raw_data['user_statistics'] contains the following data structure: - # ( - # ( - # ('netdata', 42L, 0L, 1264L, 3.111252999999968, 2.968510299999994, 110267L, 19741424L, 0L, 0L, 1265L, 0L, - # 0L, 0L, 3L, 0L, 1301L, 0L, 0L, 7633L, 0L, 83L, 44L, 0L, 0L), - # ('root', 60L, 0L, 184L, 0.22856499999999966, 0.1601419999999998, 11605L, 1516513L, 0L, 9L, 220L, 0L, 2L, 1L, - # 6L, 4L,127L, 0L, 0L, 45L, 0L, 45L, 0L, 0L, 0L) - # ), - # ( - # ('User', 253, 9, 128, 128, 0, 0), - # ('Total_connections', 3, 2, 11, 11, 0, 0), - # ('Concurrent_connections', 3, 1, 11, 11, 0, 0), - # ('Connected_time', 3, 4, 11, 11, 0, 0), - # ('Busy_time', 5, 21, 21, 21, 31, 0), - # ('Cpu_time', 5, 18, 21, 21, 31, 0), - # ('Bytes_received', 8, 6, 21, 21, 0, 0), - # ('Bytes_sent', 8, 8, 21, 21, 0, 0), - # ('Binlog_bytes_written', 8, 1, 21, 21, 0, 0), - # ('Rows_read', 8, 1, 21, 21, 0, 0), - # ('Rows_sent', 8, 4, 21, 21, 0, 0), - # ('Rows_deleted', 8, 1, 21, 21, 0, 0), - # ('Rows_inserted', 8, 1, 21, 21, 0, 0), - # ('Rows_updated', 8, 1, 21, 21, 0, 0), - # ('Select_commands', 8, 1, 21, 21, 0, 0), - # ('Update_commands', 8, 1, 21, 21, 0, 0), - # ('Other_commands', 8, 4, 21, 21, 0, 0), - # ('Commit_transactions', 8, 1, 21, 21, 0, 0), - # ('Rollback_transactions', 8, 1, 21, 21, 0, 0), - # ('Denied_connections', 8, 4, 21, 21, 0, 0), - # ('Lost_connections', 8, 1, 21, 21, 0, 0), - # ('Access_denied', 8, 2, 21, 21, 0, 0), - # ('Empty_queries', 8, 2, 21, 21, 0, 0), - # ('Total_ssl_connections', 8, 1, 21, 21, 0, 0), - # ('Max_statement_time_exceeded', 8, 1, 21, 21, 0, 0)), - # ) + # ( + # ( + # ('netdata', 1L, 0L, 60L, 0.15842499999999984, 0.15767439999999996, 5206L, 963957L, 0L, 0L, + # 61L, 0L, 0L, 0L, 0L, 0L, 62L, 0L, 0L, 0L, 0L, 0L, 0L, 0L, 0L), + # ), + # ( + # ('User', 253, 7, 128, 128, 0, 0), + # ('Total_connections', 3, 2, 11, 11, 0, 0), + # ('Concurrent_connections', 3, 1, 11, 11, 0, 0), + # ('Connected_time', 3, 2, 11, 11, 0, 0), + # ('Busy_time', 5, 20, 21, 21, 31, 0), + # ('Cpu_time', 5, 20, 21, 21, 31, 0), + # ('Bytes_received', 8, 4, 21, 21, 0, 0), + # ('Bytes_sent', 8, 6, 21, 21, 0, 0), + # ('Binlog_bytes_written', 8, 1, 21, 21, 0, 0), + # ('Rows_read', 8, 1, 21, 21, 0, 0), + # ('Rows_sent', 8, 2, 21, 21, 0, 0), + # ('Rows_deleted', 8, 1, 21, 21, 0, 0), + # ('Rows_inserted', 8, 1, 21, 21, 0, 0), + # ('Rows_updated', 8, 1, 21, 21, 0, 0), + # ('Select_commands', 8, 2, 21, 21, 0, 0), + # ('Update_commands', 8, 1, 21, 21, 0, 0), + # ('Other_commands', 8, 2, 21, 21, 0, 0), + # ('Commit_transactions', 8, 1, 21, 21, 0, 0), + # ('Rollback_transactions', 8, 1, 21, 21, 0, 0), + # ('Denied_connections', 8, 1, 21, 21, 0, 0), + # ('Lost_connections', 8, 1, 21, 21, 0, 0), + # ('Access_denied', 8, 1, 21, 21, 0, 0), + # ('Empty_queries', 8, 2, 21, 21, 0, 0), + # ('Total_ssl_connections', 8, 1, 21, 21, 0, 0), + # ('Max_statement_time_exceeded', 8, 1, 21, 21, 0, 0) + # ) + # ) data = dict() userstats_vars = [e[0] for e in raw_data['user_statistics'][1]] for i, _ in enumerate(raw_data['user_statistics'][0]): diff --git a/collectors/python.d.plugin/python.d.conf b/collectors/python.d.plugin/python.d.conf index e2ee8eeec..65a5cba28 100644 --- a/collectors/python.d.plugin/python.d.conf +++ b/collectors/python.d.plugin/python.d.conf @@ -49,6 +49,7 @@ example: no # exim: yes # fail2ban: yes # freeradius: yes +# gearman: yes go_expvar: no # gunicorn_log has been replaced by web_log diff --git a/collectors/python.d.plugin/python.d.plugin.in b/collectors/python.d.plugin/python.d.plugin.in index 5b8b50a67..7aa48cbdd 100644 --- a/collectors/python.d.plugin/python.d.plugin.in +++ b/collectors/python.d.plugin/python.d.plugin.in @@ -1,7 +1,21 @@ #!/usr/bin/env bash '''':; -exec "$(command -v python || command -v python3 || command -v python2 || -echo "ERROR python IS NOT AVAILABLE IN THIS SYSTEM")" "$0" "$@" # ''' +pybinary=$(which python || which python3 || which python2) +filtered=() +for arg in "$@" +do + case $arg in + -p*) pybinary=${arg:2} + shift 1 ;; + *) filtered+=("$arg") ;; + esac +done +if [ "$pybinary" = "" ] +then + echo "ERROR python IS NOT AVAILABLE IN THIS SYSTEM" + exit 1 +fi +exec "$pybinary" "$0" "${filtered[@]}" # ''' # -*- coding: utf-8 -*- # Description: @@ -197,7 +211,7 @@ class ModuleConfig: return [v for v in self.config if isinstance(self.config.get(v), dict)] def single_job(self): - return [self.create_job(self.name)] + return [self.create_job(self.name, self.config)] def multi_job(self): return [self.create_job(n, self.config[n]) for n in self.job_names()] @@ -574,16 +588,16 @@ class Plugin: try: job.init() except Exception as error: - self.log.warning("{0}[{1}] : unhandled exception on init : {2}, skipping the job", - job.module_name, job.real_name, repr(error)) + self.log.warning("{0}[{1}] : unhandled exception on init : {2}, skipping the job".format( + job.module_name, job.real_name, repr(error))) job.status = JOB_STATUS_DROPPED continue try: ok = job.check() except Exception as error: - self.log.warning("{0}[{1}] : unhandled exception on check : {2}, skipping the job", - job.module_name, job.real_name, repr(error)) + self.log.warning("{0}[{1}] : unhandled exception on check : {2}, skipping the job".format( + job.module_name, job.real_name, repr(error))) job.status = JOB_STATUS_DROPPED continue if not ok: @@ -595,8 +609,8 @@ class Plugin: try: job.create() except Exception as error: - self.log.error("{0}[{1}] : unhandled exception on create : {2}, skipping the job", - job.module_name, job.real_name, repr(error)) + self.log.warning("{0}[{1}] : unhandled exception on create : {2}, skipping the job".format( + job.module_name, job.real_name, repr(error))) job.status = JOB_STATUS_DROPPED continue diff --git a/collectors/python.d.plugin/rabbitmq/README.md b/collectors/python.d.plugin/rabbitmq/README.md index 346cc23f7..1d7ad956d 100644 --- a/collectors/python.d.plugin/rabbitmq/README.md +++ b/collectors/python.d.plugin/rabbitmq/README.md @@ -1,6 +1,6 @@ # rabbitmq -Module monitor rabbitmq performance and health metrics. +This module monitors [RabbitMQ](https://www.rabbitmq.com/) performance and health metrics. Following charts are drawn: @@ -48,6 +48,20 @@ Following charts are drawn: - free disk space in gigabytes + +Per Vhost charts: + +1. **Vhost Messages** + + - ack + - confirm + - deliver + - get + - get_no_ack + - publish + - redeliver + - return_unroutable + ## configuration ```yaml diff --git a/collectors/python.d.plugin/rabbitmq/rabbitmq.chart.py b/collectors/python.d.plugin/rabbitmq/rabbitmq.chart.py index d947121d6..ad7dcce21 100644 --- a/collectors/python.d.plugin/rabbitmq/rabbitmq.chart.py +++ b/collectors/python.d.plugin/rabbitmq/rabbitmq.chart.py @@ -9,6 +9,7 @@ from bases.FrameworkServices.UrlService import UrlService API_NODE = 'api/nodes' API_OVERVIEW = 'api/overview' +API_VHOSTS = 'api/vhosts' NODE_STATS = [ 'fd_used', @@ -33,6 +34,17 @@ OVERVIEW_STATS = [ 'message_stats.publish' ] +VHOST_MESSAGE_STATS = [ + 'message_stats.ack', + 'message_stats.confirm', + 'message_stats.deliver', + 'message_stats.get', + 'message_stats.get_no_ack', + 'message_stats.publish', + 'message_stats.redeliver', + 'message_stats.return_unroutable', +] + ORDER = [ 'queued_messages', 'message_rates', @@ -111,6 +123,51 @@ CHARTS = { } +def vhost_chart_template(name): + order = [ + 'vhost_{0}_message_stats'.format(name), + ] + family = 'vhost {0}'.format(name) + + charts = { + order[0]: { + 'options': [ + None, 'Vhost "{0}" Messages'.format(name), 'messages/s', family, 'rabbitmq.vhost_messages', 'stacked'], + 'lines': [ + ['vhost_{0}_message_stats_ack'.format(name), 'ack', 'incremental'], + ['vhost_{0}_message_stats_confirm'.format(name), 'confirm', 'incremental'], + ['vhost_{0}_message_stats_deliver'.format(name), 'deliver', 'incremental'], + ['vhost_{0}_message_stats_get'.format(name), 'get', 'incremental'], + ['vhost_{0}_message_stats_get_no_ack'.format(name), 'get_no_ack', 'incremental'], + ['vhost_{0}_message_stats_publish'.format(name), 'publish', 'incremental'], + ['vhost_{0}_message_stats_redeliver'.format(name), 'redeliver', 'incremental'], + ['vhost_{0}_message_stats_return_unroutable'.format(name), 'return_unroutable', 'incremental'], + ] + }, + } + + return order, charts + + +class VhostStatsBuilder: + def __init__(self): + self.stats = None + + def set(self, raw_stats): + self.stats = raw_stats + + def name(self): + return self.stats['name'] + + def has_msg_stats(self): + return bool(self.stats.get('message_stats')) + + def msg_stats(self): + name = self.name() + stats = fetch_data(raw_data=self.stats, metrics=VHOST_MESSAGE_STATS) + return dict(('vhost_{0}_{1}'.format(name, k), v) for k, v in stats.items()) + + class Service(UrlService): def __init__(self, configuration=None, name=None): UrlService.__init__(self, configuration=configuration, name=name) @@ -122,63 +179,107 @@ class Service(UrlService): configuration.get('port', 15672), ) self.node_name = str() + self.vhost = VhostStatsBuilder() + self.collected_vhosts = set() def _get_data(self): data = dict() stats = self.get_overview_stats() - if not stats: return None data.update(stats) stats = self.get_nodes_stats() - if not stats: return None data.update(stats) + stats = self.get_vhosts_stats() + if stats: + data.update(stats) + return data or None def get_overview_stats(self): url = '{0}/{1}'.format(self.url, API_OVERVIEW) - + self.debug("doing http request to '{0}'".format(url)) raw = self._get_raw_data(url) - if not raw: return None data = loads(raw) - self.node_name = data['node'] + self.debug("found node name: '{0}'".format(self.node_name)) - return fetch_data(raw_data=data, metrics=OVERVIEW_STATS) + stats = fetch_data(raw_data=data, metrics=OVERVIEW_STATS) + self.debug("number of metrics: {0}".format(len(stats))) + return stats def get_nodes_stats(self): - url = '{0}/{1}/{2}'.format(self.url, API_NODE, self.node_name) + if self.node_name == "": + self.error("trying to get node stats, but node name is not set") + return None + url = '{0}/{1}/{2}'.format(self.url, API_NODE, self.node_name) + self.debug("doing http request to '{0}'".format(url)) raw = self._get_raw_data(url) - if not raw: return None data = loads(raw) + stats = fetch_data(raw_data=data, metrics=NODE_STATS) + self.debug("number of metrics: {0}".format(len(stats))) + return stats - return fetch_data(raw_data=data, metrics=NODE_STATS) + def get_vhosts_stats(self): + url = '{0}/{1}'.format(self.url, API_VHOSTS) + self.debug("doing http request to '{0}'".format(url)) + raw = self._get_raw_data(url) + if not raw: + return None + + data = dict() + vhosts = loads(raw) + charts_initialized = len(self.charts) > 0 + + for vhost in vhosts: + self.vhost.set(vhost) + if not self.vhost.has_msg_stats(): + continue + + if charts_initialized and self.vhost.name() not in self.collected_vhosts: + self.collected_vhosts.add(self.vhost.name()) + self.add_vhost_charts(self.vhost.name()) + + data.update(self.vhost.msg_stats()) + + self.debug("number of vhosts: {0}, metrics: {1}".format(len(vhosts), len(data))) + return data + + def add_vhost_charts(self, vhost_name): + order, charts = vhost_chart_template(vhost_name) + + for chart_name in order: + params = [chart_name] + charts[chart_name]['options'] + dimensions = charts[chart_name]['lines'] + + new_chart = self.charts.add_chart(params) + for dimension in dimensions: + new_chart.add_dimension(dimension) def fetch_data(raw_data, metrics): data = dict() - for metric in metrics: value = raw_data metrics_list = metric.split('.') try: for m in metrics_list: value = value[m] - except KeyError: + except (KeyError, TypeError): continue data['_'.join(metrics_list)] = value diff --git a/collectors/slabinfo.plugin/Makefile.am b/collectors/slabinfo.plugin/Makefile.am new file mode 100644 index 000000000..07796ea7b --- /dev/null +++ b/collectors/slabinfo.plugin/Makefile.am @@ -0,0 +1,14 @@ +# SPDX-License-Identifier: GPL-3.0-or-later + +AUTOMAKE_OPTIONS = subdir-objects +MAINTAINERCLEANFILES = $(srcdir)/Makefile.in +CLEANFILES = \ + slabinfo.plugin \ + $(NULL) + +include $(top_srcdir)/build/subst.inc +SUFFIXES = .in + +dist_noinst_DATA = \ + README.md \ + $(NULL) diff --git a/collectors/slabinfo.plugin/README.md b/collectors/slabinfo.plugin/README.md new file mode 100644 index 000000000..e21802397 --- /dev/null +++ b/collectors/slabinfo.plugin/README.md @@ -0,0 +1,22 @@ +# slabinfo.plugin + +SLAB is a cache mechanism used by the Kernel to avoid fragmentation. + +Each internal structure (process, file descriptor, inode...) is stored within a SLAB. + + +## configuring Netdata for slabinfo + +There is currently no configuration needed. + +As `/proc/slabinfo` is only readable by root, this plugin is setuid root. + +## For what use + +This slabinfo details allows to have clues on actions done on your system. +In the following screenshot, you can clearly see a `find` done on a ext4 filesystem (the number of `ext4_inode_cache` & `dentry` are rising fast), and a few seconds later, an admin issued a `echo 3 > /proc/sys/vm/drop_cached` as their count dropped. + +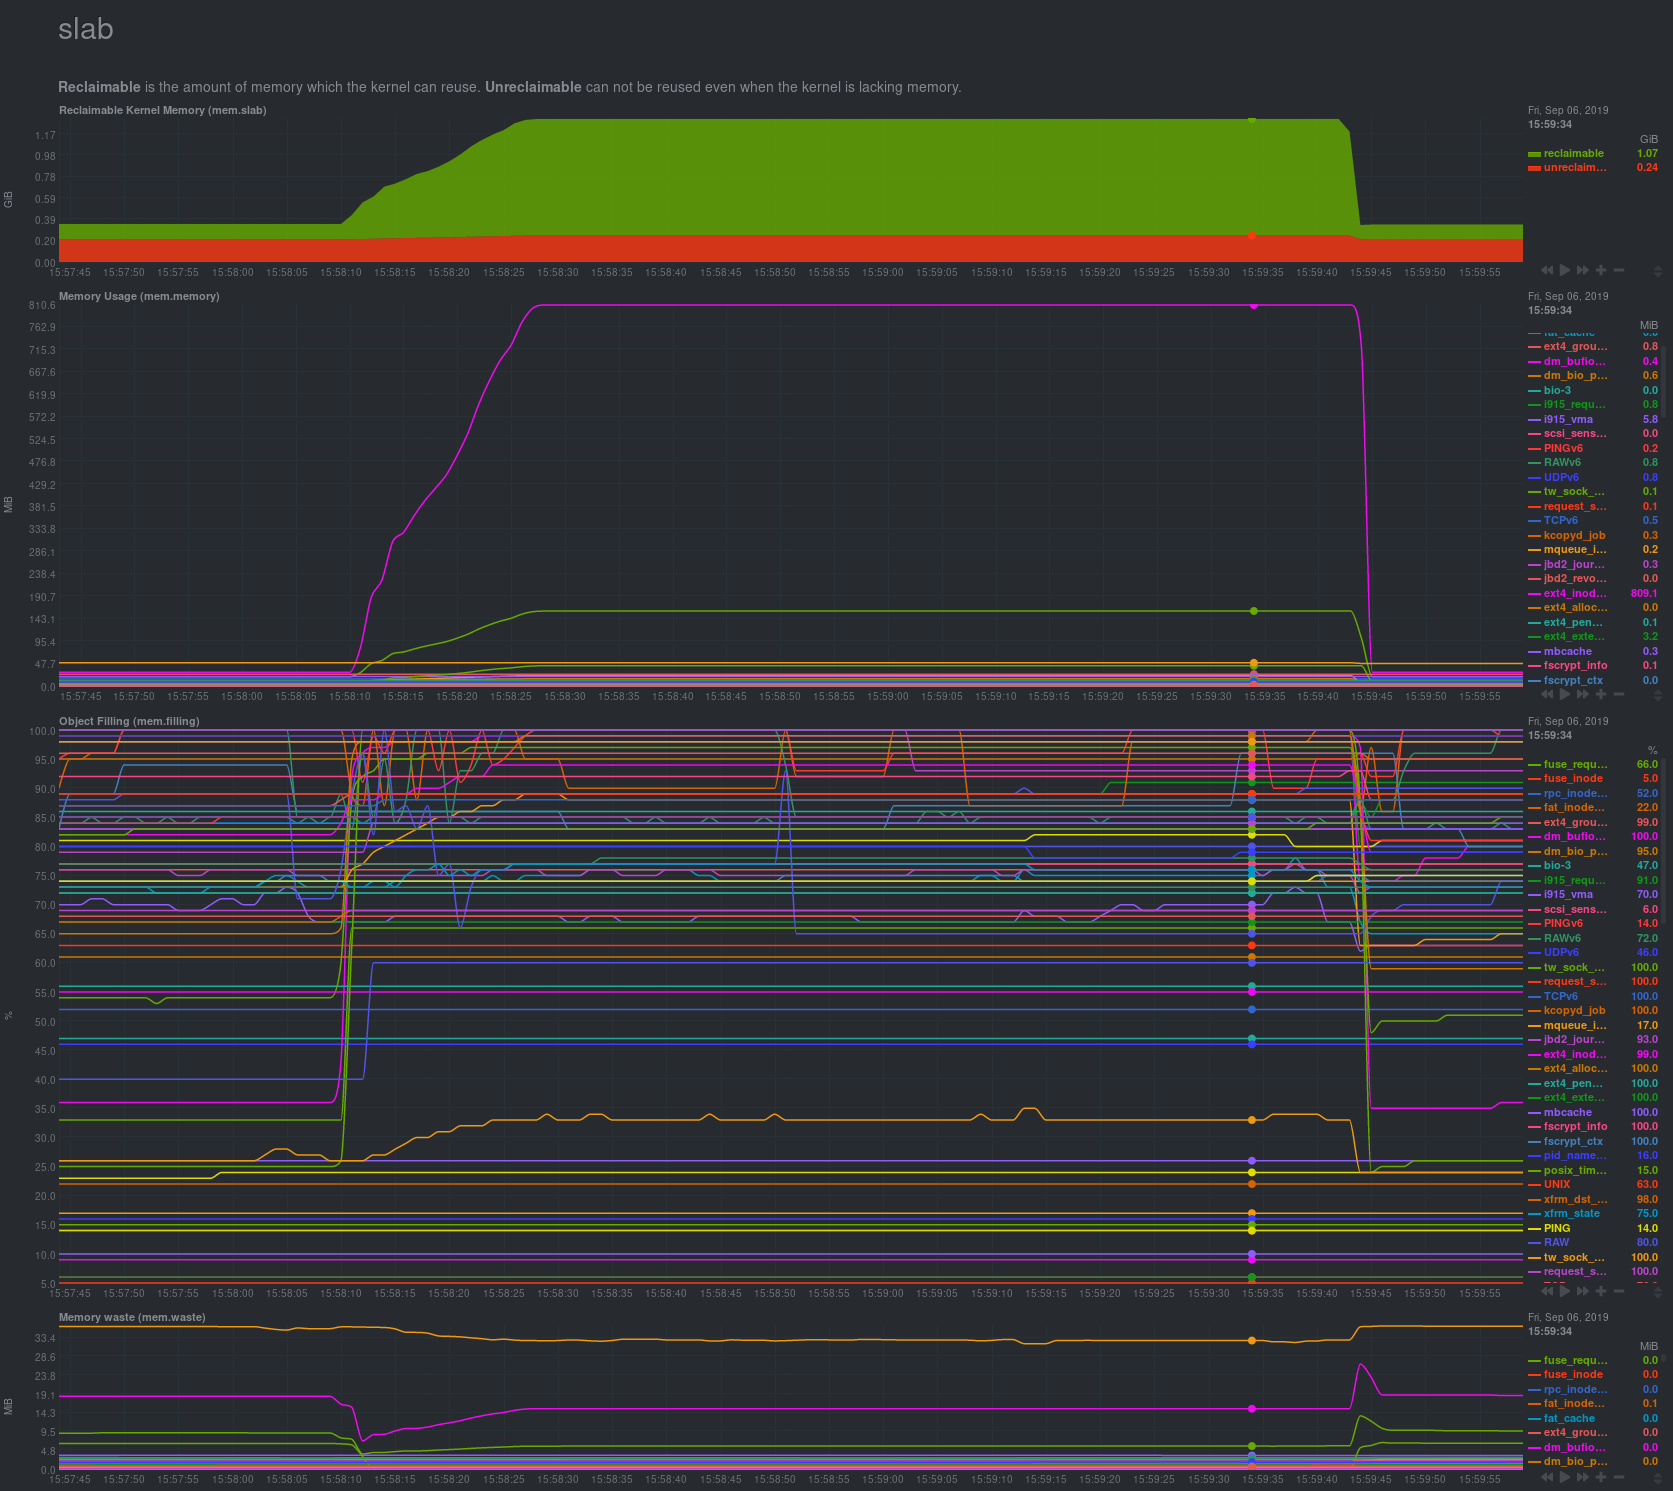 + + +[](<>) diff --git a/collectors/slabinfo.plugin/slabinfo.c b/collectors/slabinfo.plugin/slabinfo.c new file mode 100644 index 000000000..b92bc8ac2 --- /dev/null +++ b/collectors/slabinfo.plugin/slabinfo.c @@ -0,0 +1,418 @@ +// SPDX-License-Identifier: GPL-3.0-or-later + +#include "libnetdata/libnetdata.h" +#include "daemon/common.h" + +#define PLUGIN_SLABINFO_NAME "slabinfo.plugin" +#define PLUGIN_SLABINFO_PROCFILE "/proc/slabinfo" + +#define CHART_TYPE "mem" +#define CHART_FAMILY "slab" +#define CHART_PRIO 3000 + +// #define slabdebug(...) if (debug) { fprintf(stderr, __VA_ARGS__); } +#define slabdebug(args...) if (debug) { \ + fprintf(stderr, "slabinfo.plugin DEBUG (%04d@%-10.10s:%-15.15s)::", __LINE__, __FILE__, __FUNCTION__); \ + fprintf(stderr, ##args); \ + fprintf(stderr, "\n"); } + + +// ---------------------------------------------------------------------------- + +// callback required by fatal() +void netdata_cleanup_and_exit(int ret) { + exit(ret); +} + +void send_statistics(const char *action, const char *action_result, const char *action_data) { + (void) action; + (void) action_result; + (void) action_data; + return; +} + +// callbacks required by popen() +void signals_block(void) {}; +void signals_unblock(void) {}; +void signals_reset(void) {}; + +// callback required by eval() +int health_variable_lookup(const char *variable, uint32_t hash, struct rrdcalc *rc, calculated_number *result) { + (void)variable; + (void)hash; + (void)rc; + (void)result; + return 0; +}; + +// required by get_system_cpus() +char *netdata_configured_host_prefix = ""; + + +int running = 1; +int debug = 0; + +// ---------------------------------------------------------------------------- + +// Slabinfo format : +// format 2.1 Was provided by 57ed3eda977a215f054102b460ab0eb5d8d112e6 (2.6.24-rc6) as: +// seq_puts(m, "# name <active_objs> <num_objs> <objsize> <objperslab> <pagesperslab>"); +// seq_puts(m, " : tunables <limit> <batchcount> <sharedfactor>"); +// seq_puts(m, " : slabdata <active_slabs> <num_slabs> <sharedavail>"); +// +// With max values: +// seq_printf(m, "%-17s %6lu %6lu %6u %4u %4d", +// cache_name(s), sinfo.active_objs, sinfo.num_objs, s->size, sinfo.objects_per_slab, (1 << sinfo.cache_order)); +// seq_printf(m, " : tunables %4u %4u %4u", +// sinfo.limit, sinfo.batchcount, sinfo.shared); +// seq_printf(m, " : slabdata %6lu %6lu %6lu", +// sinfo.active_slabs, sinfo.num_slabs, sinfo.shared_avail); +// +// If CONFIG_DEBUG_SLAB is set, it will also add columns from slabinfo_show_stats (for SLAB only): +// seq_printf(m, " : globalstat %7lu %6lu %5lu %4lu %4lu %4lu %4lu %4lu %4lu", +// allocs, high, grown, reaped, errors, max_freeable, node_allocs, node_frees, overflows); +// seq_printf(m, " : cpustat %6lu %6lu %6lu %6lu", +// allochit, allocmiss, freehit, freemiss); +// +// Implementation choices: +// - Iterates through a linked list of kmem_cache. +// - Name is a char* from struct kmem_cache (mm/slab.h). +// - max name size found is 24: +// grep -roP 'kmem_cache_create\(".+"'| awk '{split($0,a,"\""); print a[2],length(a[2]); }' | sort -k2 -n +// - Using uint64 everywhere, as types fits and allows to use standard helpers + +struct slabinfo { + // procfile fields + const char *name; + uint64_t active_objs; + uint64_t num_objs; + uint64_t obj_size; + uint64_t obj_per_slab; + uint64_t pages_per_slab; + uint64_t tune_limit; + uint64_t tune_batchcnt; + uint64_t tune_shared_factor; + uint64_t data_active_slabs; + uint64_t data_num_slabs; + uint64_t data_shared_avail; + + // Calculated fields + uint64_t mem_usage; + uint64_t mem_waste; + uint8_t obj_filling; + + uint32_t hash; + struct slabinfo *next; +} *slabinfo_root = NULL, *slabinfo_next = NULL, *slabinfo_last_used = NULL; + +// The code is very inspired from "proc_net_dev.c" and "perf_plugin.c" + +// Get the existing object, or create a new one +static struct slabinfo *get_slabstruct(const char *name) { + struct slabinfo *s; + + slabdebug("--> Requested slabstruct %s", name); + + uint32_t hash = simple_hash(name); + + // Search it, from the next to the end + for (s = slabinfo_next; s; s = s->next) { + if ((hash = s->hash) && !strcmp(name, s->name)) { + slabdebug("<-- Found existing slabstruct after %s", slabinfo_last_used->name); + // Prepare the next run + slabinfo_next = s->next; + slabinfo_last_used = s; + return s; + } + } + + // Search it from the begining to the last position we used + for (s = slabinfo_root; s != slabinfo_last_used; s = s->next) { + if (hash == s->hash && !strcmp(name, s->name)) { + slabdebug("<-- Found existing slabstruct after root %s", slabinfo_root->name); + slabinfo_next = s->next; + slabinfo_last_used = s; + return s; + } + } + + // Create a new one + s = callocz(1, sizeof(struct slabinfo)); + s->name = strdupz(name); + s->hash = hash; + + // Add it to the current postion + if (slabinfo_root) { + slabdebug("<-- Creating new slabstruct after %s", slabinfo_last_used->name); + s->next = slabinfo_last_used->next; + slabinfo_last_used->next = s; + slabinfo_last_used = s; + } + else { + slabdebug("<-- Creating new slabstruct as root"); + slabinfo_root = slabinfo_last_used = s; + } + + return s; +} + + +// Read a full pass of slabinfo to update the structs +struct slabinfo *read_file_slabinfo() { + + slabdebug("-> Reading procfile %s", PLUGIN_SLABINFO_PROCFILE); + + static procfile *ff = NULL; + static long slab_pagesize = 0; + + if (unlikely(!slab_pagesize)) { + slab_pagesize = sysconf(_SC_PAGESIZE); + slabdebug(" Discovered pagesize: %ld", slab_pagesize); + } + + if(unlikely(!ff)) { + ff = procfile_reopen(ff, PLUGIN_SLABINFO_PROCFILE, " ,:" , PROCFILE_FLAG_DEFAULT); + if(unlikely(!ff)) { + error("<- Cannot open file '%s", PLUGIN_SLABINFO_PROCFILE); + exit(1); + } + } + + ff = procfile_readall(ff); + if(unlikely(!ff)) { + error("<- Cannot read file '%s'", PLUGIN_SLABINFO_PROCFILE); + exit(0); + } + + + // Iterate on all lines to populate / update the slabinfo struct + size_t lines = procfile_lines(ff), l; + + slabdebug(" Read %lu lines from procfile", (unsigned long)lines); + for(l = 2; l < lines; l++) { + if (unlikely(procfile_linewords(ff, l) < 14)) { + slabdebug(" Line %lu has only %lu words, skipping", (unsigned long)l, procfile_linewords(ff,l)); + continue; + } + + char *name = procfile_lineword(ff, l, 0); + struct slabinfo *s = get_slabstruct(name); + + s->active_objs = str2uint64_t(procfile_lineword(ff, l, 1)); + s->num_objs = str2uint64_t(procfile_lineword(ff, l, 2)); + s->obj_size = str2uint64_t(procfile_lineword(ff, l, 3)); + s->obj_per_slab = str2uint64_t(procfile_lineword(ff, l, 4)); + s->pages_per_slab = str2uint64_t(procfile_lineword(ff, l, 5)); + + s->tune_limit = str2uint64_t(procfile_lineword(ff, l, 7)); + s->tune_batchcnt = str2uint64_t(procfile_lineword(ff, l, 8)); + s->tune_shared_factor = str2uint64_t(procfile_lineword(ff, l, 9)); + + s->data_active_slabs = str2uint64_t(procfile_lineword(ff, l, 11)); + s->data_num_slabs = str2uint64_t(procfile_lineword(ff, l, 12)); + s->data_shared_avail = str2uint64_t(procfile_lineword(ff, l, 13)); + + uint32_t memperslab = s->pages_per_slab * slab_pagesize; + // Internal fragmentation: loss per slab, due to objects not being a multiple of pagesize + //uint32_t lossperslab = memperslab - s->obj_per_slab * s->obj_size; + + // Total usage = slabs * pages per slab * page size + s->mem_usage = (uint64_t)(s->data_num_slabs * memperslab); + + // Wasted memory (filling): slabs allocated but not filled: sum total slab - sum total objects + s->mem_waste = s->mem_usage - (uint64_t)(s->active_objs * s->obj_size); + //if (s->data_num_slabs > 1) + // s->mem_waste += s->data_num_slabs * lossperslab; + + + // Slab filling efficiency + if (s->num_objs > 0) + s->obj_filling = 100 * s->active_objs / s->num_objs; + else + s->obj_filling = 0; + + slabdebug(" Updated slab %s: %lu %lu %lu %lu %lu / %lu %lu %lu / %lu %lu %lu / %lu %lu %hhu", + name, s->active_objs, s->num_objs, s->obj_size, s->obj_per_slab, s->pages_per_slab, + s->tune_limit, s->tune_batchcnt, s->tune_shared_factor, + s->data_active_slabs, s->data_num_slabs, s->data_shared_avail, + s->mem_usage, s->mem_waste, s->obj_filling); + } + + return slabinfo_root; +} + + + +unsigned int do_slab_stats(int update_every) { + + static unsigned int loops = 0; + struct slabinfo *sactive = NULL, *s = NULL; + + // Main processing loop + while (running) { + + sactive = read_file_slabinfo(); + + // Init Charts + if (unlikely(loops == 0)) { + // Memory Usage + printf("CHART %s.%s '' 'Memory Usage' 'B' '%s' '' line %d %d %s\n" + , CHART_TYPE + , "slabmemory" + , CHART_FAMILY + , CHART_PRIO + , update_every + , PLUGIN_SLABINFO_NAME + ); + for (s = sactive; s; s = s->next) { + printf("DIMENSION %s '' absolute 1 1\n", s->name); + } + + // Slab active usage (filling) + printf("CHART %s.%s '' 'Object Filling' '%%' '%s' '' line %d %d %s\n" + , CHART_TYPE + , "slabfilling" + , CHART_FAMILY + , CHART_PRIO + 1 + , update_every + , PLUGIN_SLABINFO_NAME + ); + for (s = sactive; s; s = s->next) { + printf("DIMENSION %s '' absolute 1 1\n", s->name); + } + + // Memory waste + printf("CHART %s.%s '' 'Memory waste' 'B' '%s' '' line %d %d %s\n" + , CHART_TYPE + , "slabwaste" + , CHART_FAMILY + , CHART_PRIO + 2 + , update_every + , PLUGIN_SLABINFO_NAME + ); + for (s = sactive; s; s = s->next) { + printf("DIMENSION %s '' absolute 1 1\n", s->name); + } + } + + + // + // Memory usage + // + printf("BEGIN %s.%s\n" + , CHART_TYPE + , "slabmemory" + ); + for (s = sactive; s; s = s->next) { + printf("SET %s = %lu\n" + , s->name + , s->mem_usage + ); + } + printf("END\n"); + + // + // Slab active usage + // + printf("BEGIN %s.%s\n" + , CHART_TYPE + , "slabfilling" + ); + for (s = sactive; s; s = s->next) { + printf("SET %s = %u\n" + , s->name + , s->obj_filling + ); + } + printf("END\n"); + + // + // Memory waste + // + printf("BEGIN %s.%s\n" + , CHART_TYPE + , "slabwaste" + ); + for (s = sactive; s; s = s->next) { + printf("SET %s = %lu\n" + , s->name + , s->mem_waste + ); + } + printf("END\n"); + + + loops++; + + sleep(update_every); + } + + return loops; +} + + + + +// ---------------------------------------------------------------------------- +// main + +void usage(void) { + fprintf(stderr, "%s\n", program_name); + exit(1); +} + +int main(int argc, char **argv) { + + program_name = argv[0]; + program_version = "0.1"; + error_log_syslog = 0; + + int update_every = 1, i, n, freq = 0; + + for (i = 1; i < argc; i++) { + // Frequency parsing + if(isdigit(*argv[i]) && !freq) { + n = (int) str2l(argv[i]); + if (n > 0) { + if (n >= UPDATE_EVERY_MAX) { + error("Invalid interval value: %s", argv[i]); + exit(1); + } + freq = n; + } + } + else if (strcmp("debug", argv[i]) == 0) { + debug = 1; + continue; + } + else { + fprintf(stderr, + "netdata slabinfo.plugin %s\n" + "This program is a data collector plugin for netdata.\n" + "\n" + "Available command line options:\n" + "\n" + " COLLECTION_FREQUENCY data collection frequency in seconds\n" + " minimum: %d\n" + "\n" + " debug enable verbose output\n" + " default: disabled\n" + "\n", + program_version, + update_every + ); + exit(1); + } + } + + if(freq >= update_every) + update_every = freq; + else if(freq) + error("update frequency %d seconds is too small for slabinfo. Using %d.", freq, update_every); + + + // Call the main function. Time drift to be added + do_slab_stats(update_every); + + return 0; +} diff --git a/collectors/tc.plugin/README.md b/collectors/tc.plugin/README.md index 4095c6a3a..6e5306128 100644 --- a/collectors/tc.plugin/README.md +++ b/collectors/tc.plugin/README.md @@ -62,7 +62,7 @@ QoS is about 2 features: When your system is under a DDoS attack, it will get a lot more bandwidth compared to the one it can handle and probably your applications will crash. Setting a limit on the inbound traffic using QoS, will protect your servers (throttle the requests) and depending on the size of the attack may allow your legitimate users to access the server, while the attack is taking place. - Using QoS together with a [SYNPROXY](../proc.plugin/README.md#linux-anti-ddos) will provide a great degree of protection against most DDoS attacks. Actually when I wrote that article, a few folks tried to DDoS the Netdata demo site to see in real-time the SYNPROXY operation. They did not do it right, but anyway a great deal of requests reached the Netdata server. What saved Netdata was QoS. The Netdata demo server has QoS installed, so the requests were throttled and the server did not even reach the point of resource starvation. Read about it [here](../proc.plugin/README.md#linux-anti-ddos). + Using QoS together with a [SYNPROXY](../../collectors/proc.plugin/README.md) will provide a great degree of protection against most DDoS attacks. Actually when I wrote that article, a few folks tried to DDoS the Netdata demo site to see in real-time the SYNPROXY operation. They did not do it right, but anyway a great deal of requests reached the Netdata server. What saved Netdata was QoS. The Netdata demo server has QoS installed, so the requests were throttled and the server did not even reach the point of resource starvation. Read about it [here](../../collectors/proc.plugin/README.md). On top of all these, QoS is extremely light. You will configure it once, and this is it. It will not bother you again and it will not use any noticeable CPU resources, especially on application and database servers. |