
diff options
| author | Daniel Baumann <daniel.baumann@progress-linux.org> | 2023-02-06 16:11:34 +0000 |
|---|---|---|
| committer | Daniel Baumann <daniel.baumann@progress-linux.org> | 2023-02-06 16:11:34 +0000 |
| commit | d079b656b4719739b2247dcd9d46e9bec793095a (patch) | |
| tree | d2c950c70a776bcf697c963151c5bd959f8a9f03 /docs/cloud/insights | |
| parent | Releasing debian version 1.37.1-2. (diff) | |
| download | netdata-d079b656b4719739b2247dcd9d46e9bec793095a.tar.xz netdata-d079b656b4719739b2247dcd9d46e9bec793095a.zip | |
Merging upstream version 1.38.0.
Signed-off-by: Daniel Baumann <daniel.baumann@progress-linux.org>
Diffstat (limited to 'docs/cloud/insights')
| -rw-r--r-- | docs/cloud/insights/anomaly-advisor.mdx | 86 | ||||
| -rw-r--r-- | docs/cloud/insights/metric-correlations.md | 87 |
2 files changed, 173 insertions, 0 deletions
diff --git a/docs/cloud/insights/anomaly-advisor.mdx b/docs/cloud/insights/anomaly-advisor.mdx new file mode 100644 index 000000000..98a28d92c --- /dev/null +++ b/docs/cloud/insights/anomaly-advisor.mdx @@ -0,0 +1,86 @@ +--- +title: "Anomaly Advisor" +description: "Quickly find anomalous metrics anywhere in your infrastructure." +custom_edit_url: "https://github.com/netdata/netdata/blob/master/docs/cloud/insights/anomaly-advisor.mdx" +sidebar_label: "Anomaly Advisor" +learn_status: "Published" +learn_topic_type: "Tasks" +learn_rel_path: "Operations" +--- + +import ReactPlayer from 'react-player' + +The Anomaly Advisor feature lets you quickly surface potentially anomalous metrics and charts related to a particular highlight window of +interest. + +<ReactPlayer playing true controls true url='https://user-images.githubusercontent.com/24860547/165943403-1acb9759-7446-4704-8955-c566d04ad7ab.mp4' /> + +## Getting Started + +If you are running a Netdata version higher than `v1.35.0-29-nightly` you will be able to use the Anomaly Advisor out of the box with zero configuration. If you are on an earlier Netdata version you will need to first enable ML on your nodes by following the steps below. + +To enable the Anomaly Advisor you must first enable ML on your nodes via a small config change in `netdata.conf`. Once the anomaly detection models have trained on the Agent (with default settings this takes a couple of hours until enough data has been seen to train the models) you will then be able to enable the Anomaly Advisor feature in Netdata Cloud. + +### Enable ML on Netdata Agent + +To enable ML on your Netdata Agent, you need to edit the `[ml]` section in your `netdata.conf` to look something like the following example. + +```bash +[ml] + enabled = yes +``` + +At a minimum you just need to set `enabled = yes` to enable ML with default params. More details about configuration can be found in the [Netdata Agent ML docs](https://learn.netdata.cloud/docs/agent/ml#configuration). + +**Note**: Follow [this guide](https://github.com/netdata/netdata/blob/master/docs/guides/step-by-step/step-04.md) if you are unfamiliar with making configuration changes in Netdata. + +When you have finished your configuration, restart Netdata with a command like `sudo systemctl restart netdata` for the config changes to take effect. You can find more info on restarting Netdata [here](https://github.com/netdata/netdata/blob/master/docs/configure/start-stop-restart.md). + +After a brief delay, you should see the number of `trained` dimensions start to increase on the "dimensions" chart of the "Anomaly Detection" menu on the Overview page. By default the `minimum num samples to train = 3600` parameter means at least 1 hour of data is required to train initial models, but you could set this to `900` if you want to train initial models quicker but on less data. Over time, they will retrain on up to `maximum num samples to train = 14400` (4 hours by default), but you could increase this is you wanted to train on more data. + +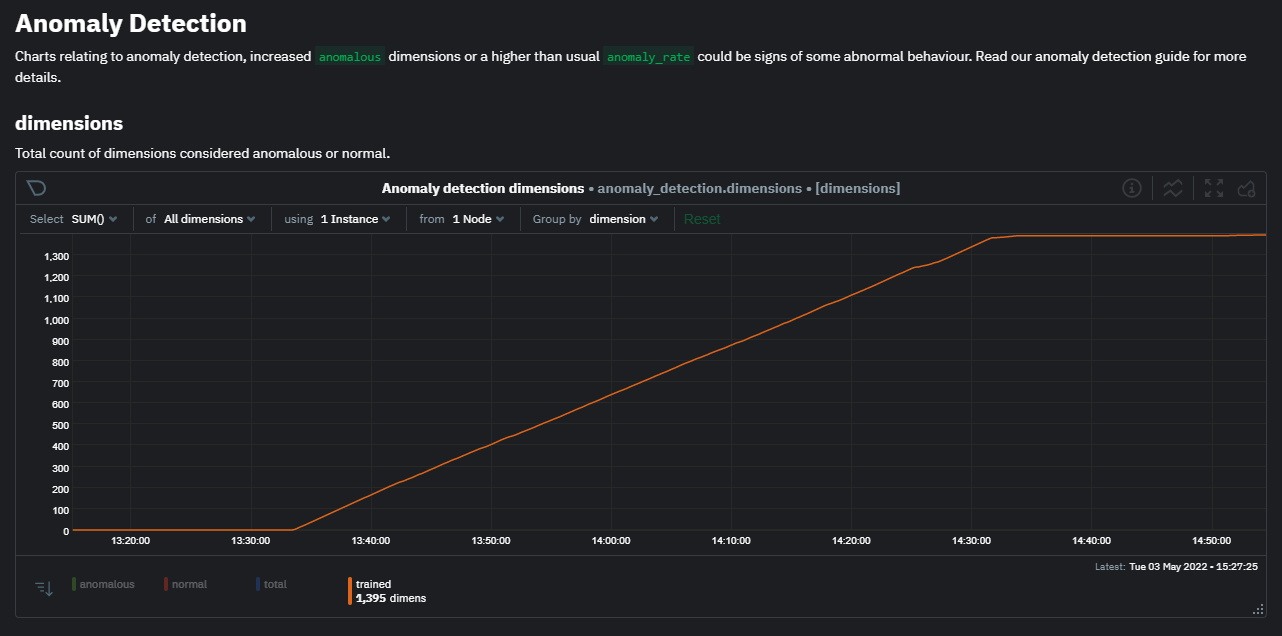 + +Once this line flattens out all configured metrics should have models trained and predicting anomaly scores each second, ready to be used by the new "anomalies" tab of the Anomaly Advisor. + +## Using Anomaly Advisor + +To use the Anomaly Advisor, go to the "anomalies" tab. Once you highlight a particular timeframe of interest, a selection of the most anomalous dimensions will appear below. + +The aim here is to surface the most anomalous metrics in the space or room for the highlighted window to try and cut down on the amount of manual searching required to get to the root cause of your issues. + +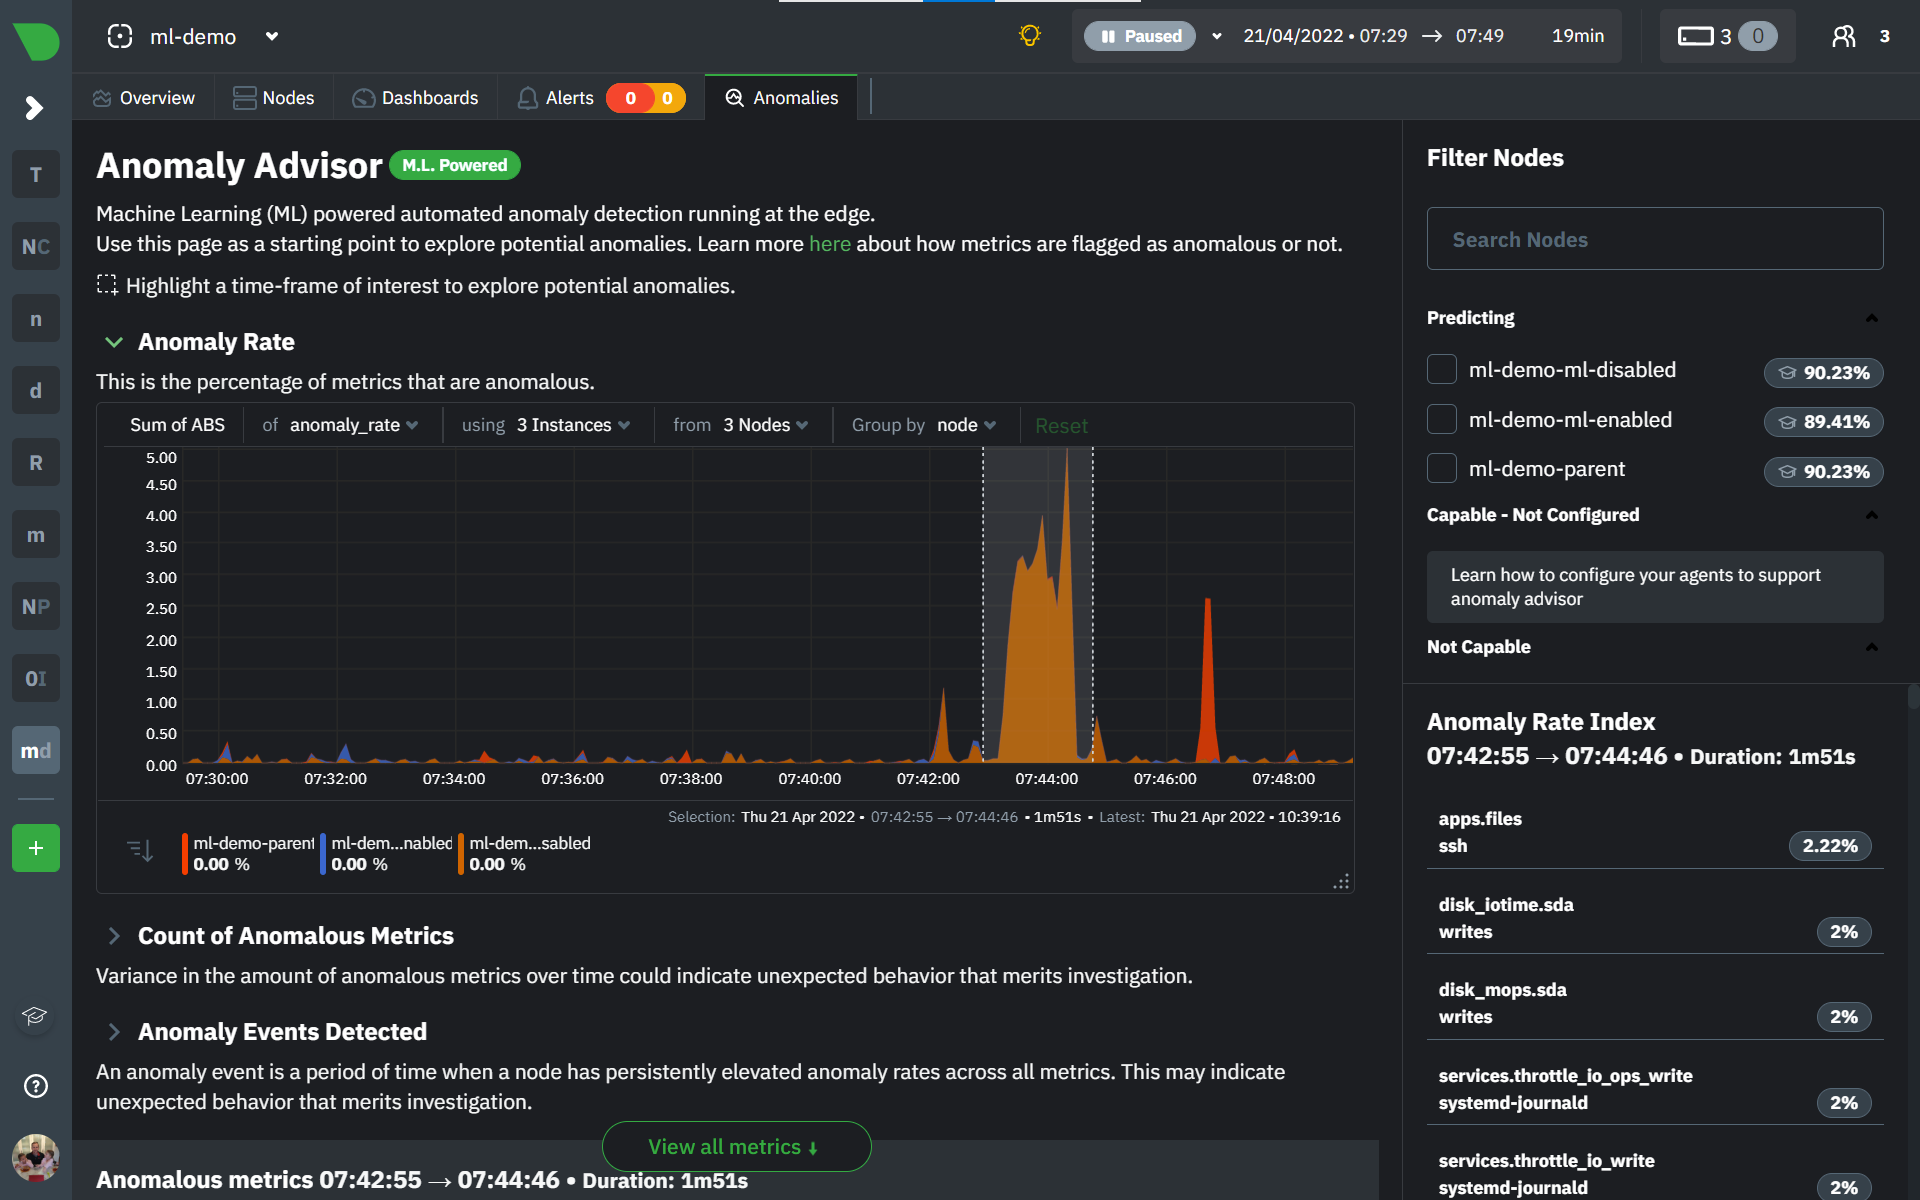 + +The "Anomaly Rate" chart shows the percentage of anomalous metrics over time per node. For example, in the following image, 3.21% of the metrics on the "ml-demo-ml-disabled" node were considered anomalous. This elevated anomaly rate could be a sign of something worth investigating. + +**Note**: in this example the anomaly rates for this node are actually being calculated on the parent it streams to, you can run ml on the Agent itselt or on a parent the Agent stream to. Read more about the various configuration options in the [Agent docs](https://github.com/netdata/netdata/blob/master/ml/README.md). + +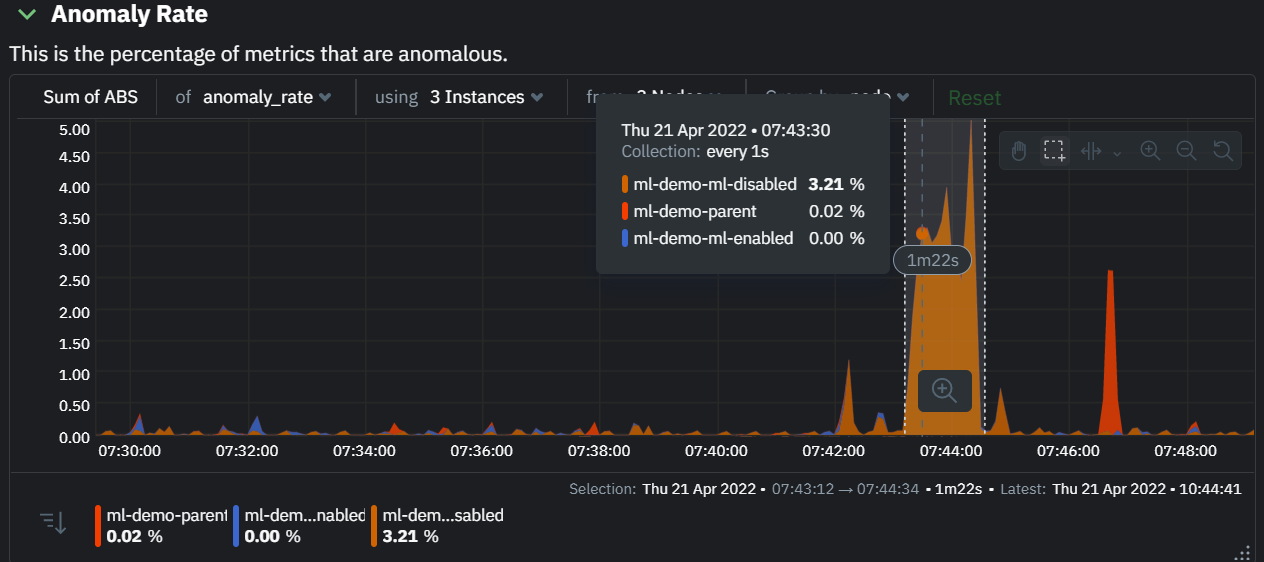 + +The "Count of Anomalous Metrics" chart (collapsed by default) shows raw counts of anomalous metrics per node so may often be similar to the anomaly rate chart, apart from where nodes may have different numbers of metrics. + +The "Anomaly Events Detected" chart (collapsed by default) shows if the anomaly rate per node was sufficiently elevated to trigger a node level anomaly. Anomaly events will appear slightly after the anomaly rate starts to increase in the timeline, this is because a significant number of metrics in the node need to be anomalous before an anomaly event is triggered. + +Once you have highlighted a window of interest, you should see an ordered list of anomaly rate sparklines in the "Anomalous metrics" section like below. + +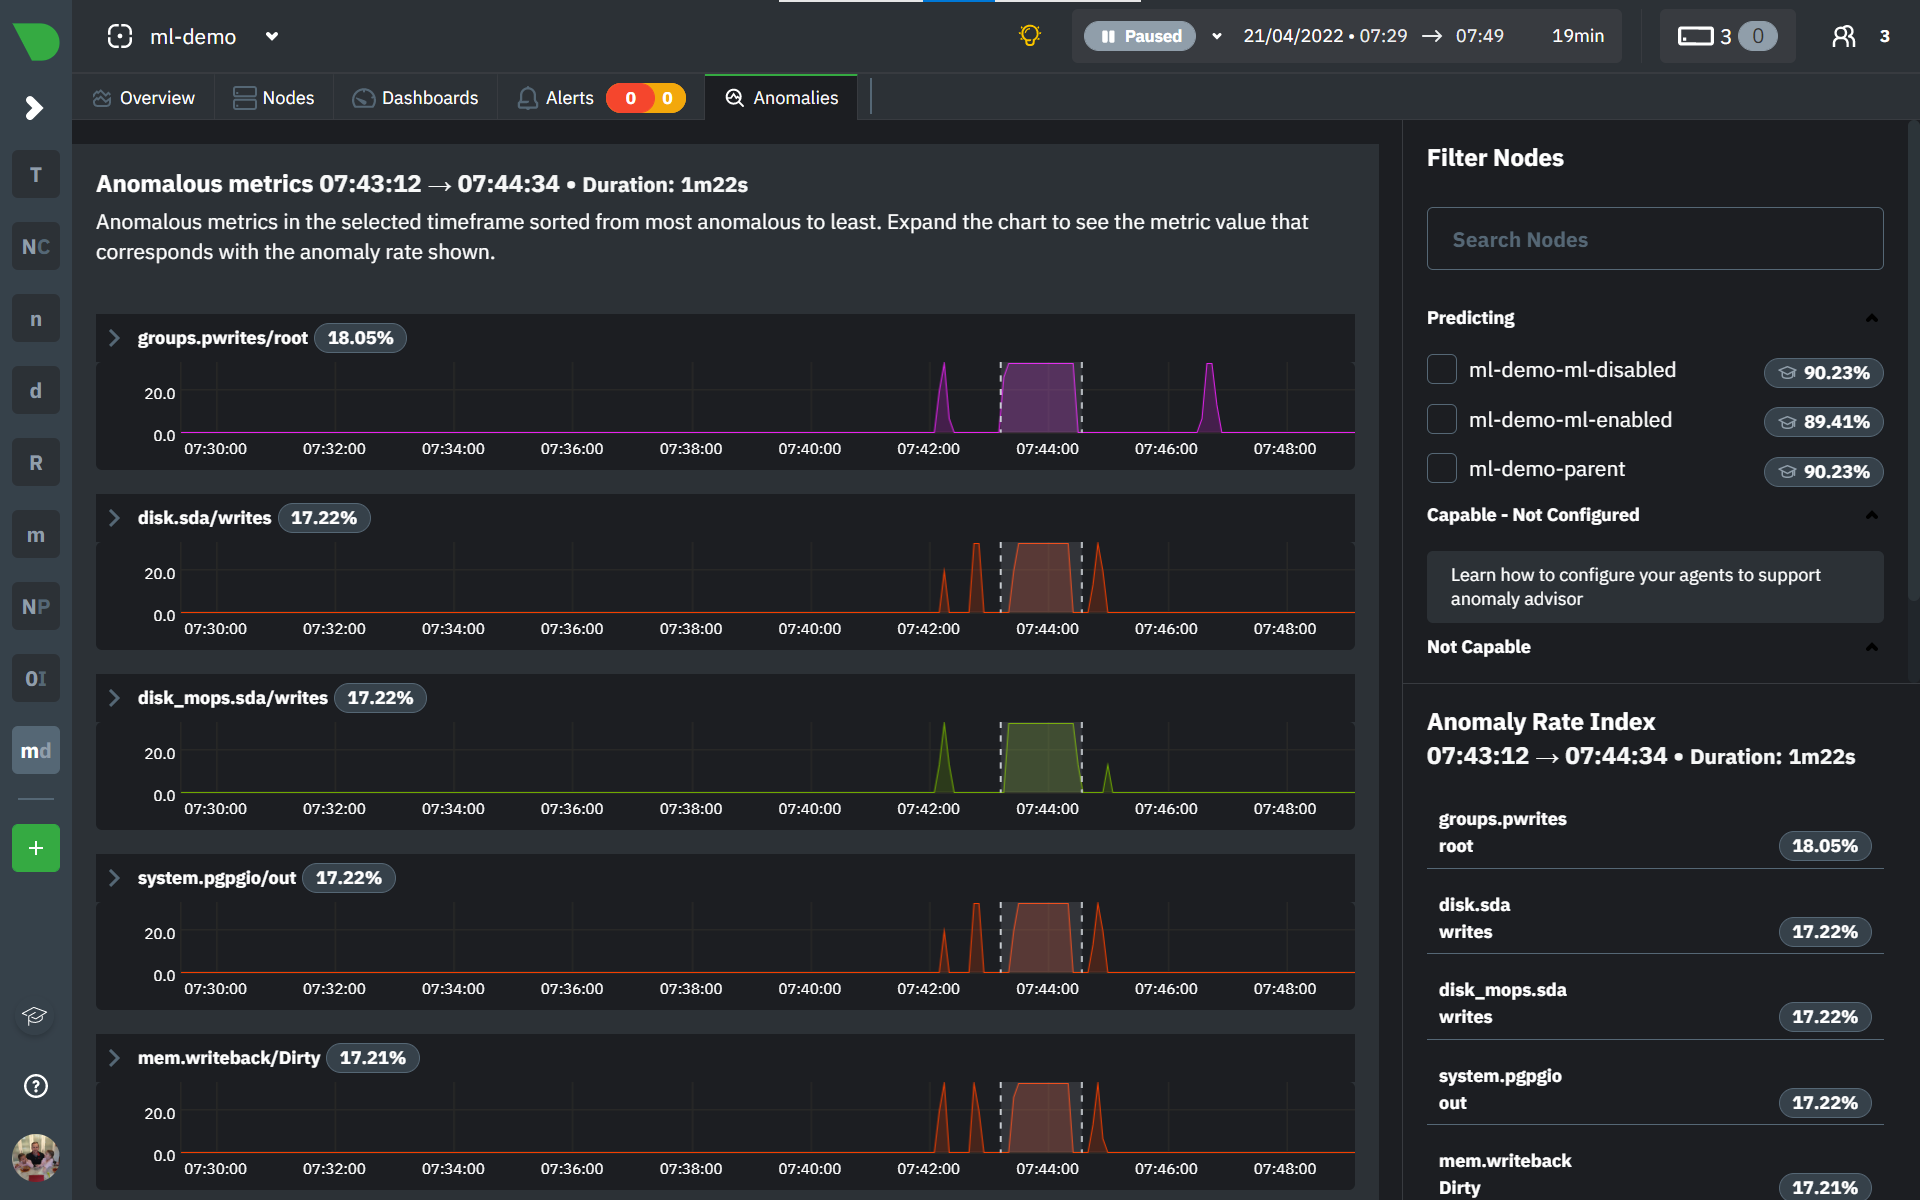 + +You can expand any sparkline chart to see the underlying raw data to see how it relates to the corresponding anomaly rate. + +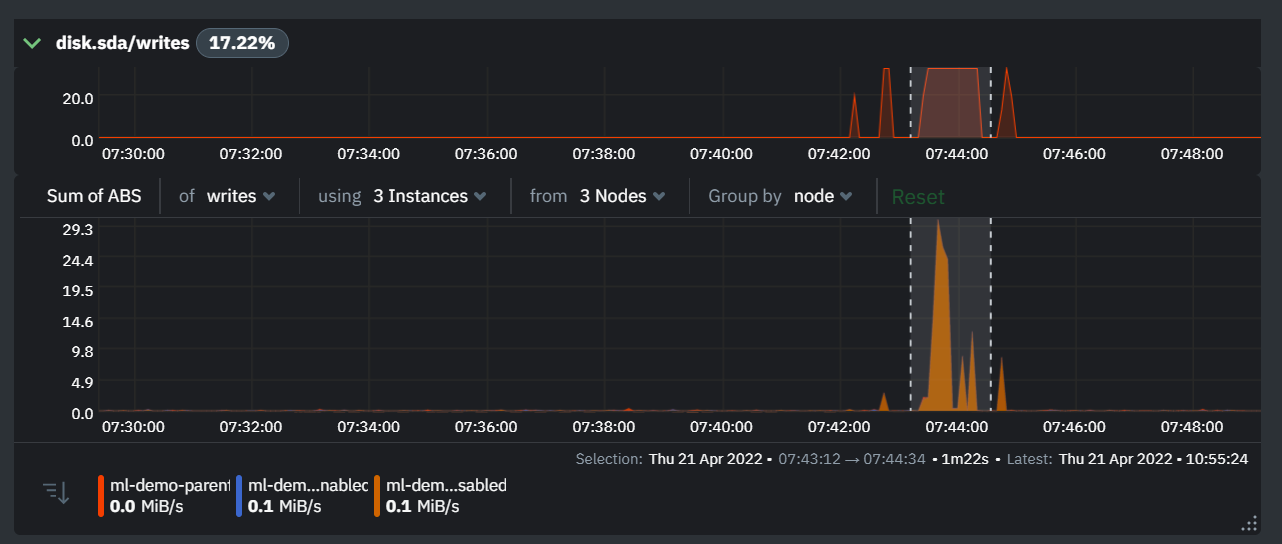 + +On the upper right hand side of the page you can select which nodes to filter on if you wish to do so. The ML training status of each node is also displayed. + +On the lower right hand side of the page an index of anomaly rates is displayed for the highlighted timeline of interest. The index is sorted from most anomalous metric (highest anomaly rate) to least (lowest anomaly rate). Clicking on an entry in the index will scroll the rest of the page to the corresponding anomaly rate sparkline for that metric. + +### Usage Tips + +- If you are interested in a subset of specific nodes then filtering to just those nodes before highlighting tends to give better results. This is because when you highlight a region, Netdata Cloud will ask the Agents for a ranking over all metrics so if you can filter this early to just the subset of nodes you are interested in, less 'averaging' will occur and so you might be a less noisy ranking. +- Ideally try and highlight close to a spike or window of interest so that the resulting ranking can narrow in more easily on the timeline you are interested in. + +You can read more detail on how anomaly detection in the Netdata Agent works in our [Agent docs](https://github.com/netdata/netdata/blob/master/ml/README.md). + +🚧 **Note**: This functionality is still **under active development** and considered experimental. We dogfood it internally and among early adopters within the Netdata community to build the feature. If you would like to get involved and help us with feedback, you can reach us through any of the following channels: +- Email us at analytics-ml-team@netdata.cloud +- Comment on the [beta launch post](https://community.netdata.cloud/t/anomaly-advisor-beta-launch/2717) in the Netdata community +- Join us in the [🤖-ml-powered-monitoring](https://discord.gg/4eRSEUpJnc) channel of the Netdata discord. +- Or open a discussion in GitHub if that's more your thing diff --git a/docs/cloud/insights/metric-correlations.md b/docs/cloud/insights/metric-correlations.md new file mode 100644 index 000000000..ce8835d34 --- /dev/null +++ b/docs/cloud/insights/metric-correlations.md @@ -0,0 +1,87 @@ +--- +title: "Metric Correlations" +description: "Quickly find metrics and charts closely related to a particular timeframe of interest anywhere in your infrastructure to discover the root cause faster." +custom_edit_url: "https://github.com/netdata/netdata/blob/master/docs/cloud/insights/metric-correlations.md" +sidebar_label: "Metric Correlations" +learn_status: "Published" +learn_topic_type: "Tasks" +learn_rel_path: "Operations" +--- + +The Metric Correlations (MC) feature lets you quickly find metrics and charts related to a particular window of interest that you want to explore further. By displaying the standard Netdata dashboard, filtered to show only charts that are relevant to the window of interest, you can get to the root cause sooner. + +Because Metric Correlations uses every available metric from your infrastructure, with as high as 1-second granularity, you get the most accurate insights using every possible metric. + +## Using Metric Correlations + +When viewing the overview or a single-node dashboard, the **Metric Correlations** button appears in the top right corner of the page. + +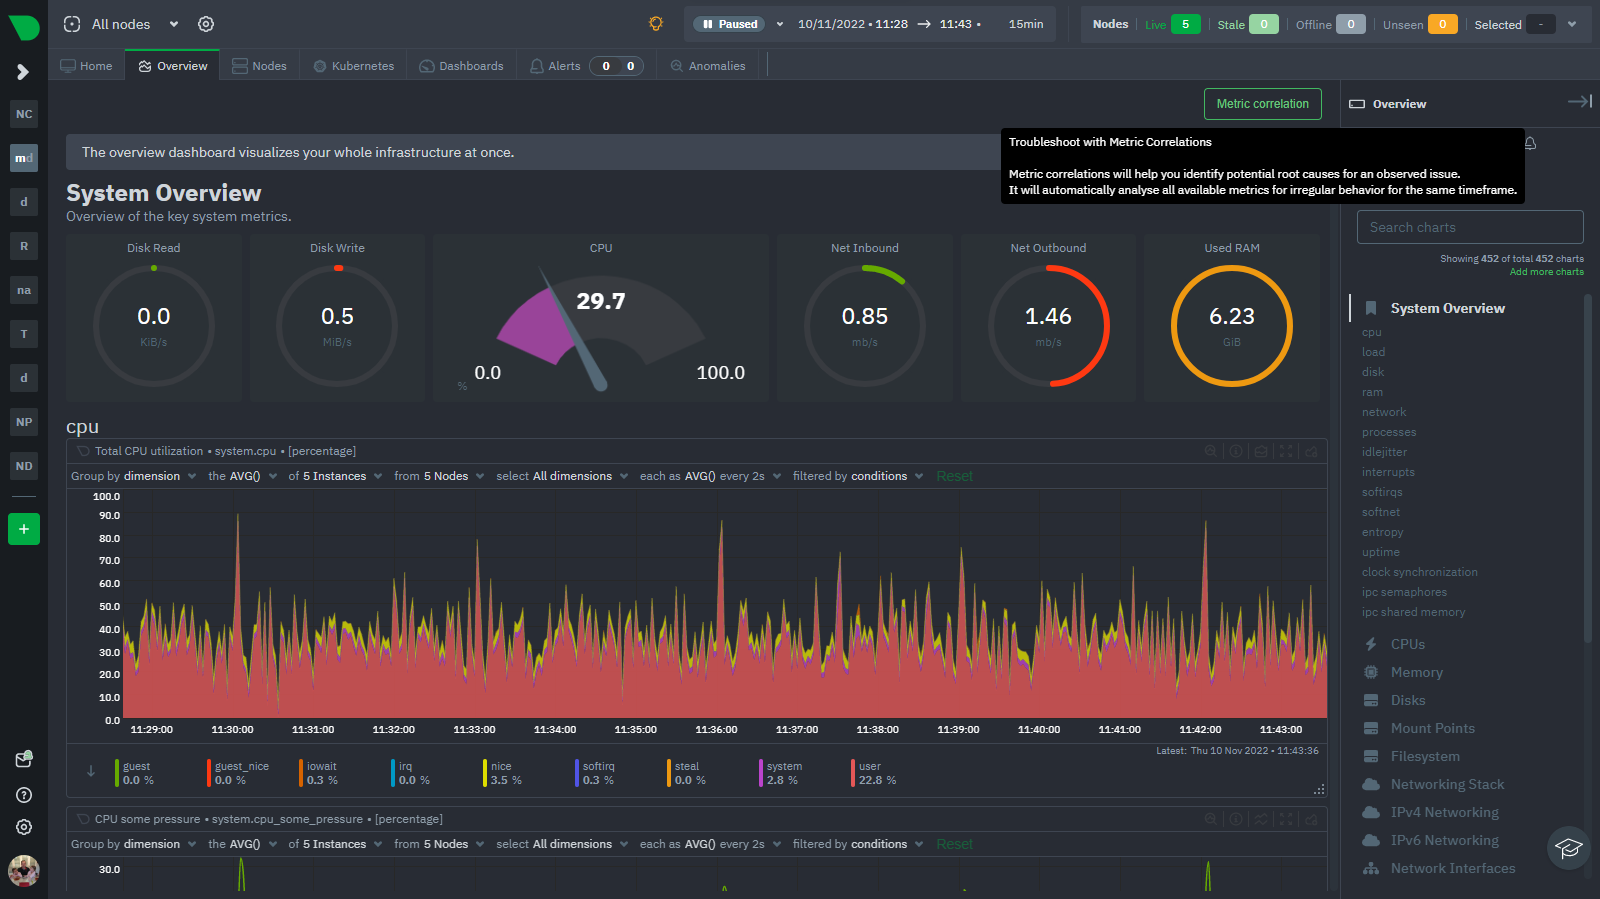 + +To start correlating metrics, click the **Metric Correlations** button, then hold the `Alt` key (or `⌘` on macOS) and click-and-drag a selection of metrics on a single chart. The selected timeframe needs to be at least 15 seconds for Metric Correlation to work. + +The menu then displays information about the selected area and reference baseline. Metric Correlations uses the reference baseline to discover which additional metrics are most closely connected to the selected metrics. The reference baseline is based upon the period immediately preceding the highlighted window and is the length of 4 times the highlighted window. This is to ensure that the reference baseline is always immediately before the highlighted window of interest and a bit longer so as to ensure it's a more representative short term baseline. + +Press the **Find Correlations** button to start up the correlations process, the button is only enabled when a valid timeframe is selected (at least 15 seconds). Once pressed, the process will score all available metrics on your nodes and return a filtered version of the Netdata dashboard. Now, you'll see only those metrics that have changed the most between a baseline window and the highlighted window you have selected. + +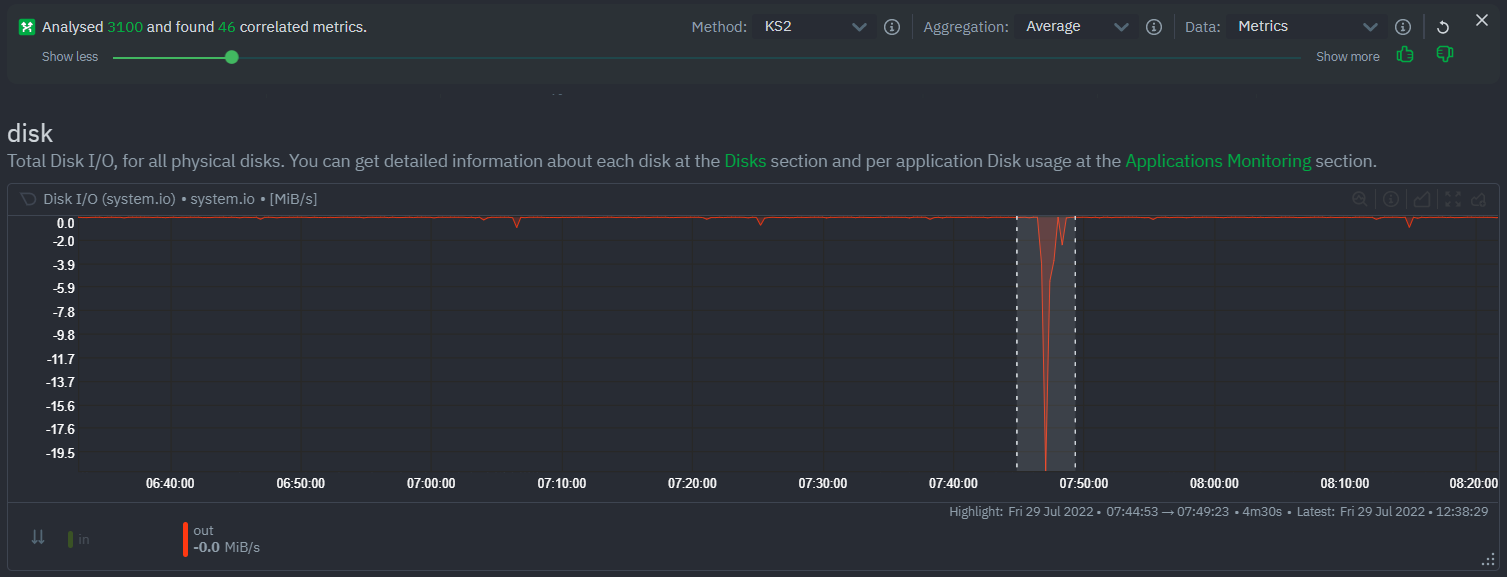 + +These charts are fully interactive, and whenever possible, will only show the _dimensions_ related to the timeline you selected. + +You can interact with all the scored metrics via the slider. Slide toward **show less** for more nuanced and significant results, or toward **show more** to "loosen" the threshold to explore other charts that may have changed too, but in a less significant manner. + +If you find something else interesting in the results, you can select another window and press **Find Correlations** again to kick the process off again. + +## Metric Correlations options + +MC enables a few input parameters that users can define to iteratively explore their data in different ways. As is usually the case in Machine Learning (ML), there is no "one size fits all" algorithm, what approach works best will typically depend on the type of data (which can be very different from one metric to the next) and even the nature of the event or incident you might be exploring in Netdata. + +So when you first run MC it will use the most sensible and general defaults. But you can also then vary any of the below options to explore further. + +### Method + +There are two algorithms available that aim to score metrics based on how much they have changed between the baseline and highlight windows. + +- `KS2` - A statistical test ([Two-sample Kolmogorov Smirnov](https://en.wikipedia.org/wiki/Kolmogorov%E2%80%93Smirnov_test#Two-sample_Kolmogorov%E2%80%93Smirnov_test)) comparing the distribution of the highlighted window to the baseline to try and quantify which metrics have most evidence of a significant change. You can explore our implementation [here](https://github.com/netdata/netdata/blob/d917f9831c0a1638ef4a56580f321eb6c9a88037/database/metric_correlations.c#L212). +- `Volume` - A heuristic measure based on the percentage change in averages between highlighted window and baseline, with various edge cases sensibly controlled for. You can explore our implementation [here](https://github.com/netdata/netdata/blob/d917f9831c0a1638ef4a56580f321eb6c9a88037/database/metric_correlations.c#L516). + +### Aggregation + +Behind the scenes, Netdata will aggregate the raw data as needed such that arbitrary window lengths can be selected for MC. By default, Netdata will just `Average` raw data when needed as part of pre-processing. However other aggregations like `Median`, `Min`, `Max`, `Stddev` are also possible. + +### Data + +Netdata is different from typical observability agents since, in addition to just collecting raw metric values, it will by default also assign an "[Anomaly Bit](/docs/agent/ml#anomaly-bit)" related to each collected metric each second. This bit will be 0 for "normal" and 1 for "anomalous". This means that each metric also natively has an "[Anomaly Rate](/docs/agent/ml#anomaly-rate)" associated with it and, as such, MC can be run against the raw metric values or their corresponding anomaly rates. + +**Note**: Read more [here](https://github.com/netdata/netdata/blob/master/docs/guides/monitor/anomaly-detection.md) to learn more about the native anomaly detection features within netdata. + +- `Metrics` - Run MC on the raw metric values. +- `Anomaly Rate` - Run MC on the corresponding anomaly rate for each metric. + +## Metric Correlations on the agent + +As of `v1.35.0` Netdata is able to run the Metric Correlations algorithm ([Two Sample Kolmogorov-Smirnov test](https://en.wikipedia.org/wiki/Kolmogorov%E2%80%93Smirnov_test#Two-sample_Kolmogorov%E2%80%93Smirnov_test)) on the agent itself. This avoids sending the underlying raw data to the original Netdata Cloud based microservice and so typically will be much much faster as no data moves around and the computation happens instead on the agent. + +When a Metric Correlations request is made to Netdata Cloud, if any node instances have MC enabled then the request will be routed to the node instance with the highest hops (e.g. a parent node if one is found or the node itself if not). If no node instances have MC enabled then the request will be routed to the original Netdata Cloud based service which will request input data from the nodes and run the computation within the Netdata Cloud backend. + +#### Enabling/Disabling Metric Correlations on the agent + +As of `v1.35.0-22-nightly` Metric Correlation has been enabled by default on all agents. After further optimizations to the implementation, the impact of running the metric correlations algorithm on the agent was less than the impact of preparing all the data to send to cloud for MC to run in the cloud, as such running MC on the agent is less impactful on local resources than running via cloud. + +Should you still want to, disabling nodes for Metric Correlation on the agent is a simple one line config change. Just set `enable metric correlations = no` in the `[global]` section of `netdata.conf` + +## Usage tips! + +- When running Metric Correlations from the [Overview tab](https://learn.netdata.cloud/docs/cloud/visualize/overview#overview) across multiple nodes, you might find better results if you iterate on the initial results by grouping by node to then filter to nodes of interest and run the Metric Correlations again. So a typical workflow in this case would be to: + - If unsure which nodes you are interested in then run MC on all nodes. + - Within the initial results returned group the most interesting chart by node to see if the changes are across all nodes or a subset of nodes. + - If you see a subset of nodes clearly jump out when you group by node, then filter for just those nodes of interest and run the MC again. This will result in less aggregation needing to be done by Netdata and so should help give clearer results as you interact with the slider. +- Use the `Volume` algorithm for metrics with a lot of gaps (e.g. request latency when there are few requests), otherwise stick with `KS2` + - By default, Netdata uses the `KS2` algorithm which is a tried and tested method for change detection in a lot of domains. The [Wikipedia](https://en.wikipedia.org/wiki/Kolmogorov%E2%80%93Smirnov_test) article gives a good overview of how this works. Basically, it is comparing, for each metric, its cumulative distribution in the highlight window with its cumulative distribution in the baseline window. The statistical test then seeks to quantify the extent to which we can say these two distributions look similar enough to be considered the same or not. The `Volume` algorithm is a bit more simple than `KS2` in that it basically compares (with some edge cases sensibly handled) the average value of the metric across baseline and highlight and looks at the percentage change. Often both `KS2` and `Volume` will have significant agreement and return similar metrics. + - `Volume` might favour picking up more sparse metrics that were relatively flat and then came to life with some spikes (or vice versa). This is because for such metrics that just don't have that many different values in them, it is impossible to construct a cumulative distribution that can then be compared. So `Volume` might be useful in spotting examples of metrics turning on or off. 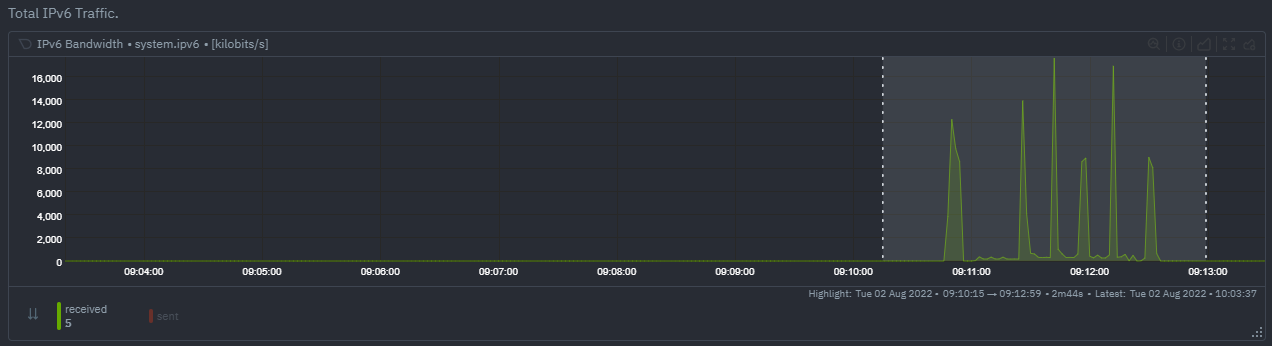 + - `KS2` since it relies on the full distribution might be better at highlighting more complex changes that `Volume` is unable to capture. For example a change in the variation of a metric might be picked up easily by `KS2` but missed (or just much lower scored) by `Volume` since the averages might remain not all that different between baseline and highlight even if their variance has changed a lot. 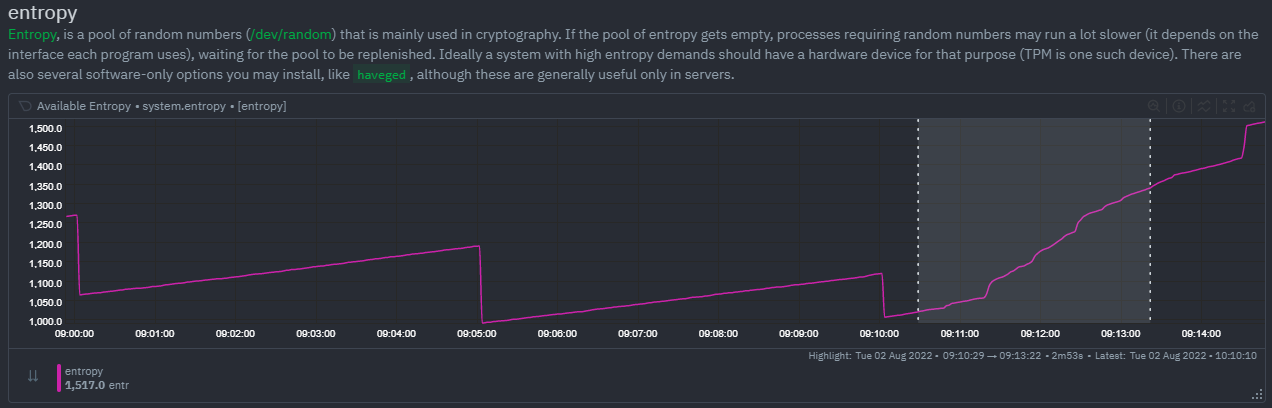 +- Use `Volume` and `Anomaly Rate` together to ask what metrics have turned most anomalous from baseline to highlighted window. You can expand the embedded anomaly rate chart once you have results to see this more clearly. 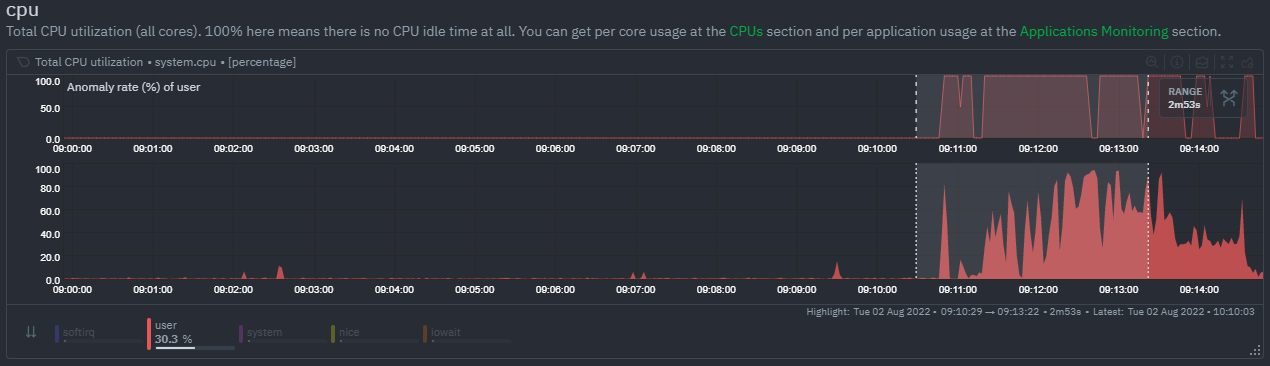 + +## What's next? + +You can read more about all the ML powered capabilities of Netdata [here](https://github.com/netdata/netdata/blob/master/docs/guides/monitor/anomaly-detection.md). If you aren't yet familiar with the power of Netdata Cloud's visualization features, check out the [Nodes view](https://github.com/netdata/netdata/blob/master/docs/cloud/visualize/nodes.md) and learn how to [build new dashboards](https://github.com/netdata/netdata/blob/master/docs/cloud/visualize/dashboards.md). |