diff options
| author | Daniel Baumann <daniel.baumann@progress-linux.org> | 2024-08-26 08:15:24 +0000 |
|---|---|---|
| committer | Daniel Baumann <daniel.baumann@progress-linux.org> | 2024-08-26 08:15:35 +0000 |
| commit | f09848204fa5283d21ea43e262ee41aa578e1808 (patch) | |
| tree | c62385d7adf209fa6a798635954d887f718fb3fb /docs/developer-and-contributor-corner | |
| parent | Releasing debian version 1.46.3-2. (diff) | |
| download | netdata-f09848204fa5283d21ea43e262ee41aa578e1808.tar.xz netdata-f09848204fa5283d21ea43e262ee41aa578e1808.zip | |
Merging upstream version 1.47.0.
Signed-off-by: Daniel Baumann <daniel.baumann@progress-linux.org>
Diffstat (limited to 'docs/developer-and-contributor-corner')
7 files changed, 28 insertions, 31 deletions
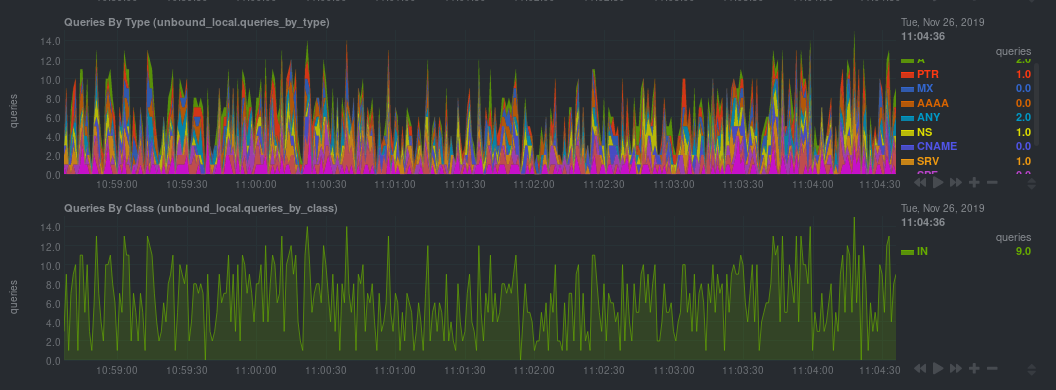
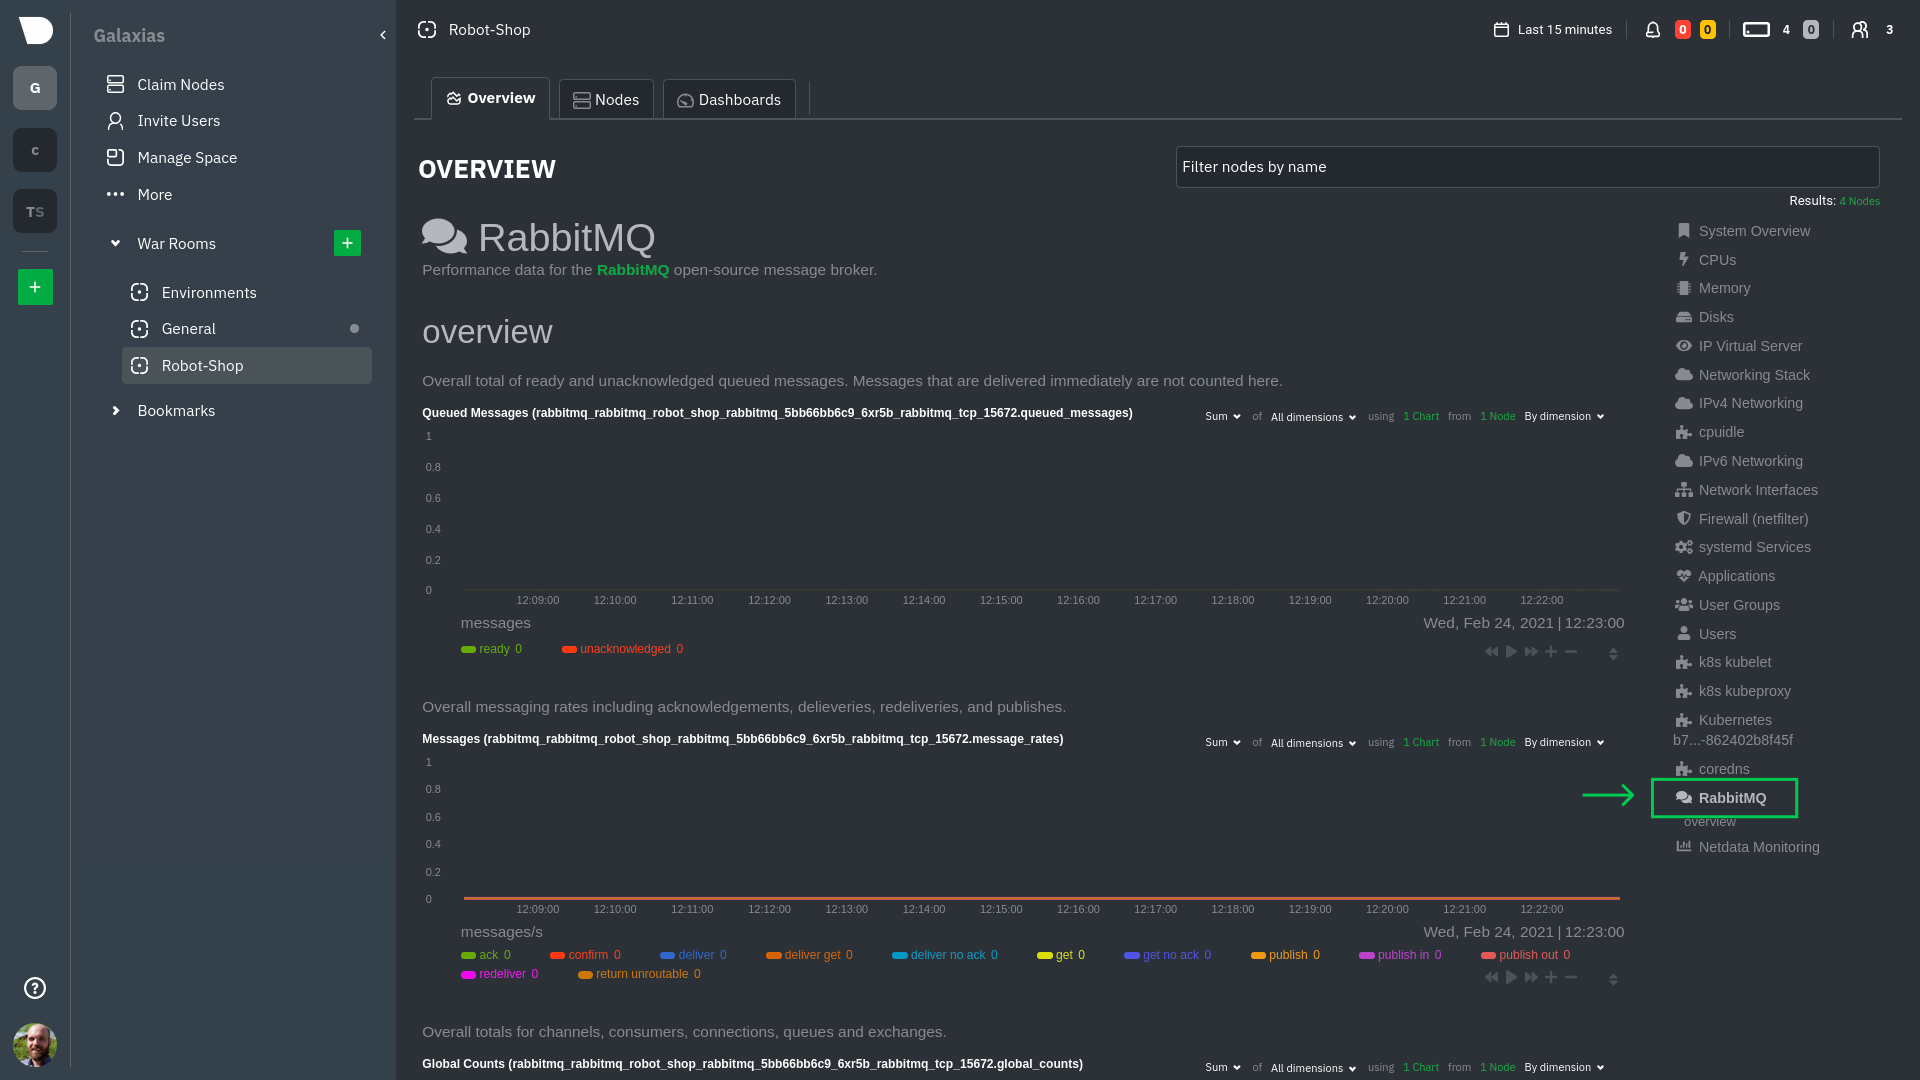
diff --git a/docs/developer-and-contributor-corner/collect-apache-nginx-web-logs.md b/docs/developer-and-contributor-corner/collect-apache-nginx-web-logs.md index 206c1e8ee..55af82fb7 100644 --- a/docs/developer-and-contributor-corner/collect-apache-nginx-web-logs.md +++ b/docs/developer-and-contributor-corner/collect-apache-nginx-web-logs.md @@ -8,7 +8,7 @@ You can use the [LTSV log format](http://ltsv.org/), track TLS and cipher usage, ever. In one test on a system with SSD storage, the collector consistently parsed the logs for 200,000 requests in 200ms, using ~30% of a single core. -The [web_log](/src/go/collectors/go.d.plugin/modules/weblog/README.md) collector is currently compatible +The [web_log](/src/go/plugin/go.d/modules/weblog/README.md) collector is currently compatible with [Nginx](https://nginx.org/en/) and [Apache](https://httpd.apache.org/). This guide will walk you through using the new Go-based web log collector to turn the logs these web servers @@ -91,7 +91,7 @@ The web log collector is capable of parsing custom Nginx and Apache log formats leave that topic for a separate guide. We do have [extensive -documentation](/src/go/collectors/go.d.plugin/modules/weblog/README.md#custom-log-format) on how +documentation](/src/go/plugin/go.d/modules/weblog/README.md#custom-log-format) on how to build custom parsing for Nginx and Apache logs. ## Tweak web log collector alerts diff --git a/docs/developer-and-contributor-corner/collect-unbound-metrics.md b/docs/developer-and-contributor-corner/collect-unbound-metrics.md index 0f80395fb..ac997b7f9 100644 --- a/docs/developer-and-contributor-corner/collect-unbound-metrics.md +++ b/docs/developer-and-contributor-corner/collect-unbound-metrics.md @@ -58,9 +58,7 @@ configuring the collector. You may not need to do any more configuration to have Netdata collect your Unbound metrics. If you followed the steps above to enable `remote-control` and make your Unbound files readable by Netdata, that should -be enough. Restart Netdata with `sudo systemctl restart netdata`, or the [appropriate -method](/packaging/installer/README.md#maintaining-a-netdata-agent-installation) for your system. You should see Unbound metrics in your Netdata -dashboard! +be enough. Restart Netdata with `sudo systemctl restart netdata`, or the appropriate method for your system. You should see Unbound metrics in your Netdata dashboard!  @@ -93,7 +91,7 @@ jobs: tls_skip_verify: yes tls_cert: /path/to/unbound_control.pem tls_key: /path/to/unbound_control.key - + - name: local address: 127.0.0.1:8953 cumulative: yes @@ -101,16 +99,15 @@ jobs: ``` Netdata will attempt to read `unbound.conf` to get the appropriate `address`, `cumulative`, `use_tls`, `tls_cert`, and -`tls_key` parameters. +`tls_key` parameters. -Restart Netdata with `sudo systemctl restart netdata`, or the [appropriate -method](/packaging/installer/README.md#maintaining-a-netdata-agent-installation) for your system. +Restart Netdata with `sudo systemctl restart netdata`, or the appropriate method for your system. ### Manual setup for a remote Unbound server Collecting metrics from remote Unbound servers requires manual configuration. There are too many possibilities to cover all remote connections here, but the [default `unbound.conf` -file](https://github.com/netdata/netdata/blob/master/src/go/collectors/go.d.plugin/config/go.d/unbound.conf) contains a few useful examples: +file](https://github.com/netdata/netdata/blob/master/src/go/plugin/go.d/config/go.d/unbound.conf) contains a few useful examples: ```yaml jobs: @@ -132,7 +129,7 @@ jobs: ``` To see all the available options, see the default [unbound.conf -file](https://github.com/netdata/netdata/blob/master/src/go/collectors/go.d.plugin/config/go.d/unbound.conf). +file](https://github.com/netdata/netdata/blob/master/src/go/plugin/go.d/config/go.d/unbound.conf). ## What's next? diff --git a/docs/developer-and-contributor-corner/kubernetes-k8s-netdata.md b/docs/developer-and-contributor-corner/kubernetes-k8s-netdata.md index 11982a5b4..011aac8da 100644 --- a/docs/developer-and-contributor-corner/kubernetes-k8s-netdata.md +++ b/docs/developer-and-contributor-corner/kubernetes-k8s-netdata.md @@ -137,7 +137,7 @@ Let's explore the most colorful box by hovering over it. container](https://user-images.githubusercontent.com/1153921/109049544-a8417980-7695-11eb-80a7-109b4a645a27.png) The **Context** tab shows `rabbitmq-5bb66bb6c9-6xr5b` as the container's image name, which means this container is -running a [RabbitMQ](/src/go/collectors/go.d.plugin/modules/rabbitmq/README.md) workload. +running a [RabbitMQ](/src/go/plugin/go.d/modules/rabbitmq/README.md) workload. Click the **Metrics** tab to see real-time metrics from that container. Unsurprisingly, it shows a spike in CPU utilization at regular intervals. @@ -166,13 +166,13 @@ for complete customization. For example, grouping the top chart by `k8s_containe Netdata has a [service discovery plugin](https://github.com/netdata/agent-service-discovery), which discovers and creates configuration files for [compatible services](https://github.com/netdata/helmchart#service-discovery-and-supported-services) and any endpoints covered by -our [generic Prometheus collector](/src/go/collectors/go.d.plugin/modules/prometheus/README.md). +our [generic Prometheus collector](/src/go/plugin/go.d/modules/prometheus/README.md). Netdata uses these files to collect metrics from any compatible application as they run _inside_ of a pod. Service discovery happens without manual intervention as pods are created, destroyed, or moved between nodes. Service metrics show up on the Overview as well, beneath the **Kubernetes** section, and are labeled according to the service in question. For example, the **RabbitMQ** section has numerous charts from the [`rabbitmq` -collector](/src/go/collectors/go.d.plugin/modules/rabbitmq/README.md): +collector](/src/go/plugin/go.d/modules/rabbitmq/README.md):  @@ -193,7 +193,7 @@ Netdata also automatically collects metrics from two essential Kubernetes proces The **k8s kubelet** section visualizes metrics from the Kubernetes agent responsible for managing every pod on a given node. This also happens without any configuration thanks to the [kubelet -collector](/src/go/collectors/go.d.plugin/modules/k8s_kubelet/README.md). +collector](/src/go/plugin/go.d/modules/k8s_kubelet/README.md). Monitoring each node's kubelet can be invaluable when diagnosing issues with your Kubernetes cluster. For example, you can see if the number of running containers/pods has dropped, which could signal a fault or crash in a particular @@ -209,7 +209,7 @@ configuration-related errors, and the actual vs. desired numbers of volumes, plu The **k8s kube-proxy** section displays metrics about the network proxy that runs on each node in your Kubernetes cluster. kube-proxy lets pods communicate with each other and accept sessions from outside your cluster. Its metrics are collected by the [kube-proxy -collector](/src/go/collectors/go.d.plugin/modules/k8s_kubeproxy/README.md). +collector](/src/go/plugin/go.d/modules/k8s_kubeproxy/README.md). With Netdata, you can monitor how often your k8s proxies are syncing proxy rules between nodes. Dramatic changes in these figures could indicate an anomaly in your cluster that's worthy of further investigation. @@ -229,9 +229,9 @@ clusters of all sizes. - [Netdata Helm chart](https://github.com/netdata/helmchart) - [Netdata service discovery](https://github.com/netdata/agent-service-discovery) - [Netdata Agent · `kubelet` - collector](/src/go/collectors/go.d.plugin/modules/k8s_kubelet/README.md) + collector](/src/go/plugin/go.d/modules/k8s_kubelet/README.md) - [Netdata Agent · `kube-proxy` - collector](/src/go/collectors/go.d.plugin/modules/k8s_kubeproxy/README.md) + collector](/src/go/plugin/go.d/modules/k8s_kubeproxy/README.md) - [Netdata Agent · `cgroups.plugin`](/src/collectors/cgroups.plugin/README.md) diff --git a/docs/developer-and-contributor-corner/lamp-stack.md b/docs/developer-and-contributor-corner/lamp-stack.md index bdec9e750..2df5a7167 100644 --- a/docs/developer-and-contributor-corner/lamp-stack.md +++ b/docs/developer-and-contributor-corner/lamp-stack.md @@ -69,7 +69,7 @@ metrics from each using the [cgroups data collector](/src/collectors/cgroups.plu ## Enable Apache monitoring Let's begin by configuring Apache to work with Netdata's [Apache data -collector](/src/go/collectors/go.d.plugin/modules/apache/README.md). +collector](/src/go/plugin/go.d/modules/apache/README.md). Actually, there's nothing for you to do to enable Apache monitoring with Netdata. @@ -80,7 +80,7 @@ metrics](https://httpd.apache.org/docs/2.4/mod/mod_status.html), which is just _ ## Enable web log monitoring The Netdata Agent also comes with a [web log -collector](/src/go/collectors/go.d.plugin/modules/weblog/README.md), which reads Apache's access +collector](/src/go/plugin/go.d/modules/weblog/README.md), which reads Apache's access log file, processes each line, and converts them into per-second metrics. On Debian systems, it reads the file at `/var/log/apache2/access.log`. @@ -93,7 +93,7 @@ monitoring. Because your MySQL database is password-protected, you do need to tell MySQL to allow the `netdata` user to connect to without a password. Netdata's [MySQL data -collector](/src/go/collectors/go.d.plugin/modules/mysql/README.md) collects metrics in _read-only_ +collector](/src/go/plugin/go.d/modules/mysql/README.md) collects metrics in _read-only_ mode, without being able to alter or affect operations in any way. First, log into the MySQL shell. Then, run the following three commands, one at a time: @@ -113,7 +113,7 @@ Unlike Apache or MySQL, PHP isn't a service that you can monitor directly, unles with [StatsD](/src/collectors/statsd.plugin/README.md). However, if you use [PHP-FPM](https://php-fpm.org/) in your LAMP stack, you can monitor that process with our [PHP-FPM -data collector](/src/go/collectors/go.d.plugin/modules/phpfpm/README.md). +data collector](/src/go/plugin/go.d/modules/phpfpm/README.md). Open your PHP-FPM configuration for editing, replacing `7.4` with your version of PHP: @@ -215,7 +215,7 @@ services. The per-second metrics granularity means you have the most accurate in any LAMP-related issues. Another powerful way to monitor the availability of a LAMP stack is the [`httpcheck` -collector](/src/go/collectors/go.d.plugin/modules/httpcheck/README.md), which pings a web server at +collector](/src/go/plugin/go.d/modules/httpcheck/README.md), which pings a web server at a regular interval and tells you whether if and how quickly it's responding. The `response_match` option also lets you monitor when the web server's response isn't what you expect it to be, which might happen if PHP-FPM crashes, for example. @@ -231,8 +231,8 @@ source of issues faster with [Metric Correlations](/docs/metric-correlations.md) ### Related reference documentation - [Netdata Agent · Get started](/packaging/installer/README.md) -- [Netdata Agent · Apache data collector](/src/go/collectors/go.d.plugin/modules/apache/README.md) -- [Netdata Agent · Web log collector](/src/go/collectors/go.d.plugin/modules/weblog/README.md) -- [Netdata Agent · MySQL data collector](/src/go/collectors/go.d.plugin/modules/mysql/README.md) -- [Netdata Agent · PHP-FPM data collector](/src/go/collectors/go.d.plugin/modules/phpfpm/README.md) +- [Netdata Agent · Apache data collector](/src/go/plugin/go.d/modules/apache/README.md) +- [Netdata Agent · Web log collector](/src/go/plugin/go.d/modules/weblog/README.md) +- [Netdata Agent · MySQL data collector](/src/go/plugin/go.d/modules/mysql/README.md) +- [Netdata Agent · PHP-FPM data collector](/src/go/plugin/go.d/modules/phpfpm/README.md) diff --git a/docs/developer-and-contributor-corner/monitor-cockroachdb.md b/docs/developer-and-contributor-corner/monitor-cockroachdb.md index 303c00f62..f0db12cc4 100644 --- a/docs/developer-and-contributor-corner/monitor-cockroachdb.md +++ b/docs/developer-and-contributor-corner/monitor-cockroachdb.md @@ -11,7 +11,7 @@ learn_rel_path: "Miscellaneous" [CockroachDB](https://github.com/cockroachdb/cockroach) is an open-source project that brings SQL databases into scalable, disaster-resilient cloud deployments. Thanks to -a [new CockroachDB collector](/src/go/collectors/go.d.plugin/modules/cockroachdb/README.md) +a [new CockroachDB collector](/src/go/plugin/go.d/modules/cockroachdb/README.md) released in [v1.20](https://blog.netdata.cloud/posts/release-1.20/), you can now monitor any number of CockroachDB databases with maximum granularity using Netdata. Collect more than 50 unique metrics and put them on interactive visualizations diff --git a/docs/developer-and-contributor-corner/monitor-hadoop-cluster.md b/docs/developer-and-contributor-corner/monitor-hadoop-cluster.md index 8ccaa935e..98bf3d21f 100644 --- a/docs/developer-and-contributor-corner/monitor-hadoop-cluster.md +++ b/docs/developer-and-contributor-corner/monitor-hadoop-cluster.md @@ -27,8 +27,8 @@ alternative, like the guide available from For more specifics on the collection modules used in this guide, read the respective pages in our documentation: -- [HDFS](/src/go/collectors/go.d.plugin/modules/hdfs/README.md) -- [Zookeeper](/src/go/collectors/go.d.plugin/modules/zookeeper/README.md) +- [HDFS](/src/go/plugin/go.d/modules/hdfs/README.md) +- [Zookeeper](/src/go/plugin/go.d/modules/zookeeper/README.md) ## Set up your HDFS and Zookeeper installations diff --git a/docs/developer-and-contributor-corner/pi-hole-raspberry-pi.md b/docs/developer-and-contributor-corner/pi-hole-raspberry-pi.md index 124b95421..df6bb0809 100644 --- a/docs/developer-and-contributor-corner/pi-hole-raspberry-pi.md +++ b/docs/developer-and-contributor-corner/pi-hole-raspberry-pi.md @@ -81,7 +81,7 @@ service](https://discourse.pi-hole.net/t/how-do-i-configure-my-devices-to-use-pi finished setting up Pi-hole at this point. As far as configuring Netdata to monitor Pi-hole metrics, there's nothing you actually need to do. Netdata's [Pi-hole -collector](/src/go/collectors/go.d.plugin/modules/pihole/README.md) will autodetect the new service +collector](/src/go/plugin/go.d/modules/pihole/README.md) will autodetect the new service running on your Raspberry Pi and immediately start collecting metrics every second. Restart Netdata with `sudo systemctl restart netdata`, which will then recognize that Pi-hole is running and start a |
