
diff options
| author | Daniel Baumann <daniel.baumann@progress-linux.org> | 2021-05-19 12:33:38 +0000 |
|---|---|---|
| committer | Daniel Baumann <daniel.baumann@progress-linux.org> | 2021-05-19 12:33:59 +0000 |
| commit | 1ee0c09c5742557e037df5421ca62abddb90ae22 (patch) | |
| tree | 71c0fa48bb6d31d036c9badd7e038527f90d1a73 /docs | |
| parent | Releasing debian version 1.30.1-1. (diff) | |
| download | netdata-1ee0c09c5742557e037df5421ca62abddb90ae22.tar.xz netdata-1ee0c09c5742557e037df5421ca62abddb90ae22.zip | |
Merging upstream version 1.31.0.
Signed-off-by: Daniel Baumann <daniel.baumann@progress-linux.org>
Diffstat (limited to 'docs')
35 files changed, 1547 insertions, 518 deletions
diff --git a/docs/Running-behind-apache.md b/docs/Running-behind-apache.md index d1dc0e08..de95f55e 100644 --- a/docs/Running-behind-apache.md +++ b/docs/Running-behind-apache.md @@ -7,29 +7,29 @@ custom_edit_url: https://github.com/netdata/netdata/edit/master/docs/Running-beh Below you can find instructions for configuring an apache server to: -1. proxy a single Netdata via an HTTP and HTTPS virtual host -2. dynamically proxy any number of Netdata servers -3. add user authentication -4. adjust Netdata settings to get optimal results +1. Proxy a single Netdata via an HTTP and HTTPS virtual host. +2. Dynamically proxy any number of Netdata servers. +3. Add user authentication. +4. Adjust Netdata settings to get optimal results. ## Requirements -Make sure your apache has installed `mod_proxy` and `mod_proxy_http`. +Make sure your apache has `mod_proxy` and `mod_proxy_http` installed and enabled. -On debian/ubuntu systems, install them with this: +On Debian/Ubuntu systems, install apache, which already includes the two modules, using: ```sh sudo apt-get install apache2 ``` -Also make sure they are enabled: +Enable them: ```sh sudo a2enmod proxy sudo a2enmod proxy_http ``` -Ensure your rewrite module is enabled: +Also, enable the rewrite module: ```sh sudo a2enmod rewrite @@ -123,7 +123,6 @@ with this content: ```conf <VirtualHost *:80> - RewriteEngine On ProxyRequests Off ProxyPreserveHost On @@ -167,7 +166,7 @@ Repeat the operation for as many servers as you need. If you wish to add an authentication (user/password) to access your Netdata, do these: -Install the package `apache2-utils`. On debian / ubuntu run `sudo apt-get install apache2-utils`. +Install the package `apache2-utils`. On Debian/Ubuntu run `sudo apt-get install apache2-utils`. Then, generate password for user `netdata`, using `htpasswd -c /etc/apache2/.htpasswd netdata` diff --git a/docs/Running-behind-nginx.md b/docs/Running-behind-nginx.md index 2f47447d..83720039 100644 --- a/docs/Running-behind-nginx.md +++ b/docs/Running-behind-nginx.md @@ -53,6 +53,8 @@ upstream backend { server { # nginx listens to this listen 80; + # uncomment the line if you want nginx to listen on IPv6 address + #listen [::]:80; # the virtual host name of this server_name netdata.example.com; @@ -82,16 +84,18 @@ upstream netdata { } server { - listen 80; + listen 80; + # uncomment the line if you want nginx to listen on IPv6 address + #listen [::]:80; - # the virtual host name of this subfolder should be exposed - #server_name netdata.example.com; + # the virtual host name of this subfolder should be exposed + #server_name netdata.example.com; - location = /netdata { + location = /netdata { return 301 /netdata/; - } + } - location ~ /netdata/(?<ndpath>.*) { + location ~ /netdata/(?<ndpath>.*) { proxy_redirect off; proxy_set_header Host $host; @@ -127,6 +131,8 @@ upstream backend-server2 { server { listen 80; + # uncomment the line if you want nginx to listen on IPv6 address + #listen [::]:80; # the virtual host name of this subfolder should be exposed #server_name netdata.example.com; diff --git a/docs/collect/application-metrics.md b/docs/collect/application-metrics.md index e5f90394..fbc0ae24 100644 --- a/docs/collect/application-metrics.md +++ b/docs/collect/application-metrics.md @@ -47,10 +47,10 @@ application metrics collectors, including those for containers/k8s clusters. ## Collect metrics from applications running on Windows Netdata is fully capable of collecting and visualizing metrics from applications running on Windows systems. The only -caveat is that you must [install the Agent](/docs/get/README.md) on a separate system or a compatible VM because there +caveat is that you must [install Netdata](/docs/get-started.mdx) on a separate system or a compatible VM because there is no native Windows version of the Netdata Agent. -Once you have the Agent running on that separate system, you can follow the [enable and configure +Once you have Netdata running on that separate system, you can follow the [enable and configure doc](/docs/collect/enable-configure.md) to tell the collector to look for exposed metrics on the Windows system's IP address or hostname, plus the applicable port. diff --git a/docs/collect/how-collectors-work.md b/docs/collect/how-collectors-work.md index 5ae444a6..b4a6c879 100644 --- a/docs/collect/how-collectors-work.md +++ b/docs/collect/how-collectors-work.md @@ -10,7 +10,7 @@ When Netdata starts, and with zero configuration, it auto-detects thousands of d per-second metrics. Netdata can immediately collect metrics from these endpoints thanks to 300+ **collectors**, which all come pre-installed -when you [install the Netdata Agent](/docs/get/README.md#install-the-netdata-agent). +when you [install Netdata](/docs/get-started.mdx). Every collector has two primary jobs: diff --git a/docs/configure/nodes.md b/docs/configure/nodes.md index c6e58cd8..a721c73c 100644 --- a/docs/configure/nodes.md +++ b/docs/configure/nodes.md @@ -40,7 +40,7 @@ exist. - `edit-config` is a shell script used for [editing configuration files](#use-edit-config-to-edit-configuration-files). - Various configuration files ending in `.conf` for [configuring plugins or collectors](/docs/collect/enable-configure.md#enable-a-collector-or-its-orchestrator) behave. Examples: `go.d.conf`, - `python.d.conf`, and `ebpf.conf`. + `python.d.conf`, and `ebpf.d.conf`. - Various directories ending in `.d`, which contain other configuration files, each ending in `.conf`, for [configuring specific collectors](/docs/collect/enable-configure.md#configure-a-collector). - `apps_groups.conf` is a configuration file for changing how applications/processes are grouped when viewing the @@ -112,7 +112,7 @@ You can edit any Netdata configuration file using `edit-config`. A few examples: ```bash ./edit-config apps_groups.conf -./edit-config ebpf.conf +./edit-config ebpf.d.conf ./edit-config health.d/load.conf ./edit-config go.d/prometheus.conf ``` diff --git a/docs/contributing/contributing-documentation.md b/docs/contributing/contributing-documentation.md index 44be9229..22df9fc3 100644 --- a/docs/contributing/contributing-documentation.md +++ b/docs/contributing/contributing-documentation.md @@ -37,7 +37,7 @@ Netdata's documentation is separated into four sections. - **Netdata Agent reference**: Reference documentation for the open-source Netdata Agent. - Stored in various `.md` files within the `netdata/netdata` repository alongside the code responsible for that feature. For example, the database engine's reference documentation is at `/database/engine/README.md`. - - Published at [`https://learn.netdata.cloud/docs/agent`](https://learn.netdata.cloud/docs/agent). + - Published under the **Reference** section in the Netdata Learn sidebar. - **Netdata Cloud reference**: Reference documentation for the closed-source Netdata Cloud web application. - Stored in a private GitHub repository and not editable by the community. - Published at [`https://learn.netdata.cloud/docs/cloud`](https://learn.netdata.cloud/docs/cloud). diff --git a/docs/dashboard/customize.mdx b/docs/dashboard/customize.mdx new file mode 100644 index 00000000..f3a8f805 --- /dev/null +++ b/docs/dashboard/customize.mdx @@ -0,0 +1,93 @@ +--- +title: "Customize the standard dashboard" +description: "Netdata's preconfigured dashboard offers many customization options, such as choosing when charts are updated, your preferred theme, and custom text to document processes, and more." +type: how-to +custom_edit_url: https://github.com/netdata/netdata/edit/master/docs/dashboard/customize.mdx +--- + +# Customize the standard dashboard + +While the [Netdata dashboard](/docs/dashboard/how-dashboard-works.mdx) comes preconfigured with hundreds of charts and +thousands of metrics, you may want to alter your experience based on a particular use case or preferences. + +## Dashboard settings + +To change dashboard settings, click the on the **settings** icon  +in the top panel. + +These settings only affect how the dashboard behaves in your browser. They take effect immediately and are permanently +saved to browser local storage (except the refresh on focus / always option). Some settings are applied immediately, and +others are only reflected after the dashboard is refreshed, which happens automatically. + +Here are a few popular settings: + +### Change chart legend position + +Find this setting under the **Visual** tab. By default, Netdata places the [legend of +dimensions](/docs/dashboards/charts-dimensions-contexts-families.mdx#dimensions) _below_ charts. Click this toggle to +move the legend to the _right_ of charts. + +### Change theme + +Find this setting under the **Visual** tab. Choose between Dark (the default) and White. + +## Customize the standard dashboard + +Netdata stores information about individual charts in the `dashboard_info.js` file. This file includes section and +subsection headings, descriptions, colors, titles, tooltips, and other information for Netdata to render on the +dashboard. + +One common use case for customizing the standard dashboard is adding internal "documentation" a section or specific +chart that can then be read by anyone with access to that dashboard. + +For example, here is how `dashboard_info.js` defines the **System Overview** section. + +```javascript +netdataDashboard.menu = { + 'system': { + title: 'System Overview', + icon: '<i class="fas fa-bookmark"></i>', + info: 'Overview of the key system metrics.' + }, +``` + +If you want to customize this information, use the example `dashboard_info_custom_example.js` as a starting point. +First, navigate to the web server's directory. If you're on a Linux system, this should be at `/usr/share/netdata/web/`. +Copy the example file, then ensure that its permissions match the rest of the web server, which is `netdata:netdata` by +default. + +```bash +cd /usr/share/netdata/web/ +sudo cp dashboard_info_custom_example.js your_dashboard_info_file.js +sudo chown netdata:netdata your_dashboard_info_file.js +``` + +Edit the file with customizations to the `title`, `icon`, and `info` fields. Replace the string after `fas fa-` with any +icon from [Font Awesome](https://fontawesome.com/cheatsheet) to customize the icons that appear throughout the +dashboard. + +Save the file, then navigate to your [Netdata config directory](/docs/configure/nodes.md) to edit `netdata.conf`. Add +the following line to the `[web]` section to tell Netdata where to find your custom configuration. + +```conf +[web] + custom dashboard_info.js = your_dashboard_info_file.js +``` + +Reload your browser tab to see your custom configuration. + +## What's next? + +If you're keen on continuing to customize your Netdata experience, check out our docs on [building new custom +dashboards](/web/gui/custom/README.md) with HTML, CSS, and JavaScript. + +### Further reading & related information + +- Dashboard + - [How the dashboard works](/docs/dashboard/how-dashboard-works.mdx) + - [Interact with charts](/docs/dashboard/interact-charts.mdx) + - [Chart dimensions, contexts, and families](/docs/dashboard/dimensions-contexts-families.mdx) + - [Select timeframes to visualize](/docs/dashboard/select-timeframes.mdx) + - [Import, export, and print a snapshot](/docs/dashboard/import-export-print-snapshot.mdx) + - **[Customize the standard dashboard](/docs/dashboard/customize.mdx)** diff --git a/docs/dashboard/dimensions-contexts-families.mdx b/docs/dashboard/dimensions-contexts-families.mdx new file mode 100644 index 00000000..49438bf2 --- /dev/null +++ b/docs/dashboard/dimensions-contexts-families.mdx @@ -0,0 +1,96 @@ +--- +title: "Chart dimensions, contexts, and families" +description: "Netdata organizes charts into dimensions, contexts, and families to automatically and meaningfully organize thousands of metrics into interactive charts." +type: explanation +custom_edit_url: https://github.com/netdata/netdata/edit/master/docs/dashboard/dimensions-contexts-families.mdx +--- + +# Chart dimensions, contexts, and families + +While Netdata's charts require no configuration and are [easy to interact with](/docs/dashboard/interact-charts.mdx), +they have a lot of underlying complexity. To meaningfully organize charts out of the box based on what's happening in +your nodes, Netdata uses the concepts of **dimensions**, **contexts**, and **families**. + +Understanding how these work will help you more easily navigate the dashboard, [write new +alarms](/docs/monitor/configure-alarms.md), or play around with the [API](/web/api/README.md). + +For a refresher on the anatomy of a chart, see [dashboards and charts](/docs/dashboard/how-dashboard-works.mdx). + +## Dimension + +A **dimension** is a value that gets shown on a chart. The value can be raw data or calculated values, such as the +average (the default), minimum, or maximum. These values can then be given any type of unit. For example, CPU +utilization is represented as a percentage, disk I/O as `MiB/s`, and available RAM as an absolute value in `MiB` or +`GiB`. + +Beneath every chart (or on the right-side if you configure the dashboard) is a legend of dimensions. When there are +multiple dimensions, you'll see a different entry in the legend for each dimension. + +The **Apps CPU Time** chart (with the [context](#contexts) `apps.cpu`), which visualizes CPU utilization of +different types of processes/services/applications on your node, always provides a vibrant example of a chart with +multiple dimensions. + +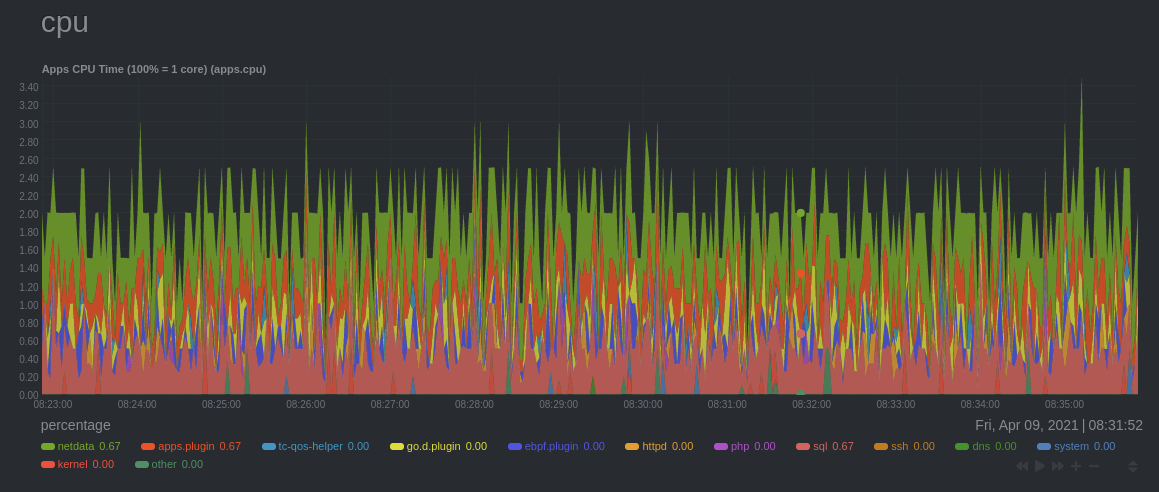 + +The chart shows 13 unique dimensions, such as `httpd` for the CPU utilization for web servers, `kernel` for anything +related to the Linux kernel, and so on. In your dashboard, these specific dimensions will almost certainly be different. + +Dimensions can be [hidden](/docs/dashboard/interact-charts.mdx#show-and-hide-dimensions) to help you focus your +attention. + +## Context + +A **context** is a way of grouping charts by the types of metrics collected and dimensions displayed. It's kind of like +a machine-readable naming and organization scheme. + +For example, the **Apps CPU Time** has the context `apps.cpu`. A little further down on the dashboard is a similar +chart, **Apps Real Memory (w/o shared)** with the context `apps.mem`. The `apps` portion of the context is the **type**, +whereas anything after the `.` is specified either by the chart's developer or by the [**family**](#family). + +By default, a chart's type affects where it fits in the menu, while its family creates submenus. + +Netdata also relies on contexts for [alarm configuration](/docs/monitor/configure-alarms.md) (the [`on` +line](/health/REFERENCE.md#alarm-line-on)). + +## Family + +**Families** are a _single instance_ of a hardware or software resource that needs to be displayed separately from +similar instances. + +For example, let's look at the **Disks** section, which contains a number of charts with contexts like `disk.io`, +`disk.ops`, `disk.backlog`, and `disk.util`. If your node has multiple disk drives at `sda` and `sdb`, Netdata creates +a separate family for each. + +Netdata now merges the contexts and families to create charts that are grouped by family, following a +`[context].[family]` naming scheme, so that you can see the `disk.io` and `disk.ops` charts for `sda` right next to each +other. + +Given the four example contexts, and two families of `sda` and `sdb`, Netdata will create the following charts and their +names: + +| Context | `sda` family | `sdb` family | +| :------------- | ------------------ | ------------------ | +| `disk.io` | `disk_io.sda` | `disk_io.sdb` | +| `disk.ops` | `disk_ops.sda` | `disk_ops.sdb` | +| `disk.backlog` | `disk_backlog.sda` | `disk_backlog.sdb` | +| `disk.util` | `disk_util.sda` | `disk_util.sdb` | + +## What's next? + +With an understanding of a chart's dimensions, context, and family, you're now ready to dig even deeper into Netdata's +dashboard. We recommend looking into [using the timeframe selector](/docs/dashboard/select-timeframes.mdx). + +If you feel comfortable with the [dashboard](/docs/dashboard/how-dashboard-works.mdx) and interacting with charts, we +recommend learning about [configuration](/docs/configure/nodes.md). While Netdata doesn't _require_ a complicated setup +process or a query language to create charts, there are a lot of ways to tweak the experience to match your needs. + +### Further reading & related information + +- Dashboard + - [How the dashboard works](/docs/dashboard/how-dashboard-works.mdx) + - [Interact with charts](/docs/dashboard/interact-charts.mdx) + - **[Chart dimensions, contexts, and families](/docs/dashboard/dimensions-contexts-families.mdx)** + - [Select timeframes to visualize](/docs/dashboard/select-timeframes.mdx) + - [Import, export, and print a snapshot](/docs/dashboard/import-export-print-snapshot.mdx) + - [Customize the standard dashboard](/docs/dashboard/customize.mdx) diff --git a/docs/dashboard/how-dashboard-works.mdx b/docs/dashboard/how-dashboard-works.mdx new file mode 100644 index 00000000..00c5df33 --- /dev/null +++ b/docs/dashboard/how-dashboard-works.mdx @@ -0,0 +1,112 @@ +--- +title: "How the dashboard works" +description: "Learn how to navigate Netdata's preconfigured dashboard to get started exploring, visualizing, and troubleshooting in real time." +type: explanation +custom_edit_url: https://github.com/netdata/netdata/edit/master/docs/dashboard/how-dashboard-works.mdx +--- + +# How the dashboard works + +Because Netdata is a monitoring and _troubleshooting_ platform, a dashboard with real-time, meaningful, and +context-aware charts is essential. + +As soon as you [install Netdata](/docs/get-started.mdx), it autodetects hardware, OS, containers, services, and +applications running on your node and builds a dashboard on a single, scrollable webpage. This page features hundreds of +charts, which are preconfigured to save you time from learning a query language, all stacked on top of one another. This +vertical rhythm is designed to encourage exploration and help you visually identify connections between the metrics +visualized in different charts. + +It's essential to understand the core concepts and features of Netdata's dashboard if you want to maximize your Netdata +experience right after installation. + +## Open the dashboard + +Access Netdata's dashboard by navigating to `http://NODE:19999` in your browser, replacing `NODE` with either +`localhost` or the hostname/IP address of a remote node. + + + +Many features of the internal web server that serves the dashboard are [configurable](/web/server/README.md), including +the listen port, enforced TLS, and even disabling the dashboard altogether. + +## Sections and menus + +As mentioned in the introduction, Netdata automatically organizes all the metrics it collects from your node, and places +them into **sections** of closely related charts. + +The first section on any dashboard is the **System Overview**, followed by **CPUs**, **Memory**, and so on. + +These sections populate the **menu**, which is on the right-hand side of the dashboard. Instead of manually scrolling up +and down to explore the dashboard, it's generally faster to click on the relevant menu item to jump to that position on +the dashboard. + +Many menu items also contain a **submenu**, with links to additional categories. For example, the **Disks** section is often separated into multiple groups based on the number of disk drives/partitions on your node, which are also known as a family. + + + +## Charts + +Every **chart** in the Netdata dashboard is [fully interactive](/docs/dashboard/interact-charts.mdx). Netdata +synchronizes your interactions to help you understand exactly how a node behaved in any timeframe, whether that's +seconds or days. + +A chart is an individual, interactive, always-updating graphic displaying one or more collected/calculated metrics, +which are generated by [collectors](/docs/collect/how-collectors-work.md). + + + +Hover over any chart to temporarily pause it and see the exact metrics values presented as different dimensions. Click +or tap to stop the chart from automatically updating with new metrics, thereby locking it to a single timeframe. +Double-click it to resume auto-updating. + +Let's cover two of the most important ways to interact with charts: panning through time and zooming. + +To pan through time, **click and hold** (or touch and hold) on any chart, then **drag your mouse** (or finger) to the +left or right. Drag to the right to pan backward through time, or drag to the left to pan forward in time. Think of it +like pushing the current timeframe off the screen to see what came before or after. + +To zoom, press and hold `Shift`, then use your mouse's scroll wheel, or a two-finger pinch if you're using a touchpad. + +See [interact with charts](/docs/dashboard/interact-charts.mdx) for all the possible ways to interact with the charts on +your dashboard. + +## Alarms + +Many of the preconfigured charts on the Netdata dashboard also come with preconfigured alarms. Netdata sends three +primary alarm states via alarms: `CLEAR`, `WARNING`, and `CRITICAL`. If an alarm moves from a `CLEAR` state to either +`WARNING` or `CRITICAL`, Netdata creates a notification to let you know exactly what's going on. There are [other alarm +states](/health/REFERENCE.md#alarm-statuses) as well. + +The easiest way to see alarms is by clicking on the alarm icon  +in the top panel to open the alarms panel, which shows you all the active alarms. The other **All** tab shows every +active alarm, and the **Log** tab shows a historical record of exactly when alarms triggered and to which state. + + + +Learn more about [viewing active alarms](/docs/monitor/view-active-alarms.md), [configuring +alarms](/docs/monitor/configure-alarms.md), or [enabling a new notification +method](/docs/monitor/enable-notifications.md). + +## What's next? + +Learn more about [interacting with charts](/docs/dashboard/interact-charts.mdx) to quickly pan through time, zoom, and +show/hide dimensions to best understand the state of your node in any timeframe. A complete understanding of [chart +dimensions, contexts, and families](/docs/dashboard/dimensions-contexts-families.mdx) will also help with how Netdata +organizes its dashboard and operates [alarms](/docs/monitor/configure-alarms.md). + +### Further reading & related information + +- Dashboard + - **[How the dashboard works](/docs/dashboard/how-dashboard-works.mdx)** + - [Interact with charts](/docs/dashboard/interact-charts.mdx) + - [Chart dimensions, contexts, and families](/docs/dashboard/dimensions-contexts-families.mdx) + - [Select timeframes to visualize](/docs/dashboard/select-timeframes.mdx) + - [Import, export, and print a snapshot](/docs/dashboard/import-export-print-snapshot.mdx) + - [Customize the standard dashboard](/docs/dashboard/customize.mdx) +- [HTTP API](/web/api/README.md) +- [Custom dashboards](/web/gui/custom/README.md) diff --git a/docs/dashboard/import-export-print-snapshot.mdx b/docs/dashboard/import-export-print-snapshot.mdx new file mode 100644 index 00000000..b5488914 --- /dev/null +++ b/docs/dashboard/import-export-print-snapshot.mdx @@ -0,0 +1,83 @@ +--- +title: "Import, export, and print a snapshot" +description: "Snapshots can be incredibly useful for diagnosing anomalies after they've already happened, and are interoperable with any other node running Netdata." +type: how-to +custom_edit_url: https://github.com/netdata/netdata/edit/master/docs/dashboard/import-export-print-snapshot.mdx +--- + +# Import, export, and print snapshots + +Netdata can export snapshots of the contents of your dashboard at a given time, which you can then import into any other +node running Netdata. Or, you can create a print-ready version of your dashboard to save to PDF or actually print to +paper. + +Snapshots can be incredibly useful for diagnosing anomalies after they've already happened. Let's say Netdata triggered +a warning alarm while you were asleep. In the morning, you can [pick the +timeframe](/docs/dashboards/pick-timeframes.mdx) when the alarm triggered, export a snapshot, and send it to a colleague +for further analysis. + +Or, send the Netdata team a snapshot of your dashboard when [filing a bug +report](https://github.com/netdata/netdata/issues/new?assignees=&labels=bug%2C+needs+triage&template=bug_report.md) on +GitHub. + + + +## Import a snapshot + +To import a snapshot, click on the **import** icon  +in the top panel. + +Select the Netdata snapshot file to import. Once the file is loaded, the modal updates with information about the +snapshot and the system from which it was taken. Click **Import** to begin to process. + +Netdata takes the data embedded inside the snapshot and re-creates a static replica on your dashboard. When the import +finishes, you're free to move around and examine the charts. + +Some caveats and tips to keep in mind: + +- Only metrics in the export timeframe are available to you. If you zoom out or pan through time, you'll see the + beginning and end of the snapshot. +- Charts won't update with new inforamtion, as you're looking at a static replica, not the live dashboard. +- The import is only temporary. Reload your browser tab to return to your node's real-time dashboard. + +## Export a snapshot + +To export a snapshot, first pan/zoom any chart to an appropriate _visible timeframe_. The export snapshot will only +contain the metrics you see in charts, so choose the most relevant timeframe. + +Next, click on the **export** icon  +in the top panel. + +Select the metrics resolution to export. The default is 1-second, equal to how often Netdata collects and stores +metrics. Lowering the resolution will reduce the number of data points, and thus the snapshot's overall size. + +Edit the snapshot file name and select your desired compression method. Click on **Export**. When the export is +complete, your browser will prompt you to save the `.snapshot` file to your machine. + +## Print a snapshot + +To print a snapshot, click on the **print** icon  +in the top panel. + +When you click **Print**, Netdata opens a new window to render every chart. This might take some time. When finished, +Netdata opens a browser print dialog for you to save to PDF or print. + +## What's next? + +Now that you understand snapshots, now is a good time to delve deeper into some of the dashboard's lesser-known +features, such as [customization](/docs/dashboard/customize.mdx) or [building new, custom +dashboards](/web/gui/custom/README.md). + +### Further reading & related information + +- Dashboard + - [How the dashboard works](/docs/dashboard/how-dashboard-works.mdx) + - [Interact with charts](/docs/dashboard/interact-charts.mdx) + - [Chart dimensions, contexts, and families](/docs/dashboard/dimensions-contexts-families.mdx) + - [Select timeframes to visualize](/docs/dashboard/select-timeframes.mdx) + - **[Import, export, and print a snapshot](/docs/dashboard/import-export-print-snapshot.mdx)** + - [Customize the standard dashboard](/docs/dashboard/customize.mdx)
\ No newline at end of file diff --git a/docs/dashboard/interact-charts.mdx b/docs/dashboard/interact-charts.mdx new file mode 100644 index 00000000..2266e101 --- /dev/null +++ b/docs/dashboard/interact-charts.mdx @@ -0,0 +1,137 @@ +--- +title: "Interact with charts" +description: "Learn how to pan, zoom, select, and customize Netdata's preconfigured charts to help you troubleshooting with real-time, per-second metrics data." +type: how-to +custom_edit_url: https://github.com/netdata/netdata/edit/master/docs/dashboard/interact-charts.mdx +--- + +# Interact with charts + +While charts that update every second with new metrics are helpful for understanding the immediate state of a node, deep +troubleshooting and root cause analysis begins by manipulating the default charts. To help you troubleshoot, Netdata +synchronizes every chart every time you interact with one of them. + +Here's what synchronization looks like: + + + +Once you understand all the interactions available to you, you'll be able to quickly move around the dashboard, search +for anomalies, and find root causes using per-second metrics. + +## Pause or stop + +| Interaction | Keyboard/mouse | Touchpad/touchscreen | +| :---------------- | :------------- | :------------------- | +| **Pause** a chart | `hover` | `n/a` | +| **Stop** a chart | `click` | `tap` | + +By hovering over any chart, you temporarily pause it so that you can hover over a specific timeframe and see the exact +values presented as dimensions. Click on the chart to lock it to this timeframe, which is useful if you want to jump to +a different chart to look for possible correlations. + + + +## Pan + +| Interaction | Keyboard/mouse | Touchpad/touchscreen | +| :---------- | :------------- | :------------------- | +| **Pan** | `click + drag` | `swipe` | + +Drag your mouse/finger to the right to pan backward through time, or drag to the left to pan forward in time. Think of +it like pushing the current timeframe off the screen to see what came before or after. + +## Zoom + +| Interaction | Keyboard/mouse | Touchpad/touchscreen | +| :------------------------------- | :-------------------------- | :--------------------------------------------------- | +| **Zoom** in or out | `Shift + mouse scrollwheel` | `two-finger pinch` <br />`Shift + two-finger scroll` | +| **Zoom** to a specific timeframe | `Shift + mouse selection` | `n/a` | + +Zooming in helps you see metrics with maximum granularity, which is useful when you're trying to diagnose the root cause +of an anomaly or outage. Zooming out lets you see metrics within the larger context, such as the last hour, day, or +week, which is useful in understanding what "normal" looks like, or to identify long-term trends, like a slow creep in +memory usage. + +## Select + +| Interaction | Keyboard/mouse | Touchpad/touchscreen | +| :------------------------------ | :-------------------------------------------------------- | :------------------- | +| **Select** a specific timeframe | `Alt + mouse selection` or `⌘ + mouse selection` (macOS) | `n/a` | + +Selecting timeframes is useful when you see an interesting spike or change in a chart and want to investigate further. + +Select a timeframe, then move to different charts/sections of the dashboard. Each chart shows the same selection to help +you immediately identify the timeframe and look for correlations. + +## Reset a chart to its default state + +| Interaction | Keyboard/mouse | Touchpad/touchscreen | +| :---------------- | :------------- | :------------------- | +| **Reset** a chart | `double-click` | `n/a` | + +Double-check on a chart to restore it to the default auto-updating state, with a timeframe based on your browser +viewport. + +## Resize + +Click-and-drag the icon on the bottom-right corner of any chart. To restore the chart to its original height, +double-click the same icon. + + + +## Show and hide dimensions + +| Interaction | Keyboard/mouse | Touchpad/touchscreen | +| :------------------------------------- | :-------------- | :------------------- | +| **Show one** dimension and hide others | `click` | `tap` | +| **Toggle (show/hide)** one dimension | `Shift + click` | `n/a` | + +Hiding dimensions simplifies the chart and can help you better discover exactly which aspect of your system might be +behaving strangely. + +## See the context + +Hover your mouse over the date that appears just beneath the chart itself. A tooltip will tell you the context for that +chart. Below, the context is `apps.cpu`. + + + +## See the resolution and update frequency + +Hover your mouse over the timestamp just to the right of the date. `resolution` is the number of seconds between each +"tick" in the chart. `collection every` is how often Netdata collects and stores that metric. + +If the `resolution` value is higher than `collection every`, such as `resolution 5 secs, collected every 1 sec`, this +means that each tick is calculating represents the average values across a 5-second period. You can zoom in to increase +the resolution to `resolution 1 sec` to see the exact values. + +## Chart controls + +Many of the above interactions can also be triggered using the icons on the bottom-right corner of every chart. They +are, respectively, `Pan Left`, `Reset`, `Pan Right`, `Zoom In`, and `Zoom Out`. + +## What's next? + +We recommend you read up on the differences between [chart dimensions, contexts, and +families](/docs/dashboard/dimensions-contexts-families.mdx) to complete your understanding of how Netdata organizes its +dashboards. Another valuable way to interact with charts is to use the [timeframe +selector](/docs/dashboard/select-timeframes.mdx), which helps you visualize specific moments of historical metrics. + +If you feel comfortable with the [dashboard](/docs/dashboard/how-dashboard-works.mdx) and interacting with charts, we +recommend moving on to learning about [configuration](/docs/configure/nodes.md). While Netdata doesn't _require_ a +complicated setup process or a query language to create charts, there are a lot of ways to tweak the experience to match +your needs. + +### Further reading & related information + +- Dashboard + - [How the dashboard works](/docs/dashboard/how-dashboard-works.mdx) + - **[Interact with charts](/docs/dashboard/interact-charts.mdx)** + - [Chart dimensions, contexts, and families](/docs/dashboard/dimensions-contexts-families.mdx) + - [Select timeframes to visualize](/docs/dashboard/select-timeframes.mdx) + - [Import, export, and print a snapshot](/docs/dashboard/import-export-print-snapshot.mdx) + - [Customize the standard dashboard](/docs/dashboard/customize.mdx) diff --git a/docs/dashboard/select-timeframes.mdx b/docs/dashboard/select-timeframes.mdx new file mode 100644 index 00000000..ac1b3f7c --- /dev/null +++ b/docs/dashboard/select-timeframes.mdx @@ -0,0 +1,85 @@ +--- +title: "Select timeframes to visualize" +description: "Netdata's dashboard features a rich timeframe selector, with useful defaults and rich customization, to help you narrow your focus when troubleshooting issues or anomalies." +type: how-to +custom_edit_url: https://github.com/netdata/netdata/edit/master/docs/dashboard/select-timeframes.mdx +--- + +# Pick timeframes to visualize + +While [panning through time and zooming in/out](/docs/dashboard/interact-charts.mdx) from charts is helpful when +you're looking a recent history, or want to do granular troubleshooting, what if you want to see metrics from 6 hours +ago? Or 6 days? + +Netdata's dashboard features a **timeframe selector** to help you visualize specific timeframes in a few helpful ways. +By default, it shows a certain number of minutes of historical metrics based on the your browser's viewport to ensure +it's always showing per-second granularity. + +## Open the timeframe selector + +To visualize a new timeframe, you need to open the picker, which appears just above the menu, near the top-right cover +of the dashboard. + +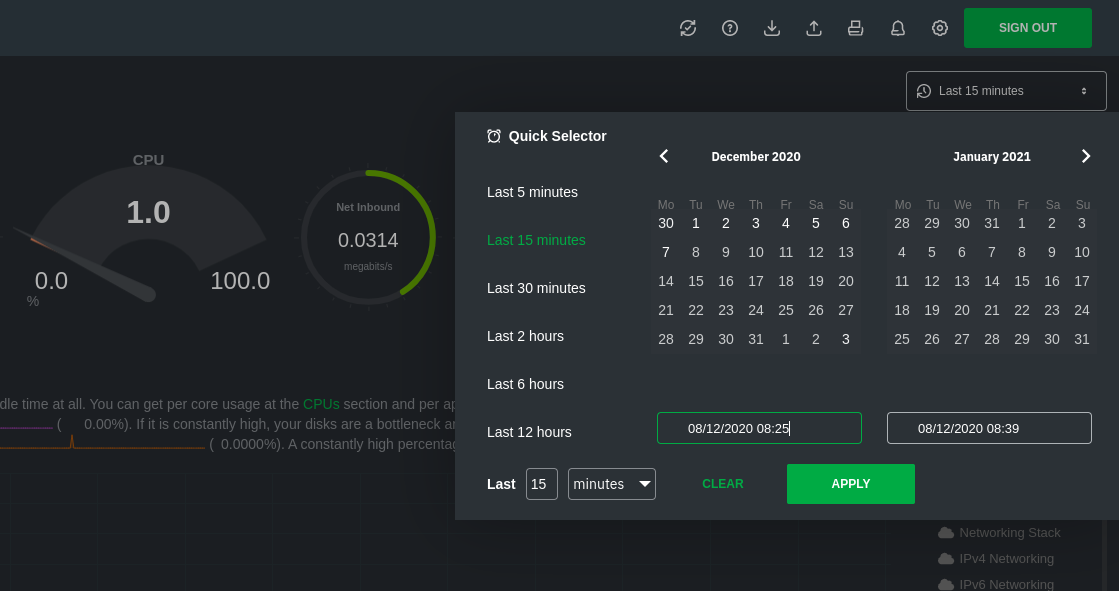 + +The **Clear** button resets the dashboard back to its default state based on your browser viewport, and **Apply** closes +the picker and shifts all charts to the selected timeframe. + +## Use the Quick Selector + +Click any of the following options in the **Quick Selector** to choose a commonly-used timeframe. + +- Last 5 minutes +- Last 15 minutes +- Last 2 hours +- Last 6 hours +- Last 12 hours + +Click **Apply** to see metrics from your selected timeframe. + +## Choose a specific interval + +Beneath the Quick Selector is an input field and dropdown you use in combination to select a specific timeframe of +minutes, hours, days, or months. Enter a number and choose the appropriate unit of time, then click **Apply**. + +## Choose multiple days + +Use the calendar to select multiple days. Click on a date to begin the timeframe selection, then an ending date. The +timeframe begins at noon on the beginning and end dates. Click **Apply** to see your selected multi-day timeframe. + +## Caveats and considerations + +**Longer timeframes will decrease metrics granularity**. At the default timeframe, based on your browser viewport, each +"tick" on charts represents one second. If you select a timeframe of 6 hours, each tick represents the _average_ value +across a larger period of time. + +**You can only see metrics as far back in history as your metrics retention policy allows**. Netdata uses an internal +time-series database (TSDB) to store as many metrics as it can within a specific amount of disk space. The default +storage is 256 MiB, which should be enough for 1-3 days of historical metrics. If you navigate back to a timeframe +beyond stored historical metrics, you'll see this message: + +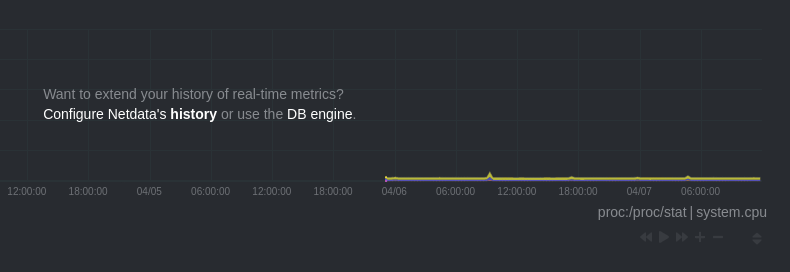 + +At any time, [configure the internal TSDB's storage capacity](/docs/store/change-metrics-storage.md) to expand your +depth of historical metrics. + +## What's next? + +One useful next step after selecting a timeframe is [exporting the +metrics](/docs/dashboard/import-export-print-snapshot.mdx) into a snapshot file, which can then be shared and imported +into any other Netdata dashboard. + +There are also many ways to [customize](/docs/dashboard/customize.mdx) the standard dashboard experience, from changing +the theme to editing the text that accompanies every section of charts. + +### Further reading & related information + +- Dashboard + - [How the dashboard works](/docs/dashboard/how-dashboard-works.mdx) + - [Interact with charts](/docs/dashboard/interact-charts.mdx) + - [Chart dimensions, contexts, and families](/docs/dashboard/dimensions-contexts-families.mdx) + - **[Select timeframes to visualize](/docs/dashboard/select-timeframes.mdx)** + - [Import, export, and print a snapshot](/docs/dashboard/import-export-print-snapshot.mdx) + - [Customize the standard dashboard](/docs/dashboard/customize.mdx) diff --git a/docs/get-started.mdx b/docs/get-started.mdx new file mode 100644 index 00000000..ef1d3f9a --- /dev/null +++ b/docs/get-started.mdx @@ -0,0 +1,138 @@ +--- +title: "Get started with Netdata" +description: "Download and install the open-source Netdata monitoring agent on physical/virtual servers, Linux (Ubuntu/Debian/CentOS/etc), Docker, Kubernetes, and many others, often with one command." +type: how-to +sidebar_label: "Get started" +custom_edit_url: https://github.com/netdata/netdata/edit/master/docs/get-started.mdx +--- + +import { OneLineInstall } from '../src/components/OneLineInstall/' +import { Install, InstallBox } from '../src/components/Install/' + +# Get started with Netdata + +Netdata is an free and open-source (FOSS) monitoring agent that collects thousands of hardware and software metrics from +any physical or virtual system (we call them _nodes_) and organizes them in an easy-to-use and -navigate interface. + +Together with [Netdata Cloud](https://learn.netdata.cloud/docs/cloud), you can monitor your entire infrastructure in +real time and troubleshoot problems that threaten the health of your nodes before they occur. + +Netdata runs permanently on all your physical/virtual servers, containers, cloud deployments, and edge/IoT devices. It +runs on Linux distributions (Ubuntu, Debian, CentOS, and more), container/microservice platforms (Kubernetes clusters, +Docker), and many other operating systems (FreeBSD, macOS), with no `sudo` required. + +<Install> + <InstallBox + to="#install-on-linux-with-one-line-installer-recommended" + os="General Linux with one-line installer (recommended)" + svg="linux" /> + <InstallBox + to="#run-netdata-with-docker" + os="Run with Docker" + svg="docker" /> + <InstallBox + to="/docs/agent/packaging/installer/methods/kubernetes" + os="Deploy on Kubernetes" + svg="kubernetes" /> + <InstallBox + to="/docs/agent/packaging/installer/methods/macos" + os="Install on macOS" + svg="macos" /> + <InstallBox + to="/docs/agent/packaging/installer/methods/packages" + os="Linux with .deb/.rpm packages" + svg="linux" /> + <InstallBox + to="/docs/agent/packaging/installer/methods/kickstart-64" + os="Linux with static 64-bit binary" + svg="linux" /> + <InstallBox + to="/docs/agent/packaging/installer/methods/manual" + os="Linux from Git" + svg="linux" /> + <InstallBox + to="/docs/agent/packaging/installer/methods/source" + os="Linux from source" + svg="linux" /> + <InstallBox + to="/docs/agent/packaging/installer/methods/offline" + os="Linux for offline nodes" + svg="linux" /> +</Install> + +## Install on Linux with one-line installer (recommended) + +The **recommended** way to install Netdata on a Linux node (physical, virtual, container, IoT) is our one-line +[kickstart script](/packaging/installer/methods/kickstart.md). This script automatically installs dependencies and +builds Netdata from its source code. + +Copy the script, paste it into your node's terminal, and hit `Enter` to begin the installation process. + +<OneLineInstall /> + +Jump down to [what's next](#whats-next) to learn how to view your new dashboard and take your next steps monitoring and +troubleshooting with Netdata. + +## Run Netdata with Docker + +You can also try out Netdata's capabilities in a [Docker container](/packaging/docker/README.md). Copy the following +`docker run` command into your node and hit `Enter` to download and run the container. + +```bash +docker run -d --name=netdata \ + -p 19999:19999 \ + -v netdataconfig:/etc/netdata \ + -v netdatalib:/var/lib/netdata \ + -v netdatacache:/var/cache/netdata \ + -v /etc/passwd:/host/etc/passwd:ro \ + -v /etc/group:/host/etc/group:ro \ + -v /proc:/host/proc:ro \ + -v /sys:/host/sys:ro \ + -v /etc/os-release:/host/etc/os-release:ro \ + --restart unless-stopped \ + --cap-add SYS_PTRACE \ + --security-opt apparmor=unconfined \ + netdata/netdata +``` + +## What's next? + +To start using Netdata, open a browser and navigate to `http://NODE:19999`, replacing `NODE` with either `localhost` or +the hostname/IP address of a remote node. + +Where you go from here is based on your use case, immediate needs, and experience with monitoring and troubleshooting. + +### Dashboard + +Learn more about [how the dashboard works](/docs/dashboard/how-dashboard-works.mdx), or dive directly into the many ways +to [interact with charts](/docs/dashboard/interact-charts.mdx). + +### Configuration + +Discover the recommended way to [configure Netdata's settings or behavior](/docs/configure/nodes.md) using our built-in +`edit-config` script, then apply that knowledge to mission-critical tweaks, such as [changing how long Netdata stores +metrics](/docs/store/change-metrics-storage.md). + +### Data collection + +If Netdata didn't autodetect all the hardware, containers, services, or applications running on your node, you should +learn more about [how data collectors work](/docs/collect/how-collectors-work.md). If there's a [supported +collector](/collectors/COLLECTORS.md) for metrics you need, [configure the collector](/docs/collect/enable-configure.md) +or read about its requirements to configure your endpoint to publish metrics in the correct format and endpoint. + +### Alarms & notifications + +Netdata comes with hundreds of preconfigured alarms, designed by our monitoring gurus in parallel with our open-source +community, but you may want to [edit alarms](/docs/monitor/configure-alarms.md) or [enable +notifications](/docs/monitor/enable-notifications.md) to customize your Netdata experience. + +### Need to monitor multiple nodes in one place? + +For robust multi-node monitoring from a single interface, consider [Netdata +Cloud](https://learn.netdata.cloud/docs/cloud), which streams, aggregates, and visualizes metrics from any number of +nodes. It's all the same out-of-the-box, zero-configuration functionality of the open-source monitoring agent, but for +any number of distributed nodes, _entirely for free_. + +There is an alternative for those who aren't interested in using Netdata Cloud, albeit with some required configuration. +Each node can [stream](/streaming/README.md) its metrics to any other node, and the default +[registry](/registry/README.md) is configurable to create a private "network" of Netdata dashboards. diff --git a/docs/get/README.md b/docs/get/README.md deleted file mode 100644 index 4bfc4878..00000000 --- a/docs/get/README.md +++ /dev/null @@ -1,159 +0,0 @@ -<!-- -title: "Get Netdata" -description: "Time to get Netdata's monitoring and troubleshooting solution. Sign in to Cloud, download the Agent everywhere, and connect it all together." -custom_edit_url: https://github.com/netdata/netdata/edit/master/docs/get/README.md ---> - -# Get Netdata - -import { OneLineInstall } from '../src/components/OneLineInstall/' -import { Install, InstallBox } from '../src/components/InstallBox/' - -Netdata uses the open-source Netdata Agent and Netdata Cloud web application -[together](/docs/overview/what-is-netdata.md) to help you collect every metric, visualize the health of your nodes, and -troubleshoot complex performance problems. Once you've signed in to Netdata Cloud and installed the Netdata Agent on all -your nodes, you can claim your nodes and see their real-time metrics on a single interface. - -## Sign in to Netdata Cloud - -If you don't already have a free Netdata Cloud account, go ahead and [create one](https://app.netdata.cloud). - -Choose your preferred authentication method and follow the onboarding process to create your Space. - -## Install the Netdata Agent - -The Netdata Agent runs permanently on all your physical/virtual servers, containers, cloud deployments, and edge/IoT -devices. It runs on Linux distributions (**Ubuntu**, **Debian**, **CentOS**, and more), container/microservice platforms -(**Kubernetes** clusters, **Docker**), and many other operating systems (**FreeBSD**, **macOS**), with no `sudo` -required. - -> ⚠️ Many distributions ship with third-party packages of Netdata, which we cannot maintain or keep up-to-date. For the -> best experience, use one of the methods described or linked to below. - -The **recommended** way to install the Netdata Agent on a Linux system is our one-line [kickstart -script](/packaging/installer/methods/kickstart.md). This script automatically installs dependencies and builds Netdata -from its source code. - -<OneLineInstall /> - -Copy the script, paste it into your node's terminal, and hit `Enter`. - -Open your favorite browser and navigate to `http://localhost:19999` or `http://NODE:19999`, replacing `NODE` with the -hostname or IP address of your system, to open the local Agent dashboard. - -<details> -<summary>Watch how the one-line installer works</summary> -<iframe width="820" height="460" src="https://www.youtube.com/embed/tVIp7ycK60A" frameborder="0" allow="accelerometer; autoplay; clipboard-write; encrypted-media; gyroscope; picture-in-picture" allowfullscreen></iframe> -</details> - -### Other operating systems/methods - -Want to install Netdata on a Kubernetes cluster, with Docker, or using a different method? Not a Linux user? Choose your -platform to see specific instructions. - -<Install> - <InstallBox - to="/docs/agent/packaging/installer/methods/kubernetes" - img="/img/index/methods/kubernetes.svg" - os="Kubernetes" /> - <InstallBox - to="/docs/agent/packaging/docker" - img="/img/index/methods/docker.svg" - os="Docker" /> - <InstallBox - to="/docs/agent/packaging/installer/methods/cloud-providers" - img="/img/index/methods/cloud.svg" - imgDark="/img/index/methods/cloud-dark.svg" - os="Cloud providers (GCP, AWS, Azure)" /> - <InstallBox - to="/docs/agent/packaging/installer/methods/packages" - img="/img/index/methods/package.svg" - imgDark="/img/index/methods/package-dark.svg" - os="Linux with .deb/.rpm" /> - <InstallBox - to="/docs/agent/packaging/installer/methods/kickstart-64" - img="/img/index/methods/static.svg" - imgDark="/img/index/methods/static-dark.svg" - os="Linux with static 64-bit binary" /> - <InstallBox - to="/docs/agent/packaging/installer/methods/manual" - img="/img/index/methods/git.svg" - imgDark="/img/index/methods/git-dark.svg" - os="Linux from Git" /> - <InstallBox - to="/docs/agent/packaging/installer/methods/freebsd" - img="/img/index/methods/freebsd.svg" - os="FreeBSD" /> - <InstallBox - to="/docs/agent/packaging/installer/methods/macos" - img="/img/index/methods/macos.svg" - os="MacOS" /> -</Install> - -Even more options available in our [packaging documentation](/packaging/installer/README.md#alternative-methods). - -## Claim your node to Netdata Cloud - -You need to [claim](/claim/README.md) your nodes to see them in Netdata Cloud. Claiming establishes a secure TLS -connection to Netdata Cloud using the [Agent-Cloud link](/aclk/README.md), and proves you have write and administrative -access to that node. - -When you view a node in Netdata Cloud, the Agent running on that node streams metrics, metadata, and alarm status to -Netdata Cloud, which in turn streams those metrics to your web browser. Netdata Cloud [does not -store](/docs/store/distributed-data-architecture.md#does-netdata-cloud-store-my-metrics) or log metrics values. - -To claim a node, you need to run the claiming script. In Netdata Cloud, click on your Space's name, then **Manage your -Space** in the dropdown. Click **Nodes** in the panel that appears. Copy the script and run it in your node's terminal. -The script looks like the following, with long strings instead of `TOKEN` and `ROOM1,ROOM2`: - -```bash -sudo netdata-claim.sh -token=TOKEN -rooms=ROOM1,ROOM2 -url=https://app.netdata.cloud -``` - -The script returns `Agent was successfully claimed.` after creating a new RSA pair and establishing the link to Netdata -Cloud. If the script returns an error, try our [troubleshooting tips](/claim/README.md#troubleshooting). - -> 💡 Our claiming reference guide also contains instructions for claiming [Docker -> containers](/claim/README.md#claim-an-agent-running-in-docker), [Kubernetes cluster parent -> pods](/claim/README.md#claim-an-agent-running-in-docker), via a [proxy](/claim/README.md#claim-through-a-proxy), and -> more. - -<details> -<summary>Watch how claiming nodes works</summary> -<iframe width="820" height="460" src="https://www.youtube.com/embed/UAzVvhMab8g" frameborder="0" allow="accelerometer; autoplay; clipboard-write; encrypted-media; gyroscope; picture-in-picture" allowfullscreen></iframe> -</details> - -For more information on the claiming process, why we implemented it, and how it works, see the [claim](/claim/README.md) -and [Agent-Cloud link](/aclk/README.md) reference docs. - -## Troubleshooting - -If you experience issues with installing the Netdata Agent, see our -[installation](/packaging/installer/README.md#troubleshooting-and-known-issues) reference. Our -[reinstall](/packaging/installer/REINSTALL.md) doc can help clean up your installation and get you back to monitoring. - -For Netdata Cloud issues, see the [Netdata Cloud reference docs](https://learn.netdata.cloud/docs/cloud). - -## What's next? - -At this point, you have set up your free Netdata Cloud account, installed the Netdata Agent on your node(s), and claimed -one or more nodes to your Space. You're ready to start monitoring, visualizing, and troubleshooting with Netdata. We -have two quickstart guides based on the scope of what you need to monitor. - -Interested in monitoring a single node? Check out our [single-node monitoring -quickstart](/docs/quickstart/single-node.md). - -If you're looking to monitor an entire infrastructure with Netdata, see the [infrastructure monitoring -quickstart](/docs/quickstart/infrastructure.md). - -Or, skip ahead to [Agent configuration](/docs/configure/nodes.md). - -### Related reference documentation - -- [Netdata Agent · Packaging & installer](/packaging/installer/README.md) -- [Netdata Agent · Reinstall Netdata](/packaging/installer/REINSTALL.md) -- [Netdata Agent · Update Netdata](/packaging/installer/UPDATE.md) -- [Netdata Agent · Agent-Cloud link](/aclk/README.md) -- [Netdata Agent · Agent claiming](/claim/README.md) - -[](<>) diff --git a/docs/guides/configure/performance.md b/docs/guides/configure/performance.md index 5f93a8cd..8e010897 100644 --- a/docs/guides/configure/performance.md +++ b/docs/guides/configure/performance.md @@ -155,6 +155,12 @@ All the settings are found in the `[global]` section of `netdata.conf`: dbengine multihost disk space = 256 ``` +Metric retention is not important in certain use cases, such as: + - Data collection nodes stream collected metrics collected to a centralization point. + - Data collection nodes export their metrics to another time series DB, or are scraped by Prometheus + - Netdata installed only during incidents, to get richer information. +In such cases, you may not want to use the dbengine at all and instead opt for memory mode `memory mode = ram` or `memory mode = none`. + ## Run Netdata behind Nginx A dedicated web server like Nginx provides far more robustness than the Agent's internal [web server](/web/README.md). diff --git a/docs/guides/monitor/anomaly-detection.md b/docs/guides/monitor/anomaly-detection.md index 2fa4896c..f680f5f2 100644 --- a/docs/guides/monitor/anomaly-detection.md +++ b/docs/guides/monitor/anomaly-detection.md @@ -35,7 +35,7 @@ server](https://user-images.githubusercontent.com/1153921/103586700-da5b0a00-4ea ## Prerequisites -- A node running the Netdata Agent. If you don't yet have that, [get Netdata](/docs/get/README.md). +- A node running the Netdata Agent. If you don't yet have that, [get Netdata](/docs/get-started.mdx). - A Netdata Cloud account. [Sign up](https://app.netdata.cloud) if you don't have one already. - Familiarity with configuring the Netdata Agent with [`edit-config`](/docs/configure/nodes.md). - _Optional_: An Nginx web server running on the same node to follow the example configuration steps. @@ -55,7 +55,7 @@ repo](https://github.com/netdata/community/tree/main/netdata-agent-api/netdata-p sudo su -s /bin/bash netdata # Install required packages for the netdata user -pip3 install --user netdata-pandas==0.0.32 numba==0.50.1 scikit-learn==0.23.2 pyod==0.8.3 +pip3 install --user netdata-pandas==0.0.38 numba==0.50.1 scikit-learn==0.23.2 pyod==0.8.3 ``` > If the `pip3` command fails, you need to install it. For example, on an Ubuntu system, use `sudo apt install diff --git a/docs/guides/monitor/lamp-stack.md b/docs/guides/monitor/lamp-stack.md index f11dfe5b..95aa03f0 100644 --- a/docs/guides/monitor/lamp-stack.md +++ b/docs/guides/monitor/lamp-stack.md @@ -56,8 +56,8 @@ To follow this tutorial, you need: ## Install the Netdata Agent -If you don't have the free, open-source [Netdata Agent](/docs/get/README.md) installed on your node yet, get started -with a [single kickstart command](/packaging/installer/methods/kickstart.md): +If you don't have the free, open-source Netdata monitoring agent installed on your node yet, get started with a [single +kickstart command](/docs/get-started.mdx): ```bash bash <(curl -Ss https://my-netdata.io/kickstart.sh) @@ -167,8 +167,7 @@ If the Netdata Agent isn't already open in your browser, open a new tab and navi > If you [signed up](https://app.netdata.cloud/sign-up?cloudRoute=/spaces) for Netdata Cloud earlier, you can also view > the exact same LAMP stack metrics there, plus additional features, like drag-and-drop custom dashboards. Be sure to -> [claim your node](/docs/get/README.md#claim-your-node-to-netdata-cloud) to start streaming metrics to your browser -> through Netdata Cloud. +> [claim your node](/claim/README.md) to start streaming metrics to your browser through Netdata Cloud. Netdata automatically organizes all metrics and charts onto a single page for easy navigation. Peek at gauges to see overall system performance, then scroll down to see more. Click-and-drag with your mouse to pan _all_ charts back and @@ -240,7 +239,7 @@ source of issues faster with [Metric Correlations](https://learn.netdata.cloud/d ### Related reference documentation -- [Netdata Agent · Get Netdata](/docs/get/README.md) +- [Netdata Agent · Get started](/docs/get-started.mdx) - [Netdata Agent · Apache data collector](https://learn.netdata.cloud/docs/agent/collectors/go.d.plugin/modules/apache) - [Netdata Agent · Web log collector](https://learn.netdata.cloud/docs/agent/collectors/go.d.plugin/modules/weblog) - [Netdata Agent · MySQL data collector](https://learn.netdata.cloud/docs/agent/collectors/go.d.plugin/modules/mysql) diff --git a/docs/guides/monitor/process.md b/docs/guides/monitor/process.md index 0f7c6861..d322035b 100644 --- a/docs/guides/monitor/process.md +++ b/docs/guides/monitor/process.md @@ -34,8 +34,8 @@ With Netdata's process monitoring, you can: ## Prerequisites -- One or more Linux nodes running the [Netdata Agent](/docs/get/README.md). If you need more time to understand - Netdata before following this guide, see the [infrastructure](/docs/quickstart/infrastructure.md) or +- One or more Linux nodes running [Netdata](/docs/get-started.mdx). If you need more time to understand Netdata before + following this guide, see the [infrastructure](/docs/quickstart/infrastructure.md) or [single-node](/docs/quickstart/single-node.md) monitoring quickstarts. - A general understanding of how to [configure the Netdata Agent](/docs/configure/nodes.md) using `edit-config`. - A Netdata Cloud account. [Sign up](https://app.netdata.cloud) if you don't have one already. diff --git a/docs/guides/monitor/raspberry-pi-anomaly-detection.md b/docs/guides/monitor/raspberry-pi-anomaly-detection.md index f5587a89..90ad763b 100644 --- a/docs/guides/monitor/raspberry-pi-anomaly-detection.md +++ b/docs/guides/monitor/raspberry-pi-anomaly-detection.md @@ -24,8 +24,8 @@ Read on to learn all the steps and enable unsupervised anomaly detection on your ## What you need to get started - A Raspberry Pi running Raspbian, which we'll call a _node_. -- The [open-source Netdata Agent](https://github.com/netdata/netdata). If you don't have it installed on your node yet, - [get it now](/docs/get/README.md). +- The [open-source Netdata](https://github.com/netdata/netdata) monitoring agent. If you don't have it installed on your + node yet, [get started now](/docs/get-started.mdx). ## Install dependencies @@ -56,7 +56,7 @@ sudo su -s /bin/bash netdata Then pass in the location to find `llvm` as an environment variable for `pip3`. ```bash -LLVM_CONFIG=llvm-config-9 pip3 install --user llvmlite numpy==1.20.1 netdata-pandas==0.0.32 numba==0.50.1 scikit-learn==0.23.2 pyod==0.8.3 +LLVM_CONFIG=llvm-config-9 pip3 install --user llvmlite numpy==1.20.1 netdata-pandas==0.0.38 numba==0.50.1 scikit-learn==0.23.2 pyod==0.8.3 ``` ## Enable the anomalies collector @@ -121,7 +121,7 @@ feedback on our [community forum](https://community.netdata.cloud/t/anomalies-co ### Related reference documentation -- [Netdata Agent · Get Netdata](/docs/get/README.md) +- [Netdata Agent · Get Netdata](/docs/get-started.mdx) - [Netdata Agent · Anomalies collector](/collectors/python.d.plugin/anomalies/README.md) [](<>) diff --git a/docs/guides/monitor/statsd.md b/docs/guides/monitor/statsd.md index 9b1de304..120715b1 100644 --- a/docs/guides/monitor/statsd.md +++ b/docs/guides/monitor/statsd.md @@ -215,7 +215,7 @@ To enable this StatsD configuration, [restart Netdata](/docs/configure/start-sto ## Final touches -At this point, you have used StatsD to gather metrics for k6, creating a whole new section in your Netdata dashboard in the process. Uil can further customize the icon of the particular section, as well as the description for each chart. +At this point, you have used StatsD to gather metrics for k6, creating a whole new section in your Netdata dashboard in the process. Moreover, you can further customize the icon of the particular section, as well as the description for each chart. To edit the section, please follow the Netdata [documentation](https://learn.netdata.cloud/docs/agent/web/gui#customizing-the-local-dashboard). diff --git a/docs/guides/python-collector.md b/docs/guides/python-collector.md index f327da32..0478bffe 100644 --- a/docs/guides/python-collector.md +++ b/docs/guides/python-collector.md @@ -29,7 +29,7 @@ covered here, or use the included examples for collecting and organizing eithre ## What you need to get started - A physical or virtual Linux system, which we'll call a _node_. -- A working installation of the free, open-source [Netdata Agent](/docs/get/README.md). +- A working installation of the free and open-source [Netdata](/docs/get-started.mdx) monitoring agent. ## Jobs and elements of a Python collector diff --git a/docs/guides/step-by-step/step-10.md b/docs/guides/step-by-step/step-10.md index 28ab47c6..d1c065c5 100644 --- a/docs/guides/step-by-step/step-10.md +++ b/docs/guides/step-by-step/step-10.md @@ -104,6 +104,8 @@ upstream backend { server { listen 80; + # uncomment the line if you want nginx to listen on IPv6 address + #listen [::]:80; # Change `example.com` to match your domain name. server_name netdata.example.com; diff --git a/docs/guides/troubleshoot/monitor-debug-applications-ebpf.md b/docs/guides/troubleshoot/monitor-debug-applications-ebpf.md index 13efa20e..d6c4b069 100644 --- a/docs/guides/troubleshoot/monitor-debug-applications-ebpf.md +++ b/docs/guides/troubleshoot/monitor-debug-applications-ebpf.md @@ -91,7 +91,7 @@ Let's turn on the `return` mode for more granularity when debugging Firefox's be ```bash cd /etc/netdata # Replace this path with your Netdata config directory -sudo ./edit-config ebpf.conf +sudo ./edit-config ebpf.d.conf ``` Replace `entry` with `return`: diff --git a/docs/metrics-storage-management/enable-streaming.mdx b/docs/metrics-storage-management/enable-streaming.mdx new file mode 100644 index 00000000..65acdb14 --- /dev/null +++ b/docs/metrics-storage-management/enable-streaming.mdx @@ -0,0 +1,151 @@ +--- +title: "Enable streaming between nodes" +description: "With metrics streaming enabled, you can not only replicate metrics data into a second database, but also view dashboards and trigger alarm notifications for multiple nodes in parallel." +type: how-to +custom_edit_url: https://github.com/netdata/netdata/edit/master/docs/metrics-storage-management/enable-streaming.mdx +--- + +# Enable streaming between nodes + +The simplest streaming configuration is **replication**, in which a child node streams its metrics in real time to a +parent node, and both nodes retain metrics in their own databases. + +To configure replication, you need two nodes, each running Netdata. First you'll first enable streaming on your parent +node, then enable streaming on your child node. When you're finished, you'll be able to see the child node's metrics in +the parent node's dashboard, quickly switch between the two dashboards, and be able to serve [alarm +notifications](/docs/monitor/enable-notifications.md) from either or both nodes. + +## Enable streaming on the parent node + +First, log onto the node that will act as the parent. + +Run `uuidgen` to create a new API key, which is a randomly-generated machine GUID the Netdata Agent uses to identify +itself while initiating a streaming connection. Copy that into a separate text file for later use. + +> Find out how to [install `uuidgen`](https://command-not-found.com/uuidgen) on your node if you don't already have it. + +Next, open `stream.conf` using [`edit-config`](/docs/configure/nodes.md#use-edit-config-to-edit-configuration-files) +from within the [Netdata config directory](/docs/configure/nodes.md#the-netdata-config-directory). + +```bash +cd /etc/netdata +sudo ./edit-config stream.conf +``` + +Scroll down to the section beginning with `[API_KEY]`. Paste the API key you generated earlier between the brackets, so +that it looks like the following: + +```conf +[11111111-2222-3333-4444-555555555555] +``` + +Set `enabled` to `yes`, and `default memory mode` to `dbengine`. Leave all the other settings as their defaults. A +simplified version of the configuration, minus the commented lines, looks like the following: + +```conf +[11111111-2222-3333-4444-555555555555] + enabled = yes + default memory mode = dbengine +``` + +Save the file and close it, then restart Netdata with `sudo systemctl restart netdata`, or the [appropriate +method](/docs/configure/start-stop-restart.md) for your system. + +## Enable streaming on the child node + +Connect to your child node with SSH. + +Open `stream.conf` again. Scroll down to the `[stream]` section and set `enabled` to `yes`. Paste the IP address of your +parent node at the end of the `destination` line, and paste the API key generated on the parent node onto the `api key` +line. + +Leave all the other settings as their defaults. A simplified version of the configuration, minus the commented lines, +looks like the following: + +```conf +[stream] + enabled = yes + destination = 203.0.113.0 + api key = 11111111-2222-3333-4444-555555555555 +``` + +Save the file and close it, then restart Netdata with `sudo systemctl restart netdata`, or the [appropriate +method](/docs/configure/start-stop-restart.md) for your system. + +## Enable TLS/SSL on streaming (optional) + +While encrypting the connection between your parent and child nodes is recommended for security, it's not required to +get started. If you're not interested in encryption, skip ahead to [view streamed +metrics](#view-streamed-metrics-in-netdata-s-dashboard). + +In this example, we'll use self-signed certificates. + +On the **parent** node, use OpenSSL to create the key and certificate, then use `chown` to make the new files readable +by the `netdata` user. + +```bash +sudo openssl req -newkey rsa:2048 -nodes -sha512 -x509 -days 365 -keyout /etc/netdata/ssl/key.pem -out /etc/netdata/ssl/cert.pem +sudo chown netdata:netdata /etc/netdata/ssl/cert.pem k/etc/netdata/ssl/ey.pem +``` + +Next, enforce TLS/SSL on the web server. Open `netdata.conf`, scroll down to the `[web]` section, and look for the `bind +to` setting. Add `^SSL=force` to turn on TLS/SSL. See the [web server +reference](/web/server/README.md#enabling-tls-support) for other TLS/SSL options. + +```conf +[web] + bind to = *=dashboard|registry|badges|management|streaming|netdata.conf^SSL=force +``` + +Next, connect to the **child** node and open `stream.conf`. Add `:SSL` to the end of the existing `destination` setting +to connect to the parent using TLS/SSL. Uncomment the `ssl skip certificate verification` line to allow the use of +self-signed certificates. + +```conf +[stream] + enabled = yes + destination = 203.0.113.0:SSL + ssl skip certificate verification = yes + api key = 11111111-2222-3333-4444-555555555555 +``` + +Restart both the parent and child nodes with `sudo systemctl restart netdata`, or the [appropriate +method](/docs/configure/start-stop-restart.md) for your system, to stream encrypted metrics using TLS/SSL. + +## View streamed metrics in Netdata's dashboard + +At this point, the child node is streaming its metrics in real time to its parent. Open the local Agent dashboard for +the parent by navigating to `http://PARENT-NODE:19999` in your browser, replacing `PARENT-NODE` with its IP address or +hostname. + +This dashboard shows parent metrics. To see child metrics, open the left-hand sidebar with the hamburger icon + +in the top panel. Both nodes appear under the **Replicated Nodes** menu. Click on either of the links to switch between +separate parent and child dashboards. + + + +The child dashboard is also available directly at `http://PARENT-NODE:19999/host/CHILD-HOSTNAME`, which in this example +is `http://203.0.113.0:19999/host/netdata-child`. + +## What's next? + +Now that you have a basic streaming setup with replication, you may want to tweak the configuration to eliminate the +child database, disable the child dashboard, or enable SSL on the streaming connection between the parent and child. + +See the [streaming reference +doc](/docs/metrics-storage-management/reference-streaming.mdx#supported-streaming-configurations) for details about +other possible configurations. + +When using Netdata's default TSDB (`dbengine`), the parent node maintains separate, parallel databases for itself and +every child node streaming to it. Each instance is sized identically based on the `dbengine multihost disk space` +setting in `netdata.conf`. See our doc on [changing metrics retention](/docs/store/change-metrics-storage.md) for +details. + +### Related information & further reading + +- Streaming + - [How Netdata streams metrics](/docs/metrics-storage-management/how-streaming-works.mdx) + - **[Enable streaming between nodes](/docs/metrics-storage-management/enable-streaming.mdx)** + - [Streaming reference](/docs/metrics-storage-management/reference-streaming.mdx)
\ No newline at end of file diff --git a/docs/metrics-storage-management/how-streaming-works.mdx b/docs/metrics-storage-management/how-streaming-works.mdx new file mode 100644 index 00000000..ecbce39b --- /dev/null +++ b/docs/metrics-storage-management/how-streaming-works.mdx @@ -0,0 +1,92 @@ +--- +title: "How metrics streaming works" +description: "Netdata's real-time streaming allows you to replicate metrics data across multiple nodes, or centralize all your metrics data into a single time-series database (TSDB)." +type: explanation +custom_edit_url: https://github.com/netdata/netdata/edit/master/docs/metrics-storage-management/how-streaming-works.mdx +--- + +# How metrics streaming works + +Each node running Netdata can stream the metrics it collects, in real time, to another node. Streaming allows you to +replicate metrics data across multiple nodes, or centralize all your metrics data into a single time-series database +(TSDB). + +When one node streams metrics to another, the node receiving metrics can visualize them on the +[dashboard](/docs/visualize/interact-dashboards-charts.md), run health checks to [trigger +alarms](/docs/monitor/view-active-alarms.md) and [send notifications](/docs/monitor/enable-notifications.md), and +[export](/docs/export/external-databases.md) all metrics to an external TSDB. When Netdata streams metrics to another +Netdata, the receiving one is able to perform everything a Netdata instance is capable of. + +Streaming lets you decide exactly how you want to store and maintain metrics data. While we believe Netdata's +[distributed architecture](/docs/store/distributed-data-architecture.md) is ideal for speed and scale, streaming +provides centralization options for those who want to maintain only a single TSDB instance. + +## Streaming basics + +There are three types of nodes in Netdata's streaming ecosystem. + +- **Parent**: A node, running Netdata, that receives streamed metric data. +- **Child**: A node, running Netdata, that streams metric data to one or more parent. +- **Proxy**: A node, running Netdata, that receives metric data from a child and "forwards" them on to a + separate parent node. + +Netdata uses API keys, which are just random GUIDs, to authorize the communication between child and parent nodes. We +recommend using `uuidgen` for generating API keys, which can then be used across any number of streaming connections. +Or, you can generate unique API keys for each parent-child relationship. + +Once the parent node authorizes the child's API key, the child can start streaming metrics. + +It's important to note that the streaming connection uses TCP, UDP, or Unix sockets, _not HTTP_. To proxy streaming +metrics, you need to use a proxy that tunnels [OSI layer 4-7 +traffic](https://en.wikipedia.org/wiki/OSI_model#Layer_4:_Transport_Layer) without interfering with it, such as +[SOCKS](https://en.wikipedia.org/wiki/SOCKS) or Nginx's [TCP/UDP load +balancing](https://docs.nginx.com/nginx/admin-guide/load-balancer/tcp-udp-load-balancer/). + +## Supported streaming configurations + +Netdata supports any combination of parent, child, and proxy nodes that you can imagine. Any node can act as both a +parent, child, or proxy at the same time, sending or receiving streaming metrics from any number of other nodes. + +Here are a few example streaming configurations: + +- **Headless collector**: + - Child `A`, _without_ a database or web dashboard, streams metrics to parent `B`. + - `A` metrics are only available via the local Agent dashboard for `B`. + - `B` generates alarms for `A`. +- **Replication**: + - Child `A`, _with_ a database and web dashboard, streams metrics to parent `B`. + - `A` metrics are available on both local Agent dashboards, and can be stored with the same or different metrics + retention policies. + - Both `A` and `B` generate alarms. +- **Proxy**: + - Child `A`, _with or without_ a database, sends metrics to proxy `C`, also _with or without_ a database. `C` sends + metrics to parent `B`. + - Any node with a database can generate alarms. + +## Viewing streamed metrics + +Parent nodes feature a **Replicated Nodes** section in the left-hand panel, which opens with the hamburger icon + +in the top navigation. The parent node, plus any child nodes, appear here. Click on any of the hostnames to switch +between parent and child dashboards, all served by the parent's [web server](/web/server/README.md). + + + +Each child dashboard is also available directly at the following URL pattern: +`http://PARENT-NODE:19999/host/CHILD-HOSTNAME`. + +## What's next? + +Now that you understand the fundamentals of streaming metrics between nodes, go ahead and [enable +streaming](/docs/metrics-storage-management/enable-streaming.mdx) using a simple `parent-child` relationship. For all +the details, see the [streaming reference](/docs/metrics-storage-management/reference-streaming.mdx) doc. + +Take your streaming setup even further by [exporting metrics](/docs/export/external-databases.md) to an external TSDB. + +### Related information & further reading + +- Streaming + - **[How Netdata streams metrics](/docs/metrics-storage-management/how-streaming-works.mdx)** + - [Enable streaming between nodes](/docs/metrics-storage-management/enable-streaming.mdx) + - [Streaming reference](/docs/metrics-storage-management/reference-streaming.mdx)
\ No newline at end of file diff --git a/docs/metrics-storage-management/reference-streaming.mdx b/docs/metrics-storage-management/reference-streaming.mdx new file mode 100644 index 00000000..1be597dd --- /dev/null +++ b/docs/metrics-storage-management/reference-streaming.mdx @@ -0,0 +1,486 @@ +--- +title: "Streaming reference" +description: "Each node running Netdata can stream the metrics it collects, in real time, to another node. See all of the available settings in this reference document." +type: reference +custom_edit_url: https://github.com/netdata/netdata/edit/master/docs/metrics-storage-management/reference-streaming.mdx +--- + +# Streaming reference + +Each node running Netdata can stream the metrics it collects, in real time, to another node. To learn more, read about +[how streaming works](/docs/metrics-storage-management/how-streaming-works.mdx). + +For a quickstart guide for enabling a simple `parent-child` streaming relationship, see our [stream metrics between +nodes](/docs/metrics-storage-management/enable-streaming.mdx) doc. All other configuration options and scenarios are +covered in the sections below. + +## Configuration + +There are two files responsible for configuring Netdata's streaming capabilities: `stream.conf` and `netdata.conf`. + +From within your Netdata config directory (typically `/etc/netdata`), [use `edit-config`](/docs/configure/nodes.md) to +open either `stream.conf` or `netdata.conf`. + +``` +sudo ./edit-config stream.conf +sudo ./edit-config netdata.conf +``` + +## Settings + +As mentioned above, both `stream.conf` and `netdata.conf` contain settings relevant to streaming. + +### `stream.conf` + +The `stream.conf` file contains three sections. The `[stream]` section is for configuring child nodes. + +The `[API_KEY]` and `[MACHINE_GUID]` sections are both for configuring parent nodes, and share the same settings. +`[API_KEY]` settings affect every child node using that key, whereas `[MACHINE_GUID]` settings affect only the child +node with a matching GUID. + +The file `/var/lib/netdata/registry/netdata.public.unique.id` contains a random GUID that **uniquely identifies each +node**. This file is automatically generated by Netdata the first time it is started and remains unaltered forever. + +#### `[stream]` section + +| Setting | Default | Description | +| :---------------------------------------------- | :------------------------ | :-------------------------------------------------------------------------------------------------------------------------------------------------------------------------------------------------------------------------------------------------------------------------------------------------------------------------------------------------------- | +| `enabled` | `no` | Whether this node streams metrics to any parent. Change to `yes` to enable streaming. | +| [`destination`](#destination) | ` ` | A space-separated list of parent nodes to attempt to stream to, with the first available parent receiving metrics, using the following format: `[PROTOCOL:]HOST[%INTERFACE][:PORT][:SSL]`. [Read more →](#destination) | +| `ssl skip certificate verification` | `yes` | If you want to accept self-signed or expired certificates, set to `yes` and uncomment. | +| `CApath` | `/etc/ssl/certs/` | The directory where known certificates are found. Defaults to OpenSSL's default path. | +| `CAfile` | `/etc/ssl/certs/cert.pem` | Add a parent node certificate to the list of known certificates in `CAPath`. | +| `api key` | ` ` | The `API_KEY` to use as the child node. | +| `timeout seconds` | `60` | The timeout to connect and send metrics to a parent. | +| `default port` | `19999` | The port to use if `destination` does not specify one. | +| [`send charts matching`](#send-charts-matching) | `*` | A space-separated list of [Netdata simple patterns](/libnetdata/simple_pattern/README.md) to filter which charts are streamed. [Read more →](#send-charts-matching) | +| `buffer size bytes` | `1048576` | The size of the buffer to use when sending metrics. The default `1048576` equals a buffer of 1MB, which is good for 10-20 seconds of data. Increase this if you expect latencies higher than that. The buffer is flushed on reconnect. | +| `reconnect delay seconds` | `5` | How long to wait until retrying to connect to the parent node. | +| `initial clock resync iterations` | `60` | Sync the clock of charts for how many seconds when starting. | + +### `[API_KEY]` and `[MACHINE_GUID]` sections + +| Setting | Default | Description | +| :---------------------------------------------- | :------------------------ | :-------------------------------------------------------------------------------------------------------------------------------------------------------------------------------------------------------------------------------------------------------------------------------------------------------------------------------------------------------- | +| `enabled` | `no` | Whether this API KEY enabled or disabled. | +| [`allow from`](#allow-from) | `*` | A space-separated list of [Netdata simple patterns](/libnetdata/simple_pattern/README.md) matching the IPs of nodes that will stream metrics using this API key. [Read more →](#allow-from) | +| `default history` | `3600` | The default amount of child metrics history to retain when using the `save`, `map`, or `ram` memory modes. | +| [`default memory mode`](#default-memory-mode) | `ram` | The [database](/database/README.md) to use for all nodes using this `API_KEY`. Valid settings are `dbengine`, `map`, `save`, `ram`, or `none`. [Read more →](#default-memory-mode) | +| `health enabled by default` | `auto` | Whether alarms and notifications should be enabled for nodes using this `API_KEY`. `auto` enables alarms when the child is connected. `yes` enables alarms always, and `no` disables alarms. | +| `default postpone alarms on connect seconds` | `60` | Postpone alarms and notifications for a period of time after the child connects. | +| `default proxy enabled` | ` ` | Route metrics through a proxy. | +| `default proxy destination` | ` ` | Space-separated list of `IP:PORT` for proxies. | +| `default proxy api key` | ` ` | The `API_KEY` of the proxy. | +| `default send charts matching` | `*` | See [`send charts matching`](#send-charts-matching). | + +#### `destination` + +A space-separated list of parent nodes to attempt to stream to, with the first available parent receiving metrics, using +the following format: `[PROTOCOL:]HOST[%INTERFACE][:PORT][:SSL]`. + +- `PROTOCOL`: `tcp`, `udp`, or `unix`. (only tcp and unix are supported by parent nodes) +- `HOST`: A IPv4, IPv6 IP, or a hostname, or a unix domain socket path. IPv6 IPs should be given with brackets + `[ip:address]`. +- `INTERFACE` (IPv6 only): The network interface to use. +- `PORT`: The port number or service name (`/etc/services`) to use. +- `SSL`: To enable TLS/SSL encryption of the streaming connection. + +To enable TCP streaming to a parent node at `203.0.113.0` on port `20000` and with TLS/SSL encryption: + +```conf +[stream] + destination = tcp:203.0.113.0:20000:SSL +``` + +#### `send charts matching` + +A space-separated list of [Netdata simple patterns](/libnetdata/simple_pattern/README.md) to filter which charts are streamed. + +The default is a single wildcard `*`, which streams all charts. + +To send only a few charts, list them explicitly, or list a group using a wildcard. To send _only_ the `apps.cpu` chart +and charts with contexts beginning with `system.`: + +```conf +[stream] + send charts matching = apps.cpu system.* +``` + +To send all but a few charts, use `!` to create a negative match. To send _all_ charts _but_ `apps.cpu`: + +```conf +[stream] + send charts matching = !apps.cpu * +``` + +#### `allow from` + +A space-separated list of [Netdata simple patterns](/libnetdata/simple_pattern/README.md) matching the IPs of nodes that +will stream metrics using this API key. The order is important, left to right, as the first positive or negative match is used. + +The default is `*`, which accepts all requests including the `API_KEY`. + +To allow from only a specific IP address: + +```conf +[API_KEY] + allow from = 203.0.113.10 +``` + +To allow all IPs starting with `10.*`, except `10.1.2.3`: + +```conf +[API_KEY] + allow from = !10.1.2.3 10.* +``` + +> If you set specific IP addresses here, and also use the `allow connections` setting in the `[web]` section of +> `netdata.conf`, be sure to add the IP address there so that it can access the API port. + +#### `default memory mode` + +The [database](/database/README.md) to use for all nodes using this `API_KEY`. Valid settings are `dbengine`, `ram`, +`save`, `map`, or `none`. + +- `dbengine`: The default, recommended time-series database (TSDB) for Netdata. Stores recent metrics in memory, then + efficiently spills them to disk for long-term storage. +- `ram`: Stores metrics _only_ in memory, which means metrics are lost when Netdata stops or restarts. Ideal for + streaming configurations that use ephemeral nodes. +- `save`: Stores metrics in memory, but saves metrics to disk when Netdata stops or restarts, and loads historical + metrics on start. +- `map`: Stores metrics in memory-mapped files, like swap, with constant disk write. +- `none`: No database. + +When using `default memory mode = dbengine`, the parent node creates a separate instance of the TSDB to store metrics +from child nodes. The [size of _each_ instance is configurable](/docs/store/change-metrics-storage.md) with the `page +cache size` and `dbengine multihost disk space` settings in the `[global]` section in `netdata.conf`. + +### `netdata.conf` + +| Setting | Default | Description | +| :----------------------------------------- | :---------------- | :--------------------------------------------------------------------------------------------------------------------------------------------------------------------------------------------------------------------------------------------------------------------------- | +| **`[global]` section** | | | +| `memory mode` | `dbengine` | Determines the [database type](/database/README.md) to be used on that node. Other options settings include `none`, `ram`, `save`, and `map`. `none` disables the database at this host. This also disables alarms and notifications, as those can't run without a database. | +| **`[web]` section** | | | +| `mode` | `static-threaded` | Determines the [web server](/web/server/README.md) type. The other option is `none`, which disables the dashboard, API, and registry. | +| `accept a streaming request every seconds` | `0` | Set a limit on how often a parent node accepts streaming requests from child nodes. `0` equals no limit. If this is set, you may see `... too busy to accept new streaming request. Will be allowed in X secs` in Netdata's `error.log`. | + +## Examples + +### Per-child settings + +While the `[API_KEY]` section applies settings for any child node using that key, you can also use per-child settings +with the `[MACHINE_GUID]` section. + +For example, the metrics streamed from only the child node with `MACHINE_GUID` are saved in memory, not using the +default `dbengine` as specified by the `API_KEY`, and alarms are disabled. + +```conf +[API_KEY] + enabled = yes + default memory mode = dbengine + health enabled by default = auto + allow from = * + +[MACHINE_GUID] + enabled = yes + memory mode = save + health enabled = no +``` + +### Securing streaming with TLS/SSL + +Netdata does not activate TLS encryption by default. To encrypt streaming connections, you first need to [enable TLS +support](/web/server/README.md#enabling-tls-support) on the parent. With encryption enabled on the receiving side, you +need to instruct the child to use TLS/SSL as well. On the child's `stream.conf`, configure the destination as follows: + +``` +[stream] + destination = host:port:SSL +``` + +The word `SSL` appended to the end of the destination tells the child that connections must be encrypted. + +> While Netdata uses Transport Layer Security (TLS) 1.2 to encrypt communications rather than the obsolete SSL protocol, +> it's still common practice to refer to encrypted web connections as `SSL`. Many vendors, like Nginx and even Netdata +> itself, use `SSL` in configuration files, whereas documentation will always refer to encrypted communications as `TLS` +> or `TLS/SSL`. + +#### Certificate verification + +When TLS/SSL is enabled on the child, the default behavior will be to not connect with the parent unless the server's +certificate can be verified via the default chain. In case you want to avoid this check, add the following to the +child's `stream.conf` file: + +``` +[stream] + ssl skip certificate verification = yes +``` + +#### Trusted certificate + +If you've enabled [certificate verification](#certificate-verification), you might see errors from the OpenSSL library +when there's a problem with checking the certificate chain (`X509_V_ERR_UNABLE_TO_GET_ISSUER_CERT_LOCALLY`). More +importantly, OpenSSL will reject self-signed certificates. + +Given these known issues, you have two options. If you trust your certificate, you can set the options `CApath` and +`CAfile` to inform Netdata where your certificates, and the certificate trusted file, are stored. + +For more details about these options, you can read about [verify +locations](https://www.openssl.org/docs/man1.1.1/man3/SSL_CTX_load_verify_locations.html). + +Before you changed your streaming configuration, you need to copy your trusted certificate to your child system and add +the certificate to OpenSSL's list. + +On most Linux distributions, the `update-ca-certificates` command searches inside the `/usr/share/ca-certificates` +directory for certificates. You should double-check by reading the `update-ca-certificate` manual (`man +update-ca-certificate`), and then change the directory in the below commands if needed. + +If you have `sudo` configured on your child system, you can use that to run the following commands. If not, you'll have +to log in as `root` to complete them. + +``` +# mkdir /usr/share/ca-certificates/netdata +# cp parent_cert.pem /usr/share/ca-certificates/netdata/parent_cert.crt +# chown -R netdata.netdata /usr/share/ca-certificates/netdata/ +``` + +First, you create a new directory to store your certificates for Netdata. Next, you need to change the extension on your +certificate from `.pem` to `.crt` so it's compatible with `update-ca-certificate`. Finally, you need to change +permissions so the user that runs Netdata can access the directory where you copied in your certificate. + +Next, edit the file `/etc/ca-certificates.conf` and add the following line: + +``` +netdata/parent_cert.crt +``` + +Now you update the list of certificates running the following, again either as `sudo` or `root`: + +``` +# update-ca-certificates +``` + +> Some Linux distributions have different methods of updating the certificate list. For more details, please read this +> guide on [adding trusted root certificates](https://github.com/Busindre/How-to-Add-trusted-root-certificates). + +Once you update your certificate list, you can set the stream parameters for Netdata to trust the parent certificate. +Open `stream.conf` for editing and change the following lines: + +``` +[stream] + CApath = /etc/ssl/certs/ + CAfile = /etc/ssl/certs/parent_cert.pem +``` + +With this configuration, the `CApath` option tells Netdata to search for trusted certificates inside `/etc/ssl/certs`. +The `CAfile` option specifies the Netdata parent certificate is located at `/etc/ssl/certs/parent_cert.pem`. With this +configuration, you can skip using the system's entire list of certificates and use Netdata's parent certificate instead. + +#### Expected behaviors + +With the introduction of TLS/SSL, the parent-child communication behaves as shown in the table below, depending on the +following configurations: + +- **Parent TLS (Yes/No)**: Whether the `[web]` section in `netdata.conf` has `ssl key` and `ssl certificate`. +- **Parent port TLS (-/force/optional)**: Depends on whether the `[web]` section `bind to` contains a `^SSL=force` or + `^SSL=optional` directive on the port(s) used for streaming. +- **Child TLS (Yes/No)**: Whether the destination in the child's `stream.conf` has `:SSL` at the end. +- **Child TLS Verification (yes/no)**: Value of the child's `stream.conf` `ssl skip certificate verification` + parameter (default is no). + +| Parent TLS enabled | Parent port SSL | Child TLS | Child SSL Ver. | Behavior | +| :----------------- | :--------------- | :-------- | :------------- | :--------------------------------------------------------------------------------------------------------------------------------------- | +| No | - | No | no | Legacy behavior. The parent-child stream is unencrypted. | +| Yes | force | No | no | The parent rejects the child connection. | +| Yes | -/optional | No | no | The parent-child stream is unencrypted (expected situation for legacy child nodes and newer parent nodes) | +| Yes | -/force/optional | Yes | no | The parent-child stream is encrypted, provided that the parent has a valid TLS/SSL certificate. Otherwise, the child refuses to connect. | +| Yes | -/force/optional | Yes | yes | The parent-child stream is encrypted. | + +### Proxy + +A proxy is a node that receives metrics from a child, then streams them onward to a parent. To configure a proxy, +configure it as a receiving and a sending Netdata at the same time. + +Netdata proxies may or may not maintain a database for the metrics passing through them. When they maintain a database, +they can also run health checks (alarms and notifications) for the remote host that is streaming the metrics. + +In the following example, the proxy receives metrics from a child node using the `API_KEY` of +`66666666-7777-8888-9999-000000000000`, then stores metrics using `dbengine`. It then uses the `API_KEY` of +`11111111-2222-3333-4444-555555555555` to proxy those same metrics on to a parent node at `203.0.113.0`. + +```conf +[stream] + enabled = yes + destination = 203.0.113.0 + api key = 11111111-2222-3333-4444-555555555555 + +[66666666-7777-8888-9999-000000000000] + enabled = yes + default memory mode = dbengine +``` + +### Ephemeral nodes + +Netdata can help you monitor ephemeral nodes, such as containers in an auto-scaling infrastructure, by always streaming +metrics to any number of permanently-running parent nodes. + +On the parent, set the following in `stream.conf`: + +```conf +[11111111-2222-3333-4444-555555555555] + # enable/disable this API key + enabled = yes + + # one hour of data for each of the child nodes + default history = 3600 + + # do not save child metrics on disk + default memory = ram + + # alarms checks, only while the child is connected + health enabled by default = auto +``` + +On the child nodes, set the following in `stream.conf`: + +```bash +[stream] + # stream metrics to another Netdata + enabled = yes + + # the IP and PORT of the parent + destination = 10.11.12.13:19999 + + # the API key to use + api key = 11111111-2222-3333-4444-555555555555 +``` + +In addition, edit `netdata.conf` on each child node to disable the database and alarms. + +```bash +[global] + # disable the local database + memory mode = none + +[health] + # disable health checks + enabled = no +``` + +## Troubleshooting + +Both parent and child nodes log information at `/var/log/netdata/error.log`. + +If the child manages to connect to the parent you will see something like (on the parent): + +``` +2017-03-09 09:38:52: netdata: INFO : STREAM [receive from [10.11.12.86]:38564]: new client connection. +2017-03-09 09:38:52: netdata: INFO : STREAM xxx [10.11.12.86]:38564: receive thread created (task id 27721) +2017-03-09 09:38:52: netdata: INFO : STREAM xxx [receive from [10.11.12.86]:38564]: client willing to stream metrics for host 'xxx' with machine_guid '1234567-1976-11e6-ae19-7cdd9077342a': update every = 1, history = 3600, memory mode = ram, health auto +2017-03-09 09:38:52: netdata: INFO : STREAM xxx [receive from [10.11.12.86]:38564]: initializing communication... +2017-03-09 09:38:52: netdata: INFO : STREAM xxx [receive from [10.11.12.86]:38564]: receiving metrics... +``` + +and something like this on the child: + +``` +2017-03-09 09:38:28: netdata: INFO : STREAM xxx [send to box:19999]: connecting... +2017-03-09 09:38:28: netdata: INFO : STREAM xxx [send to box:19999]: initializing communication... +2017-03-09 09:38:28: netdata: INFO : STREAM xxx [send to box:19999]: waiting response from remote netdata... +2017-03-09 09:38:28: netdata: INFO : STREAM xxx [send to box:19999]: established communication - sending metrics... +``` + +The following sections describe the most common issues you might encounter when connecting parent and child nodes. + +### Slow connections between parent and child + +When you have a slow connection between parent and child, Netdata raises a few different errors. Most of the +errors will appear in the child's `error.log`. + +```bash +netdata ERROR : STREAM_SENDER[CHILD HOSTNAME] : STREAM CHILD HOSTNAME [send to PARENT IP:PARENT PORT]: too many data pending - buffer is X bytes long, +Y unsent - we have sent Z bytes in total, W on this connection. Closing connection to flush the data. +``` + +On the parent side, you may see various error messages, most commonly the following: + +``` +netdata ERROR : STREAM_PARENT[CHILD HOSTNAME,[CHILD IP]:CHILD PORT] : read failed: end of file +``` + +Another common problem in slow connections is the child sending a partial message to the parent. In this case, the +parent will write the following to its `error.log`: + +``` +ERROR : STREAM_RECEIVER[CHILD HOSTNAME,[CHILD IP]:CHILD PORT] : sent command 'B' which is not known by netdata, for host 'HOSTNAME'. Disabling it. +``` + +In this example, `B` was part of a `BEGIN` message that was cut due to connection problems. + +Slow connections can also cause problems when the parent misses a message and then receives a command related to the +missed message. For example, a parent might miss a message containing the child's charts, and then doesn't know +what to do with the `SET` message that follows. When that happens, the parent will show a message like this: + +``` +ERROR : STREAM_RECEIVER[CHILD HOSTNAME,[CHILD IP]:CHILD PORT] : requested a SET on chart 'CHART NAME' of host 'HOSTNAME', without a dimension. Disabling it. +``` + +### Child cannot connect to parent + +When the child can't connect to a parent for any reason (misconfiguration, networking, firewalls, parent +down), you will see the following in the child's `error.log`. + +``` +ERROR : STREAM_SENDER[HOSTNAME] : Failed to connect to 'PARENT IP', port 'PARENT PORT' (errno 113, No route to host) +``` + +### 'Is this a Netdata?' + +This question can appear when Netdata starts the stream and receives an unexpected response. This error can appear when +the parent is using SSL and the child tries to connect using plain text. You will also see this message when +Netdata connects to another server that isn't Netdata. The complete error message will look like this: + +``` +ERROR : STREAM_SENDER[CHILD HOSTNAME] : STREAM child HOSTNAME [send to PARENT HOSTNAME:PARENT PORT]: server is not replying properly (is it a netdata?). +``` + +### Stream charts wrong + +Chart data needs to be consistent between child and parent nodes. If there are differences between chart data on +a parent and a child, such as gaps in metrics collection, it most often means your child's `memory mode` +does not match the parent's. To learn more about the different ways Netdata can store metrics, and thus keep chart +data consistent, read our [memory mode documentation](/database/README.md). + +### Forbidding access + +You may see errors about "forbidding access" for a number of reasons. It could be because of a slow connection between +the parent and child nodes, but it could also be due to other failures. Look in your parent's `error.log` for errors +that look like this: + +``` +STREAM [receive from [child HOSTNAME]:child IP]: `MESSAGE`. Forbidding access." +``` + +`MESSAGE` will have one of the following patterns: + +- `request without KEY` : The message received is incomplete and the KEY value can be API, hostname, machine GUID. +- `API key 'VALUE' is not valid GUID`: The UUID received from child does not have the format defined in [RFC + 4122](https://tools.ietf.org/html/rfc4122) +- `machine GUID 'VALUE' is not GUID.`: This error with machine GUID is like the previous one. +- `API key 'VALUE' is not allowed`: This stream has a wrong API key. +- `API key 'VALUE' is not permitted from this IP`: The IP is not allowed to use STREAM with this parent. +- `machine GUID 'VALUE' is not allowed.`: The GUID that is trying to send stream is not allowed. +- `Machine GUID 'VALUE' is not permitted from this IP. `: The IP does not match the pattern or IP allowed to connect to + use stream. + +### Netdata could not create a stream + +The connection between parent and child is a stream. When the parent can't convert the initial connection into +a stream, it will write the following message inside `error.log`: + +``` +file descriptor given is not a valid stream +``` + +After logging this error, Netdata will close the stream. diff --git a/docs/monitor/view-active-alarms.md b/docs/monitor/view-active-alarms.md index 63ddfdde..b23e2d72 100644 --- a/docs/monitor/view-active-alarms.md +++ b/docs/monitor/view-active-alarms.md @@ -37,8 +37,10 @@ Cloud](https://user-images.githubusercontent.com/1153921/108564813-f08d2000-72c0 ## Local Netdata Agent dashboard -Find the bell 🔔 icon in the top navigation to bring up a modal that shows currently raised alarms, all running alarms, -and the alarms log. Here is an example of a raised `system.cpu` alarm, followed by the full list and alarm log: +Find the alarms icon  +in the top navigation to bring up a modal that shows currently raised alarms, all running alarms, and the alarms log. +Here is an example of a raised `system.cpu` alarm, followed by the full list and alarm log:  diff --git a/docs/netdata-security.md b/docs/netdata-security.md index 50c6b054..8c0fc6d6 100644 --- a/docs/netdata-security.md +++ b/docs/netdata-security.md @@ -209,7 +209,7 @@ If sending this information to the central Netdata registry violates your securi ### Opt-out of anonymous statistics -Starting with v1.12, Netdata collects anonymous usage information by default and sends it to Google Analytics. Read +Starting with v1.30, Netdata collects anonymous usage information by default and sends it to a self hosted PostHog instance within the Netdata infrastructure. Read about the information collected, and learn how to-opt, on our [anonymous statistics](anonymous-statistics.md) page. The usage statistics are _vital_ for us, as we use them to discover bugs and prioritize new features. We thank you for diff --git a/docs/overview/netdata-monitoring-stack.md b/docs/overview/netdata-monitoring-stack.md index 1504d5f2..3a954f05 100644 --- a/docs/overview/netdata-monitoring-stack.md +++ b/docs/overview/netdata-monitoring-stack.md @@ -57,6 +57,6 @@ charts, or use Netdata's health watchdog to send notifications whenever an anoma ## What's next? Whether you're using Netdata standalone or as part of a larger monitoring stack, the next step is the same: [**Get -Netdata**](/docs/get/README.md). +Netdata**](/docs/get-started.mdx). [](<>) diff --git a/docs/overview/what-is-netdata.md b/docs/overview/what-is-netdata.md index 5c4b5495..0a600234 100644 --- a/docs/overview/what-is-netdata.md +++ b/docs/overview/what-is-netdata.md @@ -18,9 +18,9 @@ Netdata's distributed monitoring Agent collects thousands of metrics from system configuration. It runs permanently on all your physical/virtual servers, containers, cloud deployments, and edge/IoT devices. -You can [install](/docs/get/README.md#install-the-netdata-agent) Netdata on most Linux distributions (Ubuntu, Debian, -CentOS, and more), container/microservice platforms (Kubernetes clusters, Docker), and many other operating systems -(FreeBSD, macOS), with no `sudo` required. +You can [install](/docs/get-started.mdx) Netdata on most Linux distributions (Ubuntu, Debian, CentOS, and more), +container/microservice platforms (Kubernetes clusters, Docker), and many other operating systems (FreeBSD, macOS), with +no `sudo` required. 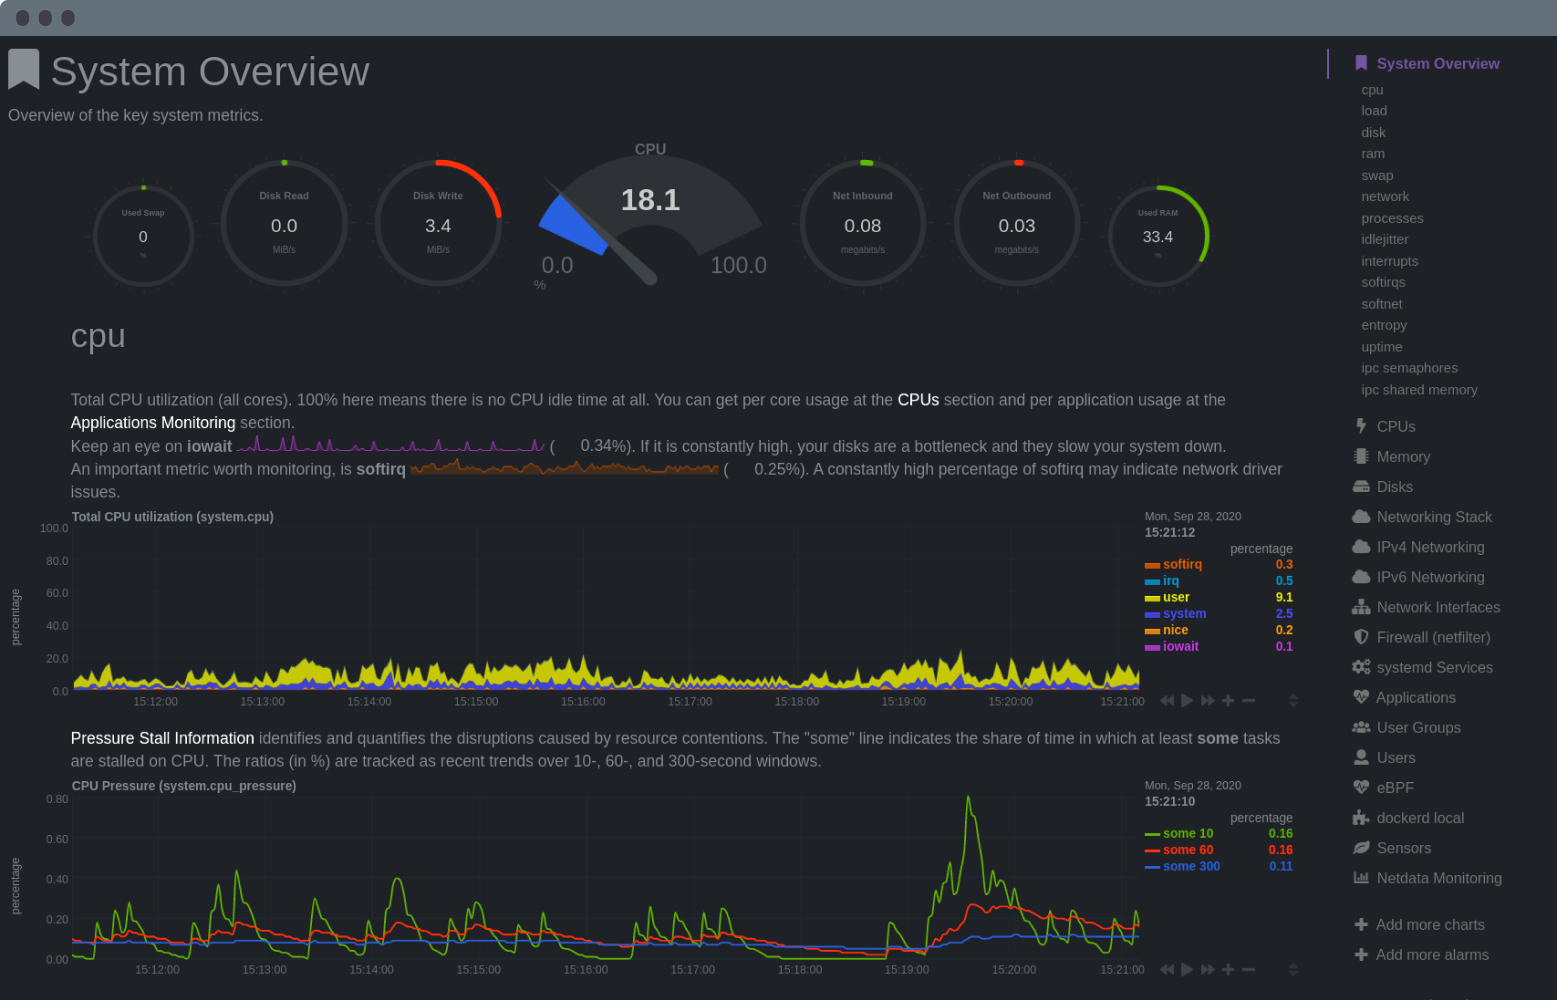 diff --git a/docs/privacy-policy.md b/docs/privacy-policy.md deleted file mode 100644 index 0152b0e0..00000000 --- a/docs/privacy-policy.md +++ /dev/null @@ -1,134 +0,0 @@ -<!-- -title: "Privacy Policy" -custom_edit_url: https://github.com/netdata/netdata/edit/master/docs/privacy-policy.md ---> - -# Privacy Policy - -## 1. Preamble - -This Privacy Policy explains the collection, use, processing, transferring and disclosure of personal information by Netdata, Inc (“ND” or “Netdata”), a Delaware Corporation. - -This Privacy Policy is incorporated into and made part of the Netdata Master Terms of Use (“Master Terms”) located [here](terms-of-use.md). - -Unless otherwise noted on a particular website or service hosted by Netdata, this Privacy Policy applies to your use of all websites that Netdata operates. These include <https://my-netdata.io> and <https://netdata.cloud>, together with all other subdomains thereof, (collectively, the “Websites”). This Privacy Policy also applies to all products, information, and services provided through the Websites, including without limitation the ND agent, the ND registry, the ND hub and the ND cloud website (together with the Websites, the “Services”). - -In addition, supplemental Privacy Policy terms (“Supplemental Privacy Policy Terms”) may apply to a particular Service. All such Supplemental Privacy Policy Terms will be accessible for you to read either within, or through your use of, that particular Service. - -By accessing or using any of the Services, you are accepting and agreeing to the practices described in this Privacy Policy. - -## 2. Our Principles - -Netdata has designed this policy to be consistent with the following principles: - -Privacy policies should be human readable and easy to find. -Data collection, storage, and processing should be simplified as much as possible to enhance security, ensure consistency, and make the practices easy for users to understand. -Data practices should always meet the reasonable expectations of users. - -## 3. Personal Information ND Collects and How it is Used - -As used in this policy, “personal information” means information that would allow someone to identify you, including your name, email address, IP address, or other information from which someone could deduce your identity. - -ND collects and uses personal information in the following ways: - -Website and Analytics: When you visit our Websites and use our Services, ND collects some information about your activities through tools such as Google Analytics. The type of information that we collect focuses on general information such as country or city where you are located, pages visited, time spent on pages, heat-map of visitors’ activity on the site, information about the browser you are using, etc. ND collects and uses this information pursuant to our legitimate interest in enhancing the security and utility of our Services. The information we gather and process is used in the aggregate to spot trends without deliberately identifying individuals. - -Note that you can learn about Google’s practices in connection with its analytics services and how to opt out of it by downloading the Google Analytics opt-out browser add-on, available at <https://tools.google.com/dlpage/gaoptout>. - -Information from Cookies: We and our service providers (for example, Google Analytics as described above) may collect information using cookies or similar technologies for the purposes described above and below. Cookies are pieces of information that are stored by your browser on the hard drive or memory of your computer or other Internet access device. Cookies may enable us to personalize your experience on the Services, maintain a persistent session, passively collect demographic information about your computer, and monitor advertisements and other activities. The Websites may use different kinds of cookies and other types of local storage (such as browser-based or plugin-based local storage). - -ND Registry: The global registry, together with certain browser features, allow Netdata to provide unified cross-server dashboards, via the node menu. -The menu lists the Netdata servers you have visited. For example, when you jump from server to server using the node menu, several session settings -(like the currently viewed charts, the current zoom and pan operations on the charts, etc.) are propagated to the new server, so that the new dashboard will come with exactly the -same view. The global registry keeps track of 4 entities: - -1. **machines**: i.e. the Netdata installations (a random GUID generated by each Netdata the first time it starts; we call this **machine_guid**) - - For each Netdata installation (each `machine_guid`) the registry keeps track of the different URLs it is accessed. - -2. **persons**: i.e. the web browsers accessing the Netdata installations (a random GUID generated by the registry the first time it sees a new web browser; we call this **person_guid**) - - For each person, the registry keeps track of the Netdata installations it has accessed and their URLs. - -3. **URLs** of Netdata installations (as seen by the web browsers) - - For each URL, the registry keeps the URL and nothing more. Each URL is linked to _persons_ and _machines_. The only way to find a URL is to know its **machine_guid** or have a **person_guid** it is linked to it. - -4. **accounts**: i.e. the information used to sign-in via one of the available sign-in methods. Depending on the method, this may include an email, an email and a profile picture. - -For _persons/accounts_ and _machines_, the registry keeps links to _URLs_, each link with 2 timestamps (first time seen, last time seen) and a counter (number of times it has been seen). -_machines_, _persons_, and timestamps are stored in the Netdata registry regardless of whether you sign in or not. - -If sending this information is against your policies, you can [run your own registry](/registry/README.md#run-your-own-registry). -Note that ND versions with the 'Sign in' feature of the ND Cloud do not use the global registry. - -ND Cloud: When you sign up to obtain a user account via the 'Sign in' link on the ND agent user interface, ND is granted access to personal information in the user profile of the authentication provider you choose (e.g. GitHub or Google). ND collects and uses this personal information pursuant to its legitimate interest in establishing and maintaining your account providing you with the features we provide Registered Users. We may use your email address to contact you regarding changes to this policy or other applicable policies. The login name or email address of your profile may be used to attribute you in connection with any content you submit to any Service. - -Anonymous Usage Statistics: From Netdata v1.12 and above, anonymous usage information is collected by default on certain events of the ND daemon and send to Google Analytics. Every time the daemon is started or stopped and every time a fatal condition is encountered, Netdata collects system information and sends it to GA via an http call. The information collected for all events is: - -- Netdata version -- OS name, version, id, id_like -- Kernel name, version, architecture -- Virtualization technology -- Containerization technology - Furthermore, the FATAL event sends the Netdata process & thread info, along with the file, function and line of the fatal error. - -The statistics calculated from this information are used for: - -1. **Quality assurance**, to help us understand if Netdata behaves as expected and help us identify repeating issues for certain distributions or environment. - -2. **Usage statistics**, to help us focus on the parts of Netdata that are used the most, or help us identify the extend our development decisions influence the community. - -To opt-out from sending anonymous statistics, you can create a file called `.opt-out-from-anonymous-statistics` under the user configuration directory (usually `/etc/netdata`). - -Emails and Newsletters: When you sign up to receive updates from Netdata or otherwise subscribe to one of our mailing lists, you will be asked to provide some personal information. ND collects and uses this personal information pursuant to its legitimate interest in providing news and updates to, and collaborating with, its supporters and volunteers. - -Email Analytics: When you receive communications from ND after signing up for the ND newsletter, campaign updates, or other ongoing email communications from ND, we may use analytics to track whether you open the mail, click on the links, and otherwise interact with what we send. You may opt out of this tracking by choosing to get plain-text emails from ND. ND collects and uses this personal information pursuant to its legitimate interest in understanding the interests of its community of supporters and volunteers in order to provide more relevant news and updates. - -Other Voluntarily Provided Information: When you provide feedback to Netdata, sign a petition distributed by ND, or otherwise submit personal information to Netdata, ND collects and uses this personal information pursuant to its legitimate interest in better understanding our community of supporters and volunteers and in furtherance of the particular program or activity to which you provided feedback or other input. - -## 4. Retention of Personal Information - -The majority of the personal information collected and used as explained in Section 3 above is aggregated and stored in a central database provided by a third party service provider. ND aggregates this data pursuant to its legitimate interest in having information stored in a single location to minimize complexity, increase consistency in internal practices, better understand its community of supporters and volunteers, and enhance the security of the data. - -## 5. Access to Your Personal Information - -You are generally entitled to access personal information that Netdata holds and to have inaccurate data corrected or removed to the extent ND still maintains it. In certain circumstances, you also may have the right to object for legitimate reasons to the processing or transfer of personal information. If you wish to exercise any of these rights, please write to legal@netdata.cloud explaining your request. - -## 6. Disclosure of Your Personal Information - -ND does not disclose personal information to third parties except as specified elsewhere in this policy and in the following instances: - -We may disclose your personal information to third parties in a good faith belief that such disclosure is reasonably necessary to (a) take action regarding suspected illegal activities; (b) enforce or apply our Master Terms and this Privacy Policy; (c) enforce our Charter, including the Code of Conduct and policies contained and incorporated therein, or (d) comply with legal process, such as a search warrant, subpoena, statute, or court order. - -## 7. Security of Your Personal Information - -Netdata has implemented reasonable physical, technical, and organizational security measures for personal information that Netdata processes against accidental or unlawful destruction, or accidental loss, alteration, unauthorized disclosure or access, in compliance with applicable law. However, no website can fully eliminate security risks. If any data breach occurs, we will post a reasonably prominent notice to the Websites and comply with all other applicable data privacy requirements including, when required, personal notice to you if you have provided and we have maintained an email address for you. - -The ND Cloud Services have security risks in addition to those described above. Among other things, they are vulnerable to DNS attacks, and using any ND Cloud Service may increase the risk of phishing. - -## 8. Children - -The Services are not directed at children under the age of 13. Consistent with the U.S. federal Children’s Online Privacy Protection Act of 1998 (COPPA), we will never knowingly request personal information from anyone under the age of 13 without requiring parental consent. Our Master Terms specifically prohibit anyone using our Services from submitting any personally identifiable information about persons under 13 years of age. Any person who provides their personal information to ND through the Services represents that they are 13 years of age or older. - -## 9. Third Party Service Providers - -Netdata uses many third party service providers in connection with the Services, including website hosting services, database management, credit card processing, and many more. Some of these service providers may place session cookies on your computer, and they may collect and store your personal information on our behalf in accordance with the data practices and purposes explained above in Section 3. - -## 10. Third Party Sites - -The Services may provide links to a wide variety of third party websites. You should consult the respective privacy policies of these third-party websites. This Privacy Policy does not apply to, and we cannot control the activities of, such other websites. - -## 11. Transferring Data to Other Countries - -If you are accessing or using the Services in regions with laws governing data collection, processing, transfer and use, please note that when we use and share your data as specified in this policy, we may transfer your information to recipients in countries other than the country in which the information was originally collected. Those countries may not have the same data protection laws as the country in which you initially provided the information. - -Data transferred from the European Union to the United States or outside the European Union will be made on the grounds of a certification to the E.U./U.S. Privacy Shield regime and/or a data transfer agreement based on the Standard Contractual Clauses approved of by the European Commission respectively, consistent with applicable data privacy requirements. - -## 12. Changes to this Privacy Policy - -We may occasionally update this Privacy Policy. When we do, we will provide you with notice of such update through (at a minimum) a reasonably prominent notice on the Websites and Services, and will revise the Effective Date below. We encourage you to periodically review this Privacy Policy to stay informed about how we are protecting, using, processing and transferring the personal information we collect. - -Effective Date: 8 January 2019. - -[](<>) diff --git a/docs/quickstart/infrastructure.md b/docs/quickstart/infrastructure.md index 8ec9b75c..71e70b94 100644 --- a/docs/quickstart/infrastructure.md +++ b/docs/quickstart/infrastructure.md @@ -19,15 +19,16 @@ resources you need to invest in, and the complexity of, monitoring your infrastr Netdata Cloud unifies infrastructure monitoring by _centralizing the interface_ you use to query and visualize your nodes' metrics, not the data. By streaming metrics values to your browser, with Netdata Cloud acting as the secure proxy between them, you can monitor your infrastructure using customizable, interactive, and real-time visualizations from any -numbe of distributed nodes. +number of distributed nodes. In this quickstart guide, you'll learn the basics of using Netdata Cloud to monitor an infrastructure with dashboards, composite charts, and alarm viewing. You'll then learn about the most critical ways to configure the Agent on each of your nodes to maximize the value you get from Netdata. This quickstart assumes you've installed the Netdata Agent on more than one node in your infrastructure, and claimed -those nodes to your Space in Netdata Cloud. If you haven't yet, see the [_Get Netdata_ doc](/docs/get/README.md) for -details on signing up for Netdata Cloud, installation, and claiming. +those nodes to your Space in Netdata Cloud. If you haven't yet, see the [Netdata +Cloud](https://learn.netdata.cloud/docs/cloud) docs for details on signing up for Netdata Cloud, installation, and +claiming. > If you want to monitor a Kubernetes cluster with Netdata, see our [k8s installation > doc](/packaging/installer/methods/kubernetes.md) for setup details, and then read our guide, [_Monitor a Kubernetes diff --git a/docs/quickstart/single-node.md b/docs/quickstart/single-node.md index 77656af2..ab98a838 100644 --- a/docs/quickstart/single-node.md +++ b/docs/quickstart/single-node.md @@ -14,10 +14,6 @@ In this quickstart guide, you'll learn how to access your single node's metrics to your liking, and make sure the Netdata Agent is collecting metrics from the applications or containers you're running on your node. -> This quickstart assumes you have installed the Netdata Agent on your node. If you haven't yet, see the [_Get Netdata_ -> doc](/docs/get/README.md) for details on installation. In addition, this quickstart mentions features available only -> through Netdata Cloud, which requires you to [claim your node](/docs/get/README.md#claim-your-node-on-netdata-cloud). - ## See your node's metrics To see your node's real-time metrics, you need to access its dashboard. You can either view the local dashboard, which diff --git a/docs/store/change-metrics-storage.md b/docs/store/change-metrics-storage.md index 6dde22c0..2ed026c5 100644 --- a/docs/store/change-metrics-storage.md +++ b/docs/store/change-metrics-storage.md @@ -8,9 +8,10 @@ custom_edit_url: https://github.com/netdata/netdata/edit/master/docs/store/chang import { Calculator } from '../../src/components/agent/dbCalc/' -The [database engine](/database/engine/README.md) uses RAM to store recent metrics. When metrics reach a certain age, -and based on how much system RAM you allocate toward storing metrics in memory, they are compressed and "spilled" to -disk for long-term storage. +The Netdata Agent uses a time-series database (TSDB), named the [database engine +(`dbengine`)](/database/engine/README.md), to store metrics data. The most recently-collected metrics are stored in RAM, +and when metrics reach a certain age, and based on how much system RAM you allocate toward storing metrics in memory, +they are compressed and "spilled" to disk for long-term storage. The default settings retain about two day's worth of metrics on a system collecting 2,000 metrics every second, but the Netdata Agent is highly configurable if you want your nodes to store days, weeks, or months worth of per-second data. @@ -59,15 +60,18 @@ method](/docs/configure/start-stop-restart.md) for your system, to change the da ## What's next? -For more information about the database engine, see our [database reference doc](/database/engine/README.md). +If you have multiple nodes with the Netdata Agent installed, you can [stream +metrics](/docs/metrics-storage-management/how-streaming-works.mdx) from any number of _child_ nodes to a _parent_ node +and store metrics using a centralized time-series database. Streaming allows you to centralize your data, run Agents as +headless collectors, replicate data, and more. Storing metrics with the database engine is completely interoperable with [exporting to other time-series databases](/docs/export/external-databases.md). With exporting, you can use the node's resources to surface metrics when [viewing dashboards](/docs/visualize/interact-dashboards-charts.md), while also archiving metrics elsewhere for further analysis, visualization, or correlation with other tools. -If you don't want to always store metrics on the node that collects them or run ephemeral nodes without dedicated -storage, you can use [streaming](/streaming/README.md). Streaming allows you to centralize your data, run Agents as -headless collectors, replicate data, and more. +### Related reference documentation + +- [Netdata Agent · Database engine](/database/engine/README.md) [](<>) diff --git a/docs/terms-of-use.md b/docs/terms-of-use.md deleted file mode 100644 index a3cbd009..00000000 --- a/docs/terms-of-use.md +++ /dev/null @@ -1,166 +0,0 @@ -<!-- -title: "Terms of Use" -custom_edit_url: https://github.com/netdata/netdata/edit/master/docs/terms-of-use.md ---> - -# Terms of Use - -Netdata Master Terms of Use -Effective as of 09 Aug 2019 - -## 1. General Information Regarding These Terms of Use - -Master terms: Welcome, and thank you for your interest in Netdata (“Netdata, Inc.” “ND,” “we,” “our,” or “us”). Unless otherwise noted on a particular site or service, these master terms of use (“Master Terms”) apply to your use of all of the websites that Netdata Corporation operates. These include <https://my-netdata.io> and <https://netdata.cloud>, together with all other subdomains thereof, (collectively, the “Websites”). The Master Terms also apply to all products, information, and services provided through the Websites, such as the NDID Login Service. - -Additional terms: In addition to the Master Terms, your use of any Services may also be subject to specific terms applicable to a particular Service (“Additional Terms”). If there is any conflict between the Additional Terms and the Master Terms, then the Additional Terms apply in relation to the relevant Service. - -Collectively, the Terms: The Master Terms, together with any Additional Terms, form a binding legal agreement between you and Netdata in relation to your use of the Services. Collectively, this legal agreement is referred to below as the “Terms.” - -Human-readable summary of Sec 1: These terms, together with any special terms for particular websites, create a contract between you and Netdata. The contract governs your use of all websites operated by Netdata, unless a particular website indicates otherwise. These human-readable summaries of each section are not part of the contract, but are intended to help you understand its terms. - -## 2. Your Agreement to the Terms - -BY ACCESSING OR USING ANY OF THE SERVICES, YOU ACKNOWLEDGE THAT YOU HAVE READ, UNDERSTOOD, AND AGREED TO BE BOUND BY THE TERMS. By accessing or using any Services you also represent that you have the legal authority to accept the Terms on behalf of yourself and any party you represent in connection with your use of any Services. If you do not agree to the Terms, you are not authorized to use any Services. If you are an individual who is entering into these Terms on behalf of an entity, you represent and warrant that you have the power to bind that entity, and you hereby agree on that entity’s behalf to be bound by these Terms, with the terms “you,” and “your” applying to you, that entity, and other users accessing the Services on behalf of that entity. - -Human-readable summary of Sec 2: Please read these terms and only use our sites and services if you agree to them. - -## 3. Changes to the Terms - -From time to time, Netdata may change, remove, or add to the Terms, and reserves the right to do so in its discretion. In that case, we will post updated Terms and indicate the date of revision. If we feel the modifications are material, we will make reasonable efforts to post a prominent notice on the relevant Website(s) and notify those of you with a current NDID Login Service account via email. All new and/or revised Terms take effect immediately and apply to your use of the Services from that date on, except that material changes will take effect 30 days after the change is made and identified as material. Your continued use of any Services after new and/or revised Terms are effective indicates that you have read, understood, and agreed to those Terms. - -Human-readable summary of Sec 3: These terms may change. When the changes are important, we will put a notice on the website. If you continue to use the sites after the changes are made, you agree to the changes. - -## 4. No Legal Advice - -Netdata is not a law firm, does not provide legal advice, and is not a substitute for a law firm. Sending us an email or using any of the Services, including the licenses, public domain tools, and choosers, does not constitute legal advice or create an attorney-client relationship. - -Human-readable summary of Sec 4: Some of us are lawyers, but we aren’t your lawyer. Please consult your own attorney if you need legal advice. - -## 5. Content Available through the Services - -Provided as-is: You acknowledge that Netdata does not make any representations or warranties about the material, data, and information, such as data files, text, computer software, code, music, audio files or other sounds, photographs, videos, or other images (collectively, the “Content”) which you may have access to as part of, or through your use of, the Services. Under no circumstances is Netdata liable in any way for any Content, including, but not limited to: any infringing Content, any errors or omissions in Content, or for any loss or damage of any kind incurred as a result of the use of any Content posted, transmitted, linked from, or otherwise accessible through or made available via the Services. You understand that by using the Services, you may be exposed to Content that is offensive, indecent, or objectionable. - -You agree that you are solely responsible for your reuse of Content made available through the Services, including providing proper attribution. You should review the terms of the applicable license before you use the Content so that you know what you can and cannot do. - -Licensing: ND-Owned Content: Other than the text of Netdata licenses, ND licenses, and other legal tools and the text of the deeds for all legal tools, Netdata trademarks (subject to the Trademark Policy), and the software code, all Content on the Websites is licensed under the Creative Commons Attribution 4.0 license, unless otherwise marked. See the ND Policies page for more information. - -ND-Owned Code: All of CC’s software code is free software; please check our code repository for the specific license on software you want to reuse. - -Search Tools: On some of its Websites, Netdata provides website search tools, including ND Search, which return Content based on any information our search tools are able to locate and interpret. Those search tools may return Content that is not ND licensed, and you should independently verify the terms of the license attached to any Content you intend to use. - -Human-readable summary of Sec 5: We try our best to have useful information on our sites, but we cannot promise that everything is accurate or appropriate for your situation. Content on the site is licensed under CC BY 4.0 unless it says it is available under different terms. If you find content through a link on our websites, be sure to check the license terms before using it. - -## 6. Content Supplied by You - -Your responsibility: You represent, warrant, and agree that no Content posted or otherwise shared by you on or through any of the Services (“Your Content”), violates or infringes upon the rights of any third party, including copyright, trademark, privacy, publicity, or other personal or proprietary rights, breaches or conflicts with any obligation, such as a confidentiality obligation, or contains libelous, defamatory, or otherwise unlawful material. - -Licensing Your Content: You retain any copyright that you may have in Your Content. You hereby agree that Your Content: (a) is hereby licensed under the CC Attribution 4.0 License and may be used under the terms of that license or any later version of a CC Attribution License, or (b) is in the public domain (such as Content that is not copyrightable or Content you make available under CC0), or (c) if not owned by you, (i) is available under a CC Attribution 4.0 License or (ii) is a media file that is available under any CC license or that you are authorized by law to post or share through any of the Services, such as under the fair use doctrine, and that is prominently marked as being subject to third party copyright. All of Your Content must be appropriately marked with licensing (or other permission status such as fair use) and attribution information. - -Removal: Netdata may, but is not obligated to, review Your Content and may delete or remove Your Content (without notice) from any of the Services in its sole discretion. Removal of any of Your Content from the Services (by you or Netdata) does not impact any rights you granted in Your Content under the terms of a Netdata license. - -Human-readable summary of Sec 6: We do not take any ownership of your content when you post it on our sites. If you post content you own, you agree it can be used under the terms of CC BY 4.0 or any future version of that license. If you do not own the content, then you should not post it unless it is in the public domain or licensed CC BY 4.0, except that you may also post pictures and videos if you are authorized to use them under law (e.g. fair use) or if they are available under any CC license. You must note that information on the file when you upload it. You are responsible for any content you upload to our sites. - -## 7. Prohibited Conduct - -You agree not to engage in any of the following activities: - -### 1. Violating laws and rights: - -You may not (a) use any Service for any illegal purpose or in violation of any local, state, national, or international laws, including without limitation U.S. export controls and economic sanctions regulations, or (b) violate or encourage others to violate any right of or obligation to a third party, including by infringing, misappropriating, or violating intellectual property, confidentiality, or privacy rights. - -### 2. Solicitation: - -You may not use the Services or any information provided through the Services for the transmission of advertising or promotional materials, including junk mail, spam, chain letters, pyramid schemes, or any other form of unsolicited or unwelcome solicitation. - -### 3. Disruption: - -You may not use the Services in any manner that could disable, overburden, damage, or impair the Services, or interfere with any other party’s use and enjoyment of the Services; including by (a) uploading or otherwise disseminating any virus, adware, spyware, worm or other malicious code, or (b) interfering with or disrupting any network, equipment, or server connected to or used to provide any of the Services, or violating any regulation, policy, or procedure of any network, equipment, or server. - -### 4. Harming others: - -You may not post or transmit Content on or through the Services that is harmful, offensive, obscene, abusive, invasive of privacy, defamatory, hateful or otherwise discriminatory, false or misleading, or incites an illegal act; -You may not intimidate or harass another through the Services; and, you may not post or transmit any personally identifiable information about persons under 13 years of age on or through the Services. - -### 5. Impersonation or unauthorized access: - -You may not impersonate another person or entity, or misrepresent your affiliation with a person or entity when using the Services; -You may not use or attempt to use another’s account or personal information without authorization; and -You may not attempt to gain unauthorized access to the Services, or the computer systems or networks connected to the Services, through hacking password mining or any other means. - -Human-readable summary of Sec 7: Play nice. Be yourself. Don’t break the law or be disruptive. - -## 8. DISCLAIMER OF WARRANTIES - -TO THE FULLEST EXTENT PERMITTED BY APPLICABLE LAW, NETDATA OFFERS THE SERVICES (INCLUDING ALL CONTENT AVAILABLE ON OR THROUGH THE SERVICES) AS-IS AND MAKES NO REPRESENTATIONS OR WARRANTIES OF ANY KIND CONCERNING THE SERVICES, EXPRESS, IMPLIED, STATUTORY, OR OTHERWISE, INCLUDING WITHOUT LIMITATION, WARRANTIES OF TITLE, MERCHANTABILITY, FITNESS FOR A PARTICULAR PURPOSE, OR NON-INFRINGEMENT. NETDATA DOES NOT WARRANT THAT THE FUNCTIONS OF THE SERVICES WILL BE UNINTERRUPTED OR ERROR-FREE, THAT CONTENT MADE AVAILABLE ON OR THROUGH THE SERVICES WILL BE ERROR-FREE, THAT DEFECTS WILL BE CORRECTED, OR THAT ANY SERVERS USED BY ND ARE FREE OF VIRUSES OR OTHER HARMFUL COMPONENTS. NETDATA DOES NOT WARRANT OR MAKE ANY REPRESENTATION REGARDING USE OF THE CONTENT AVAILABLE THROUGH THE SERVICES IN TERMS OF ACCURACY, RELIABILITY, OR OTHERWISE. - -Human-readable summary of Sec 8: ND does not make any guarantees about the sites, services, or content available on the sites. - -## 9. LIMITATION OF LIABILITY - -TO THE FULLEST EXTENT PERMITTED BY APPLICABLE LAW, IN NO EVENT WILL NETDATA BE LIABLE TO YOU ON ANY LEGAL THEORY FOR ANY INCIDENTAL, DIRECT, INDIRECT, PUNITIVE, ACTUAL, CONSEQUENTIAL, SPECIAL, EXEMPLARY, OR OTHER DAMAGES, INCLUDING WITHOUT LIMITATION, LOSS OF REVENUE OR INCOME, LOST PROFITS, PAIN AND SUFFERING, EMOTIONAL DISTRESS, COST OF SUBSTITUTE GOODS OR SERVICES, OR SIMILAR DAMAGES SUFFERED OR INCURRED BY YOU OR ANY THIRD PARTY THAT ARISE IN CONNECTION WITH THE SERVICES (OR THE TERMINATION THEREOF FOR ANY REASON), EVEN IF NETDATA HAS BEEN ADVISED OF THE POSSIBILITY OF SUCH DAMAGES. - -TO THE FULLEST EXTENT PERMITTED BY APPLICABLE LAW, NETDATA IS NOT RESPONSIBLE OR LIABLE WHATSOEVER IN ANY MANNER FOR ANY CONTENT POSTED ON OR AVAILABLE THROUGH THE SERVICES (INCLUDING CLAIMS OF INFRINGEMENT RELATING TO THAT CONTENT), FOR YOUR USE OF THE SERVICES, OR FOR THE CONDUCT OF THIRD PARTIES ON OR THROUGH THE SERVICES. - -Certain jurisdictions do not permit the exclusion of certain warranties or limitation of liability for incidental or consequential damages, which means that some of the above limitations may not apply to you. IN THESE JURISDICTIONS, THE FOREGOING EXCLUSIONS AND LIMITATIONS WILL BE ENFORCED TO THE GREATEST EXTENT PERMITTED BY APPLICABLE LAW. - -Human-readable summary of Sec 9: ND is not responsible for the content on the sites, your use of our services, or for the conduct of others on our sites. - -## 10. Indemnification - -To the extent authorized by law, you agree to indemnify and hold harmless Netdata, its employees, officers, directors, affiliates, and agents from and against any and all claims, losses, expenses, damages, and costs, including reasonable attorneys’ fees, resulting directly or indirectly from or arising out of (a) your violation of the Terms, (b) your use of any of the Services, and/or (c) the Content you make available on any of the Services. - -Human-readable summary of Sec 10: If something happens because you violate these terms, because of your use of the services, or because of the content you post on the sites, you agree to repay ND for the damage it causes. - -## 11. Privacy Policy - -Netdata is committed to responsibly handling the information and data we collect through our Services in compliance with our Privacy Policy, which is incorporated by reference into these Master Terms. Please review the Privacy Policy so you are aware of how we collect and use your personal information. - -Human-readable summary of Sec 11: Please read our Privacy Policy. It is part of these terms, too. - -## 12. Trademark Policy - -ND’s name, logos, icons, and other trademarks may only be used in accordance with our Trademark Policy, which is incorporated by reference into these Master Terms. Please review the Trademark Policy so you understand how ND’s trademarks may be used. - -Human-readable summary of Sec 12: Please read our Trademark Policy. It is part of these terms, too. - -## 13. Copyright Complaints - -Netdata respects copyright, and we prohibit users of the Services from submitting, uploading, posting, or otherwise transmitting any Content on the Services that violates another person’s proprietary rights. - -To report allegedly infringing Content hosted on a website owned or controlled by ND, send a Notice of Infringing Materials to info@netdata.cloud. - -Please note that Netdata does not host the Content made available through ND Search. You should contact the web site or service hosting the Content to have it removed. - -Human-readable summary of Sec 13: Please let us know if you find infringing content on our websites. - -## 14. Termination - -By Netdata: Netdata may modify, suspend, or terminate the operation of, or access to, all or any portion of the Services at any time for any reason. Additionally, your individual access to, and use of, the Services may be terminated by Netdata at any time and for any reason. - -By you: If you wish to terminate this agreement, you may immediately stop accessing or using the Services at any time. - -Automatic upon breach: Your right to access and use the Services (including use of your ND Login Service account) automatically upon your breach of any of the Terms. For the avoidance of doubt, termination of the Terms does not require you to remove or delete any reference to previously-applied ND legal tools from your own Content. - -Survival: The disclaimer of warranties, the limitation of liability, and the jurisdiction and applicable law provisions will survive any termination. The license grants applicable to Your Content are not impacted by the termination of the Terms and shall continue in effect subject to the terms of the applicable license. Your warranties and indemnification obligations will survive for one year after termination. - -Human-readable summary of Sec 14: If you violate these terms, you may no longer use our sites. - -## 15. Miscellaneous Terms - -Choice of law: The Terms are governed by and construed by the laws of the State of Delaware in the United States, not including its choice of law rules. - -Dispute resolution: The parties agree that any disputes between Netdata and you concerning these Terms, and/or any of the Services may only brought in a federal or state court of competent jurisdiction sitting in the State of Delaware, and you hereby consent to the personal jurisdiction and venue of such court. - -If you are an authorized agent of a government or intergovernmental entity using the Services in your official capacity, including an authorized agent of the federal, state, or local government in the United States, and you are legally restricted from accepting the controlling law, jurisdiction, or venue clauses above, then those clauses do not apply to you. For any such U.S. federal government entities, these Terms and any action related thereto will be governed by the laws of the United States of America (without reference to conflict of laws) and, in the absence of federal law and to the extent permitted under federal law, the laws of the State of Delaware (excluding its choice of law rules). - -No waiver: Either party’s failure to insist on or enforce strict performance of any of the Terms will not be construed as a waiver of any provision or right. - -Severability: If any part of the Terms is held to be invalid or unenforceable by any law or regulation or final determination of a competent court or tribunal, that provision will be deemed severable and will not affect the validity and enforceability of the remaining provisions. - -No agency relationship: The parties agree that no joint venture, partnership, employment, or agency relationship exists between you and Netdata as a result of the Terms or from your use of any of the Services. - -Integration: These Master Terms and any applicable Additional Terms constitute the entire agreement between you and Netdata relating to this subject matter and supersede any and all prior communications and/or agreements between you and Netdata relating to access and use of the Services. - -Human-readable summary of Sec 15: If there is a lawsuit arising from these terms, it should be in Delaware and governed by Delaware law. We are glad you use our sites, but this agreement does not mean we are partners. - -[](<>) |