
diff options
| author | Daniel Baumann <daniel.baumann@progress-linux.org> | 2021-02-07 11:49:00 +0000 |
|---|---|---|
| committer | Daniel Baumann <daniel.baumann@progress-linux.org> | 2021-02-07 12:42:05 +0000 |
| commit | 2e85f9325a797977eea9dfea0a925775ddd211d9 (patch) | |
| tree | 452c7f30d62fca5755f659b99e4e53c7b03afc21 /docs | |
| parent | Releasing debian version 1.19.0-4. (diff) | |
| download | netdata-2e85f9325a797977eea9dfea0a925775ddd211d9.tar.xz netdata-2e85f9325a797977eea9dfea0a925775ddd211d9.zip | |
Merging upstream version 1.29.0.
Signed-off-by: Daniel Baumann <daniel.baumann@progress-linux.org>
Diffstat (limited to 'docs')
97 files changed, 8402 insertions, 3367 deletions
diff --git a/docs/Add-more-charts-to-netdata.md b/docs/Add-more-charts-to-netdata.md index fe0341ced..a16f2e9db 100644 --- a/docs/Add-more-charts-to-netdata.md +++ b/docs/Add-more-charts-to-netdata.md @@ -1,438 +1,16 @@ -# Add more charts to Netdata - -Netdata collects system metrics by itself. It has many [internal plugins](../collectors) for collecting most of the metrics presented by default when it starts, collecting data from `/proc`, `/sys` and other Linux kernel sources. - -To collect non-system metrics, Netdata supports a plugin architecture. The following are the currently available external plugins: - -- **[Web Servers](#web-servers)**, such as apache, nginx, nginx_plus, tomcat, litespeed -- **[Web Logs](#web-log-parsers)**, such as apache, nginx, lighttpd, gunicorn, squid access logs, apache cache.log -- **[Load Balancers](#load-balancers)**, like haproxy -- **[Message Brokers](#message-brokers)**, like rabbitmq, beanstalkd -- **[Database Servers](#database-servers)**, such as mysql, mariadb, postgres, couchdb, mongodb, rethinkdb -- **[Social Sharing Servers](#social-sharing-servers)**, like retroshare -- **[Proxy Servers](#proxy-servers)**, like squid -- **[HTTP accelerators](#http-accelerators)**, like varnish cache -- **[Search engines](#search-engines)**, like elasticsearch -- **[Name Servers](#name-servers)** (DNS), like bind, nsd, powerdns, dnsdist -- **[DHCP Servers](#dhcp-servers)**, like ISC DHCP -- **[UPS](#ups)**, such as APC UPS, NUT -- **[RAID](#raid)**, such as MegaRAID -- **[Mail Servers](#mail-servers)**, like postfix, exim, dovecot -- **[File Servers](#file-servers)**, like samba, NFS, ftp, sftp, WebDAV -- **[Print Servers](#print-servers)**, like CUPS -- **[Hypervisors](#hypervisors)**, like XenServer, XCP-ng -- **[System](#system)**, for processes and other system metrics -- **[Sensors](#sensors)**, like temperature, fans speed, voltage, humidity, HDD/SSD S.M.A.R.T attributes -- **[Network](#network)**, such as SNMP devices, `fping`, access points, dns_query_time, nfacct -- **[Time Servers](#time-servers)**, like chrony -- **[Security](#security)**, like FreeRADIUS, OpenVPN, Fail2ban -- **[Telephony Servers](#telephony-servers)**, like openSIPS -- **[Go applications](#go-applications)** -- **[Household appliances](#household-appliances)**, like SMA WebBox (solar power), Fronius Symo solar power, Stiebel Eltron heating -- **[Java Processes](#java-processes)**, via JMX or Spring Boot Actuator -- **[Provisioning Systems](#provisioning-systems)**, like Puppet -- **[Game Servers](#game-servers)**, like SpigotMC -- **[Distributed Computing Clients](#distributed-computing-clients)**, like BOINC -- **[Skeleton Plugins](#skeleton-plugins)**, for writing your own data collectors - -Check also [Third Party Plugins](Third-Party-Plugins.md) for a list of plugins distributed by third parties. - -## configuring plugins - -Netdata comes with **internal** and **external** plugins: - -1. The **internal** ones are written in `C` and run as threads within the Netdata daemon. -2. The **external** ones can be written in any computer language. The Netdata daemon spawns these as processes (shown with `ps fax`) and reads their metrics using pipes (so the `stdout` of external plugins is connected to Netdata for metrics collection and the `stderr` of external plugins is connected to `/var/log/netdata/error.log`). - -To make it easier to develop plugins, and minimize the number of threads and processes running, Netdata supports **plugin orchestrators**, each of them supporting one or more data collection **modules**. Currently we ship plugin orchestrators for 4 languages: `C`, `python`, `node.js` and `bash` and 2 more are under development (`go` and `java`). - -#### enabling and disabling plugins - -To control which plugins Netdata run, edit `netdata.conf` and check the `[plugins]` section. It looks like this: - -``` -[plugins] - # enable running new plugins = yes - # check for new plugins every = 60 - # proc = yes - # diskspace = yes - # cgroups = yes - # cups = yes - # tc = yes - # nfacct = yes - # idlejitter = yes - # freeipmi = yes - # node.d = yes - # python.d = yes - # fping = yes - # ioping = yes - # charts.d = yes - # apps = yes - # xenstat = yes - # perf = no - # slabinfo = no -``` - -The default for all plugins is the option `enable running new plugins`. So, setting this to `no` will disable all the plugins, except the ones specifically enabled. - -#### enabling and disabling modules - -Each of the **plugins** may support one or more data collection **modules**. To control which of its modules run, you have to consult the configuration of the **plugin** (see table below). - -#### modules configuration - -Most **modules** come with **auto-detection**, configured to work out-of-the-box on popular operating systems with the default settings. - -However, there are cases that auto-detection fails. Usually the reason is that the applications to be monitored do not allow Netdata to connect. In most of the cases, allowing the user `netdata` from `localhost` to connect and collect metrics, will automatically enable data collection for the application in question (it will require a Netdata restart). - -You can verify Netdata **external plugins and their modules** are able to collect metrics, following this procedure: - -```sh -# become user netdata -sudo su -s /bin/bash netdata - -# execute the plugin in debug mode, for a specific module. -# example for the python plugin, mysql module: -/usr/libexec/netdata/plugins.d/python.d.plugin 1 debug trace mysql -``` - -Similarly, you can use `charts.d.plugin` for BASH plugins and `node.d.plugin` for node.js plugins. -Other plugins (like `apps.plugin`, `freeipmi.plugin`, `fping.plugin`, `ioping.plugin`, `nfacct.plugin`, `xenstat.plugin`, `perf.plugin`, `slabinfo.plugin`) use the native Netdata plugin API and can be run directly. - -If you need to configure a Netdata plugin or module, all user supplied configuration is kept at `/etc/netdata` while the stock versions of all files is at `/usr/lib/netdata/conf.d`. -To copy a stock file and edit it, run `/etc/netdata/edit-config`. Running this command without an argument, will list the available stock files. - -Each file should provide plenty of examples and documentation about each module and plugin. - -This is a map of the all supported configuration options: - -#### map of configuration files - -| plugin | language | plugin<br/>configuration | modules<br/>configuration | -|-----:|:------:|:----------------------:|:------------------------| -| `apps.plugin`<br/>(external plugin for monitoring the process tree on Linux and FreeBSD)|`C`|`netdata.conf` section `[plugin:apps]`|Custom configuration for the processes to be monitored at `apps_groups.conf`| -| `freebsd.plugin`<br/>(internal plugin for monitoring FreeBSD system resources)|`C`|`netdata.conf` section `[plugin:freebsd]`|one section for each module `[plugin:freebsd:MODULE]`. Each module may provide additional sections in the form of `[plugin:freebsd:MODULE:SUBSECTION]`.| -| `cgroups.plugin`<br/>(internal plugin for monitoring Linux containers, VMs and systemd services)|`C`|`netdata.conf` section `[plugin:cgroups]`|N/A| -| `charts.d.plugin`<br/>(external plugin orchestrator for BASH modules)|`BASH`|`charts.d.conf`|a file for each module in `/etc/netdata/charts.d/`| -| `diskspace.plugin`<br/>(internal plugin for collecting Linux mount points usage)|`C`|`netdata.conf` section `[plugin:diskspace]`|N/A| -| `fping.plugin`<br/>(external plugin for collecting network latencies)|`C`|`fping.conf`|This plugin is a wrapper for the `fping` command.| -| `ioping.plugin`<br/>(external plugin for collecting disk latencies)|`C`|`ioping.conf`|This plugin is a wrapper for the `ioping` command.| -| `freeipmi.plugin`<br/>(external plugin for collecting IPMI h/w sensors)|`C`|`netdata.conf` section `[plugin:freeipmi]`|| -| `nfacct.plugin`<br/>(external plugin for monitoring netfilter firewall and connection tracker)|`C`|`netdata.conf` section `[plugin:nfacct]`|N/A| -| `xenstat.plugin`<br/>(external plugin for monitoring XCP-ng and XenServer)|`C`|`netdata.conf` section `[plugin:xenstat]`|N/A| -| `perf.plugin`<br/>(external plugin for monitoring CPU performance on Linux)|`C`|`netdata.conf` section `[plugin:perf]`|N/A| -| `idlejitter.plugin`<br/>(internal plugin for monitoring CPU jitter)|`C`|N/A|N/A| -| `macos.plugin`<br/>(internal plugin for monitoring MacOS system resources)|`C`|`netdata.conf` section `[plugin:macos]`|one section for each module `[plugin:macos:MODULE]`. Each module may provide additional sections in the form of `[plugin:macos:MODULE:SUBSECTION]`.| -| `node.d.plugin`<br/>(external plugin orchestrator of node.js modules)|`node.js`|`node.d.conf`|a file for each module in `/etc/netdata/node.d/`.| -| `proc.plugin`<br/>(internal plugin for monitoring Linux system resources)|`C`|`netdata.conf` section `[plugin:proc]`|one section for each module `[plugin:proc:MODULE]`. Each module may provide additional sections in the form of `[plugin:proc:MODULE:SUBSECTION]`.| -| `python.d.plugin`<br/>(external plugin orchestrator for running python modules)|`python`<br/>v2 or v3<br/>both are supported|`python.d.conf`|a file for each module in `/etc/netdata/python.d/`.| -| `statsd.plugin`<br/>(internal plugin for collecting statsd metrics)|`C`|`netdata.conf` section `[statsd]`|Synthetic statsd charts can be configured with files in `/etc/netdata/statsd.d/`.| -| `slabinfo.plugin`<br/>(external plugin for monitoring Kernel SLAB cache on Linux)|`C`|`netdata.conf` section `[plugin:slabinfo]`|N/A| -| `tc.plugin`<br/>(internal plugin for collecting Linux traffic QoS)|`C`|`netdata.conf` section `[plugin:tc]`|The plugin runs an external helper called `tc-qos-helper.sh` to interface with the `tc` command. This helper supports a few additional options using `tc-qos-helper.conf`.| - -## writing data collection modules - -You can add custom plugins following the [External Plugins Guide](../collectors/plugins.d/). - ---- - -## available data collection modules - -These are all the data collection plugins currently available. - -### Web Servers - -| application | language | notes | -|:---------:|:------:|:----| -| apache|python<br/>v2 or v3|Connects to multiple apache servers (local or remote) to collect real-time performance metrics.<br/> <br/>Netdata plugin: [python.d.plugin](../collectors/python.d.plugin)<br/>plugin module: [apache.chart.py](../collectors/python.d.plugin/apache)<br/>configuration file: [python.d/apache.conf](../collectors/python.d.plugin/apache)| -| apache|BASH<br/>Shell Script|Connects to an apache server (local or remote) to collect real-time performance metrics.<br/><br/>DEPRECATED IN FAVOR OF THE PYTHON ONE. It is still supplied only as an example module to shell scripting plugins.<br/> <br/>Netdata plugin: [charts.d.plugin](../collectors/charts.d.plugin#chartsdplugin)<br/>plugin module: [apache.chart.sh](../collectors/charts.d.plugin/apache)<br/>configuration file: [charts.d/apache.conf](../collectors/charts.d.plugin/apache)| -| ipfs|python<br/>v2 or v3|Connects to multiple ipfs servers (local or remote) to collect real-time performance metrics.<br/> <br/>Netdata plugin: [python.d.plugin](../collectors/python.d.plugin)<br/>plugin module: [ipfs.chart.py](../collectors/python.d.plugin/ipfs)<br/>configuration file: [python.d/ipfs.conf](../collectors/python.d.plugin/ipfs)| -| litespeed|python<br/>v2 or v3|reads the litespeed `rtreport` files to collect metrics.<br/> <br/>Netdata plugin: [python.d.plugin](../collectors/python.d.plugin)<br/>plugin module: [litespeed.chart.py](../collectors/python.d.plugin/litespeed)<br/>configuration file: [python.d/litespeed.conf](../collectors/python.d.plugin/litespeed)| -| nginx|python<br/>v2 or v3|Connects to multiple nginx servers (local or remote) to collect real-time performance metrics.<br/> <br/>Netdata plugin: [python.d.plugin](../collectors/python.d.plugin)<br/>plugin module: [nginx.chart.py](../collectors/python.d.plugin/nginx)<br/>configuration file: [python.d/nginx.conf](../collectors/python.d.plugin/nginx)| -| nginx_plus|python<br/>v2 or v3|Connects to multiple nginx_plus servers (local or remote) to collect real-time performance metrics.<br/> <br/>Netdata plugin: [python.d.plugin](../collectors/python.d.plugin)<br/>plugin module: [nginx_plus.chart.py](../collectors/python.d.plugin/nginx_plus)<br/>configuration file: [python.d/nginx_plus.conf](../collectors/python.d.plugin/nginx_plus)| -| nginx|BASH<br/>Shell Script|Connects to an nginx server (local or remote) to collect real-time performance metrics.<br/><br/>DEPRECATED IN FAVOR OF THE PYTHON ONE. It is still supplied only as an example module to shell scripting plugins.<br/> <br/>Netdata plugin: [charts.d.plugin](../collectors/charts.d.plugin#chartsdplugin)<br/>plugin module: [nginx.chart.sh](../collectors/charts.d.plugin/nginx)<br/>configuration file: [charts.d/nginx.conf](../collectors/charts.d.plugin/nginx)| -| phpfpm|python<br/>v2 or v3|Connects to multiple phpfpm servers (local or remote) to collect real-time performance metrics.<br/> <br/>Netdata plugin: [python.d.plugin](../collectors/python.d.plugin)<br/>plugin module: [phpfpm.chart.py](../collectors/python.d.plugin/phpfpm)<br/>configuration file: [python.d/phpfpm.conf](../collectors/python.d.plugin/phpfpm)| -| phpfpm|BASH<br/>Shell Script|Connects to one or more phpfpm servers (local or remote) to collect real-time performance metrics.<br/><br/>DEPRECATED IN FAVOR OF THE PYTHON ONE. It is still supplied only as an example module to shell scripting plugins.<br/> <br/>Netdata plugin: [charts.d.plugin](../collectors/charts.d.plugin#chartsdplugin)<br/>plugin module: [phpfpm.chart.sh](../collectors/charts.d.plugin/phpfpm)<br/>configuration file: [charts.d/phpfpm.conf](../collectors/charts.d.plugin/phpfpm)| -| tomcat|python<br/>v2 or v3|Connects to multiple tomcat servers (local or remote) to collect real-time performance metrics.<br/> <br/>Netdata plugin: [python.d.plugin](../collectors/python.d.plugin)<br/>plugin module: [tomcat.chart.py](../collectors/python.d.plugin/tomcat)<br/>configuration file: [python.d/tomcat.conf](../collectors/python.d.plugin/tomcat)| -| tomcat|BASH<br/>Shell Script|Connects to a tomcat server (local or remote) to collect real-time performance metrics.<br/><br/>DEPRECATED IN FAVOR OF THE PYTHON ONE. It is still supplied only as an example module to shell scripting plugins.<br/> <br/>Netdata plugin: [charts.d.plugin](../collectors/charts.d.plugin#chartsdplugin)<br/>plugin module: [tomcat.chart.sh](../collectors/charts.d.plugin/tomcat)<br/>configuration file: [charts.d/tomcat.conf](../collectors/charts.d.plugin/tomcat)| - ---- - -### Web Log Parsers - -| application|language|notes| -|:---------:|:------:|:----| -| web_log|python<br/>v2 or v3|powerful plugin, capable of incrementally parsing any number of web server log files <br/> <br/>Netdata plugin: [python.d.plugin](../collectors/python.d.plugin)<br/>plugin module: [web_log.chart.py](../collectors/python.d.plugin/web_log)<br/>configuration file: [python.d/web_log.conf](../collectors/python.d.plugin/web_log)| - ---- - -### Database Servers - -| application|language|notes| -|:---------:|:------:|:----| -| couchdb|python<br/>v2 or v3|Connects to multiple couchdb servers (local or remote) to collect real-time performance metrics.<br/> <br/>Netdata plugin: [python.d.plugin](../collectors/python.d.plugin)<br/>plugin module: [couchdb.chart.py](../collectors/python.d.plugin/couchdb)<br/>configuration file: [python.d/couchdb.conf](../collectors/python.d.plugin/couchdb)| -| memcached|python<br/>v2 or v3|Connects to multiple memcached servers (local or remote) to collect real-time performance metrics.<br/> <br/>Netdata plugin: [python.d.plugin](../collectors/python.d.plugin)<br/>plugin module: [memcached.chart.py](../collectors/python.d.plugin/memcached)<br/>configuration file: [python.d/memcached.conf](../collectors/python.d.plugin/memcached)| -| mongodb|python<br/>v2 or v3|Connects to multiple `mongodb` servers (local or remote) to collect real-time performance metrics.<br/> <br/>Requires package `python-pymongo`.<br/> <br/>Netdata plugin: [python.d.plugin](../collectors/python.d.plugin)<br/>plugin module: [mongodb.chart.py](../collectors/python.d.plugin/mongodb)<br/>configuration file: [python.d/mongodb.conf](../collectors/python.d.plugin/mongodb)| -| mysql<br/>mariadb|python<br/>v2 or v3|Connects to multiple mysql or mariadb servers (local or remote) to collect real-time performance metrics.<br/> <br/>Requires package `python-mysqldb` (faster and preferred), or `python-pymysql`. <br/> <br/>Netdata plugin: [python.d.plugin](../collectors/python.d.plugin)<br/>plugin module: [mysql.chart.py](../collectors/python.d.plugin/mysql)<br/>configuration file: [python.d/mysql.conf](../collectors/python.d.plugin/mysql)| -| mysql<br/>mariadb|BASH<br/>Shell Script|Connects to multiple mysql or mariadb servers (local or remote) to collect real-time performance metrics.<br/><br/>DEPRECATED IN FAVOR OF THE PYTHON ONE. It is still supplied only as an example module to shell scripting plugins.<br/> <br/>Netdata plugin: [charts.d.plugin](../collectors/charts.d.plugin#chartsdplugin)<br/>plugin module: [mysql.chart.sh](../collectors/charts.d.plugin/mysql)<br/>configuration file: [charts.d/mysql.conf](../collectors/charts.d.plugin/mysql)| -| postgres|python<br/>v2 or v3|Connects to multiple postgres servers (local or remote) to collect real-time performance metrics.<br/> <br/>Requires package `python-psycopg2`.<br/> <br/>Netdata plugin: [python.d.plugin](../collectors/python.d.plugin)<br/>plugin module: [postgres.chart.py](../collectors/python.d.plugin/postgres)<br/>configuration file: [python.d/postgres.conf](../collectors/python.d.plugin/postgres)| -| redis|python<br/>v2 or v3|Connects to multiple redis servers (local or remote) to collect real-time performance metrics.<br/> <br/>Netdata plugin: [python.d.plugin](../collectors/python.d.plugin)<br/>plugin module: [redis.chart.py](../collectors/python.d.plugin/redis)<br/>configuration file: [python.d/redis.conf](../collectors/python.d.plugin/redis)| -| rethinkdb|python<br/>v2 or v3|Connects to multiple rethinkdb servers (local or remote) to collect real-time metrics.<br/> <br/>Netdata plugin: [python.d.plugin](../collectors/python.d.plugin)<br/>plugin module: [rethinkdb.chart.py](../collectors/python.d.plugin/rethinkdbs)<br/>configuration file: [python.d/rethinkdb.conf](../collectors/python.d.plugin/rethinkdbs)| - ---- - -### Social Sharing Servers - -| application | language | notes | -|:---------:|:------:|:----| -| retroshare | python<br/>v2 or v3|Connects to multiple retroshare servers (local or remote) to collect real-time performance metrics.<br/> <br/>Netdata plugin: [python.d.plugin](../collectors/python.d.plugin)<br/>plugin module: [retroshare.chart.py](../collectors/python.d.plugin/retroshare)<br/>configuration file: [python.d/retroshare.conf](../collectors/python.d.plugin/retroshare)| - ---- - -### Proxy Servers - -|application|language|notes| -|:---------:|:------:|:----| -|squid|python<br/>v2 or v3|Connects to multiple squid servers (local or remote) to collect real-time performance metrics.<br/> <br/>Netdata plugin: [python.d.plugin](../collectors/python.d.plugin)<br/>plugin module: [squid.chart.py](../collectors/python.d.plugin/squid)<br/>configuration file: [python.d/squid.conf](../collectors/python.d.plugin/squid)| -|squid|BASH<br/>Shell Script|Connects to a squid server (local or remote) to collect real-time performance metrics.<br/><br/>DEPRECATED IN FAVOR OF THE PYTHON ONE. It is still supplied only as an example module to shell scripting plugins.<br/> <br/>Netdata plugin: [charts.d.plugin](../collectors/charts.d.plugin#chartsdplugin)<br/>plugin module: [squid.chart.sh](../collectors/charts.d.plugin/squid)<br/>configuration file: [charts.d/squid.conf](../collectors/charts.d.plugin/squid)| - ---- - -### HTTP Accelerators - -| application|language|notes| -|:---------:|:------:|:----| -| varnish|python<br/>v2 or v3|Uses the varnishstat command to provide varnish cache statistics (client metrics, cache perfomance, thread-related metrics, backend health, memory usage etc.).<br/> <br/>Netdata plugin: [python.d.plugin](../collectors/python.d.plugin)<br/>plugin module: [varnish.chart.py](../collectors/python.d.plugin/varnish)<br/>configuration file: [python.d/varnish.conf](../collectors/python.d.plugin/varnish)| - ---- - -### Search Engines - -| application|language|notes| -|:---------:|:------:|:----| -| elasticsearch|python<br/>v2 or v3|Monitor elasticsearch performance and health metrics.<br/> <br/>Netdata plugin: [python.d.plugin](../collectors/python.d.plugin)<br/>plugin module: [elasticsearch.chart.py](../collectors/python.d.plugin/elasticsearch)<br/>configuration file: [python.d/elasticsearch.conf](../collectors/python.d.plugin/elasticsearch)| - ---- - -### Name Servers - -| application|language|notes| -|:---------:|:------:|:----| -| named|node.js|Connects to multiple named (ISC-Bind) servers (local or remote) to collect real-time performance metrics. All versions of bind after 9.9.10 are supported.<br/> <br/>Netdata plugin: [node.d.plugin](../collectors/node.d.plugin#nodedplugin)<br/>plugin module: [named.node.js](../collectors/node.d.plugin/named)<br/>configuration file: [node.d/named.conf](../collectors/node.d.plugin/named)| -| bind_rndc|python<br/>v2 or v3|Parses named.stats dump file to collect real-time performance metrics. All versions of bind after 9.6 are supported.<br/> <br/>Netdata plugin: [python.d.plugin](../collectors/python.d.plugin)<br/>plugin module: [bind_rndc.chart.py](../collectors/python.d.plugin/bind_rndc)<br/>configuration file: [python.d/bind_rndc.conf](../collectors/python.d.plugin/bind_rndc)| -| nsd|python<br/>v2 or v3|Charts the nsd received queries and zones.<br/> <br/>Netdata plugin: [python.d.plugin](../collectors/python.d.plugin)<br/>plugin module: [nsd.chart.py](../collectors/python.d.plugin/nsd)<br/>configuration file: [python.d/nsd.conf](../collectors/python.d.plugin/nsd)| -| powerdns|python<br/>v2 or v3|Monitors powerdns performance and health metrics <br/> <br/>Netdata plugin: [python.d.plugin](../collectors/python.d.plugin)<br/>plugin module: [powerdns.chart.py](../collectors/python.d.plugin/powerdns)<br/>configuration file: [python.d/powerdns.conf](../collectors/python.d.plugin/powerdns)| -| dnsdist|python<br/>v2 or v3|Monitors dnsdist performance and health metrics <br/> <br/>Netdata plugin: [python.d.plugin](../collectors/python.d.plugin)<br/>plugin module: [dnsdist.chart.py](../collectors/python.d.plugin/dnsdist)<br/>configuration file: [python.d/dnsdist.conf](../collectors/python.d.plugin/dnsdist)| -| unbound|python<br/>v2 or v3|Monitors Unbound performance and resource usage metrics <br/> <br/>Netdata plugin: [python.d.plugin](../collectors/python.d.plugin)<br/>plugin module: [unbound.chart.py](../collectors/python.d.plugin/unbound)<br/>configuration file: [python.d/unbound.conf](../collectors/python.d.plugin/unbound)| - ---- - -### DHCP Servers - -| application|language|notes| -|:---------:|:------:|:----| -| isc dhcp|python<br/>v2 or v3|Monitor lease database to show all active leases.<br/> <br/>Python v2 requires package `python-ipaddress`.<br/> <br/>Netdata plugin: [python.d.plugin](../collectors/python.d.plugin)<br/>plugin module: [isc-dhcpd.chart.py](../collectors/python.d.plugin/isc_dhcpd)<br/>configuration file: [python.d/isc-dhcpd.conf](../collectors/python.d.plugin/isc_dhcpd)| - ---- +<!-- +title: "Add more charts to Netdata" +custom_edit_url: https://github.com/netdata/netdata/edit/master/docs/Add-more-charts-to-netdata.md +--> -### Load Balancers - -| application|language|notes| -|:---------:|:------:|:----| -| haproxy|python<br/>v2 or v3|Monitor frontend, backend and health metrics.<br/> <br/>Netdata plugin: [python.d.plugin](../collectors/python.d.plugin)<br/>plugin module: [haproxy.chart.py](../collectors/python.d.plugin/haproxy)<br/>configuration file: [python.d/haproxy.conf](../collectors/python.d.plugin/haproxy)| -| traefik|python<br/>v2 or v3|Connects to multiple traefik instances (local or remote) to collect API metrics (response status code, response time, average response time and server uptime).<br/> <br/>Netdata plugin: [python.d.plugin](../collectors/python.d.plugin)<br/>plugin module: [traefik.chart.py](../collectors/python.d.plugin/traefik)<br/>configuration file: [python.d/traefik.conf](../collectors/python.d.plugin/traefik)| - ---- - -### Message Brokers - -| application | language|notes| -|:---------:|:------:|:----| -| rabbitmq | python<br/>v2 or v3|Monitor rabbitmq performance and health metrics.<br/> <br/>Netdata plugin: [python.d.plugin](../collectors/python.d.plugin)<br/>plugin module: [rabbitmq.chart.py](../collectors/python.d.plugin/rabbitmq)<br/>configuration file: [python.d/rabbitmq.conf](../collectors/python.d.plugin/rabbitmq)| -| beanstalkd | python<br/>v2 or v3|Provides server and tube level statistics.<br/> <br/>Requires beanstalkc python package (`pip install beanstalkc` or install package `python-beanstalkc`, which also installs `python-yaml`).<br/> <br/>Netdata plugin: [python.d.plugin](../collectors/python.d.plugin)<br/>plugin module: [beanstalk.chart.py](../collectors/python.d.plugin/beanstalk)<br/>configuration file: [python.d/beanstalk.conf](../collectors/python.d.plugin/beanstalk)| - ---- - -### UPS - -| application|language|notes| -|:---------:|:------:|:----| -| apcupsd|BASH<br/>Shell Script|Connects to an apcupsd server to collect real-time statistics of an APC UPS.<br/> <br/>Netdata plugin: [charts.d.plugin](../collectors/charts.d.plugin#chartsdplugin)<br/>plugin module: [apcupsd.chart.sh](../collectors/charts.d.plugin/apcupsd)<br/>configuration file: [charts.d/apcupsd.conf](../collectors/charts.d.plugin/apcupsd)| -| nut|BASH<br/>Shell Script|Connects to a nut server (upsd) to collect real-time UPS statistics.<br/> <br/>Netdata plugin: [charts.d.plugin](../collectors/charts.d.plugin#chartsdplugin)<br/>plugin module: [nut.chart.sh](../collectors/charts.d.plugin/nut)<br/>configuration file: [charts.d/nut.conf](../collectors/charts.d.plugin/nut)| - ---- - -### RAID - -|application|language|notes| -|:---------:|:------:|:----| -|megacli|python<br/>v2 or v3|Collects adapter, physical drives and battery stats..<br/> <br/>Netdata plugin: [python.d.plugin](../collectors/python.d.plugin)<br/>plugin module: [megacli.chart.py](../collectors/python.d.plugin/megacli)<br/>configuration file: [python.d/megacli.conf](../collectors/python.d.plugin/megacli)| - ---- - -### Mail Servers - -| application|language|notes| -|:---------:|:------:|:----| -| dovecot|python<br/>v2 or v3|Connects to multiple dovecot servers (local or remote) to collect real-time performance metrics.<br/> <br/>Netdata plugin: [python.d.plugin](../collectors/python.d.plugin)<br/>plugin module: [dovecot.chart.py](../collectors/python.d.plugin/dovecot)<br/>configuration file: [python.d/dovecot.conf](../collectors/python.d.plugin/dovecot)| -| exim|python<br/>v2 or v3|Charts the exim queue size.<br/> <br/>Netdata plugin: [python.d.plugin](../collectors/python.d.plugin)<br/>plugin module: [exim.chart.py](../collectors/python.d.plugin/exim)<br/>configuration file: [python.d/exim.conf](../collectors/python.d.plugin/exim)| -| exim|BASH<br/>Shell Script|Charts the exim queue size.<br/><br/>DEPRECATED IN FAVOR OF THE PYTHON ONE. It is still supplied only as an example module to shell scripting plugins.<br/> <br/>Netdata plugin: [charts.d.plugin](../collectors/charts.d.plugin#chartsdplugin)<br/>plugin module: [exim.chart.sh](../collectors/charts.d.plugin/exim)<br/>configuration file: [charts.d/exim.conf](../collectors/charts.d.plugin/exim)| -| postfix|python<br/>v2 or v3|Charts the postfix queue size (supports multiple queues).<br/> <br/>Netdata plugin: [python.d.plugin](../collectors/python.d.plugin)<br/>plugin module: [postfix.chart.py](../collectors/python.d.plugin/postfix)<br/>configuration file: [python.d/postfix.conf](../collectors/python.d.plugin/postfix)| -| postfix|BASH<br/>Shell Script|Charts the postfix queue size.<br/><br/>DEPRECATED IN FAVOR OF THE PYTHON ONE. It is still supplied only as an example module to shell scripting plugins.<br/> <br/>Netdata plugin: [charts.d.plugin](../collectors/charts.d.plugin#chartsdplugin)<br/>plugin module: [postfix.chart.sh](../collectors/charts.d.plugin/postfix)<br/>configuration file: [charts.d/postfix.conf](../collectors/charts.d.plugin/postfix)| - ---- - -### File Servers - -| application|language|notes| -|:---------:|:------:|:----| -| NFS Client|`C`|This is handled entirely by the Netdata daemon.<br/> <br/>Configuration: `netdata.conf`, section `[plugin:proc:/proc/net/rpc/nfs]`.| -| NFS Server|`C`|This is handled entirely by the `netdata` daemon.<br/> <br/>Configuration: `netdata.conf`, section `[plugin:proc:/proc/net/rpc/nfsd]`.| -| samba|python<br/>v2 or v3|Performance metrics of Samba SMB2 file sharing.<br/> <br/>documentation page: [python.d.plugin module samba](../collectors/python.d.plugin/samba)<br/>Netdata plugin: [python.d.plugin](../collectors/python.d.plugin)<br/>plugin module: [samba.chart.py](../collectors/python.d.plugin/samba)<br/>configuration file: [python.d/samba.conf](../collectors/python.d.plugin/samba)| - ---- - -### Print Servers - -| application|language|notes| -|:---------:|:------:|:----| -| CUPS|C|Charts metrics of printers, jobs and other cups destinations.<br/> <br/>Netdata plugin: [cups.plugin](../collectors/cups.plugin)| - ---- - -### Hypervisors - -| application|language|notes| -|:---------:|:------:|:----| -| xenstat|C|Collects host and domain statistics for XenServer or XCP-ng hypervisors.<br/> <br/>Netdata plugin: [xenstat.plugin](../collectors/xenstat.plugin)| - ---- - -### System - -| application|language|notes| -|:---------:|:------:|:----| -| apps|C|`apps.plugin` collects resource usage statistics for all processes running in the system. It groups the entire process tree and reports dozens of metrics for CPU utilization, memory footprint, disk I/O, swap memory, network connections, open files and sockets, etc. It reports metrics for application groups, users and user groups.<br/> <br/>[Documentation of `apps.plugin`](../collectors/apps.plugin/).<br/> <br/>Netdata plugin: [`apps_plugin.c`](../collectors/apps.plugin)<br/>configuration file: [`apps_groups.conf`](../collectors/apps.plugin)| -| ioping|C|Charts disk latency statistics for a directory/file/device, using the `ioping` command. A recent (probably unreleased) version of ioping is required. The plugin supplied can install it in `/usr/local`.<br/> <br/>Netdata plugin: [ioping.plugin](../collectors/ioping.plugin) (this is a shell wrapper to start ioping - once ioping is started, Netdata and ioping communicate directly - it can also install the right version of ioping)<br/>configuration file: [ioping.conf](../collectors/ioping.plugin)| -| perf|C|`perf.plugin` collects CPU performance metrics using hardware performance monitoring units (PMU).<br/> <br/>[Documentation of `perf.plugin`](../collectors/perf.plugin/).<br/> <br/>Netdata plugin: [`perf_plugin.c`](../collectors/perf.plugin)| -| cpu_apps|BASH<br/>Shell Script|Collects the CPU utilization of select apps.<br/><br/>DEPRECATED IN FAVOR OF `apps.plugin`. It is still supplied only as an example module to shell scripting plugins.<br/> <br/>Netdata plugin: [charts.d.plugin](../collectors/charts.d.plugin#chartsdplugin)<br/>plugin module: [cpu_apps.chart.sh](../collectors/charts.d.plugin/cpu_apps)<br/>configuration file: [charts.d/cpu_apps.conf](../collectors/charts.d.plugin/cpu_apps)| -| load_average|BASH<br/>Shell Script|Collects the current system load average.<br/><br/>DEPRECATED IN FAVOR OF THE NETDATA INTERNAL ONE. It is still supplied only as an example module to shell scripting plugins.<br/> <br/>Netdata plugin: [charts.d.plugin](../collectors/charts.d.plugin#chartsdplugin)<br/>plugin module: [load_average.chart.sh](../collectors/charts.d.plugin/load_average)<br/>configuration file: [charts.d/load_average.conf](../collectors/charts.d.plugin/load_average)| -| mem_apps|BASH<br/>Shell Script|Collects the memory footprint of select applications.<br/><br/>DEPRECATED IN FAVOR OF `apps.plugin`. It is still supplied only as an example module to shell scripting plugins.<br/> <br/>Netdata plugin: [charts.d.plugin](../collectors/charts.d.plugin#chartsdplugin)<br/>plugin module: [mem_apps.chart.sh](../collectors/charts.d.plugin/mem_apps)<br/>configuration file: [charts.d/mem_apps.conf](../collectors/charts.d.plugin/mem_apps)| -| slabinfo|C|`slabinfo.plugin` collects Kernel SLAB cache metrics on Linux .<br/> <br/>[Documentation of `slabinfo.plugin`](../collectors/slabinfo.plugin/).<br/> <br/>Netdata plugin: [`slabinfo_plugin.c`](../collectors/slabinfo.plugin)| - ---- - -### Sensors - -| application|language|notes| -|:---------:|:------:|:----| -| cpufreq|BASH<br/>Shell Script|Collects current CPU frequency from `/sys/devices`.<br/><br/>DEPRECATED IN FAVOR OF THE PYTHON ONE. It is still supplied only as an example module to shell scripting plugins.<br/> <br/>Netdata plugin: [charts.d.plugin](../collectors/charts.d.plugin#chartsdplugin)<br/>plugin module: [cpufreq.chart.sh](../collectors/charts.d.plugin/cpufreq)<br/>configuration file: [charts.d/cpufreq.conf](../collectors/charts.d.plugin/cpufreq)| -| IPMI|C|Collects temperatures, voltages, currents, power, fans and `SEL` events from IPMI using `libipmimonitoring`.<br/>Check [Monitoring IPMI](../collectors/freeipmi.plugin/) for more information<br/> <br/>Netdata plugin: [freeipmi.plugin](../collectors/freeipmi.plugin)<br/>configuration file: none required - to enable it, compile/install Netdata with `--enable-plugin-freeipmi`| -| hddtemp|python<br/>v2 or v3|Connects to multiple hddtemp servers (local or remote) to collect real-time performance metrics.<br/> <br/>Netdata plugin: [python.d.plugin](../collectors/python.d.plugin)<br/>plugin module: [hddtemp.chart.py](../collectors/python.d.plugin/hddtemp)<br/>configuration file: [python.d/hddtemp.conf](../collectors/python.d.plugin/hddtemp)| -| hddtemp|BASH<br/>Shell Script|Connects to a hddtemp server (local or remote) to collect real-time performance metrics.<br/><br/>DEPRECATED IN FAVOR OF THE PYTHON ONE. It is still supplied only as an example module to shell scripting plugins.<br/> <br/>Netdata plugin: [charts.d.plugin](../collectors/charts.d.plugin#chartsdplugin)<br/>plugin module: [hddtemp.chart.sh](../collectors/charts.d.plugin/hddtemp)<br/>configuration file: [charts.d/hddtemp.conf](../collectors/charts.d.plugin/hddtemp)| -| sensors|BASH<br/>Shell Script|Collects sensors values from files in `/sys`.<br/><br/>DEPRECATED IN FAVOR OF THE PYTHON ONE. It is still supplied only as an example module to shell scripting plugins.<br/> <br/>Netdata plugin: [charts.d.plugin](../collectors/charts.d.plugin#chartsdplugin)<br/>plugin module: [sensors.chart.sh](../collectors/charts.d.plugin/sensors)<br/>configuration file: [charts.d/sensors.conf](../collectors/charts.d.plugin/sensors)| -| sensors|python<br/>v2 or v3|Uses `lm-sensors` to collect sensor data.<br/> <br/>Netdata plugin: [python.d.plugin](../collectors/python.d.plugin)<br/>plugin module: [sensors.chart.py](../collectors/python.d.plugin/sensors)<br/>configuration file: [python.d/sensors.conf](../collectors/python.d.plugin/sensors)| -| smartd_log|python<br/>v2 or v3|Collects the S.M.A.R.T attributes from `smartd` log files.<br/> <br/>Netdata plugin: [python.d.plugin](../collectors/python.d.plugin)<br/>plugin module: [smartd_log.chart.py](../collectors/python.d.plugin/smartd_log)<br/>configuration file: [python.d/smartd_log.conf](../collectors/python.d.plugin/smartd_log)| -| w1sensor|python<br/>v2 or v3|Collects data from connected 1-Wire sensors.<br/> <br/>Netdata plugin: [python.d.plugin](../collectors/python.d.plugin)<br/>plugin module: [w1sensor.chart.py](../collectors/python.d.plugin/w1sensor)<br/>configuration file: [python.d/w1sensor.conf](../collectors/python.d.plugin/w1sensor)| - ---- - -### Network - -| application|language|notes| -|:---------:|:------:|:----| -| ap|BASH<br/>Shell Script|Uses the `iw` command to provide statistics of wireless clients connected to a wireless access point running on this host (works well with `hostapd`).<br/> <br/>Netdata plugin: [charts.d.plugin](../collectors/charts.d.plugin#chartsdplugin)<br/>plugin module: [ap.chart.sh](../collectors/charts.d.plugin/ap)<br/>configuration file: [charts.d/ap.conf](../collectors/charts.d.plugin/ap)| -| fping|C|Charts network latency statistics for any number of nodes, using the `fping` command. A recent (probably unreleased) version of fping is required. The plugin supplied can install it in `/usr/local`.<br/> <br/>Netdata plugin: [fping.plugin](../collectors/fping.plugin) (this is a shell wrapper to start fping - once fping is started, Netdata and fping communicate directly - it can also install the right version of fping)<br/>configuration file: [fping.conf](../collectors/fping.plugin)| -| snmp|node.js|Connects to multiple snmp servers to collect real-time performance metrics.<br/> <br/>Netdata plugin: [node.d.plugin](../collectors/node.d.plugin#nodedplugin)<br/>plugin module: [snmp.node.js](../collectors/node.d.plugin/snmp)<br/>configuration file: [node.d/snmp.conf](../collectors/node.d.plugin/snmp)| -| nfacct|C|collects netfilter firewall, connection tracker and accounting metrics using `libmnl` and `libnetfilter_acct`| -| dns_query_time|python<br/>v2 or v3|Provides DNS query time statistics.<br/> <br/>Requires package `dnspython` (`pip install dnspython` or install package `python-dnspython`).<br/> <br/>Netdata plugin: [python.d.plugin](../collectors/python.d.plugin)<br/>plugin module: [dns_query_time.chart.py](../collectors/python.d.plugin/dns_query_time)<br/>configuration file: [python.d/dns_query_time.conf](../collectors/python.d.plugin/dns_query_time)| -| http|python<br />v2 or v3|Monitors a generic web page for status code and returned content in HTML| -| port|ptyhon<br />v2 or v3|Checks if a generic TCP port for its availability and response time| - ---- - -### Time Servers - -| application|language|notes| -|:---------:|:------:|:----| -| chrony|python<br/>v2 or v3|Uses the chronyc command to provide chrony statistics (Frequency, Last offset, RMS offset, Residual freq, Root delay, Root dispersion, Skew, System time).<br/> <br/>Netdata plugin: [python.d.plugin](../collectors/python.d.plugin)<br/>plugin module: [chrony.chart.py](../collectors/python.d.plugin/chrony)<br/>configuration file: [python.d/chrony.conf](../collectors/python.d.plugin/chrony)| -| ntpd|python<br/>v2 or v3|Connects to multiple ntpd servers (local or remote) to provide statistics of system variables and optional also peer variables (if enabled in the configuration).<br/> <br/>Netdata plugin: [python.d.plugin](../collectors/python.d.plugin)<br/>plugin module: [ntpd.chart.py](../collectors/python.d.plugin/ntpd)<br/>configuration file: [python.d/ntpd.conf](../collectors/python.d.plugin/ntpd)| - ---- - -### Security - -| application|language|notes| -|:---------:|:------:|:----| -| freeradius|python<br/>v2 or v3|Uses the radclient command to provide freeradius statistics (authentication, accounting, proxy-authentication, proxy-accounting).<br/> <br/>Netdata plugin: [python.d.plugin](../collectors/python.d.plugin)<br/>plugin module: [freeradius.chart.py](../collectors/python.d.plugin/freeradius)<br/>configuration file: [python.d/freeradius.conf](../collectors/python.d.plugin/freeradius)| -| openvpn|python<br/>v2 or v3|All data from openvpn-status.log in your dashboard! <br/> <br/>Netdata plugin: [python.d.plugin](../collectors/python.d.plugin)<br/>plugin module: [ovpn_status_log.chart.py](../collectors/python.d.plugin/ovpn_status_log)<br/>configuration file: [python.d/ovpn_status_log.conf](../collectors/python.d.plugin/ovpn_status_log)| -| fail2ban|python<br/>v2 or v3|Monitor fail2ban log file to show all bans for all active jails <br/> <br/>Netdata plugin: [python.d.plugin](../collectors/python.d.plugin)<br/>plugin module: [fail2ban.chart.py](../collectors/python.d.plugin/fail2ban)<br/>configuration file: [python.d/fail2ban.conf](../collectors/python.d.plugin/fail2ban)| - ---- - -### Telephony Servers - -| application|language|notes| -|:---------:|:------:|:----| -| opensips|BASH<br/>Shell Script|Connects to an opensips server (local only) to collect real-time performance metrics.<br/> <br/>Netdata plugin: [charts.d.plugin](../collectors/charts.d.plugin#chartsdplugin)<br/>plugin module: [opensips.chart.sh](../collectors/charts.d.plugin/opensips)<br/>configuration file: [charts.d/opensips.conf](../collectors/charts.d.plugin/opensips)| - ---- - -### Go applications - -| application|language|notes| -|:---------:|:------:|:----| -| go_expvar|python<br/>v2 or v3|Parses metrics exposed by applications written in the Go programming language using the [expvar package](https://golang.org/pkg/expvar/).<br/> <br/>Netdata plugin: [python.d.plugin](../collectors/python.d.plugin)<br/>plugin module: [go_expvar.chart.py](../collectors/python.d.plugin/go_expvar)<br/>configuration file: [python.d/go_expvar.conf](../collectors/python.d.plugin/go_expvar)<br/>documentation: [Monitoring Go Applications](../collectors/python.d.plugin/go_expvar/)| - ---- - -### Household Appliances - -| application|language|notes| -|:---------:|:------:|:----| -| sma_webbox|node.js|Connects to multiple remote SMA webboxes to collect real-time performance metrics of the photovoltaic (solar) power generation.<br/> <br/>Netdata plugin: [node.d.plugin](../collectors/node.d.plugin#nodedplugin)<br/>plugin module: [sma_webbox.node.js](../collectors/node.d.plugin/sma_webbox)<br/>configuration file: [node.d/sma_webbox.conf](../collectors/node.d.plugin/sma_webbox)| -| fronius|node.js|Connects to multiple remote Fronius Symo servers to collect real-time performance metrics of the photovoltaic (solar) power generation.<br/> <br/>Netdata plugin: [node.d.plugin](../collectors/node.d.plugin#nodedplugin)<br/>plugin module: [fronius.node.js](../collectors/node.d.plugin/fronius)<br/>configuration file: [node.d/fronius.conf](../collectors/node.d.plugin/fronius)| -| stiebeleltron|node.js|Collects the temperatures and other metrics from your Stiebel Eltron heating system using their Internet Service Gateway (ISG web).<br/> <br/>Netdata plugin: [node.d.plugin](../collectors/node.d.plugin#nodedplugin)<br/>plugin module: [stiebeleltron.node.js](../collectors/node.d.plugin/stiebeleltron)<br/>configuration file: [node.d/stiebeleltron.conf](../collectors/node.d.plugin/stiebeleltron)| - ---- - -### Java Processes - -| application|language|notes| -|:---------:|:------:|:----| -| Spring Boot Application|java|Monitors running Java [Spring Boot](https://spring.io/) applications that expose their metrics with the use of the **Spring Boot Actuator** included in Spring Boot library.<br/> <br/>Netdata plugin: [python.d.plugin](../collectors/python.d.plugin)<br/>plugin module: [springboot](../collectors/python.d.plugin/springboot)<br/>configuration file: [python.d/springboot.conf](../collectors/python.d.plugin/springboot)| - ---- - -### Provisioning Systems - -| application|language|notes| -|:---------:|:------:|:----| -| puppet|python<br/>v2 or v3|Connects to multiple Puppet Server and Puppet DB instances (local or remote) to collect real-time status metrics.<br/> <br/>Netdata plugin: [python.d.plugin](../collectors/python.d.plugin)<br/>plugin module: [puppet.chart.py](../collectors/python.d.plugin/puppet)<br/>configuration file: [python.d/puppet.conf](../collectors/python.d.plugin/puppet)| - ---- - -### Game Servers - -| application|language|notes| -|:---------:|:------:|:----| -| SpigotMC|Python<br/>v2 or v3|Monitors Spigot Minecraft server ticks per second and number of online players using the Minecraft remote console.<br/> <br/>Netdata plugin: [python.d.plugin](../collectors/python.d.plugin)<br/>plugin module: [spigotmc.chart.py](../collectors/python.d.plugin/spigotmc)<br/>configuration file: [python.d/spigotmc.conf](../collectors/python.d.plugin/spigotmc)| - ---- - -### Distributed Computing Clients - -| application|language|notes| -|:---------:|:------:|:----| -| BOINC|Python<br/>v2 or v3|Monitors task states for local and remote BOINC client software using the remote GUI RPC interface. Also provides alarms for a handful of error conditions. Requires manual configuration<br/> <br/>Netdata plugin: [python.d.plugin](../collectors/python.d.plugin)<br/>plugin module: [boinc.chart.py](../collectors/python.d.plugin/boinc)<br/>configuration file: [python.d/boinc.conf](../collectors/python.d.plugin/boinc)| +# Add more charts to Netdata ---- +This file has been deprecated. Please see our [collectors docs](/collectors/README.md) or the collectors [quickstart +guide](/collectors/QUICKSTART.md) for more information. -### Skeleton Plugins +## Available data collection modules -| application|language|notes| -|:---------:|:------:|:----| -| example|BASH<br/>Shell Script|Skeleton plugin in BASH.<br/><br/>DEPRECATED IN FAVOR OF THE PYTHON ONE. It is still supplied only as an example module to shell scripting plugins.<br/> <br/>Netdata plugin: [charts.d.plugin](../collectors/charts.d.plugin#chartsdplugin)<br/>plugin module: [example.chart.sh](../collectors/charts.d.plugin/example)<br/>configuration file: [charts.d/example.conf](../collectors/charts.d.plugin/example)| -| example|python<br/>v2 or v3|Skeleton plugin in Python.<br/> <br/>Netdata plugin: [python.d.plugin](../collectors/python.d.plugin)<br/>plugin module: [example.chart.py](../collectors/python.d.plugin/example)<br/>configuration file: [python.d/example.conf](../collectors/python.d.plugin/example)| +See the [list of supported collectors](/collectors/COLLECTORS.md) to see all the sources Netdata can collect metrics +from. -[](<>) +[]() diff --git a/docs/Demo-Sites.md b/docs/Demo-Sites.md index 6bb501de4..8af1282ba 100644 --- a/docs/Demo-Sites.md +++ b/docs/Demo-Sites.md @@ -1,20 +1,25 @@ +<!-- +title: "Demo sites" +date: 2020-03-26 +custom_edit_url: https://github.com/netdata/netdata/edit/master/docs/Demo-Sites.md +--> + # Demo sites -Live demo installations of Netdata are available at **[https://www.netdata.cloud](https://www.netdata.cloud/#live-demo)**: +You can also view live demos of Netdata at **[https://www.netdata.cloud](https://www.netdata.cloud/#live-demo)**. -| Location|Netdata demo URL|60 mins reqs|VM Donated by| -|:------:|:--------------:|:----------:|:------------| -| London (UK)|**[london.my-netdata.io](https://london.my-netdata.io)**<br/>(this is the global Netdata **registry** and has **named** and **mysql** charts)|[](https://london.my-netdata.io)|[DigitalOcean.com](https://m.do.co/c/83dc9f941745)| -| Atlanta (USA)|**[cdn77.my-netdata.io](https://cdn77.my-netdata.io)**<br/>(with **named** and **mysql** charts)|[](https://cdn77.my-netdata.io)|[CDN77.com](https://www.cdn77.com/)| -| Israel|**[octopuscs.my-netdata.io](https://octopuscs.my-netdata.io)**|[](https://octopuscs.my-netdata.io)|[OctopusCS.com](https://www.octopuscs.com)| -| Madrid (Spain)|**[stackscale.my-netdata.io](https://stackscale.my-netdata.io)**|[](https://stackscale.my-netdata.io)|[StackScale Spain](https://www.stackscale.es/)| -| Bangalore (India)|**[bangalore.my-netdata.io](https://bangalore.my-netdata.io)**|[](https://bangalore.my-netdata.io)|[DigitalOcean.com](https://m.do.co/c/83dc9f941745)| -| Frankfurt (Germany)|**[frankfurt.my-netdata.io](https://frankfurt.my-netdata.io)**|[](https://frankfurt.my-netdata.io)|[DigitalOcean.com](https://m.do.co/c/83dc9f941745)| -| New York (USA)|**[newyork.my-netdata.io](https://newyork.my-netdata.io)**|[](https://newyork.my-netdata.io)|[DigitalOcean.com](https://m.do.co/c/83dc9f941745)| -| San Francisco (USA)|**[sanfrancisco.my-netdata.io](https://sanfrancisco.my-netdata.io)**|[](https://sanfrancisco.my-netdata.io)|[DigitalOcean.com](https://m.do.co/c/83dc9f941745)| -| Singapore|**[singapore.my-netdata.io](https://singapore.my-netdata.io)**|[](https://singapore.my-netdata.io)|[DigitalOcean.com](https://m.do.co/c/83dc9f941745)| -| Toronto (Canada)|**[toronto.my-netdata.io](https://toronto.my-netdata.io)**|[](https://toronto.my-netdata.io)|[DigitalOcean.com](https://m.do.co/c/83dc9f941745)| +| Location | Netdata demo URL | 60 mins reqs | VM donated by | +| :------------------ | :-------------------------------------------------------------------------------------------------------------------------------------------- | :------------------------------------------------------------------------------------------------------------------------------------------------------------------------------------------------------------------------------------------------------------| :------------------------------------------------- | +| London (UK) | **[london.my-netdata.io](https://london.my-netdata.io)**<br/>(this is the global Netdata **registry** and has **named** and **mysql** charts) | [](https://london.my-netdata.io) | [DigitalOcean.com](https://m.do.co/c/83dc9f941745) | +| Atlanta (USA) | **[cdn77.my-netdata.io](https://cdn77.my-netdata.io)**<br/>(with **named** and **mysql** charts) | [](https://cdn77.my-netdata.io) | [CDN77.com](https://www.cdn77.com/) | +| Israel | **[octopuscs.my-netdata.io](https://octopuscs.my-netdata.io)** | [](https://octopuscs.my-netdata.io) | [OctopusCS.com](https://www.octopuscs.com) | +| Bangalore (India) | **[bangalore.my-netdata.io](https://bangalore.my-netdata.io)** | [](https://bangalore.my-netdata.io) | [DigitalOcean.com](https://m.do.co/c/83dc9f941745) | +| Frankfurt (Germany) | **[frankfurt.my-netdata.io](https://frankfurt.my-netdata.io)** | [](https://frankfurt.my-netdata.io) | [DigitalOcean.com](https://m.do.co/c/83dc9f941745) | +| New York (USA) | **[newyork.my-netdata.io](https://newyork.my-netdata.io)** | [](https://newyork.my-netdata.io) | [DigitalOcean.com](https://m.do.co/c/83dc9f941745) | +| San Francisco (USA) | **[sanfrancisco.my-netdata.io](https://sanfrancisco.my-netdata.io)** | [](https://sanfrancisco.my-netdata.io) | [DigitalOcean.com](https://m.do.co/c/83dc9f941745) | +| Singapore | **[singapore.my-netdata.io](https://singapore.my-netdata.io)** | [](https://singapore.my-netdata.io) | [DigitalOcean.com](https://m.do.co/c/83dc9f941745) | +| Toronto (Canada) | **[toronto.my-netdata.io](https://toronto.my-netdata.io)** | [](https://toronto.my-netdata.io) | [DigitalOcean.com](https://m.do.co/c/83dc9f941745) | -_Netdata dashboards are mobile and touch friendly._ +Netdata dashboards are mobile- and touch-friendly. [](<>) diff --git a/docs/Donations-netdata-has-received.md b/docs/Donations-netdata-has-received.md index 8b46980ae..df6c040ba 100644 --- a/docs/Donations-netdata-has-received.md +++ b/docs/Donations-netdata-has-received.md @@ -1,3 +1,8 @@ +<!-- +title: "Donations" +custom_edit_url: https://github.com/netdata/netdata/edit/master/docs/Donations-netdata-has-received.md +--> + # Donations This is a list of the donations we have received for Netdata (sorted alphabetically on their name): @@ -11,7 +16,6 @@ This is a list of the donations we have received for Netdata (sorted alphabetica | Cloud VMs|[london.my-netdata.io](https://london.my-netdata.io) (Several VMs)|**[DigitalOcean.com](https://www.digitalocean.com/)**|**DigitalOcean.com** donated 1000 USD to be used in their excellent Cloud Computing services. Many thanks to [Justin Paine](https://github.com/xxdesmus) for making this happen.| | Development IDE|-|**[JetBrains.com](https://www.jetbrains.com/)**|**JetBrains.com** donated an open source license for 4 developers for 1 year, to their excellent IDEs.| | Cloud VM|[octopuscs.my-netdata.io](https://octopuscs.my-netdata.io)|**[OctopusCS.com](https://octopuscs.com/)**|**OctopusCS.com** donated a VM with 4 CPU cores, 16GB RAM and 50GB HD in their excellent Cloud Computing services.| -| Cloud VM|[ventureer.my-netdata.io](https://ventureer.my-netdata.io)|**[Ventureer.com](https://ventureer.com/)**|**Ventureer.com** donated a VM with 4 CPU cores, 8GB RAM and 50GB HD in their excellent Cloud Computing services.| | Cloud VM|[stackscale.my-netdata.io](https://stackscale.my-netdata.io)|**[stackscale.com](https://www.stackscale.com/)**|**StackScale.com** donated a VM with 4 CPU cores, 16GB RAM and 100GB HD in their excellent Cloud Computing services.| Thank you! diff --git a/docs/Performance.md b/docs/Performance.md deleted file mode 100644 index 8205c70ee..000000000 --- a/docs/Performance.md +++ /dev/null @@ -1,222 +0,0 @@ -# Performance - -Netdata performance is affected by: - -**Data collection** - -- the number of charts for which data are collected -- the number of plugins running -- the technology of the plugins (i.e. BASH plugins are slower than binary plugins) -- the frequency of data collection - -You can control all the above. - -**Web clients accessing the data** - -- the duration of the charts in the dashboard -- the number of charts refreshes requested -- the compression level of the web responses - -- - - - -## Netdata Daemon - -For most server systems, with a few hundred charts and a few thousand dimensions, the Netdata daemon, without any web clients accessing it, should not use more than 1% of a single core. - -To prove Netdata scalability, check issue [#1323](https://github.com/netdata/netdata/issues/1323#issuecomment-265501668) where Netdata collects 95.000 metrics per second, with 12% CPU utilization of a single core! - -In embedded systems, if the Netdata daemon is using a lot of CPU without any web clients accessing it, you should lower the data collection frequency. To set the data collection frequency, edit `/etc/netdata/netdata.conf` and set `update_every` to a higher number (this is the frequency in seconds data are collected for all charts: higher number of seconds = lower frequency, the default is 1 for per second data collection). You can also set this frequency per module or chart. Check the [daemon configuration](../daemon/config) for plugins and charts. For specific modules, the configuration needs to be changed in: - -- `python.d.conf` for [python](../collectors/python.d.plugin/#pythondplugin) -- `node.d.conf` for [nodejs](../collectors/node.d.plugin/#nodedplugin) -- `charts.d.conf` for [bash](../collectors/charts.d.plugin/#chartsdplugin) - -## Plugins - -If a plugin is using a lot of CPU, you should lower its update frequency, or if you wrote it, re-factor it to be more CPU efficient. Check [External Plugins](../collectors/plugins.d/) for more details on writing plugins. - -## CPU consumption when web clients are accessing dashboards - -Netdata is very efficient when servicing web clients. On most server platforms, Netdata should be able to serve **1800 web client requests per second per core** for auto-refreshing charts. - -Normally, each user connected will request less than 10 chart refreshes per second (the page may have hundreds of charts, but only the visible are refreshed). So you can expect 180 users per CPU core accessing dashboards before having any delays. - -Netdata runs with the lowest possible process priority, so even if 1000 users are accessing dashboards, it should not influence your applications. CPU utilization will reach 100%, but your applications should get all the CPU they need. - -To lower the CPU utilization of Netdata when clients are accessing the dashboard, set `web compression level = 1`, or disable web compression completely by setting `enable web responses gzip compression = no`. Both settings are in the `[web]` section. - -## Monitoring a heavy loaded system - -Netdata, while running, does not depend on disk I/O (apart its log files and `access.log` is written with buffering enabled and can be disabled). Some plugins that need disk may stop and show gaps during heavy system load, but the Netdata daemon itself should be able to work and collect values from `/proc` and `/sys` and serve web clients accessing it. - -Keep in mind that Netdata saves its database when it exits and loads it back when restarted. While it is running though, its DB is only stored in RAM and no I/O takes place for it. - -## Netdata process priority - -By default, Netdata runs with the `idle` process scheduler, which assigns CPU resources to Netdata, only when the system has such resources to spare. - -The following `netdata.conf` settings control this: - -``` -[global] - process scheduling policy = idle - process scheduling priority = 0 - process nice level = 19 -``` - -The policies supported by Netdata are `idle` (the Netdata default), `other` (also as `nice`), `batch`, `rr`, `fifo`. Netdata also recognizes `keep` and `none` to keep the current settings without changing them. - -For `other`, `nice` and `batch`, the setting `process nice level = 19` is activated to configure the nice level of Netdata. Nice gets values -20 (highest) to 19 (lowest). - -For `rr` and `fifo`, the setting `process scheduling priority = 0` is activated to configure the priority of the relative scheduling policy. Priority gets values 1 (lowest) to 99 (highest). - -For the details of each scheduler, see `man sched_setscheduler` and `man sched`. - -When Netdata is running under systemd, it can only lower its priority (the default is `other` with `nice level = 0`). If you want to make Netdata to get more CPU than that, you will need to set in `netdata.conf`: - -``` -[global] - process scheduling policy = keep -``` - -and edit `/etc/systemd/system/netdata.service` and add: - -``` -CPUSchedulingPolicy=other | batch | idle | fifo | rr -CPUSchedulingPriority=99 -Nice=-10 -``` - -## Running Netdata in embedded devices - -Embedded devices usually have very limited CPU resources available, and in most cases, just a single core. - -> keep in mind that Netdata on RPi 2 and 3 does not require any tuning. The default settings will be good. The following tunables apply only when running Netdata on RPi 1 or other very weak IoT devices. - -We suggest to do the following: - -### 1. Disable External plugins - -External plugins can consume more system resources than the Netdata server. Disable the ones you don't need. If you need them, increase their `update every` value (again in `/etc/netdata/netdata.conf`), so that they do not run that frequently. - -Edit `/etc/netdata/netdata.conf`, find the `[plugins]` section: - -``` -[plugins] - proc = yes - - tc = no - idlejitter = no - cgroups = no - checks = no - apps = no - charts.d = no - node.d = no - python.d = no - - plugins directory = /usr/libexec/netdata/plugins.d - enable running new plugins = no - check for new plugins every = 60 -``` - -In detail: - -| plugin|description| -|:----:|:----------| -| `proc`|the internal plugin used to monitor the system. Normally, you don't want to disable this. You can disable individual functions of it at the next section.| -| `tc`|monitoring network interfaces QoS (tc classes)| -| `idlejitter`|internal plugin (written in C) that attempts show if the systems starved for CPU. Disabling it will eliminate a thread.| -| `cgroups`|monitoring linux containers. Most probably you are not going to need it. This will also eliminate another thread.| -| `checks`|a debugging plugin, which is disabled by default.| -| `apps`|a plugin that monitors system processes. It is very complex and heavy (consumes twice the CPU resources of the Netdata daemon), so if you don't need to monitor the process tree, you can disable it.| -| `charts.d`|BASH plugins (squid, nginx, mysql, etc). This is a heavy plugin, that consumes twice the CPU resources of the Netdata daemon.| -| `node.d`|node.js plugin, currently used for SNMP data collection and monitoring named (the name server).| -| `python.d`|has many modules and can use over 20MB of memory.| - -For most IoT devices, you can disable all plugins except `proc`. For `proc` there is another section that controls which functions of it you need. Check the next section. - ---- - -### 2. Disable internal plugins - -In this section you can select which modules of the `proc` plugin you need. All these are run in a single thread, one after another. Still, each one needs some RAM and consumes some CPU cycles. With all the modules enabled, the `proc` plugin adds ~9 MiB on top of the 5 MiB required by the Netdata daemon. - -``` -[plugin:proc] - # /proc/net/dev = yes # network interfaces - # /proc/diskstats = yes # disks -... -``` - -Refer to the [proc.plugins documentation](../collectors/proc.plugin/) for the list and description of all the proc plugin modules. - -### 3. Lower internal plugin update frequency - -If Netdata is still using a lot of CPU, lower its update frequency. Going from per second updates, to once every 2 seconds updates, will cut the CPU resources of all Netdata programs **in half**, and you will still have very frequent updates. - -If the CPU of the embedded device is too weak, try setting even lower update frequency. Experiment with `update every = 5` or `update every = 10` (higher number = lower frequency) in `netdata.conf`, until you get acceptable results. - -Keep in mind this will also force dashboard chart refreshes to happen at the same rate. So increasing this number actually lowers data collection frequency but also lowers dashboard chart refreshes frequency. - -This is a dashboard on a device with `[global].update every = 5` (this device is a media player and is now playing a movie): - - - -### 4. Disable logs - -Normally, you will not need them. To disable them, set: - -``` -[global] - debug log = none - error log = none - access log = none -``` - -### 5. Set memory mode to RAM - -Setting the memory mode to `ram` will disable loading and saving the round robin database. This will not affect anything while running Netdata, but it might be required if you have very limited storage available. - -``` -[global] - memory mode = ram -``` - -### 6. Lower memory requirements - -You can set the default size of the round robin database for all charts, using: - -``` -[global] - history = 600 -``` - -The units for history is `[global].update every` seconds. So if `[global].update every = 6` and `[global].history = 600`, you will have an hour of data ( 6 x 600 = 3.600 ), which will store 600 points per dimension, one every 6 seconds. - -Check also [Database](../database) for directions on calculating the size of the round robin database. - -### 7. Disable gzip compression of responses - -Gzip compression of the web responses is using more CPU that the rest of Netdata. You can lower the compression level or disable gzip compression completely. You can disable it, like this: - -``` -[web] - enable gzip compression = no -``` - -To lower the compression level, do this: - -``` -[web] - enable gzip compression = yes - gzip compression level = 1 -``` - -Finally, if no web server is installed on your device, you can use port tcp/80 for Netdata: - -``` -[web] - port = 80 -``` - -[](<>) diff --git a/docs/README.md b/docs/README.md index 752802f6d..47950f388 100644 --- a/docs/README.md +++ b/docs/README.md @@ -1,7 +1,17 @@ -# Read documentation on <https://docs.netdata.cloud> +<!-- +title: "Read documentation on <https://learn.netdata.cloud>" +custom_edit_url: https://github.com/netdata/netdata/edit/master/docs/README.md +--> -Welcome to the Netdata documentation! While you can read Netdata documentation here, or throughout the Netdata repository, our intention is that these pages are read on [docs.netdata.cloud](https://docs.netdata.cloud). +# Read documentation on <https://learn.netdata.cloud> -Links between documentation pages will work fine here, but the formatting may not be perfect, as our documentation site uses a few extra Markdown features that GitHub doesn't support natively. Other things might be missing or look less than perfect. +Welcome to the Netdata documentation! While you can read Netdata documentation here, or throughout the Netdata +repository, our intention is that these pages are read on [learn.netdata.cloud](https://learn.netdata.cloud). + +Links between documentation pages will work fine here, but the formatting may not be perfect, as our documentation site +uses a few extra Markdown features that GitHub doesn't support natively. Other things might be missing or look less than +perfect. Now get out there and build an exceptional infrastructure. + +[](<>) diff --git a/docs/Running-behind-apache.md b/docs/Running-behind-apache.md index 6c5ab6776..8810dc8fc 100644 --- a/docs/Running-behind-apache.md +++ b/docs/Running-behind-apache.md @@ -1,3 +1,8 @@ +<!-- +title: "Netdata via apache's mod_proxy" +custom_edit_url: https://github.com/netdata/netdata/edit/master/docs/Running-behind-apache.md +--> + # Netdata via apache's mod_proxy Below you can find instructions for configuring an apache server to: @@ -14,7 +19,7 @@ Make sure your apache has installed `mod_proxy` and `mod_proxy_http`. On debian/ubuntu systems, install them with this: ```sh -sudo apt-get install apache2-bin +sudo apt-get install apache2 ``` Also make sure they are enabled: @@ -227,6 +232,52 @@ If you want to enable CSP within your Apache, you should consider some special r Note: Changes are applied by reloading or restarting Apache. +## Using Netdata with Apache's `mod_evasive` module + +The `mod_evasive` Apache module helps system administrators protect their web server from brute force and distributed +denial of service attack (DDoS) attacks. + +Because Netdata sends a request to the web server for every chart update, it's normal to create 20-30 requests per +second, per client. If you're using `mod_evasive` on your Apache web server, this volume of requests will trigger the +module's protection, and your dashboard will become unresponsive. You may even begin to see 403 errors. + +To mitigate this issue, you will need to change the value of the `DOSPageCount` option in your `mod_evasive.conf` file, +which can typically be found at `/etc/httpd/conf.d/mod_evasive.conf` or `/etc/apache2/mods-enabled/evasive.conf`. + +The `DOSPageCount` option sets the limit of the number of requests from a single IP address for the same page per page +interval, which is usually 1 second. The default value is `2` requests per second. Clearly, Netdata's typical usage will +exceed that threshold, and `mod_evasive` will add your IP address to a blocklist. + +Our users have found success by setting `DOSPageCount` to `30`. Try this, and raise the value if you continue to see 403 +errors while accessing the dashboard. + +```conf +DOSPageCount 30 +``` + +Restart Apache with `sudo service apache2 restart`, or the appropriate method to restart services on your system, to +reload its configuration with your new values. + + +### Virtual host + +To adjust the `DOSPageCount` for a specific virtual host, open your virtual host config, which can be found at +`/etc/httpd/conf/sites-available/my-domain.conf` or `/etc/apache2/sites-available/my-domain.conf` and add the +following: + +```conf +<VirtualHost *:80> + ... + # Increase the DOSPageCount to prevent 403 errors and IP addresses being blocked. + <IfModule mod_evasive20.c> + DOSPageCount 30 + </IfModule> +</VirtualHost> +``` + +See issues [#2011](https://github.com/netdata/netdata/issues/2011) and +[#7658](https://github.com/netdata/netdata/issues/7568) for more information. + # Netdata configuration You might edit `/etc/netdata/netdata.conf` to optimize your setup a bit. For applying these changes you need to restart Netdata. @@ -301,7 +352,7 @@ If your apache server is not on localhost, you can set: *note: Netdata v1.9+ support `allow connections from`* -`allow connections from` accepts [Netdata simple patterns](../libnetdata/simple_pattern/) to match against the connection IP address. +`allow connections from` accepts [Netdata simple patterns](/libnetdata/simple_pattern/README.md) to match against the connection IP address. ## prevent the double access.log @@ -314,7 +365,7 @@ apache logs accesses and Netdata logs them too. You can prevent Netdata from gen ## Troubleshooting mod_proxy -Make sure the requests reach Netdata, by examing `/var/log/netdata/access.log`. +Make sure the requests reach Netdata, by examining `/var/log/netdata/access.log`. 1. if the requests do not reach Netdata, your apache does not forward them. 2. if the requests reach Netdata but the URLs are wrong, you have not re-written them properly. diff --git a/docs/Running-behind-caddy.md b/docs/Running-behind-caddy.md index 866d488d0..c1d57504a 100644 --- a/docs/Running-behind-caddy.md +++ b/docs/Running-behind-caddy.md @@ -1,3 +1,8 @@ +<!-- +title: "Netdata via Caddy" +custom_edit_url: https://github.com/netdata/netdata/edit/master/docs/Running-behind-caddy.md +--> + # Netdata via Caddy To run Netdata via [Caddy's proxying,](https://caddyserver.com/docs/proxy) set your Caddyfile up like this: diff --git a/docs/Running-behind-haproxy.md b/docs/Running-behind-haproxy.md index cf411b9f8..d4b09f85c 100644 --- a/docs/Running-behind-haproxy.md +++ b/docs/Running-behind-haproxy.md @@ -1,12 +1,18 @@ +<!-- +title: "Netdata via HAProxy" +custom_edit_url: https://github.com/netdata/netdata/edit/master/docs/Running-behind-haproxy.md +--> + # Netdata via HAProxy > HAProxy is a free, very fast and reliable solution offering high availability, load balancing, > and proxying for TCP and HTTP-based applications. It is particularly suited for very high traffic web sites > and powers quite a number of the world's most visited ones. -If Netdata is running on a host running HAProxy, rather than connecting to Netdata from a port number, a domain name -can be pointed at HAProxy, and HAProxy can redirect connections to the Netdata port. This can make it possible to -connect to Netdata at <https://example.com> or <https://example.com/netdata/>, which is a much nicer experience then <http://example.com:19999>. +If Netdata is running on a host running HAProxy, rather than connecting to Netdata from a port number, a domain name can +be pointed at HAProxy, and HAProxy can redirect connections to the Netdata port. This can make it possible to connect to +Netdata at `https://example.com` or `https://example.com/netdata/`, which is a much nicer experience then +`http://example.com:19999`. To proxy requests from [HAProxy](https://github.com/haproxy/haproxy) to Netdata, the following configuration can be used: @@ -22,11 +28,11 @@ defaults ## Simple Configuration -A simple example where the base URL, say <http://example.com>, is used with no subpath: +A simple example where the base URL, say `http://example.com`, is used with no subpath: ### Frontend -Create a frontend to recieve the request. +Create a frontend to receive the request. ```conf frontend http_frontend @@ -80,7 +86,7 @@ frontend http_frontend ### Backend -Same as simple example, expept remove `/netdata/` with regex. +Same as simple example, except remove `/netdata/` with regex. ```conf backend netdata_backend @@ -160,7 +166,7 @@ backend netdata_backend ## Enable authentication -To use basic HTTP Authentication, create a authentication list: +To use basic HTTP Authentication, create an authentication list: ```conf # HTTP Auth diff --git a/docs/Running-behind-lighttpd.md b/docs/Running-behind-lighttpd.md index 8f05973b8..864915800 100644 --- a/docs/Running-behind-lighttpd.md +++ b/docs/Running-behind-lighttpd.md @@ -1,3 +1,8 @@ +<!-- +title: "Netdata via lighttpd v1.4.x" +custom_edit_url: https://github.com/netdata/netdata/edit/master/docs/Running-behind-lighttpd.md +--> + # Netdata via lighttpd v1.4.x Here is a config for accessing Netdata in a suburl via lighttpd 1.4.46 and newer: diff --git a/docs/Running-behind-nginx.md b/docs/Running-behind-nginx.md index 99e5e601d..2f47447da 100644 --- a/docs/Running-behind-nginx.md +++ b/docs/Running-behind-nginx.md @@ -1,3 +1,8 @@ +<!-- +title: "Running Netdata behind Nginx" +custom_edit_url: https://github.com/netdata/netdata/edit/master/docs/Running-behind-nginx.md +--> + # Running Netdata behind Nginx ## Intro @@ -126,7 +131,7 @@ server { # the virtual host name of this subfolder should be exposed #server_name netdata.example.com; - location ~ /netdata/(?<behost>.*)/(?<ndpath>.*) { + location ~ /netdata/(?<behost>.*?)/(?<ndpath>.*) { proxy_set_header X-Forwarded-Host $host; proxy_set_header X-Forwarded-Server $host; proxy_set_header X-Forwarded-For $proxy_add_x_forwarded_for; @@ -158,7 +163,9 @@ Using the above, you access Netdata on the backend servers, like this: ### Encrypt the communication between Nginx and Netdata -In case Netdata's web server has been [configured to use TLS](../web/server/#enabling-tls-support), it is necessary to specify inside the Nginx configuration that the final destination is using TLS. To do this, please, append the following parameters in your `nginx.conf` +In case Netdata's web server has been [configured to use TLS](/web/server/README.md#enabling-tls-support), it is +necessary to specify inside the Nginx configuration that the final destination is using TLS. To do this, please, append +the following parameters in your `nginx.conf` ```conf proxy_set_header X-Forwarded-Proto https; @@ -231,7 +238,8 @@ If your Nginx server is not on localhost, you can set: *note: Netdata v1.9+ support `allow connections from`* -`allow connections from` accepts [Netdata simple patterns](../libnetdata/simple_pattern/) to match against the connection IP address. +`allow connections from` accepts [Netdata simple patterns](/libnetdata/simple_pattern/README.md) to match against the +connection IP address. ## Prevent the double access.log diff --git a/docs/Third-Party-Plugins.md b/docs/Third-Party-Plugins.md deleted file mode 100644 index 1b7344b12..000000000 --- a/docs/Third-Party-Plugins.md +++ /dev/null @@ -1,31 +0,0 @@ -# Third-party plugins - -The following is a list of Netdata plugins distributed by third parties: - -## Nvidia GPUs - -[Netdata nv plugin](https://github.com/coraxx/netdata_nv_plugin) monitors nvidia GPUs. - - - -## teamspeak 3 - -[teamspeak 3 plugin](https://github.com/coraxx/netdata_ts3_plugin) polls active users and bandwidth from TeamSpeak 3 servers. - -## SSH - -[SSH module](https://github.com/Yaser-Amiri/netdata-ssh-module) monitors failed authentication requests of SSH server. - -## interactive users count - -Collect [number of currently logged-on users](https://github.com/veksh/netdata-numsessions) - -## CyberPower UPS - -[cyberups plugin](https://github.com/HawtDogFlvrWtr/netdata_cyberpwrups_plugin) polls the USB connected CyberPower UPS for stats. - -## Nim - -There is an unofficial [nim plugin helper](https://github.com/FedericoCeratto/nim-netdata-plugin) - -[](<>) diff --git a/docs/a-github-star-is-important.md b/docs/a-github-star-is-important.md index 6bac3acef..d309d3928 100644 --- a/docs/a-github-star-is-important.md +++ b/docs/a-github-star-is-important.md @@ -1,10 +1,19 @@ +<!-- +title: "A GitHub star is important" +custom_edit_url: https://github.com/netdata/netdata/edit/master/docs/a-github-star-is-important.md +--> + # A GitHub star is important -**GitHub stars** allow Netdata to expand its reach, its community, especially attract people with skills willing to contribute to it. +**GitHub stars** allow Netdata to expand its reach, its community, especially attract people with skills willing to +contribute to it. -Compared to its first release, Netdata is now **twice as fast**, has all its bugs settled and a lot more functionality. This happened because a lot of people find it useful, use it daily at home and work, **rely on it** and **contribute to it**. +Compared to its first release, Netdata is now **twice as fast**, has all its bugs settled and a lot more functionality. +This happened because a lot of people find it useful, use it daily at home and work, **rely on it** and **contribute to +it**. -**GitHub stars** also **motivate** us. They state that you find our work **useful**. They give us strength to continue, to work **harder** to make it even **better**. +**GitHub stars** also **motivate** us. They state that you find our work **useful**. They give us strength to continue, +to work **harder** to make it even **better**. So, give Netdata a **GitHub star**, at the top right of this page. diff --git a/docs/agent-cloud.md b/docs/agent-cloud.md new file mode 100644 index 000000000..061b8472d --- /dev/null +++ b/docs/agent-cloud.md @@ -0,0 +1,79 @@ +<!-- +title: "Use the Agent with Netdata Cloud" +date: 2020-05-04 +custom_edit_url: https://github.com/netdata/netdata/edit/master/docs/agent-cloud.md +--> + +# Use the Agent with Netdata Cloud + +While the Netdata Agent is an enormously powerful _distributed_ health monitoring and performance troubleshooting tool, +many of its users need to monitor dozens or hundreds of systems at the same time. That's why we built Netdata Cloud, a +hosted web interface that gives you real-time visibility into your entire infrastructure. + +There are two main ways to use your Agent(s) with Netdata Cloud. You can use both these methods simultaneously, or just +one, based on your needs: + +- Use Netdata Cloud's web interface for monitoring an entire infrastructure, with any number of Agents, in one + centralized dashboard. +- Use **Visited nodes** to quickly navigate between the dashboards of nodes you've recently visited. + +## Monitor an infrastructure with Netdata Cloud + +We designed Netdata Cloud to help you see health and performance metrics, plus active alarms, in a single interface. +Here's what a small infrastructure might look like: + + + +[Read more about Netdata Cloud](https://learn.netdata.cloud/docs/cloud/) to better understand how it gives you real-time +visibility into your entire infrastructure, and why you might consider using it. + +Next, [get started in 5 minutes](https://learn.netdata.cloud/docs/cloud/get-started/), or read our [claiming +reference](/claim/README.md) for a complete investigation of Cloud's security and encryption features, plus instructions +for Docker containers. + +## Navigate between dashboards with Visited nodes + +If you don't want to use Netdata Cloud's web interface, you can still connect multiple nodes through the **Visited +nodes** menu, which appears on the left-hand side of the dashboard. + +You can use the Visited nodes menu to navigate between the dashboards of many different Agent-monitored systems quickly. + +To add nodes to your Visited nodes menu, you first need to navigate to that node's dashboard, then click the **Sign in** +button at the top of the dashboard. On the screen that appears, which states your node is requesting access to your +Netdata Cloud account, sign in with your preferred method. + +Cloud redirects you back to your node's dashboard, which is now connected to your Netdata Cloud account. You can now see +the Visited nodes menu, which is populated by a single node. + + + +If you previously went through the Cloud onboarding process to create a Space and War Room, you will also see these in +the Visited Nodes menu. You can click on your Space or any of your War Rooms to navigate to Netdata Cloud and continue +monitoring your infrastructure from there. + + + +To add more Agents to your Visited nodes menu, visit them and sign in again. This process connects that node to your +Cloud account and further populates the menu. + +Once you've added more than one node, you can use the menu to switch between various dashboards without remembering IP +addresses or hostnames or saving bookmarks for every node you want to monitor. + + + +## What's next? + +The Agent-Cloud integration is highly adaptable to the needs of any infrastructure or user. If you want to learn more +about how you might want to use or configure Cloud, we recommend the following: + +- Get an overview of Cloud's features by reading [Cloud documentation](https://learn.netdata.cloud/docs/cloud/). +- Follow the 5-minute [get started with Cloud](https://learn.netdata.cloud/docs/cloud/get-started/) guide to finish + onboarding and claim your first nodes. +- Better understand how agents connect securely to the Cloud with [claiming](/claim/README.md) and [Agent-Cloud + link](/aclk/README.md) documentation. + +[]() diff --git a/docs/anonymous-statistics.md b/docs/anonymous-statistics.md index 7f175a1c9..70c502d06 100644 --- a/docs/anonymous-statistics.md +++ b/docs/anonymous-statistics.md @@ -1,49 +1,64 @@ -# Anonymous Statistics +<!-- +title: "Anonymous statistics" +description: "The Netdata Agent collects anonymous usage information by default and sends it to Google Analytics for quality assurance and product decisions." +custom_edit_url: https://github.com/netdata/netdata/edit/master/docs/anonymous-statistics.md +--> -From Netdata v1.12 and above, anonymous usage information is collected by default and sent to Google Analytics. -The statistics calculated from this information will be used for: +# Anonymous statistics -1. **Quality assurance**, to help us understand if Netdata behaves as expected and help us identify repeating issues for certain distributions or environment. +Starting with v1.12, Netdata collects anonymous usage information by default and sends it to Google Analytics. We use +the statistics gathered from this information for two purposes: -2. **Usage statistics**, to help us focus on the parts of Netdata that are used the most, or help us identify the extend our development decisions influence the community. +1. **Quality assurance**, to help us understand if Netdata behaves as expected, and to help us classify repeated + issues with certain distributions or environments. -Information is sent to Netdata via two different channels: +2. **Usage statistics**, to help us interpret how people use the Netdata agent in real-world environments, and to help + us identify how our development/design decisions influence the community. -- Google Tag Manager is used when an agent's dashboard is accessed. -- The script `anonymous-statistics.sh` is executed by the Netdata daemon, when Netdata starts, stops cleanly, or fails. +Netdata sends information to Google Analytics via two different channels: -Both methods are controlled via the same [opt-out mechanism](#opt-out) +- Google Tag Manager fires when you access an agent's dashboard. +- The Netdata daemon executes the [`anonymous-statistics.sh` + script](https://github.com/netdata/netdata/blob/6469cf92724644f5facf343e4bdd76ac0551a418/daemon/anonymous-statistics.sh.in) + when Netdata starts, stops cleanly, or fails. + +You can opt-out from sending anonymous statistics to Netdata through three different [opt-out mechanisms](#opt-out). ## Google tag manager -Google tag manager (GTM) is the recommended way of collecting statistics for new implementations using GA. Unlike the older API, the logic of when to send information to GA and what information to send is controlled centrally. +Google tag manager (GTM) is the recommended way of collecting statistics for new implementations using GA. Unlike the +older API, the logic of when to send information to GA and what information to send is controlled centrally. -We have configured GTM to trigger the tag only when the variable `anonymous_statistics` is true. The value of this variable is controlled via the [opt-out mechanism](#opt-out). +We have configured GTM to trigger the tag only when the variable `anonymous_statistics` is true. The value of this +variable is controlled via the [opt-out mechanism](#opt-out). To ensure anonymity of the stored information, we have configured GTM's GA variable "Fields to set" as follows: -| Field Name|Value| -|----------|-----| -| page|netdata-dashboard| -| hostname|dashboard.my-netdata.io| -| anonymizeIp|true| -| title|Netdata dashboard| -| campaignSource|{{machine_guid}}| -| campaignMedium|web| -| referrer|<http://dashboard.my-netdata.io>| -| Page URL|<http://dashboard.my-netdata.io/netdata-dashboard>| -| Page Hostname|<http://dashboard.my-netdata.io>| -| Page Path|/netdata-dashboard| -| location|<http://dashboard.my-netdata.io>| +| Field name | Value | +| -------------- | -------------------------------------------------- | +| page | netdata-dashboard | +| hostname | dashboard.my-netdata.io | +| anonymizeIp | true | +| title | Netdata dashboard | +| campaignSource | {{machine_guid}} | +| campaignMedium | web | +| referrer | <http://dashboard.my-netdata.io> | +| Page URL | <http://dashboard.my-netdata.io/netdata-dashboard> | +| Page Hostname | <http://dashboard.my-netdata.io> | +| Page Path | /netdata-dashboard | +| location | <http://dashboard.my-netdata.io> | In addition, the Netdata-generated unique machine guid is sent to GA via a custom dimension. You can verify the effect of these settings by examining the GA `collect` request parameters. -The only thing that's impossible for us to prevent from being **sent** is the URL in the "Referrer" Header of the browser request to GA. However, the settings above ensure that all **stored** URLs and host names are anonymized. +The only thing that's impossible for us to prevent from being **sent** is the URL in the "Referrer" Header of the +browser request to GA. However, the settings above ensure that all **stored** URLs and host names are anonymized. ## Anonymous Statistics Script -Every time the daemon is started or stopped and every time a fatal condition is encountered, Netdata uses the anonymous statistics script to collect system information and send it to GA via an http call. The information collected for all events is: +Every time the daemon is started or stopped and every time a fatal condition is encountered, Netdata uses the anonymous +statistics script to collect system information and send it to GA via an http call. The information collected for all +events is: - Netdata version - OS name, version, id, id_like @@ -51,16 +66,44 @@ Every time the daemon is started or stopped and every time a fatal condition is - Virtualization technology - Containerization technology -Furthermore, the FATAL event sends the Netdata process & thread name, along with the source code function, source code filename and source code line number of the fatal error. +Furthermore, the FATAL event sends the Netdata process & thread name, along with the source code function, source code +filename and source code line number of the fatal error. + +Starting with v1.21, we additionally collect information about: + +- Failures to build the dependencies required to use Cloud features. +- Unavailability of Cloud features in an agent. +- Failures to connect to the Cloud in case the agent has been [claimed](/claim/README.md). This includes error codes + to inform the Netdata team about the reason why the connection failed. + +To see exactly what and how is collected, you can review the script template `daemon/anonymous-statistics.sh.in`. The +template is converted to a bash script called `anonymous-statistics.sh`, installed under the Netdata `plugins +directory`, which is usually `/usr/libexec/netdata/plugins.d`. + +## Opt-out + +You can opt-out from sending anonymous statistics to Netdata through three different opt-out mechanisms: + +**Create a file called `.opt-out-from-anonymous-statistics`.** This empty file, stored in your Netdata configuration +directory (usually `/etc/netdata`), immediately stops the statistics script from running, and works with any type of +installation, including manual, offline, and macOS installations. Create the file by running `touch +.opt-out-from-anonymous-statistics` from your Netdata configuration directory. -To see exactly what and how is collected, you can review the script template `daemon/anonymous-statistics.sh.in`. The template is converted to a bash script called `anonymous-statistics.sh`, installed under the Netdata `plugins directory`, which is usually `/usr/libexec/netdata/plugins.d`. +**Pass the option `--disable-telemetry` to any of the installer scripts in the [installation +docs](/packaging/installer/README.md).** You can append this option during the initial installation or a manual +update. You can also export the environment variable `DO_NOT_TRACK` with a non-zero or non-empty value +(e.g: `export DO_NOT_TRACK=1`). -## Opt-Out +When using Docker, **set your `DO_NOT_TRACK` environment variable to `1`.** You can set this variable with the following +command: `export DO_NOT_TRACK=1`. When creating a container using Netdata's [Docker +image](/packaging/docker/README.md#run-the-agent-with-the-docker-command) for the first time, this variable will disable +the anonymous statistics script inside of the container. -To opt-out from sending anonymous statistics, you can create a file called `.opt-out-from-anonymous-statistics` under the user configuration directory (usually `/etc/netdata`). The effect of creating the file is the following: +Each of these opt-out processes does the following: -- The daemon will never execute the anonymous statistics script -- The anonymous statistics script will exit immediately if called via any other way (e.g. shell) -- The Google Tag Manager Javascript snippet will remain in the page, but the linked tag will not be fired. The effect is that no data will ever be sent to GA. +- Prevents the daemon from executing the anonymous statistics script. +- Forces the anonymous statistics script to exit immediately. +- Stops the Google Tag Manager Javascript snippet, which remains on the dashboard, from firing and sending any data to + Google Analytics. -You can also disable telemetry by passing the option `--disable-telemetry` to any of the installers. +[]() diff --git a/docs/collect/application-metrics.md b/docs/collect/application-metrics.md new file mode 100644 index 000000000..e5f903946 --- /dev/null +++ b/docs/collect/application-metrics.md @@ -0,0 +1,80 @@ +<!-- +title: "Collect application metrics with Netdata" +sidebar_label: "Application metrics" +description: "Monitor and troubleshoot every application on your infrastructure with per-second metrics, zero configuration, and meaningful charts." +custom_edit_url: https://github.com/netdata/netdata/edit/master/docs/collect/application-metrics.md +--> + +# Collect application metrics with Netdata + +Netdata instantly collects per-second metrics from many different types of applications running on your systems, such as +web servers, databases, message brokers, email servers, search platforms, and much more. Metrics collectors are +pre-installed with every Netdata Agent and usually require zero configuration. Netdata also collects and visualizes +resource utilization per application on Linux systems using `apps.plugin`. + +[**apps.plugin**](/collectors/apps.plugin/README.md) looks at the Linux process tree every second, much like `top` or +`ps fax`, and collects resource utilization information on every running process. By reading the process tree, Netdata +shows CPU, disk, networking, processes, and eBPF for every application or Linux user. Unlike `top` or `ps fax`, Netdata +adds a layer of meaningful visualization on top of the process tree metrics, such as grouping applications into useful +dimensions, and then creates per-application charts under the **Applications** section of a Netdata dashboard, per-user +charts under **Users**, and per-user group charts under **User Groups**. + +Our most popular application collectors: + +- [Prometheus endpoints](https://learn.netdata.cloud/docs/agent/collectors/go.d.plugin/modules/prometheus): Gathers + metrics from one or more Prometheus endpoints that use the OpenMetrics exposition format. Autodetects more than 600 + endpoints. +- [Web server logs (Apache, NGINX)](https://learn.netdata.cloud/docs/agent/collectors/go.d.plugin/modules/weblog/): + Tail access logs and provide very detailed web server performance statistics. This module is able to parse 200k+ + rows in less than half a second. +- [MySQL](https://learn.netdata.cloud/docs/agent/collectors/go.d.plugin/modules/mysql/): Collect database global, + replication, and per-user statistics. +- [Redis](/collectors/python.d.plugin/redis/): Monitor database status by reading the server's response to the `INFO` + command. +- [Apache](https://learn.netdata.cloud/docs/agent/collectors/go.d.plugin/modules/apache/): Collect Apache web + server performance metrics via the `server-status?auto` endpoint. +- [Nginx](https://learn.netdata.cloud/docs/agent/collectors/go.d.plugin/modules/nginx/): Monitor web server + status information by gathering metrics via `ngx_http_stub_status_module`. +- [Postgres](/collectors/python.d.plugin/postgres/README.md): Collect database health and performance metrics. +- [ElasticSearch](/collectors/python.d.plugin/elasticsearch/README.md): Collect search engine performance and health + statistics. Optionally collects per-index metrics. +- [PHP-FPM](https://learn.netdata.cloud/docs/agent/collectors/go.d.plugin/modules/phpfpm/): Collect application + summary and processes health metrics by scraping the status page (`/status?full`). + +Our [supported collectors list](/collectors/COLLECTORS.md#service-and-application-collectors) shows all Netdata's +application metrics collectors, including those for containers/k8s clusters. + +## Collect metrics from applications running on Windows + +Netdata is fully capable of collecting and visualizing metrics from applications running on Windows systems. The only +caveat is that you must [install the Agent](/docs/get/README.md) on a separate system or a compatible VM because there +is no native Windows version of the Netdata Agent. + +Once you have the Agent running on that separate system, you can follow the [enable and configure +doc](/docs/collect/enable-configure.md) to tell the collector to look for exposed metrics on the Windows system's IP +address or hostname, plus the applicable port. + +For example, you have a MySQL database with a root password of `my-secret-pw` running on a Windows system with the IP +address 203.0.113.0. you can configure the [MySQL +collector](https://learn.netdata.cloud/docs/agent/collectors/go.d.plugin/modules/mysql) to look at `203.0.113.0:3306`: + +```yml +jobs: + - name: local + dsn: root:my-secret-pw@tcp(203.0.113.0:3306)/ +``` + +This same logic applies to any application in our [supported collectors +list](/collectors/COLLECTORS.md#service-and-application-collectors) that can run on Windows. + +## What's next? + +If you haven't yet seen the [supported collectors list](/collectors/COLLECTORS.md) give it a once-over for any +additional applications you may want to monitor using Netdata's native collectors, or the [generic Prometheus +collector](https://learn.netdata.cloud/docs/agent/collectors/go.d.plugin/modules/prometheus). + +Collecting all the available metrics on your nodes, and across your entire infrastructure, is just one piece of the +puzzle. Next, learn more about Netdata's famous real-time visualizations by [seeing an overview of your +infrastructure](/docs/visualize/overview-infrastructure.md) using Netdata Cloud. + +[](<>) diff --git a/docs/collect/container-metrics.md b/docs/collect/container-metrics.md new file mode 100644 index 000000000..b5bb9da01 --- /dev/null +++ b/docs/collect/container-metrics.md @@ -0,0 +1,99 @@ +<!-- +title: "Collect container metrics with Netdata" +sidebar_label: "Container metrics" +description: "Use Netdata to collect per-second utilization and application-level metrics from Linux/Docker containers and Kubernetes clusters." +custom_edit_url: https://github.com/netdata/netdata/edit/master/docs/collect/container-metrics.md +--> + +# Collect container metrics with Netdata + +Thanks to close integration with Linux cgroups and the virtual files it maintains under `/sys/fs/cgroup`, Netdata can +monitor the health, status, and resource utilization of many different types of Linux containers. + +Netdata uses [cgroups.plugin](/collectors/cgroups.plugin/README.md) to poll `/sys/fs/cgroup` and convert the raw data +into human-readable metrics and meaningful visualizations. Through cgroups, Netdata is compatible with **all Linux +containers**, such as Docker, LXC, LXD, Libvirt, systemd-nspawn, and more. Read more about [Docker-specific +monitoring](#collect-docker-metrics) below. + +Netdata also has robust **Kubernetes monitoring** support thanks to a +[Helmchart](/packaging/installer/methods/kubernetes.md) to automate deployment, collectors for k8s agent services, and +robust [service discovery](https://github.com/netdata/agent-service-discovery/#service-discovery) to monitor the +services running inside of pods in your k8s cluster. Read more about [Kubernetes +monitoring](#collect-kubernetes-metrics) below. + +A handful of additional collectors gather metrics from container-related services, such as +[dockerd](/collectors/python.d.plugin/dockerd/README.md) or [Docker +Engine](https://learn.netdata.cloud/docs/agent/collectors/go.d.plugin/modules/docker_engine/). You can find all +container collectors in our supported collectors list under the +[containers/VMs](/collectors/COLLECTORS.md#containers-and-vms) and +[Kubernetes](/collectors/COLLECTORS.md#containers-and-vms) headings. + +## Collect Docker metrics + +Netdata has robust Docker monitoring thanks to the aforementioned +[cgroups.plugin](/collectors/cgroups.plugin/README.md). By polling cgroups every second, Netdata can produce meaningful +visualizations about the CPU, memory, disk, and network utilization of all running containers on the host system with +zero configuration. + +Netdata also collects metrics from applications running inside of Docker containers. For example, if you create a MySQL +database container using `docker run --name some-mysql -e MYSQL_ROOT_PASSWORD=my-secret-pw -d mysql:tag`, it exposes +metrics on port 3306. You can configure the [MySQL +collector](https://learn.netdata.cloud/docs/agent/collectors/go.d.plugin/modules/mysql) to look at `127.0.0.0:3306` for +MySQL metrics: + +```yml +jobs: + - name: local + dsn: root:my-secret-pw@tcp(127.0.0.1:3306)/ +``` + +Netdata then collects metrics from the container itself, but also dozens [MySQL-specific +metrics](https://learn.netdata.cloud/docs/agent/collectors/go.d.plugin/modules/mysql#charts) as well. + +### Collect metrics from applications running in Docker containers + +You could use this technique to monitor an entire infrastructure of Docker containers. The same [enable and +configure](/docs/collect/enable-configure.md) procedures apply whether an application runs on the host system or inside +a container. You may need to configure the target endpoint if it's not the application's default. + +Netdata can even [run in a Docker container](/packaging/docker/README.md) itself, and then collect metrics about the +host system, its own container with cgroups, and any applications you want to monitor. + +See our [application metrics doc](/docs/collect/application-metrics.md) for details about Netdata's application metrics +collection capabilities. + +## Collect Kubernetes metrics + +We already have a few complementary tools and collectors for monitoring the many layers of a Kubernetes cluster, +_entirely for free_. These methods work together to help you troubleshoot performance or availability issues across +your k8s infrastructure. + +- A [Helm chart](https://github.com/netdata/helmchart), which bootstraps a Netdata Agent pod on every node in your + cluster, plus an additional parent pod for storing metrics and managing alarm notifications. +- A [service discovery plugin](https://github.com/netdata/agent-service-discovery), which discovers and creates + configuration files for [compatible + applications](https://github.com/netdata/helmchart#service-discovery-and-supported-services) and any endpoints + covered by our [generic Prometheus + collector](https://learn.netdata.cloud/docs/agent/collectors/go.d.plugin/modules/prometheus). With these + configuration files, Netdata collects metrics from any compatible applications as they run _inside_ of a pod. + Service discovery happens without manual intervention as pods are created, destroyed, or moved between nodes. +- A [Kubelet collector](https://learn.netdata.cloud/docs/agent/collectors/go.d.plugin/modules/k8s_kubelet), which runs + on each node in a k8s cluster to monitor the number of pods/containers, the volume of operations on each container, + and more. +- A [kube-proxy collector](https://learn.netdata.cloud/docs/agent/collectors/go.d.plugin/modules/k8s_kubeproxy), which + also runs on each node and monitors latency and the volume of HTTP requests to the proxy. +- A [cgroups collector](/collectors/cgroups.plugin/README.md), which collects CPU, memory, and bandwidth metrics for + each container running on your k8s cluster. + +For a holistic view of Netdata's Kubernetes monitoring capabilities, see our guide: [_Monitor a Kubernetes (k8s) cluster +with Netdata_](https://learn.netdata.cloud/guides/monitor/kubernetes-k8s-netdata). + +## What's next? + +Netdata is capable of collecting metrics from hundreds of applications, such as web servers, databases, messaging +brokers, and more. See more in the [application metrics doc](/docs/collect/application-metrics.md). + +If you already have all the information you need about collecting metrics, move into Netdata's meaningful visualizations +with [seeing an overview of your infrastructure](/docs/visualize/overview-infrastructure.md) using Netdata Cloud. + +[](<>) diff --git a/docs/collect/enable-configure.md b/docs/collect/enable-configure.md new file mode 100644 index 000000000..33d7a7bb4 --- /dev/null +++ b/docs/collect/enable-configure.md @@ -0,0 +1,66 @@ +<!-- +title: "Enable or configure a collector" +description: "Every collector is highly configurable, allowing them to collect metrics from any node and any infrastructure." +custom_edit_url: https://github.com/netdata/netdata/edit/master/docs/collect/enable-configure.md +--> + +# Enable or configure a collector + +When Netdata starts up, each collector searches for exposed metrics on the default endpoint established by that service +or application's standard installation procedure. For example, the [Nginx +collector](https://learn.netdata.cloud/docs/agent/collectors/go.d.plugin/modules/nginx) searches at +`http://127.0.0.1/stub_status` for exposed metrics in the correct format. If an Nginx web server is running and exposes +metrics on that endpoint, the collector begins gathering them. + +However, not every node or infrastructure uses standard ports, paths, files, or naming conventions. You may need to +enable or configure a collector to gather all available metrics from your systems, containers, or applications. + +## Enable a collector or its orchestrator + +You can enable/disable collectors individually, or enable/disable entire orchestrators, using their configuration files. +For example, you can change the behavior of the Go orchestrator, or any of its collectors, by editing `go.d.conf`. + +Use `edit-config` from your [Netdata config directory](/docs/configure/nodes.md#the-netdata-config-directory) to open +the orchestrator primary configuration file: + +```bash +cd /etc/netdata +sudo ./edit-config go.d.conf +``` + +Within this file, you can either disable the orchestrator entirely (`enabled: yes`), or find a specific collector and +enable/disable it with `yes` and `no` settings. Uncomment any line you change to ensure the Netdata daemon reads it on +start. + +After you make your changes, restart the Agent with `service netdata restart`. + +## Configure a collector + +First, [find the collector](/collectors/COLLECTORS.md) you want to edit and open its documentation. Some software has +collectors written in multiple languages. In these cases, you should always pick the collector written in Go. + +Use `edit-config` from your [Netdata config directory](/docs/configure/nodes.md#the-netdata-config-directory) to open a +collector's configuration file. For example, edit the Nginx collector with the following: + +```bash +./edit-config go.d/nginx.conf +``` + +Each configuration file describes every available option and offers examples to help you tweak Netdata's settings +according to your needs. In addition, every collector's documentation shows the exact command you need to run to +configure that collector. Uncomment any line you change to ensure the collector's orchestrator or the Netdata daemon +read it on start. + +After you make your changes, restart the Agent with `service netdata restart`. + +## What's next? + +Read high-level overviews on how Netdata collects [system metrics](/docs/collect/system-metrics.md), [container +metrics](/docs/collect/container-metrics.md), and [application metrics](/docs/collect/application-metrics.md). + +If you're already collecting all metrics from your systems, containers, and applications, it's time to move into +Netdata's visualization features. [See an overview of your infrastructure](/docs/visualize/overview-infrastructure.md) +using Netdata Cloud, or learn how to [interact with dashboards and +charts](/docs/visualize/interact-dashboards-charts.md). + +[](<>) diff --git a/docs/collect/how-collectors-work.md b/docs/collect/how-collectors-work.md new file mode 100644 index 000000000..5ae444a6f --- /dev/null +++ b/docs/collect/how-collectors-work.md @@ -0,0 +1,80 @@ +<!-- +title: "How Netdata's metrics collectors work" +description: "When Netdata starts, and with zero configuration, it auto-detects thousands of data sources and immediately collects per-second metrics." +custom_edit_url: https://github.com/netdata/netdata/edit/master/docs/collect/how-collectors-work.md +--> + +# How Netdata's metrics collectors work + +When Netdata starts, and with zero configuration, it auto-detects thousands of data sources and immediately collects +per-second metrics. + +Netdata can immediately collect metrics from these endpoints thanks to 300+ **collectors**, which all come pre-installed +when you [install the Netdata Agent](/docs/get/README.md#install-the-netdata-agent). + +Every collector has two primary jobs: + +- Look for exposed metrics at a pre- or user-defined endpoint. +- Gather exposed metrics and use additional logic to build meaningful, interactive visualizations. + +If the collector finds compatible metrics exposed on the configured endpoint, it begins a per-second collection job. The +Netdata Agent gathers these metrics, sends them to the [database engine for +storage](/docs/store/change-metrics-storage.md), and immediately [visualizes them +meaningfully](/docs/visualize/interact-dashboards-charts.md) on dashboards. + +Each collector comes with a pre-defined configuration that matches the default setup for that application. This endpoint +can be a URL and port, a socket, a file, a web page, and more. + +For example, the [Nginx collector](https://learn.netdata.cloud/docs/agent/collectors/go.d.plugin/modules/nginx) searches +at `http://127.0.0.1/stub_status`, which is the default endpoint for exposing Nginx metrics. The [web log collector for +Nginx or Apache](https://learn.netdata.cloud/docs/agent/collectors/go.d.plugin/modules/weblog) searches at +`/var/log/nginx/access.log` and `/var/log/apache2/access.log`, respectively, both of which are standard locations for +access log files on Linux systems. + +The endpoint is user-configurable, as are many other specifics of what a given collector does. + +## What can Netdata collect? + +To quickly find your answer, see our [list of supported collectors](/collectors/COLLECTORS.md). + +Generally, Netdata's collectors can be grouped into three types: + +- [Systems](/docs/collect/system-metrics.md): Monitor CPU, memory, disk, networking, systemd, eBPF, and much more. + Every metric exposed by `/proc`, `/sys`, and other Linux kernel sources. +- [Containers](/docs/collect/container-metrics.md): Gather metrics from container agents, like `dockerd` or `kubectl`, + along with the resource usage of containers and the applications they run. +- [Applications](/docs/collect/application-metrics.md): Collect per-second metrics from web servers, databases, logs, + message brokers, APM tools, email servers, and much more. + +## Collector architecture and terminology + +**Collector** is a catch-all term for any Netdata process that gathers metrics from an endpoint. + +While we use _collector_ most often in documentation, release notes, and educational content, you may encounter other +terms related to collecting metrics. + +- **Modules** are a type of collector. +- **Orchestrators** are external plugins that run and manage one or more modules. They run as independent processes. + The Go orchestrator is in active development. + - [go.d.plugin](https://learn.netdata.cloud/docs/agent/collectors/go.d.plugin/): An orchestrator for data + collection modules written in `go`. + - [python.d.plugin](/collectors/python.d.plugin/README.md): An orchestrator for data collection modules written in + `python` v2/v3. + - [charts.d.plugin](/collectors/charts.d.plugin/README.md): An orchestrator for data collection modules written in + `bash` v4+. + - [node.d.plugin](/collectors/node.d.plugin/README.md): An orchestrator for data collection modules written in + `node.js`. +- **External plugins** gather metrics from external processes, such as a webserver or database, and run as independent + processes that communicate with the Netdata daemon via pipes. +- **Internal plugins** gather metrics from `/proc`, `/sys`, and other Linux kernel sources. They are written in `C`, + and run as threads within the Netdata daemon. + +## What's next? + +[Enable or configure a collector](/docs/collect/enable-configure.md) if the default settings are not compatible with +your infrastructure. + +See our [collectors reference](/collectors/REFERENCE.md) for detailed information on Netdata's collector architecture, +troubleshooting a collector, developing a custom collector, and more. + +[](<>) diff --git a/docs/collect/system-metrics.md b/docs/collect/system-metrics.md new file mode 100644 index 000000000..72aa5714b --- /dev/null +++ b/docs/collect/system-metrics.md @@ -0,0 +1,65 @@ +<!-- +title: "Collect system metrics with Netdata" +sidebar_label: "System metrics" +description: "Netdata collects thousands of metrics from physical and virtual systems, IoT/edge devices, and containers with zero configuration." +custom_edit_url: https://github.com/netdata/netdata/edit/master/docs/collect/system-metrics.md +--> + +# Collect system metrics with Netdata + +Netdata collects thousands of metrics directly from the operating systems of physical and virtual systems, IoT/edge +devices, and [containers](/docs/collect/container-metrics.md) with zero configuration. + +To gather system metrics, Netdata uses roughly a dozen plugins, each of which has one or more collectors for very +specific metrics exposed by the host. The system metrics Netdata users interact with most for health monitoring and +performance troubleshooting are collected and visualized by `proc.plugin`, `cgroups.plugin`, and `ebpf.plugin`. + +[**proc.plugin**](/collectors/proc.plugin/README.md) gathers metrics from the `/proc` and `/sys` folders in Linux +systems, along with a few other endpoints, and is responsible for the bulk of the system metrics collected and +visualized by Netdata. It collects CPU, memory, disks, load, networking, mount points, and more with zero configuration. +It even allows Netdata to monitor its own resource utilization! + +[**cgroups.plugin**](/collectors/cgroups.plugin/README.md) collects rich metrics about containers and virtual machines +using the virtual files under `/sys/fs/cgroup`. By reading cgroups, Netdata can instantly collect resource utilization +metrics for systemd services, all containers (Docker, LXC, LXD, Libvirt, systemd-nspawn), and more. Learn more in the +[collecting container metrics](/docs/collect/container-metrics.md) doc. + +[**ebpf.plugin**](/collectors/ebpf.plugin/README.md): Netdata's extended Berkeley Packet Filter (eBPF) collector +monitors Linux kernel-level metrics for file descriptors, virtual filesystem IO, and process management. You can use our +eBPF collector to analyze how and when a process accesses files, when it makes system calls, whether it leaks memory or +creating zombie processes, and more. + +While the above plugins and associated collectors are the most important for system metrics, there are many others. You +can find all system collectors in our [supported collectors list](/collectors/COLLECTORS.md#system-metrics). + +## Collect Windows system metrics + +Netdata is also capable of monitoring Windows systems. The [WMI +collector](https://learn.netdata.cloud/docs/agent/collectors/go.d.plugin/modules/wmi) integrates with +[windows_exporter](https://github.com/prometheus-community/windows_exporter), a small Go-based binary that you can run +on Windows systems. The WMI collector then gathers metrics from an endpoint created by windows_exporter. + +First, [download windows_exporter](https://github.com/prometheus-community/windows_exporter#installation) and run it +with the following collectors enabled, changing `0.14.0` to the version you downloaded. + +```powershell +windows_exporter-0.14.0-amd64.exe --collectors.enabled="cpu,memory,net,logical_disk,os,system,logon" +``` + +Next, [configure the WMI +collector](https://learn.netdata.cloud/docs/agent/collectors/go.d.plugin/modules/wmi#configuration) to point to the URL +and port of your exposed endpoint. Restart Netdata with `service netdata restart` and you'll start seeing Windows system +metrics, such as CPU utilization, memory, bandwidth per NIC, number of processes, and much more. + +For information about collecting metrics from applications _running on Windows systems_, see the [application metrics +doc](/docs/collect/application-metrics.md#collect-metrics-from-applications-running-on-windows). + +## What's next? + +Because there's some overlap between system metrics and [container metrics](/docs/collect/container-metrics.md), you +should investigate Netdata's container compatibility if you use them heavily in your infrastructure. + +If you don't use containers, skip ahead to collecting [application metrics](/docs/collect/application-metrics.md) with +Netdata. + +[](<>) diff --git a/docs/configuration-guide.md b/docs/configuration-guide.md deleted file mode 100644 index 600848e2e..000000000 --- a/docs/configuration-guide.md +++ /dev/null @@ -1,137 +0,0 @@ -# Configuration guide - -No configuration is required to run Netdata, but you will find plenty of options to tweak, so that you can adapt it to your particular needs. - -<details markdown="1"><summary>Configuration files are placed in `/etc/netdata`.</summary> -Depending on your installation method, Netdata will have been installed either directly under `/`, or under `/opt/netdata`. The paths mentioned here and in the documentation in general assume that your installation is under `/`. If it is not, you will find the exact same paths under `/opt/netdata` as well. (i.e. `/etc/netdata` will be `/opt/netdata/etc/netdata`).</details> - -Under that directory you will see the following: - -- `netdata.conf` is [the main configuration file](../daemon/config/#daemon-configuration) -- `edit-config` is an sh script that you can use to easily and safely edit the configuration. Just run it to see its usage. -- Other directories, initially empty, where your custom configurations for alarms and collector plugins/modules will be copied from the stock configuration, if and when you customize them using `edit-config`. -- `orig` is a symbolic link to the directory `/usr/lib/netdata/conf.d`, which contains the stock configurations for everything not included in `netdata.conf`: - - `health_alarm_notify.conf` is where you configure how and to who Netdata will send [alarm notifications](../health/notifications/#netdata-alarm-notifications). - - `health.d` is the directory that contains the alarm triggers for [health monitoring](../health/#health-monitoring). It contains one .conf file per collector. - - The [modular plugin orchestrators](../collectors/plugins.d/#external-plugins-overview) have: - - One config file each, mainly to turn their modules on and off: `python.d.conf` for [python](../collectors/python.d.plugin/#pythondplugin), `node.d.conf` for [nodejs](../collectors/node.d.plugin/#nodedplugin) and `charts.d.conf` for [bash](../collectors/charts.d.plugin/#chartsdplugin) modules. - - One directory each, where the module-specific configuration files can be found. - - `stream.conf` is where you configure [streaming and replication](../streaming/#streaming-and-replication) - - `stats.d` is a directory under which you can add .conf files to add [synthetic charts](../collectors/statsd.plugin/#synthetic-statsd-charts). - - Individual collector plugin config files, such as `fping.conf` for the [fping plugin](../collectors/fping.plugin/) and `apps_groups.conf` for the [apps plugin](../collectors/apps.plugin/) - -So there are many configuration files to control every aspect of Netdata's behavior. It can be overwhelming at first, but you won't have to deal with any of them, unless you have specific things you need to change. The following HOWTO will guide you on how to customize your Netdata, based on what you want to do. - -## How to - -### Persist my configuration - -In <http://localhost:19999/netdata.conf>, you will see the following two parameters: - -```bash - # config directory = /etc/netdata - # stock config directory = /usr/lib/netdata/conf.d -``` - -To persist your configurations, don't edit the files under the `stock config directory` directly. Use the `sudo [config directory]/edit-config` command, or copy the stock config file to its proper place under the `config directory` and edit it there. - -### Change what I see - -##### Increase the metrics retention period - -Increase `history` in [netdata.conf \[global\]](../daemon/config/#global-section-options). Just ensure you understand [how much memory will be required](../database/) - -##### Reduce the data collection frequency - -Increase `update every` in [netdata.conf \[global\]](../daemon/config/#global-section-options). This is another way to increase your metrics retention period, but at a lower resolution than the default 1s. - -##### Modify how a chart is displayed - -In `netdata.conf` under `# Per chart configuration` you will find several [\[CHART_NAME\] sections](../daemon/config/#per-chart-configuration), where you can control all aspects of a specific chart. - -##### Disable a collector - -Entire plugins can be turned off from the [netdata.conf \[plugins\]](../daemon/config/#plugins-section-options) section. To disable specific modules of a plugin orchestrator, you need to edit one of the following: - -- `python.d.conf` for [python](../collectors/python.d.plugin/#pythondplugin) -- `node.d.conf` for [nodejs](../collectors/node.d.plugin/#nodedplugin) -- `charts.d.conf` for [bash](../collectors/charts.d.plugin/#chartsdplugin) - -##### Show charts with zero metrics - -By default, Netdata will enable monitoring metrics for disks, memory, and network only when they are not zero. If they are constantly zero they are ignored. Metrics that will start having values, after Netdata is started, will be detected and charts will be automatically added to the dashboard (a refresh of the dashboard is needed for them to appear though). Use `yes` instead of `auto` in plugin configuration sections to enable these charts permanently. You can also set the `enable zero metrics` option to `yes` in the `[global]` section which enables charts with zero metrics for all internal Netdata plugins. - -### Modify alarms and notifications - -##### Add a new alarm - -You can add a new alarm definition either by editing an existing stock alarm config file under `health.d` (e.g. `/etc/netdata/edit-config health.d/load.conf`), or by adding a new `.conf` file under `/etc/netdata/health.d`. The documentation on how to define an alarm is in [health monitoring](../health/#health-monitoring). It is suggested to look at some of the stock alarm definitions, so you can ensure you understand how the various options work. - -##### Turn off all alarms and notifications - -Just set `enabled = no` in the [netdata.conf \[health\]](../daemon/config/#health-section-options) section - -##### Modify or disable a specific alarm - -The `health.d` directory that contains the alarm triggers for [health monitoring](../health/#health-monitoring). It has one .conf file per collector. You can easily find the .conf file you will need to modify, by looking for the "source" line on the table that appears on the right side of an alarm on the Netdata gui. - -For example, if you click on Alarms and go to the tab 'All', the default Netdata installation will show you at the top the configured alarm for `10 min cpu usage` (it's the name of the badge). Looking at the table on the right side, you will see a row that says: `source 4@/usr/lib/netdata/conf.d/health.d/cpu.conf`. This way, you know that you will need to run `/etc/netdata/edit-config health.d/cpu.conf` and look for alarm at line 4 of the conf file. - -As stated at the top of the .conf file, **you can disable an alarm notification by setting the 'to' line to: silent**. -To modify how the alarm gets triggered, we suggest that you go through the guide on [health monitoring](../health/#health-monitoring). - -##### Receive notifications using my preferred method - -You only need to configure `health_alarm_notify.conf`. To learn how to do it, read first [alarm notifications](../health/notifications/#netdata-alarm-notifications) and then open the submenu `Supported Notifications` under `Alarm notifications` in the documentation to find the specific page on your prefered notification method. - -### Make security-related customizations - -##### Change the Netdata web server access lists - -You have several options under the [netdata.conf \[web\]](../web/server/#access-lists) section. - -##### Stop sending info to registry.my-netdata.io - -You will need to configure the [registry] section in `netdata.conf`. First read the [registry documentation](../registry/). In it, are instructions on how to [run your own registry](../registry/#run-your-own-registry). - -##### Change the IP address/port Netdata listens to - -The settings are under `netdata.conf` [web]. Look at the [web server documentation](../web/server/#binding-netdata-to-multiple-ports) for more info. - -### System resource usage - -##### Reduce the resources Netdata uses - -The page on [Netdata performance](Performance.md) has an excellent guide on how to reduce the Netdata cpu/disk/RAM utilization to levels suitable even for the weakest [IoT devices](netdata-for-IoT.md). - -##### Change when Netdata saves metrics to disk - -[netdata.conf \[global\]](../daemon/config/#global-section-options) : `memory mode` - -##### Prevent Netdata from getting immediately killed when my server runs out of memory - -You can change the Netdata [OOM score](../daemon/#oom-score) in `netdata.conf` [global]. - -### Other - -##### Move Netdata directories - -The various directory paths are in [netdata.conf \[global\]](../daemon/config/#global-section-options). - -## How Netdata configuration works - -The configuration files are `name = value` dictionaries with `[sections]`. Write whatever you like there as long as it follows this simple format. - -Netdata loads this dictionary and then when the code needs a value from it, it just looks up the `name` in the dictionary at the proper `section`. In all places, in the code, there are both the `names` and their `default values`, so if something is not found in the configuration file, the default is used. The lookup is made using B-Trees and hashes (no string comparisons), so they are super fast. Also the `names` of the settings can be `my super duper setting that once set to yes, will turn the world upside down = no` - so goodbye to most of the documentation involved. - -Next, Netdata can generate a valid configuration for the user to edit. No need to remember anything. Just get the configuration from the server (`/netdata.conf` on your Netdata server), edit it and save it. - -Last, what about options you believe you have set, but you misspelled?When you get the configuration file from the server, there will be a comment above all `name = value` pairs the server does not use. So you know that whatever you wrote there, is not used. - -## Netdata simple patterns - -Unix prefers regular expressions. But they are just too hard, too cryptic to use, write and understand. - -So, Netdata supports [simple patterns](../libnetdata/simple_pattern/). - -[](<>) diff --git a/docs/configure/common-changes.md b/docs/configure/common-changes.md new file mode 100644 index 000000000..6749384ac --- /dev/null +++ b/docs/configure/common-changes.md @@ -0,0 +1,214 @@ +<!-- +title: "Common configuration changes" +description: "See the most popular configuration changes to make to the Netdata Agent, including longer metrics retention, reduce sampling, and more." +custom_edit_url: https://github.com/netdata/netdata/edit/master/docs/configure/common-changes.md +--> + +# Common configuration changes + +The Netdata Agent requires no configuration upon installation to collect thousands of per-second metrics from most +systems, containers, and applications, but there are hundreds of settings to tweak if you want to exercise more control +over your monitoring platform. + +This document assumes familiarity with using [`edit-config`](/docs/configure/nodes.md) from the Netdata config +directory. + +## Change dashboards and visualizations + +The Netdata Agent's [local dashboard](/web/gui/README.md), accessible at `http://NODE:19999` is highly configurable. If +you use Netdata Cloud for [infrastructure monitoring](/docs/quickstart/infrastructure.md), you will see many of these +changes reflected in those visualizations due to the way Netdata Cloud proxies metric data and metadata to your browser. + +### Increase the long-term metrics retention period + +Increase the values for the `page cache size` and `dbengine multihost disk space` settings in the [`[global]` +section](/daemon/config/README.md#global-section-options) of `netdata.conf`. + +```conf +[global] + page cache size = 128 # 128 MiB of memory for metrics storage + dbengine multihost disk space = 4096 # 4GiB of disk space for metrics storage +``` + +Read our doc on [increasing long-term metrics storage](/docs/store/change-metrics-storage.md) for details, including a +[calculator](/docs/store/change-metrics-storage.md#calculate-the-system-resources-RAM-disk-space-needed-to-store-metrics) +to help you determine the exact settings for your desired retention period. + +### Reduce the data collection frequency + +Change `update every` in the [`[global]` section](/daemon/config/README.md#global-section-options) of `netdata.conf` so +that it is greater than `1`. An `update every` of `5` means the Netdata Agent enforces a _minimum_ collection frequency +of 5 seconds. + +```conf +[global] + update every = 5 +``` + +Every collector and plugin has its own `update every` setting, which you can also change in the `go.d.conf`, +`python.d.conf`, `node.d.conf`, or `charts.d.conf` files, or in individual collector configuration files. If the `update +every` for an individual collector is less than the global, the Netdata Agent uses the global setting. See the [enable +or configure a collector](/docs/collect/enable-configure.md) doc for details. + +### Disable a collector or plugin + +Turn off entire plugins in the [`[plugins]` section](/daemon/config/README.md#plugins-section-options) of +`netdata.conf`. + +To disable specific collectors, open `go.d.conf`, `python.d.conf`, `node.d.conf`, or `charts.d.conf` and find the line +for that specific module. Uncomment the line and change its value to `no`. + +## Modify alarms and notifications + +Netdata's health monitoring watchdog uses hundreds of preconfigured health entities, with intelligent thresholds, to +generate warning and critical alarms for most production systems and their applications without configuration. However, +each alarm and notification method is completely customizable. + +### Add a new alarm + +To create a new alarm configuration file, initiate an empty file, with a filename that ends in `.conf`, in the +`health.d/` directory. The Netdata Agent loads any valid alarm configuration file ending in `.conf` in that directory. +Next, edit the new file with `edit-config`. For example, with a file called `example-alarm.conf`. + +```bash +sudo touch health.d/example-alarm.conf +sudo ./edit-config health.d/example-alarm.conf +``` + +Or, append your new alarm to an existing file by editing a relevant existing file in the `health.d/` directory. + +Read more about [configuring alarms](/docs/monitor/configure-alarms.md) to get started, and see the [health monitoring +reference](/health/REFERENCE.md) for a full listing of options available in health entities. + +### Configure a specific alarm + +Tweak existing alarms by editing files in the `health.d/` directory. For example, edit `health.d/cpu.conf` to change how +the Agent responds to anomalies related to CPU utilization. + +To see which configuration file you need to edit to configure a specific alarm, [view your active +alarms](/docs/monitor/view-active-alarms.md) in Netdata Cloud or the local Agent dashboard and look for the **source** +line. For example, it might read `source 4@/usr/lib/netdata/conf.d/health.d/cpu.conf`. + +Because the source path contains `health.d/cpu.conf`, run `sudo edit-config health.d/cpu.conf` to configure that alarm. + +### Disable a specific alarm + +Open the configuration file for that alarm and set the `to` line to `silent`. + +```conf +template: disk_fill_rate + on: disk.space + lookup: max -1s at -30m unaligned of avail + calc: ($this - $avail) / (30 * 60) + every: 15s + to: silent +``` + +### Turn of all alarms and notifications + +Set `enabled` to `no` in the [`[health]` section](/daemon/config/README.md#health-section-options) section of +`netdata.conf`. + +### Enable alarm notifications + +Open `health_alarm_notify.conf` for editing. First, read the [enabling +notifications](/docs/monitor/enable-notifications.md#netdata-agent) doc for an example of the process using Slack, then +click on the link to your preferred notification method to find documentation for that specific endpoint. + +## Improve node security + +While the Netdata Agent is both [open and secure by design](https://www.netdata.cloud/blog/netdata-agent-dashboard/), we +recommend every user take some action to administer and secure their nodes. + +Learn more about a few of the following changes in the [node security doc](/docs/configure/secure-nodes.md). + +### Disable the local Agent dashboard (`http://NODE:19999`) + +If you use Netdata Cloud to visualize metrics, stream metrics to a parent node, or otherwise don't need the local Agent +dashboard, disabling it reduces the Agent's resource utilization and improves security. + +Change the `mode` setting to `none` in the [`[web]` section](/web/server/README.md#configuration) of `netdata.conf`. + +```conf +[web] + mode = none +``` + +### Use access lists to restrict access to specific assets + +Allow access from only specific IP addresses, ranges of IP addresses, or hostnames using [access +lists](/web/server/README.md#access-lists) and [simple patterns](/libnetdata/simple_pattern/README.md). + +See a quickstart to access lists in the [node security +doc](/docs/configure/secure-nodes.md#restrict-access-to-the-local-dashboard). + +### Stop sending anonymous statistics to Google Analytics + +Create a file called `.opt-out-from-anonymous-statistics` inside of your Netdata config directory to immediately stop +the statistics script. + +```bash +sudo touch .opt-out-from-anonymous-statistics +``` + +Learn more about [why we collect anonymous statistics](/docs/anonymous-statistics.md). + +### Change the IP address/port Netdata listens to + +Change the `default port` setting in the `[web]` section to a port other than `19999`. + +```conf +[web] + default port = 39999 +``` + +Use the `bind to` setting to the ports other assets, such as the [running `netdata.conf` +configuration](/docs/configure/nodes.md#see-an-agents-running-configuration), API, or streaming requests listen to. + +## Reduce resource usage + +Read our [performance optimization guide](/docs/guides/configure/performance.md) for a long list of specific changes +that can reduce the Netdata Agent's CPU/memory footprint and IO requirements. + +## Organize nodes with host labels + +Beginning with v1.20, Netdata accepts user-defined **host labels**. These labels are sent during streaming, exporting, +and as metadata to Netdata Cloud, and help you organize the metrics coming from complex infrastructure. Host labels are +defined in the section `[host labels]`. + +For a quick introduction, read the [host label guide](/docs/guides/using-host-labels.md). + +The following restrictions apply to host label names: + +- Names cannot start with `_`, but it can be present in other parts of the name. +- Names only accept alphabet letters, numbers, dots, and dashes. + +The policy for values is more flexible, but you can not use exclamation marks (`!`), whitespaces (` `), single quotes +(`'`), double quotes (`"`), or asterisks (`*`), because they are used to compare label values in health alarms and +templates. + +## What's next? + +If you haven't already, learn how to [secure your nodes](/docs/configure/secure-nodes.md). + +As mentioned at the top, there are plenty of other + +You can also take what you've learned about node configuration to tweak the Agent's behavior or enable new features: + +- [Enable new collectors](/docs/collect/enable-configure.md) or tweak their behavior. +- [Configure existing health alarms](/docs/monitor/configure-alarms.md) or create new ones. +- [Enable notifications](/docs/monitor/enable-notifications.md) to receive updates about the health of your + infrastructure. +- Change [the long-term metrics retention period](/docs/store/change-metrics-storage.md) using the database engine. + +### Related reference documentation + +- [Netdata Agent · Daemon](/health/README.md) +- [Netdata Agent · Daemon configuration](/daemon/config/README.md) +- [Netdata Agent · Web server](/web/server/README.md) +- [Netdata Agent · Local Agent dashboard](/web/gui/README.md) +- [Netdata Agent · Health monitoring](/health/REFERENCE.md) +- [Netdata Agent · Notifications](/health/notifications/README.md) +- [Netdata Agent · Simple patterns](/libnetdata/simple_pattern/README.md) + +[](<>) diff --git a/docs/configure/nodes.md b/docs/configure/nodes.md new file mode 100644 index 000000000..2e4bef640 --- /dev/null +++ b/docs/configure/nodes.md @@ -0,0 +1,165 @@ +<!-- +title: "Configure the Netdata Agent" +description: "Netdata is zero-configuration for most users, but complex infrastructures may require you to tweak some of the Agent's granular settings." +custom_edit_url: https://github.com/netdata/netdata/edit/master/docs/configure/nodes.md +--> + +# Configure the Netdata Agent + +Netdata's zero-configuration collection, storage, and visualization features work for many users, infrastructures, and +use cases, but there are some situations where you might want to configure the Netdata Agent running on your node(s), +which can be a physical or virtual machine (VM), container, cloud deployment, or edge/IoT device. + +For example, you might want to increase metrics retention, configure a collector based on your infrastructure's unique +setup, or secure the local dashboard by restricting it to only connections from `localhost`. + +Whatever the reason, Netdata users should know how to configure individual nodes to act decisively if an incident, +anomaly, or change in infrastructure affects how their Agents should perform. + +## The Netdata config directory + +On most Linux systems, using our [recommended one-line installation](/docs/get/README.md#install-the-netdata-agent), the +**Netdata config directory** is `/etc/netdata/`. The config directory contains several configuration files with the +`.conf` extension, a few directories, and a shell script named `edit-config`. + +> Some operating systems will use `/opt/netdata/etc/netdata/` as the config directory. If you're not sure where yours +> is, navigate to `http://NODE:19999/netdata.conf` in your browser, replacing `NODE` with the IP address or hostname of +> your node, and find the `# config directory = ` setting. The value listed is the config directory for your system. + +All of Netdata's documentation assumes that your config directory is at `/etc/netdata`, and that you're running any +scripts from inside that directory. + +## Netdata's configuration files + +Upon installation, the Netdata config directory contains a few files and directories. It's okay if you don't see all +these files in your own Netdata config directory, as the next section describes how to edit any that might not already +exist. + +- `netdata.conf` is the main configuration file. This is where you'll find most configuration options. Read descriptions + for each in the [daemon config](/daemon/config/README.md) doc. +- `edit-config` is a shell script used for [editing configuration files](#use-edit-config-to-edit-configuration-files). +- Various configuration files ending in `.conf` for [configuring plugins or + collectors](/docs/collect/enable-configure.md#enable-a-collector-or-its-orchestrator) behave. Examples: `go.d.conf`, + `python.d.conf`, and `ebpf.conf`. +- Various directories ending in `.d`, which contain other configuration files, each ending in `.conf`, for [configuring + specific collectors](/docs/collect/enable-configure.md#configure-a-collector). +- `apps_groups.conf` is a configuration file for changing how applications/processes are grouped when viewing the + **Application** charts from [`apps.plugin`](/collectors/apps.plugin/README.md) or + [`ebpf.plugin`](/collectors/ebpf.plugin/README.md). +- `health.d/` is a directory that contains [health configuration files](/docs/monitor/configure-alarms.md). +- `health_alarm_notify.conf` enables and configures [alarm notifications](/docs/monitor/enable-notifications.md). +- `statsd.d/` is a directory for configuring Netdata's [statsd collector](/collectors/statsd.plugin/README.md). +- `stream.conf` configures [parent-child streaming](/streaming/README.md) between separate nodes running the Agent. +- `.environment` is a hidden file that describes the environment in which the Netdata Agent is installed, including the + `PATH` and any installation options. Useful for [reinstalling](/packaging/installer/REINSTALL.md) or + [uninstalling](/packaging/installer/UNINSTALL.md) the Agent. + +The Netdata config directory also contains one symlink: + +- `orig` is a symbolic link to the directory `/usr/lib/netdata/conf.d`, which contains stock configuration files. Stock + versions are copied into the config directory when opened with `edit-config`. _Do not edit the files in + `/usr/lib/netdata/conf.d`, as they are overwritten by updates to the Netdata Agent._ + +## Use `edit-config` to edit configuration files + +The **recommended way to easily and safely edit Netdata's configuration** is with the `edit-config` script. This script +opens existing Netdata configuration files using your system's `$EDITOR`. If the file doesn't yet exist in your config +directory, the script copies the stock version from `/usr/lib/netdata/conf.d` and opens it for editing. + +Run `edit-config` without any options to see details on its usage and a list of all the configuration files you can +edit. + +```bash +./edit-config +USAGE: + ./edit-config FILENAME + + Copy and edit the stock config file named: FILENAME + if FILENAME is already copied, it will be edited as-is. + + The EDITOR shell variable is used to define the editor to be used. + + Stock config files at: '/usr/lib/netdata/conf.d' + User config files at: '/etc/netdata' + + Available files in '/usr/lib/netdata/conf.d' to copy and edit: + +./apps_groups.conf ./health.d/phpfpm.conf +./aws_kinesis.conf ./health.d/pihole.conf +./charts.d/ap.conf ./health.d/portcheck.conf +./charts.d/apcupsd.conf ./health.d/postgres.conf +... +``` + +To edit `netdata.conf`, run `./edit-config netdata.conf`. You may need to elevate your privileges with `sudo` or another +method for `edit-config` to write into the config directory. Use your `$EDITOR`, make your changes, and save the file. + +> `edit-config` uses the `EDITOR` environment variable on your system to edit the file. On many systems, that is +> defaulted to `vim` or `nano`. Use `export EDITOR=` to change this temporarily, or edit your shell configuration file +> to change to permanently. + +After you make your changes, you need to [restart the Agent](/docs/configure/start-stop-restart.md) with `sudo systemctl +restart netdata` or the appropriate method for your system. + +Here's an example of editing the node's hostname, which appears in both the local dashboard and in Netdata Cloud. + + + +### Other configuration files + +You can edit any Netdata configuration file using `edit-config`. A few examples: + +```bash +./edit-config apps_groups.conf +./edit-config ebpf.conf +./edit-config health.d/load.conf +./edit-config go.d/prometheus.conf +``` + +The documentation for each of Netdata's components explains which file(s) to edit to achieve the desired behavior. + +## See an Agent's running configuration + +On start, the Netdata Agent daemon attempts to load `netdata.conf`. If that file is missing, incomplete, or contains +invalid settings, the daemon attempts to run sane defaults instead. In other words, the state of `netdata.conf` on your +filesystem may be different from the state of the Netdata Agent itself. + +To see the _running configuration_, navigate to `http://NODE:19999/netdata.conf` in your browser, replacing `NODE` with +the IP address or hostname of your node. The file displayed here is exactly the settings running live in the Netdata +Agent. + +If you're having issues with configuring the Agent, apply the running configuration to `netdata.conf` by downloading the +file to the Netdata config directory. Use `sudo` to elevate privileges. + +```bash +wget -O /etc/netdata/netdata.conf http://localhost:19999/netdata.conf +# or +curl -o /etc/netdata/netdata.conf http://NODE:19999/netdata.conf +``` + +## What's next? + +Learn more about [starting, stopping, or restarting](/docs/configure/start-stop-restart.md) the Netdata daemon to apply +configuration changes. + +Apply some [common configuration changes](/docs/configure/common-changes.md) to quickly tweak the Agent's behavior. + +[Add security to your node](/docs/configure/secure-nodes.md) with what you've learned about the Netdata config directory +and `edit-config`. We put together a few security best practices based on how you use the Netdata. + +You can also take what you've learned about node configuration to enable or enhance features: + +- [Enable new collectors](/docs/collect/enable-configure.md) or tweak their behavior. +- [Configure existing health alarms](/docs/monitor/configure-alarms.md) or create new ones. +- [Enable notifications](/docs/monitor/enable-notifications.md) to receive updates about the health of your + infrastructure. +- Change [the long-term metrics retention period](/docs/store/change-metrics-storage.md) using the database engine. + +### Related reference documentation + +- [Netdata Agent · Daemon](/health/README.md) +- [Netdata Agent · Health monitoring](/health/README.md) +- [Netdata Agent · Notifications](/health/notifications/README.md) + +[](<>) diff --git a/docs/configure/secure-nodes.md b/docs/configure/secure-nodes.md new file mode 100644 index 000000000..704db35a3 --- /dev/null +++ b/docs/configure/secure-nodes.md @@ -0,0 +1,123 @@ +<!-- +title: "Secure your nodes" +description: "Your data and systems are safe with Netdata, but we recommend a few easy ways to improve the security of your infrastructure." +custom_edit_url: https://github.com/netdata/netdata/edit/master/docs/configure/secure-nodes.md +--> + +# Secure your nodes + +Upon installation, the Netdata Agent serves the **local dashboard** at port `19999`. If the node is accessible to the +internet at large, anyone can access the dashboard and your node's metrics at `http://NODE:19999`. We made this decision +so that the local dashboard was immediately accessible to users, and so that we don't dictate how professionals set up +and secure their infrastructures. + +Despite this design decision, your [data](/docs/netdata-security.md#your-data-are-safe-with-netdata) and your +[systems](/docs/netdata-security.md#your-systems-are-safe-with-netdata) are safe with Netdata. Netdata is read-only, +cannot do anything other than present metrics, and runs without special/`sudo` privileges. Also, the local dashboard +only exposes chart metadata and metric values, not raw data. + +While Netdata is secure by design, we believe you should [protect your +nodes](/docs/netdata-security.md#why-netdata-should-be-protected). If left accessible to the internet at large, the +local dashboard could reveal sensitive information about your infrastructure. For example, an attacker can view which +applications you run (databases, webservers, and so on), or see every user account on a node. + +Instead of dictating how to secure your infrastructure, we give you many options to establish security best practices +that align with your goals and your organization's standards. + +- [Disable the local dashboard](#disable-the-local-dashboard): **Simplest and recommended method** for those who have + added nodes to Netdata Cloud and view dashboards and metrics there. +- [Restrict access to the local dashboard](#restrict-access-to-the-local-dashboard): Allow local dashboard access from + only certain IP addresses, such as a trusted static IP or connections from behind a management LAN. Full support for + Netdata Cloud. +- [Use a reverse proxy](#use-a-reverse-proxy): Password-protect a local dashboard and enable TLS to secure it. Full + support for Netdata Cloud. + +## Disable the local dashboard + +This is the _recommended method for those who have claimed their nodes to Netdata Cloud_ and prefer viewing real-time +metrics using the War Room Overview, Nodes view, and Cloud dashboards. + +You can disable the local dashboard (and API) but retain the encrypted Agent-Cloud link ([ACLK](/aclk/README.md)) that +allows you to stream metrics on demand from your nodes via the Netdata Cloud interface. This change mitigates all +concerns about revealing metrics and system design to the internet at large, while keeping all the functionality you +need to view metrics and troubleshoot issues with Netdata Cloud. + +Open `netdata.conf` with `./edit-config netdata.conf`. Scroll down to the `[web]` section, and find the `mode = +static-threaded` setting, and change it to `none`. + +```conf +[web] + mode = none +``` + +Save and close the editor, then [restart your Agent](/docs/configure/start-stop-restart.md) using `sudo systemctl +restart netdata`. If you try to visit the local dashboard to `http://NODE:19999` again, the connection will fail because +that node no longer serves its local dashboard. + +> See the [configuration basics doc](/docs/configure/nodes.md) for details on how to find `netdata.conf` and use +> `edit-config`. + +## Restrict access to the local dashboard + +If you want to keep using the local dashboard, but don't want it exposed to the internet, you can restrict access with +[access lists](/web/server/README.md#access-lists). This method also fully retains the ability to stream metrics +on-demand through Netdata Cloud. + +The `allow connections from` setting helps you allow only certain IP addresses or FQDN/hostnames, such as a trusted +static IP, only `localhost`, or connections from behind a management LAN. + +By default, this setting is `localhost *`. This setting allows connections from `localhost` in addition to _all_ +connections, using the `*` wildcard. You can change this setting using Netdata's [simple +patterns](/libnetdata/simple_pattern/README.md). + +```conf +[web] + # Allow only localhost connections + allow connections from = localhost + + # Allow only from management LAN running on `10.X.X.X` + allow connections from = 10.* + + # Allow connections only from a specific FQDN/hostname + allow connections from = example* +``` + +The `allow connections from` setting is global and restricts access to the dashboard, badges, streaming, API, and +`netdata.conf`, but you can also set each of those access lists more granularly if you choose: + +```conf +[web] + allow connections from = localhost * + allow dashboard from = localhost * + allow badges from = * + allow streaming from = * + allow netdata.conf from = localhost fd* 10.* 192.168.* 172.16.* 172.17.* 172.18.* 172.19.* 172.20.* 172.21.* 172.22.* 172.23.* 172.24.* 172.25.* 172.26.* 172.27.* 172.28.* 172.29.* 172.30.* 172.31.* + allow management from = localhost +``` + +See the [web server](/web/server/README.md#access-lists) docs for additional details about access lists. You can take +access lists one step further by [enabling SSL](/web/server/README.md#enabling-tls-support) to encrypt data from local +dashboard in transit. The connection to Netdata Cloud is always secured with TLS. + +## Use a reverse proxy + +You can also put Netdata behind a reverse proxy for additional security while retaining the functionality of both the +local dashboard and Netdata Cloud dashboards. You can use a reverse proxy to password-protect the local dashboard and +enable HTTPS to encrypt metadata and metric values in transit. + +We recommend Nginx, as it's what we use for our [demo server](https://london.my-netdata.io/), and we have a guide +dedicated to [running Netdata behind Nginx](/docs/Running-behind-nginx.md). + +We also have guides for [Apache](/docs/Running-behind-apache.md), [Lighttpd](/docs/Running-behind-lighttpd.md), +[HAProxy](/docs/Running-behind-haproxy.md), and [Caddy](/docs/Running-behind-caddy.md). + +## What's next? + +Read about [Netdata's security design](/docs/netdata-security.md) and our [blog +post](https://www.netdata.cloud/blog/netdata-agent-dashboard/) about why the local Agent dashboard is both open and +secure by design. + +Next up, learn about [collectors](/docs/collect/how-collectors-work.md) to ensure you're gathering every essential +metric about your node, its applications, and your infrastructure at large. + +[](<>) diff --git a/docs/configure/start-stop-restart.md b/docs/configure/start-stop-restart.md new file mode 100644 index 000000000..4967fff08 --- /dev/null +++ b/docs/configure/start-stop-restart.md @@ -0,0 +1,98 @@ +<!-- +title: "Start, stop, or restart the Netdata Agent" +description: "Manage the Netdata Agent daemon, load configuration changes, and troubleshoot stuck processes on systemd and non-systemd nodes." +custom_edit_url: https://github.com/netdata/netdata/edit/master/docs/configure/start-stop-restart.md +--> + +# Start, stop, or restart the Netdata Agent + +When you install the Netdata Agent, the [daemon](/daemon/README.md) is configured to start at boot and stop and +restart/shutdown. + +You will most often need to _restart_ the Agent to load new or editing configuration files. [Health +configuration](#reload-health-configuration) files are the only exception, as they can be reloaded without restarting +the entire Agent. + +Stopping or restarting the Netdata Agent will cause gaps in stored metrics until the `netdata` process initiates +collectors and the database engine. + +## Using `systemctl`, `service`, or `init.d` + +This is the recommended way to start, stop, or restart the Netdata daemon. + +- To **start** Netdata, run `sudo systemctl start netdata`. +- To **stop** Netdata, run `sudo systemctl stop netdata`. +- To **restart** Netdata, run `sudo systemctl restart netdata`. + +If the above commands fail, or you know that you're using a non-systemd system, try using the `service` command: + +- **service**: `sudo service netdata start`, `sudo service netdata stop`, `sudo service netdata restart` + +## Using `netdata` + +Use the `netdata` command, typically located at `/usr/sbin/netdata`, to start the Netdata daemon. + +```bash +sudo netdata +``` + +If you start the daemon this way, close it with `sudo killall netdata`. + +## Using `netdatacli` + +The Netdata Agent also comes with a [CLI tool](/cli/README.md) capable of performing shutdowns. Start the Agent back up +using your preferred method listed above. + +```bash +sudo netdatacli shutdown-agent +``` + +## Reload health configuration + +You do not need to restart the Netdata Agent between changes to health configuration files, such as specific health +entities. Instead, use [`netdatacli`](#using-netdatacli) and the `reload-health` option to prevent gaps in metrics +collection. + +```bash +sudo netdatacli reload-health +``` + +If `netdatacli` doesn't work on your system, send a `SIGUSR2` signal to the daemon, which reloads health configuration +without restarting the entire process. + +```bash +killall -USR2 netdata +``` + +## Force stop stalled or unresponsive `netdata` processes + +In rare cases, the Netdata Agent may stall or not properly close sockets, preventing a new process from starting. In +these cases, try the following three commands: + +```bash +sudo systemctl stop netdata +sudo killall netdata +ps aux| grep netdata +``` + +The output of `ps aux` should show no `netdata` or associated processes running. You can now start the Netdata Agent +again with `service netdata start`, or the appropriate method for your system. + +## What's next? + +Learn more about [securing the Netdata Agent](/docs/configure/secure-nodes.md). + +You can also use the restart/reload methods described above to enable new features: + +- [Enable new collectors](/docs/collect/enable-configure.md) or tweak their behavior. +- [Configure existing health alarms](/docs/monitor/configure-alarms.md) or create new ones. +- [Enable notifications](/docs/monitor/enable-notifications.md) to receive updates about the health of your + infrastructure. +- Change [the long-term metrics retention period](/docs/store/change-metrics-storage.md) using the database engine. + +### Related reference documentation + +- [Netdata Agent · Daemon](/daemon/README.md) +- [Netdata Agent · Netdata CLI](/cli/README.md) + +[](<>) diff --git a/docs/contributing/contributing-documentation.md b/docs/contributing/contributing-documentation.md index ebdffdbf6..44be92299 100644 --- a/docs/contributing/contributing-documentation.md +++ b/docs/contributing/contributing-documentation.md @@ -1,192 +1,109 @@ -# Contributing to documentation - -We welcome contributions to Netdata's already extensive documentation, -which we host at [docs.netdata.cloud](https://docs.netdata.cloud/) -and store inside of the [main repository](https://github.com/netdata/netdata) on GitHub. - -Like all contributing to all other aspects of Netdata, we ask that anyone who wants to help with documentation -read and abide by the [Contributor Convenant Code of Conduct](https://docs.netdata.cloud/code_of_conduct/) -and follow the instructions outlined in our [Contributing document](../../CONTRIBUTING.md). - -We also ask you to read our [documentation style guide](style-guide.md), which, while not complete, -will give you some guidance on how we write and organize our documentation. - -All our documentation uses the Markdown syntax. If you're not familiar with how it works, -please read the [Markdown introduction post](https://daringfireball.net/projects/markdown/) by its creator, -followed by [Mastering Markdown](https://guides.github.com/features/mastering-markdown/) guide from GitHub. +<!-- +title: "Contributing to documentation" +description: "Want to contribute to Netdata's documentation? This guide will set you up with the tools to help others learn about health and performance monitoring." +custom_edit_url: https://github.com/netdata/netdata/edit/master/docs/contributing/contributing-documentation.md +--> -## How contributing to the documentation works - -There are two ways to contribute to Netdata's documentation: +# Contributing to documentation -1. Edit documentation [directly in GitHub](#edit-documentation-directly-on-github). -2. Download the repository and [edit documentation locally](#edit-documentation-locally). +We welcome contributions to Netdata's already extensive documentation. -Editing in GitHub is a simpler process and is perfect for quick edits to a single document, -such as fixing a typo or clarifying a confusing sentence. +We store documentation related to the open-source Netdata Agent inside of the [`netdata/netdata` +repository](https://github.com/netdata/netdata) on GitHub. Documentation related to Netdata Cloud is stored in a private +repository and is not currently open to community contributions. -Editing locally is more complex, as you need to download the Netdata repository -and build the documentation using `mkdocs`, but allows you to better organize complex projects. -By building documentation locally, you can preview your work using a local web server before you submit your PR. +The Netdata team aggregates and publishes all documentation at [learn.netdata.cloud](https://learn.netdata.cloud/) using +[Docusaurus](https://v2.docusaurus.io/) in a private GitHub repository. -In both cases, you'll finish by submitting a pull request (PR). -Once you submit your PR, GitHub will initiate a number of jobs, including a Netlify preview. -You can use this preview to view the documentation site with your changes applied, -which might help you catch any lingering issues. +## Before you get started -To continue, follow one of the paths below: +Anyone interested in contributing to documentation should first read the [Netdata style +guide](/docs/contributing/style-guide.md) and the [Netdata Community Code of Conduct](/CODE_OF_CONDUCT.md). -- [Edit documentation directly in GitHub](#edit-documentation-directly-on-github) -- [Edit documentation locally](#edit-documentation-locally) +Netdata's documentation uses Markdown syntax. If you're not familiar with Markdown, read the [Mastering +Markdown](https://guides.github.com/features/mastering-markdown/) guide from GitHub for the basics on creating +paragraphs, styled text, lists, tables, and more. -## Edit documentation directly on GitHub +### Netdata's documentation structure -Start editing documentation on GitHub by clicking the small pencil icon on any page on Netdata's [documentation site](https://docs.netdata.cloud/). -You can find them at the top of every page. +Netdata's documentation is separated into four sections. -Clicking on this icon will take you to the associated page in the `netdata/netdata` repository. -Then click the small pencil icon on any documentation file (those ending in the `.md` Markdown extension) in the `netdata/netdata` repository. +- **Netdata**: Documents based on the actions users want to take, and solutions to their problems, such both the Netdata + Agent and Netdata Cloud. + - Stored in various subfolders of the [`/docs` folder](https://github.com/netdata/netdata/tree/master/docs) within the + `netdata/netdata` repository: `/docs/collect`, `/docs/configure`, `/docs/export`, `/docs/get`, `/docs/monitor`, + `/docs/overview`, `/docs/quickstart`, `/docs/store`, and `/docs/visualize`. + - Published at [`https://learn.netdata.cloud/docs`](https://learn.netdata.cloud/docs). +- **Netdata Agent reference**: Reference documentation for the open-source Netdata Agent. + - Stored in various `.md` files within the `netdata/netdata` repository alongside the code responsible for that + feature. For example, the database engine's reference documentation is at `/database/engine/README.md`. + - Published at [`https://learn.netdata.cloud/docs/agent`](https://learn.netdata.cloud/docs/agent). +- **Netdata Cloud reference**: Reference documentation for the closed-source Netdata Cloud web application. + - Stored in a private GitHub repository and not editable by the community. + - Published at [`https://learn.netdata.cloud/docs/cloud`](https://learn.netdata.cloud/docs/cloud). +- **Guides**: Solutions-based articles for users who want instructions on completing a specific complex task using the + Netdata Agent and/or Netdata Cloud. + - Stored in the [`/docs/guides` folder](https://github.com/netdata/netdata/tree/master/docs/guides) within the + `netdata/netdata` repository. Organized into subfolders that roughly correlate with the core Netdata documentation. + - Published at [`https://learn.netdata.cloud/guides`](https://learn.netdata.cloud/guides). - +Generally speaking, if you want to contribute to the reference documentation for a specific Netdata Agent feature, find +the appropriate `.md` file co-located with that feature. If you want to contribute documentation that spans features or +products, or has no direct correlation with the existing directory structure, place it in the `/docs` folder within +`netdata/netdata`. -If you know where a file resides in the Netdata repository already, -you can skip the step of beginning on the documentation site and go directly to GitHub. +## How to contribute -Once you've clicked the pencil icon on GitHub, you'll see a full Markdown version of the file. -Make changes as you see fit. -You can use the `Preview changes` button to ensure your Markdown syntax is working properly. +The easiest way to contribute to Netdata's documentation is to edit a file directly on GitHub. This is perfect for small +fixes to a single document, such as fixing a typo or clarifying a confusing sentence. -Under the `Propose file change` header, write in a descriptive title for your requested change. -Beneath that, add a concise descrition of what you've changed and why you think it's important. Then, click the `Propose file change` button. +Click on the **Edit this page** button on any published document on [Netdata Learn](https://learn.netdata.cloud). Each +page has two of these buttons: One beneath the table of contents, and another at the end of the document, which take you +to GitHub's code editor. Make your suggested changes, keeping [Netdata style guide](/docs/contributing/style-guide.md) +in mind, and use *Preview changes** button to ensure your Markdown syntax works as expected. -After you've hit that button, -jump down to our instructions on [pull requests and cleanup](#pull-requests-and-final-steps) for your next steps. +Under the **Commit changes** header, write descriptive title for your requested change. Click the **Commit changes** +button to initiate your pull request (PR). -!!! note - This process will create a branch directly on the `netdata/netdata` repository, which then requires manual cleanup. - If you're going to make significant documentation contributions, or contribute often, - we recommend the local editing process just below. +Jump down to our instructions on [PRs](#making-a-pull-request) for your next steps. -## Edit documentation locally +### Edit locally -Editing documentation locally is the preferred method for complex changes, PRs that span across multiple documents, -or those that change the styling or underlying functionality of the documentation. +Editing documentation locally is the preferred method for complex changes that span multiple documents or change the +documentation's style or structure. -Here is the workflow for editing documentation locally. First, create a fork of the Netdata repository, -if you don't have one already. Visit the [Netdata repository](https://github.com/netdata/netdata) -and click on the `Fork` button in the upper-right corner of the window. +Create a fork of the Netdata Agent repository by visit the [Netdata repository](https://github.com/netdata/netdata) and +clicking on the **Fork** button. - + -GitHub will ask you where you want to clone the repository, -and once finished you'll end up at the index of your forked Netdata repository. -Clone your fork to your local machine: +GitHub will ask you where you want to clone the repository. When finished, you end up at the index of your forked +Netdata Agent repository. Clone your fork to your local machine: ```bash git clone https://github.com/YOUR-GITHUB-USERNAME/netdata.git ``` -You can now jump into the directory and explore Netdata's structure for yourself. - -### Understanding the structure of Netdata's documentation - -All of Netdata's documentation is stored within the repository itself, as close as possible to the code it -corresponds to. Many sub-folders contain a `README.md` file, -which is then used to populate the documentation about that feature/component of Netdata. - -For example, the file at `packaging/installer/README.md` becomes `https://docs.netdata.cloud/packaging/installer/` -and is our installation documentation. By co-locating it with quick-start installtion code, -we ensure documentation is always tightly knit with the functions it describes. - -You might find other `.md` files within these directories. The `packaging/installer/` folder also contains `UPDATE.md` -and `UNINSTALL.md`, which become `https://docs.netdata.cloud/packaging/installer/update/` -and `https://docs.netdata.cloud/packaging/installer/uninstall/`, respectively. - -If the documentation you're working on has a direct correlation to some component of Netdata, place it into the correct -folder and either name it `README.md` for generic documentation, or with another name for very specific instructions. - -#### The `docs` folder - -At the root of the Netdata repository is a `docs/` folder. Inside this folder we place documentation that does not have -a direct relationship to a specific component of Netdata. It's where we house our [getting started -guide](../../docs/getting-started.md), guides on [running Netdata behind Nginx](../../docs/Running-behind-nginx.md), and -more. - -If the documentation you're working on doesn't have a direct relaionship to a component of Netdata, -it can be placed in this `docs/` folder. - -### Make your edits - -Now that you're set up and understand where to find or create your `.md` file, you can now begin to make your edits. -Just use your favorite editor and keep in mind our [style guide](style-guide.md) as you work. - -If you add a new file to the documentation, you may need to modify the `buildyaml.sh` file to ensure -it's added to the site's navigation. This is true for any file added to the `docs/` folder. - -Be sure to periodically add/commit your edits so that you don't lose your work! -We use version control software for a reason. - -### Build the documentation - -Building the documentation periodically gives you a glimpse into the final product, and is generally required -if you're making changes to the table of contents. - -!!! attention "" - We have only tested the build process on Linux. Initial tests on OS X have been unsuccessful. - Windows is fully untested at this point, but we would love to know if it works there as well! - -To build the documentation, you need `python`/`pip`, `mkdocs`, and `mkdocs-material` installed on your machine. - -Follow the [Python installation instructions](https://www.python.org/downloads/) for your machine. - -Use `pip`, which was installed alongside Python, to install `mkdocs` and `mkdocs-material`. -Your operating system might force you to use `pip2` or `pip3` instead, -dependin on which version of Python you have installed. - -```bash -pip install mkdocs mkdocs-material -``` - -??? note "Troubleshooting" - If you're having trouble with the installation of Python, `mkdocs`, or `mkdocs-material`, try looking into the `mkdocs` [installation instructions](https://squidfunk.github.io/mkdocs-material/getting-started/#installation). - -When `pip` is finished installing, navigate to the root directory of the Netdata repository -and run the documentation generator script. - -```bash -sh docs/generator/buildhtml.sh -``` - -This process will take some time. Once finished, the built documentation site will be located at `docs/generator/build/`. - -### Run a local web server to test documentation - -The best way to view the documentation site you just built is to run a simple web server from the `docs/generator/build/` directory. -So, navigate there and run a Python-based web server: - -```sh -cd docs/generator/build/ -python3 -m http.server 20000 -``` - -Feel free to replace the port number you want this web server to listen on (port `20000` in this case (only one higher -than the agent!)). - -Open your web browser and navigate to `http://localhost:20000`. -If you replaced the port earlier, change it here as well. -You can now navigate through the documentation as you would on the live site! +Create a new branch using `git checkout -b BRANCH-NAME`. Use your favorite text editor to make your changes, keeping the +[Netdata style guide](/docs/contributing/style-guide.md) in mind. Add, commit, and push changes to your fork. When +you're finished, visit the [Netdata Agent Pull requests](https://github.com/netdata/netdata/pulls) to create a new pull +request based on the changes you made in the new branch of your fork. -## Pull requests and final steps +## Making a pull request -When you're finished with your changes, add and commit them to your fork of the Netdata repository. -Head over to GitHub to create your pull request (PR). +Pull requests (PRs) should be concise and informative. See our [PR guidelines](/CONTRIBUTING.md#pr-guidelines) for +specifics. -Once we receive your pull request (PR), we'll take time to read through it and assess it for correctness, conciseness, -and overall quality. -We may point to specific sections and ask for additional information or other fixes. +- The title must follow the [imperative mood](https://en.wikipedia.org/wiki/Imperative_mood) and be no more than ~50 + characters. +- The description should explain what was changed and why. Verify that you tested any code or processes that you are + trying to change. -## What's next +The Netdata team will review your PR and assesses it for correctness, conciseness, and overall quality. We may point to +specific sections and ask for additional information or other fixes. -- Read up on the Netdata documentation [style guide](style-guide.md). +After merging your PR, the Netdata team rebuilds the [documentation site](https://learn.netdata.cloud) to publish the +changed documentation. [](<>) diff --git a/docs/contributing/style-guide.md b/docs/contributing/style-guide.md index 5ccd250ee..faa6fc62b 100644 --- a/docs/contributing/style-guide.md +++ b/docs/contributing/style-guide.md @@ -1,271 +1,444 @@ +<!-- +title: "Netdata style guide" +description: "The Netdata style guide establishes editorial guidelines for all of Netdata's writing, including documentation, blog posts, in-product UX copy, and more." +custom_edit_url: https://github.com/netdata/netdata/edit/master/docs/contributing/style-guide.md +--> + # Netdata style guide -This in-progress style guide establishes editorial guidelines for anyone who wants to write documentation for Netdata products. +The _Netdata style guide_ establishes editorial guidelines for any writing produced by the Netdata team or the Netdata +community, including documentation, articles, in-product UX copy, and more. Both internal Netdata teams and external +contributors to any of Netdata's open-source projects should reference and adhere to this style guide as much as +possible. -## Table of contents +Netdata's writing should **empower** and **educate**. You want to help people understand Netdata's value, encourage them +to learn more, and ultimately use Netdata's products to democratize monitoring in their organizations. To achieve these +goals, your writing should be: -- [Welcome!](#welcome) -- [Goals of the Netdata style guide](#goals-of-the-Netdata-style-guide) -- [General principles](#general-principles) -- [Tone and content](#tone-and-content) -- [Language and grammar](#language-and-grammar) -- [Markdown syntax](#markdown-syntax) -- [Accessibility](#accessibility) +- **Clear**. Use simple words and sentences. Use strong, direct, and active language that encourages readers to action. +- **Concise**. Provide solutions and answers as quickly as possible. Give users the information they need right now, + along with opportunities to learn more. +- **Universal**. Think of yourself as a guide giving a tour of Netdata's products, features, and capabilities to a + diverse group of users. Write to reach the widest possible audience. -## Welcome +You can achieve these goals by reading and adhering to the principles outlined below. -Proper documentation is essential to the success of any open-source project. Netdata is no different. The health of our monitoring agent, and the community it's created, depends on this effort. +## Voice and tone -We’re here to make developers, sysadmins, and DevOps engineers better at their jobs, after all! +One way we write empowering, educational content is by using a consistent voice and an appropriate tone. -We welcome contributions to Netdata's documentation. Begin with the [contributing to documentation guide](contributing-documentation.md), followed by this style guide. +_Voice_ is like your personality, which doesn't really change day to day. -## Goals of the Netdata style guide +_Tone_ is how you express your personality. Your expression changes based on your attitude or mood, or based on who +you're around. In writing, your reflect tone in your word choice, punctuation, sentence structure, or even the use of +emoji. -An editorial style guide establishes standards for writing and maintaining documentation. At Netdata, we focus on the following principles: +The same idea about voice and tone applies to organizations, too. Our voice shouldn't change much between two pieces of +content, no matter who wrote each, but the tone might be quite different based on who we think is reading. -- Consistency -- High-quality writing -- Conciseness -- Accessibility +For example, a [blog post](https://www.netdata.cloud/blog/) and a [press release](https://www.netdata.cloud/news/) +should have a similar voice, despite most often being written by different people. However, blog posts are relaxed and +witty, while press releases are focused and academic. You won't see any emoji in a press release. -These principles will make documentation better for everyone who wants to use Netdata, whether they're a beginner or an expert. +### Voice -### Breaking the rules +Netdata's voice is authentic, passionate, playful, and respectful. -None of the rules described in this style guide are absolute. **We welcome rule-breaking if it creates better, more accessible documentation.** +- **Authentic** writing is honest and fact-driven. Focus on Netdata's strength while accurately communicating what + Netdata can and cannot do, and emphasize technical accuracy over hard sells and marketing jargon. +- **Passionate** writing is strong and direct. Be a champion for the product or feature you're writing about, and let + your unique personality and writing style shine. +- **Playful** writing is friendly, thoughtful, and engaging. Don't take yourself too seriously, as long as it's not at + the expense of Netdata or any of its users. +- **Respectful** writing treats people the way you want to be treated. Prioritize giving solutions and answers as + quickly as possible. -But be aware that Netdata staff or community members may ask you to justify your rule-breaking during the PR review process. +### Tone -## General principles +Netdata's tone is fun and playful, but clarity and conciseness comes first. We also tend to be informal, and aren't +afraid of a playful joke or two. -Yes, this style guide is pretty overwhelming! Establishing standards for a global community is never easy. +While we have general standards for voice and tone, we do want every individual's unique writing style to reflect in +published content. -Here's a few key points to start with. Where relevant, they link to more in-depth information about a given rule. +## Universal communication -**[Tone and content](#tone-and-content)**: +Netdata is a global company in every sense, with employees, contributors, and users from around the world. We strive to +communicate in a way that is clear and easily understood by everyone. -- Be [conversational and friendly](#conversational-and-friendly-tone). -- Write [concisely](#write-concisely). -- Don't use words like **here** when [creating hyperlinks](#use-informational-hyperlinks). -- Don't mention [future releases or features](#mentioning-future-releases-or-features) in documentation. +Here are some guidelines, pointers, and questions to be aware of as you write to ensure your writing is universal. Some +of these are expanded into individual sections in the [language, grammar, and +mechanics](#language-grammar-and-mechanics) section below. -**[Language and grammar](#language-and-grammar)**: +- Would this language make sense to someone who doesn't work here? +- Could someone quickly scan this document and understand the material? +- Create an information hierarchy with key information presented first and clearly called out to improve scannability. +- Avoid directional language like "sidebar on the right of the page" or "header at the top of the page" since + presentation elements may adapt for devices. +- Use descriptive links rather than "click here" or "learn more". +- Include alt text for images and image links. +- Ensure any information contained within a graphic element is also available as plain text. +- Avoid idioms that may not be familiar to the user or that may not make sense when translated. +- Avoid local, cultural, or historical references that may be unfamiliar to users. +- Prioritize active, direct language. +- Avoid referring to someone's age unless it is directly relevant; likewise, avoid referring to people with age-related + descriptors like "young" or "elderly." +- Avoid disability-related idioms like "lame" or "falling on deaf ears." Don't refer to a person's disability unless + it’s directly relevant to what you're writing. +- Don't call groups of people "guys." Don't call women "girls." +- Avoid gendered terms in favor of neutral alternatives, like "server" instead of "waitress" and "businessperson" + instead of "businessman." +- When writing about a person, use their communicated pronouns. When in doubt, just ask or use their name. It's OK to + use "they" as a singular pronoun. -- [Capitalize words](#capitalization) at the beginning of sentences, for proper nouns, and at the beginning of document titles and section headers. -- Use [second person](#second-person)—"you" rather than "we"—when giving instructions. -- Use [active voice](#active-voice) to make clear who or what is performing an action. -- Always employ an [Oxford comma](#oxford-comma) on lists. +> Some of these guidelines were adapted from MailChimp under the Creative Commons license. -**[Markdown syntax](#markdown-syntax)**: +## Language, grammar, and mechanics -- [Reference UI elements](#references-to-ui-elements) with bold text. -- Use our [built-in syntax highlighter](#language-specific-syntax-highlighting-in-code-blocks) to improve the readability and usefulness of code blocks. +To ensure Netdata's writing is clear, concise, and universal, we have established standards for language, grammar, and +certain writing mechanics. However, if you're writing about Netdata for an external publication, such as a guest blog +post, follow that publication's style guide or standards, while keeping the [preferred spelling of Netdata +terms](#netdata-specific-terms) in mind. -**[Accessibility](#accessibility)**: +### Active voice -- Include [alt tags on images](#images). +Active voice is more concise and easier to understand compared to passive voice. When using active voice, the subject of +the sentence is action. In passive voice, the subject is acted upon. A famous example of passive voice is the phrase +"mistakes were made." ---- +| | | +|-----------------|---------------------------------------------------------------------------------------------| +| Not recommended | When an alarm is triggered by a metric, a notification is sent by Netdata. | +| **Recommended** | When a metric triggers an alarm, Netdata sends a notification to your preferred endpoint. | -## Tone and content +### Second person -Netdata's documentation should be conversational, concise, and informational, without feeling formal. This isn't a textbook. It's a repository of information that should (on occasion!) encourage and excite its readers. +Use the second person ("you") to give instructions or "talk" directly to users. -By following a few principles on tone and content we'll ensure more readers from every background and skill level will learn as much as possible about Netdata's capabilities. +In these situations, avoid "we," "I," "let's," and "us," particularly in documentation. The "you" pronoun can also be +implied, depending on your sentence structure. -### Conversational and friendly tone +One valid exception is when a member of the Netdata team or community wants to write about said team or community. -Netdata's documentation should be conversational and friendly. To borrow from Google's fantastic [developer style guide](https://developers.google.com/style/tone): +| | | +|--------------------------------|-------------------------------------------------------------------------------------------| +| Not recommended | To install Netdata, we should try the one-line installer... | +| **Recommended** | To install Netdata, you should try the one-line installer... | +| **Recommended**, implied "you" | To install Netdata, try the one-line installer... | -> Try to sound like a knowledgeable friend who understands what the developer wants to do. +### "Easy" or "simple" -Feel free to let some of your personality show! Documentation can be highly professional without being dry, formal, or overly instructive. +Using words that imply the complexity of a task or feature goes against our policy of [universal +communication](#universal-communication). If you claim that a task is easy and the reader struggles to complete it, you +may inadvertently discourage them. -### Write concisely +However, if you give users two options and want to relay that one option is genuinely less complex than another, be +specific about how and why. -You should always try to use as few words as possible to explain a particular feature, configuration, or process. Conciseness leads to more accurate and understandable writing. +For example, don't write, "Netdata's one-line installer is the easiest way to install Netdata." Instead, you might want +to say, "Netdata's one-line installer requires fewer steps than manually installing from source." -### Use informational hyperlinks +### Slang, metaphors, and jargon -Hyperlinks should clearly state its destination. Don't use words like "here" to describe where a link will take your reader. +A particular word, phrase, or metaphor you're familiar with might not translate well to the other cultures featured +among Netdata's global community. We recommended you avoid slang or colloquialisms in your writing. -``` -# Not recommended -To install Netdata, click [here](https://docs.netdata.cloud/packaging/installer/). +In addition, don't use abbreviations that have not yet been defined in the content. See our section on +[abbreviations](#abbreviations-acronyms-and-initialisms) for additional guidance. -# Recommended -To install Netdata, read our [installation instructions](https://docs.netdata.cloud/packaging/installer/). -``` +If you must use industry jargon, such as "mean time to resolution," define the term as clearly and concisely as you can. -In general, guides should include fewer hyperlinks to keep the reader focused on the task at hand. Documentation should include as many hyperlinks as necessary to provide meaningful context. +> Netdata helps you reduce your organization's mean time to resolution (MTTR), which is the average time the responsible +> team requires to repair a system and resolve an ongoing incident. -### Avoid words like "easy" or "simple" +### Spelling -Never assume readers of Netdata documentation are experts in Netdata's inner workings or health monitoring/performance troubleshooting in general. +While the Netdata team is mostly _not_ American, we still aspire to use American spelling whenever possible, as it is +the standard for the monitoring industry. -If you claim that a task is easy and the reader struggles to complete it, they'll get discouraged. +See the [word list](#word-list) for spellings of specific words. -If you perceive one option to be easier than another, be specific about how and why. For example, don't write, "Netdata's one-line installer is the easiest way to install Netdata." Instead, you might want to say, "Netdata's one-line installer requires fewer steps than manually installing from source." +### Capitalization -### Avoid slang, metaphors, and jargon +Follow the general [English standards](https://owl.purdue.edu/owl/general_writing/mechanics/help_with_capitals.html) for +capitalization. In summary: -A particular word, phrase, or metaphor you're familiar with might not translate well to the other cultures featured among Netdata's global community. It's recommended you avoid slang or colloquialisms in your writing. +- Capitalize the first word of every new sentence. +- Don't use uppercase for emphasis. (Netdata is the BEST!) +- Capitalize the names of brands, software, products, and companies according to their official guidelines. (Netdata, + Docker, Apache, NGINX) +- Avoid camel case (NetData) or all caps (NETDATA). -If you must use industry jargon, such as "white-box monitoring," in a document, be sure to define the term as clearly and concisely as you can. +Whenever you refer to the company Netdata, Inc., or the open-source monitoring agent the company develops, capitalize +**Netdata**. -> White-box monitoring: Monitoring of a system or application based on the metrics it directly exposes, such as logs. +However, if you are referring to a process, user, or group on a Linux system, use lowercase and fence the word in an +inline code block: `` `netdata` ``. -Avoid emojis whenever possible for the same reasons—they can be difficult to understand immediately and don't translate well. +| | | +|-----------------|------------------------------------------------------------------------------------------------| +| Not recommended | The netdata agent, which spawns the netdata process, is actively maintained by netdata, inc. | +| **Recommended** | The Netdata Agent, which spawns the `netdata` process, is actively maintained by Netdata, Inc. | -### Mentioning future releases or features +#### Capitalization of document titles and page headings -Documentation is meant to describe the product as-is, not as it will be or could be in the future. Netdata documentation generally avoids talking about future features or products, even if we know they are inevitable. +Document titles and page headings should use sentence case. That means you should only capitalize the first word. -An exception can be made for documenting beta features that are subject to change with further development. +If you need to use the name of a brand, software, product, and company, capitalize it according to their official +guidelines. -## Language and grammar +Also, don't put a period (`.`) or colon (`:`) at the end of a title or header. -Netdata's documentation should be consistent in the way it uses certain words, phrases, and grammar. The following sections will outline the preferred usage for capitalization, point of view, active voice, and more. +| | | +|-----------------|-----------------------------------------------------------------------------------------------------| +| Not recommended | Getting Started Guide <br />Service Discovery and Auto-Detection: <br />Install netdata with docker | +| **Recommended** | Getting started guide <br />Service discovery and auto-detection <br />Install Netdata with Docker | -### Capitalization +### Abbreviations (acronyms and initialisms) -In text, follow the general [English standards](https://owl.purdue.edu/owl/general_writing/mechanics/help_with_capitals.html) for capitalization. In summary: +Use abbreviations (including [acronyms and initialisms](https://www.dictionary.com/e/acronym-vs-abbreviation/)) in +documentation when one exists, when it's widely accepted within the monitoring/sysadmin community, and when it improves +the readability of a document. -- Capitalize the first word of every new sentence. -- Don't use uppercase for emphasis. (Netdata is the BEST!) -- Capitalize the names of brands, software, products, and companies according to their official guidelines. (Netdata, Docker, Apache, Nginx) -- Avoid camel case (NetData) or all caps (NETDATA). +When introducing an abbreviation to a document for the first time, give the reader both the spelled-out version and the +shortened version at the same time. For example: -#### Capitalization of 'Netdata' and 'netdata' +> Use Netdata to monitor Extended Berkeley Packet Filter (eBPF) metrics in real-time. -Whenever you refer to the company Netdata, Inc., or the open-source monitoring agent the company develops, capitalize **Netdata**. +After you define an abbreviation, don't switch back and forth. Use only the abbreviation for the rest of the document. -However, if you are referring to a process, user, or group on a Linux system, you should not capitalize, as by default those are typically lowercased. In this case, you should also fence these terms in an inline code block: `` `netdata` ``. +You can also use abbreviations in a document's title to keep the title short and relevant. If you do this, you should +still introduce the spelled-out name alongside the abbreviation as soon as possible. -``` -# Not recommended -The netdata agent, which spawns the netdata process, is actively maintained by netdata, inc. +### Clause order -# Recommended -The Netdata agent, which spawns the `netdata` process, is actively maintained by Netdata, Inc. -``` +When instructing users to take action, give them the context first. By placing the context in an initial clause at the +beginning of the sentence, users can immediately know if they want to read more, follow a link, or skip ahead. -#### Capitalization of document titles and page headings +| | | +|-----------------|--------------------------------------------------------------------------------| +| Not recommended | Read the reference guide if you'd like to learn more about custom dashboards. | +| **Recommended** | If you'd like to learn more about custom dashboards, read the reference guide. | -Document titles and page headings should use sentence case. That means you should only capitalize the first word. +### Oxford comma -If you need to use the name of a brand, software, product, and company, capitalize it according to their official guidelines. +The Oxford comma is the comma used after the second-to-last item in a list of three or more items. It appears just +before "and" or "or." -Also, don't put a period (`.`) or colon (`:`) at the end of a title or header. +| | | +|-----------------|------------------------------------------------------------------------------| +| Not recommended | Netdata can monitor RAM, disk I/O, MySQL queries per second and lm-sensors. | +| **Recommended** | Netdata can monitor RAM, disk I/O, MySQL queries per second, and lm-sensors. | -**Document titles**: +### Future releases or features -| Capitalization | Not recommended | Recommended -| --- | --- | --- -| Document titles | Getting Started Guide | Getting started guide -| Page headings | Service Discovery and Auto-Detection: | Service discovery and auto-detection -| Proper nouns | Install netdata with docker | Install Netdata with Docker +Do not mention future releases or upcoming features in writing unless they have been previously communicated via a +public roadmap. -### Second person +In particular, documentation must describe, as accurately as possible, the Netdata Agent _as of the [latest +commit](https://github.com/netdata/netdata/commits/master) in the GitHub repository_. For Netdata Cloud, documentation +must reflect the _current state of [production](https://app.netdata.cloud). -When writing documentation, you should use the second person ("you") to give instructions. When using the second person, you give the impression that you're personally leading your reader through the steps or tips in question. +### Informational links -See how that works? It's a core part of making Netdata's documentation feel welcoming to all. +Every link should clearly state its destination. Don't use words like "here" to describe where a link will take your +reader. -Avoid using "we," "I," "let's," and "us" in documentation whenever possible. +| | | +|-----------------|-------------------------------------------------------------------------------------------| +| Not recommended | To install Netdata, click [here](/packaging/installer/README.md). | +| **Recommended** | To install Netdata, read the [installation instructions](/packaging/installer/README.md). | -The "you" pronoun can also be implied, depending on your sentence structure. +Use links as often as required to provide necessary context. Blog posts and guides require less hyperlinks than +documentation. See the section on [linking between documentation](#linking-between-documentation) for guidance on the +Markdown syntax and path structure of inter-documentation links. -``` -# Not recommended -To install Netdata, we should try the one-line installer... +### Contractions -# Recommended -To install Netdata, you should try the one-line installer... +Contractions like "you'll" or "they're" are acceptable in most Netdata writing. They're both authentic and playful, and +reinforce the idea that you, as a writer, are guiding users through a particular idea, process, or feature. -# Recommended, implied "you" -To install Netdata, try the one-line installer... -``` +Contractions are generally not used in press releases or other media engagements. -### Active voice +### Emoji -Use active voice instead of passive voice, because active voice is more concise and easier to understand. +Emoji can add fun and character to your writing, but should be used sparingly and only if it matches the content's tone +and desired audience. -When using voice, the subject of the sentence is performing the action. In passive voice, the subject is being acted upon. A famous example of passive voice is the phrase "mistakes were made." +## Technical/Linux standards -``` -# Not recommended (passive) -When an alarm is triggered by a metric, a notification is sent by Netdata... +Configuration or maintenance of the Netdata Agent requires some system administration skills, such as navigating +directories, editing files, or starting/stopping/restarting services. Certain processes + +### Switching Linux users + +Netdata documentation often suggests that users switch from their normal user to the `netdata` user to run specific +commands. Use the following command to instruct users to make the switch: -# Recommended (active) -When a metric triggers an alarm, Netdata sends a notification... +```bash +sudo su -s /bin/bash netdata ``` -### Standard American spelling +### Hostname/IP address of a node -While the Netdata team is mostly *not* American, we still aspire to use American spelling whenever possible, as it is more commonly used within the monitoring industry. +Use `NODE` instead of an actual or example IP address/hostname when referencing the process of navigating to a dashboard +or API endpoint in a browser. -### Clause order +| | | +|-----------------|-----------------------------------------------------------------------------------------------------------------------------------------------------------------------------| +| Not recommended | Navigate to `http://example.com:19999` in your browser to see Netdata's dashboard. <br />Navigate to `http://203.0.113.0:19999` in your browser to see Netdata's dashboard. | +| **Recommended** | Navigate to `http://NODE:19999` in your browser to see Netdata's dashboard. | -If you want to instruct your reader to take some action in a particular circumstance, such as optional steps, the beginning of the sentence should indicate that circumstance. +If you worry that `NODE` doesn't provide enough context for the user, particularly in documentation or guides designed +for beginners, you can provide an explanation: -``` -# Not recommended -Read the reference guide if you'd like to learn more about custom dashboards. +> With the Netdata Agent running, visit `http://NODE:19999/api/v1/info` in your browser, replacing `NODE` with the IP +> address or hostname of your Agent. -# Recommended -If you'd like to learn more about custom dashboards, read the reference guide. -``` +### Paths and running commands -By placing the circumstance at the beginning of the sentence, those who don't want to follow can stop reading and move on. Those who *do* want to read it are less likely to skip over the sentence. +When instructing users to run a Netdata-specific command, don't assume the path to said command, because not every +Netdata Agent installation will have commands under the same paths. When applicable, help them navigate to the correct +path, providing a recommendation or instructions on how to view the running configuration, which includes the correct +paths. -### Oxford comma +For example, the [configuration](/docs/configure/nodes.md) doc first teaches users how to find the Netdata config +directory and navigate to it, then runs commands from the `/etc/netdata` path so that the instructions are more +universal. -The Oxford comma is the comma used after the second-to-last item in a list of three or more items. It appears just before "and" or "or." +Don't include full paths, beginning from the system's root (`/`), as these might not work on certain systems. -``` -# Not recommended -Netdata can monitor RAM, disk I/O, MySQL queries per second and lm-sensors. +| | | +|-----------------|-----------------------------------------------------------------------------------------------------------------------------------------------------------------------------| +| Not recommended | Use `edit-config` to edit Netdata's configuration: `sudo /etc/netdata/edit-config netdata.conf`. | +| **Recommended** | Use `edit-config` to edit Netdata's configuration by first navigating to your [Netdata config directory](/docs/configure/nodes.md#the-netdata-config-directory), which is typically at `/etc/netdata`, then running `sudo edit-config netdata.conf`. | -# Recommended -Netdata can monitor RAM, disk I/O, MySQL queries per second, and lm-sensors. -``` +### `sudo` + +Include `sudo` before a command if you believe most Netdata users will need to elevate privileges to run it. This makes +our writing more universal, and users on `sudo`-less systems are generally already aware that they need to run commands +differently. + +For example, most users need to use `sudo` with the `edit-config` script, because the Netdata config directory is owned +by the `netdata` user. Same goes for restarting the Netdata Agent with `systemctl`. + +| | | +|-----------------|----------------------------------------------------------------------------------------------------------------------------------------------| +| Not recommended | Run `edit-config netdata.conf` to configure the Netdata Agent. <br />Run `systemctl restart netdata` to restart the Netdata Agent. | +| **Recommended** | Run `sudo edit-config netdata.conf` to configure the Netdata Agent. <br />Run `sudo systemctl restart netdata` to restart the Netdata Agent. | ## Markdown syntax -The Netdata documentation uses the Markdown syntax for styling and formatting. If you're not familiar with how it works, please read the [Markdown introduction post](https://daringfireball.net/projects/markdown/) by its creator, followed by [Mastering Markdown](https://guides.github.com/features/mastering-markdown/) guide from GitHub. +Netdata's documentation uses Markdown syntax. -We also leverage the power of the [Material theme for MkDocs](https://squidfunk.github.io/mkdocs-material/), which features several [extensions](https://squidfunk.github.io/mkdocs-material/extensions/admonition/), such as the ability to create notes, warnings, and collapsible blocks. +If you're not familiar with Markdown, read the [Mastering +Markdown](https://guides.github.com/features/mastering-markdown/) guide from GitHub for the basics on creating +paragraphs, styled text, lists, tables, and more. -You can follow the syntax specified in the above resources for the majority of documents, but the following sections specify a few particular use cases. +The following sections describe situations in which a specific syntax is required. -### References to UI elements +### Syntax standards (`remark-lint`) + +The Netdata team uses [`remark-lint`](https://github.com/remarkjs/remark-lint) for Markdown code styling. + +- Use a maximum of 120 characters per line. +- Begin headings with hashes, such as `# H1 heading`, `## H2 heading`, and so on. +- Use `_` for italics/emphasis. +- Use `**` for bold. +- Use dashes `-` to begin an unordered list, and put a single space after the dash. +- Tables should be padded so that pipes line up vertically with added whitespace. + +If you want to see all the settings, open the +[`remarkrc.js`](https://github.com/netdata/netdata/blob/master/.remarkrc.js) file in the `netdata/netdata` repository. + +### Frontmatter + +Every document must begin with frontmatter, followed by an H1 (`#`) heading. + +Unlike typical Markdown frontmatter, Netdata uses HTML comments (`<!--`, `-->`) to begin and end the frontmatter block. +These HTML comments are later converted into typical frontmatter syntax when building [Netdata +Learn](https://learn.netdata.cloud). + +Frontmatter _must_ contain the following variables: + +- A `title` that quickly and distinctly describes the document's content. +- A `description` that elaborates on the purpose or goal of the document using no less than 100 characters and no more + than 155 characters. +- A `custom_edit_url` that links directly to the GitHub URL where another user could suggest additional changes to the + published document. + +Some documents, like the Ansible guide and others in the `/docs/guides` folder, require an `image` variable as well. In +this case, replace `/docs` with `/img/seo`, and then rebuild the remainder of the path to the document in question. End +the path with `.png`. A member of the Netdata team will assist in creating the image when publishing the content. -If you need to instruct your reader to click a user interface (UI) element inside of a Netdata interface, you should reference the label text of the link/button with Markdown's (`**bold text**`) tag. +For example, here is the frontmatter for the guide about [deploying the Netdata Agent with +Ansible](https://learn.netdata.cloud/guides/deploy/ansible). ```markdown -Click on the **Sign in** button. +<!-- +title: Deploy Netdata with Ansible +description: "Deploy an infrastructure monitoring solution in minutes with the Netdata Agent and Ansible. Use and customize a simple playbook for monitoring as code." +image: /img/seo/guides/deploy/ansible.png +custom_edit_url: https://github.com/netdata/netdata/edit/master/docs/guides/deploy/ansible.md +--> + +# Deploy Netdata with Ansible + +... ``` -!!! note - Whenever possible, avoid using directional language to orient readers, because not every reader can use instructions like "look at the top-left corner" to find their way around an interface. +Questions about frontmatter in documentation? [Ask on our community +forum](https://community.netdata.cloud/c/blog-posts-and-articles/6). + +### Linking between documentation + +Documentation should link to relevant pages whenever it's relevant and provides valuable context to the reader. + +Links should always reference the full path to the document, beginning at the root of the Netdata Agent repository +(`/`), and ending with the `.md` file extension. Avoid relative links or traversing up directories using `../`. +For example, if you want to link to our node configuration document, link to `/docs/configure/nodes.md`. To reference +the guide for deploying the Netdata Agent with Ansible, link to `/docs/guides/deploy/ansible.md`. + +### References to UI elements + +When referencing a user interface (UI) element in Netdata, reference the label text of the link/button with Markdown's +(`**bold text**`) tag. + +```markdown +Click the **Sign in** button. ``` -If you feel that you must use directional language, perhaps use an [image](#images) (with proper alt text) instead. -We're also working to establish standards for how we refer to certain elements of the Netdata's web interface. We'll include that in this style guide as soon as it's complete. +Avoid directional language whenever possible. Not every user can use instructions like "look at the top-left corner" to +find their way around an interface, and interfaces often change between devices. If you must use directional language, +try to supplement the text with an [image](#images). + +### Images + +Don't rely on images to convey features, ideas, or instructions. Accompany every image with descriptive alt text. + +In Markdown, use the standard image syntax, `![]()`, and place the alt text between the brackets `[]`. Here's an example +using our logo: + +```markdown + ``` -### Language-specific syntax highlighting in code blocks +Reference in-product text, code samples, and terminal output with actual text content, not screen captures or other +images. Place the text in an appropriate element, such as a blockquote or code block, so all users can parse the +information. -Our documentation uses the [Highlight extension](https://facelessuser.github.io/pymdown-extensions/extensions/highlight/) for syntax highlighting. Highlight is fully compatible with [Pygments](http://pygments.org/), allowing you to highlight the syntax within code blocks in a number of interesting ways. +### Syntax highlighting -For a full list of languages, see [Pygment's supported languages](http://pygments.org/languages/). Netdata documentation will use the following for the most part: `c`, `python`, `js`, `shell`, `markdown`, `bash`, `css`, `html`, and `go`. If no language is specified, the Highlight extension doesn't apply syntax highlighting. +Our documentation site at [learn.netdata.cloud](https://learn.netdata.cloud) uses +[Prism](https://v2.docusaurus.io/docs/markdown-features#syntax-highlighting) for syntax highlighting. Netdata +documentation will use the following for the most part: `c`, `python`, `js`, `shell`, `markdown`, `bash`, `css`, `html`, +and `go`. If no language is specified, Prism tries to guess the language based on its content. -Include the language directly after the three backticks (```` ``` ````) that start the code block. For highlighting C code, for example: +Include the language directly after the three backticks (```` ``` ````) that start the code block. For highlighting C +code, for example: -```` +````c ```c inline char *health_stock_config_dir(void) { char buffer[FILENAME_MAX + 1]; @@ -285,35 +458,35 @@ inline char *health_stock_config_dir(void) { } ``` -You can also use the Highlight and [SuperFences](https://facelessuser.github.io/pymdown-extensions/extensions/superfences/) extensions together to show line numbers or highlight specific lines. +Prism also supports titles and line highlighting. See the [Docusaurus +documentation](https://v2.docusaurus.io/docs/markdown-features#code-blocks) for more information. -Display line numbers by appending `linenums="1"` after the language declaration, replacing `1` with the starting line number of your choice. Highlight lines by appending `hl_lines="2"`, replacing `2` with the line you'd like to highlight. Or, multiple lines: `hl_lines="1 2 4 12`. +## Word list -!!! note - Line numbers and highlights are not compatible with GitHub's Markdown parser, and thus will only be viewable on our [documentation site](https://docs.netdata.cloud/). They should be used sparingly and only when necessary. +The following tables describe the standard spelling, capitalization, and usage of words found in Netdata's writing. -## Accessibility +### Netdata-specific terms -Netdata's documentation should be as accessible as possible to as many people as possible. While the rules about [tone and content](#tone-and-content) and [language and grammar](#language-and-grammar) are helpful to an extent, we also need some additional rules to improve the reading experience for all readers. - -### Images - -Images are an important component to documentation, which is why we have a few rules around their usage. - -Perhaps most importantly, don't use only images to convey instructions. Each image should be accompanied by alt text and text-based instructions to ensure that every reader can access the information in the best way for them. - -#### Alt text - -Provide alt text for every image you include in Netdata's documentation. It should summarize the intent and content of the image. - -In Markdown, use the standard image syntax, `![]()`, and place the alt text between the brackets `[]`. Here's an example using our logo: - -``` - -``` +| Term | Definition | +|-----------------------------|-----------------------------------------------------------------------------------------------------------------------------------------------------------------------------------------------------------------------------------------------------------------------------------------------------------------------------------------------------------------------------------------------------------------------| +| **claimed node** | A node that you've proved ownership of by completing the [claiming process](/claim/README.md). The claimed node will then appear in your Space and any War Rooms you added it to. | +| **Netdata** | The company behind the open-source Netdata Agent and the Netdata Cloud web application. Never use _netdata_ or _NetData_. <br /><br />In general, focus on the user's goals, actions, and solutions rather than what the company provides. For example, write _Learn more about enabling alarm notifications on your preferred platforms_ instead of _Netdata sends alarm notifications to your preferred platforms_. | +| **Netdata Agent** | The free and open source [monitoring agent](https://github.com/netdata/netdata) that you can install on all of your distributed systems, whether they're physical, virtual, containerized, ephemeral, and more. The Agent monitors systems running Linux, Docker, Kubernetes, macOS, FreeBSD, and more, and collects metrics from hundreds of popular services and applications. | +| **Netdata Cloud** | The web application hosted at [https://app.netdata.cloud](https://app.netdata.cloud) that helps you monitor an entire infrastructure of distributed systems in real time. <br /><br />Never use _Cloud_ without the preceding _Netdata_ to avoid ambiguity. | +| **Netdata community** | Contributors to any of Netdata's [open-source projects](https://learn.netdata.cloud/contribute/projects), members of the [community forum](https://community.netdata.cloud/). | +| **Netdata community forum** | The Discourse-powered forum for feature requests, Netdata Cloud technical support, and conversations about Netdata's monitoring and troubleshooting products. | +| **node** | A system on which the Netdata Agent is installed. The system can be physical, virtual, in a Docker container, and more. Depending on your infrastructure, you may have one, dozens, or hundreds of nodes. Some nodes are _ephemeral_, in that they're created/destroyed automatically by an orchestrator service. | +| **Space** | The highest level container within Netdata Cloud for a user to organize their team members and nodes within their infrastructure. A Space likely represents an entire organization or a large team. <br /><br />_Space_ is always capitalized. | +| **unreachable node** | A claimed node with a disrupted [Agent-Cloud link](/aclk/README.md). Unreachable could mean the node no longer exists or is experiencing network connectivity issues with Cloud. | +| **visited node** | A node which has had its Agent dashboard directly visited by a user. A list of these is maintained on a per-user basis. | +| **War Room** | A smaller grouping of nodes where users can view key metrics in real-time and monitor the health of many nodes with their alarm status. War Rooms can be used to organize nodes in any way that makes sense for your infrastructure, such as by a service, purpose, physical location, and more. <br /><br />_War Room_ is always capitalized. | -#### Images of text +### Other technical terms -Don't use images of text, code samples, or terminal output. Instead, put that text content in a code block so that all devices can render it clearly and screen readers can parse it. +| Term | Definition | +|-----------------------------|-----------------------------------------------------------------------------------------------------------------------------------------------------------------------------------------------------------------------------| +| **filesystem** | Use instead of _file system_. | +| **preconfigured** | The concept that many of Netdata's features come with sane defaults that users don't need to configure to find [immediate value](/docs/overview/why-netdata.md#simple-to-deploy). | +| **real time**/**real-time** | Use _real time_ as a noun phrase, most often with _in_: _Netdata collects metrics in real time_. Use _real-time_ as an adjective: _Netdata collects real-time metrics from hundreds of supported applications and services. | [](<>) diff --git a/docs/export/enable-connector.md b/docs/export/enable-connector.md new file mode 100644 index 000000000..9789de2d8 --- /dev/null +++ b/docs/export/enable-connector.md @@ -0,0 +1,93 @@ +<!-- +title: "Enable an exporting connector" +description: "Learn how to enable and configure any connector using examples to start exporting metrics to external time-series databases in minutes." +custom_edit_url: https://github.com/netdata/netdata/edit/master/docs/export/enable-connector.md +--> + +# Enable an exporting connector + +Now that you found the right connector for your [external time-series +database](/docs/export/external-databases.md#supported-databases), you can now enable the exporting engine and the +connector itself. We'll walk through the process of enabling the exporting engine itself, followed by two examples using +the OpenTSDB and Graphite connectors. + +> When you enable the exporting engine and a connector, the Netdata Agent exports metrics _beginning from the time you +> restart its process_, not the entire [database of long-term metrics](/docs/store/change-metrics-storage.md). + +Once you understand the process of enabling a connector, you can translate that knowledge to any other connector. + +## Enable the exporting engine + +Use `edit-config` from your [Netdata config directory](/docs/configure/nodes.md#the-netdata-config-directory) to open +`exporting.conf`: + +```bash +sudo ./edit-config exporting.conf +``` + +Enable the exporting engine itself by setting `enabled` to `yes`: + +```conf +[exporting:global] + enabled = yes +``` + +Save the file but keep it open, as you will edit it again to enable specific connectors. + +## Example: Enable the OpenTSDB connector + +Use the following configuration as a starting point. Copy and paste it into `exporting.conf`. + +```conf +[opentsdb:http:my_opentsdb_http_instance] + enabled = yes + destination = localhost:4242 +``` + +Replace `my_opentsdb_http_instance` with an instance name of your choice, and change the `destination` setting to the IP +address or hostname of your OpenTSDB database. + +Restart your Agent with `sudo systemctl restart netdata` to begin exporting to your OpenTSDB database. The Netdata Agent +exports metrics _beginning from the time the process starts_, and because it exports as metrics are collected, you +should start seeing data in your external database after only a few seconds. + +Any further configuration is optional, based on your needs and the configuration of your OpenTSDB database. See the +[OpenTSDB connector doc](/exporting/opentsdb/README.md) and [exporting engine +reference](/exporting/README.md#configuration) for details. + +## Example: Enable the Graphite connector + +Use the following configuration as a starting point. Copy and paste it into `exporting.conf`. + +```conf +[graphite:my_graphite_instance] + enabled = yes + destination = 203.0.113.0:2003 +``` + +Replace `my_graphite_instance` with an instance name of your choice, and change the `destination` setting to the IP +address or hostname of your Graphite-supported database. + +Restart your Agent with `sudo systemctl restart netdata` to begin exporting to your Graphite-supported database. Because +the Agent exports metrics as they're collected, you should start seeing data in your external database after only a few +seconds. + +Any further configuration is optional, based on your needs and the configuration of your Graphite-supported database. +See [exporting engine reference](/exporting/README.md#configuration) for details. + +## What's next? + +If you want to further configure your exporting connectors, see the [exporting engine +reference](/exporting/README.md#configuration). + +For a comprehensive example of using the Graphite connector, read our guide: [_Export and visualize Netdata metrics in +Graphite_](/docs/guides/export/export-netdata-metrics-graphite.md). Or, start [using host +labels](/docs/guides/using-host-labels.md) on exported metrics. + +### Related reference documentation + +- [Exporting engine reference](/exporting/README.md) +- [OpenTSDB connector](/exporting/opentsdb/README.md) +- [Graphite connector](/exporting/graphite/README.md) + +[](<>) diff --git a/docs/export/external-databases.md b/docs/export/external-databases.md new file mode 100644 index 000000000..309b03a87 --- /dev/null +++ b/docs/export/external-databases.md @@ -0,0 +1,90 @@ +<!-- +title: "Export metrics to external time-series databases" +description: "Use the exporting engine to send Netdata metrics to popular external time series databases for long-term storage or further analysis." +custom_edit_url: https://github.com/netdata/netdata/edit/master/docs/export/external-databases.md +--> + +# Export metrics to external time-series databases + +Netdata allows you to export metrics to external time-series databases with the [exporting +engine](/exporting/README.md). This system uses a number of **connectors** to initiate connections to [more than +thirty](#supported-databases) supported databases, including InfluxDB, Prometheus, Graphite, ElasticSearch, and much +more. + +The exporting engine resamples Netdata's thousands of per-second metrics at a user-configurable interval, and can export +metrics to multiple time-series databases simultaneously. + +Based on your needs and resources you allocated to your external time-series database, you can configure the interval +that metrics are exported or export only certain charts with filtering. You can also choose whether metrics are exported +as-collected, a normalized average, or the sum/volume of metrics values over the configured interval. + +Exporting is an important part of Netdata's effort to be [interoperable](/docs/overview/netdata-monitoring-stack.md) +with other monitoring software. You can use an external time-series database for long-term metrics retention, further +analysis, or correlation with other tools, such as application tracing. + +## Supported databases + +Netdata supports exporting metrics to the following databases through several +[connectors](/exporting/README.md#features). Once you find the connector that works for your database, open its +documentation and the [enabling a connector](/docs/export/enable-connector.md) doc for details on enabling it. + +- **AppOptics**: [Prometheus remote write](/exporting/prometheus/remote_write/README.md) +- **AWS Kinesis**: [AWS Kinesis Data Streams](/exporting/aws_kinesis/README.md) +- **Azure Data Explorer**: [Prometheus remote write](/exporting/prometheus/remote_write/README.md) +- **Azure Event Hubs**: [Prometheus remote write](/exporting/prometheus/remote_write/README.md) +- **Blueflood**: [Graphite](/exporting/graphite/README.md) +- **Chronix**: [Prometheus remote write](/exporting/prometheus/remote_write/README.md) +- **Cortex**: [Prometheus remote write](/exporting/prometheus/remote_write/README.md) +- **CrateDB**: [Prometheus remote write](/exporting/prometheus/remote_write/README.md) +- **ElasticSearch**: [Graphite](/exporting/graphite/README.md), [Prometheus remote + write](/exporting/prometheus/remote_write/README.md) +- **Gnocchi**: [Prometheus remote write](/exporting/prometheus/remote_write/README.md) +- **Google BigQuery**: [Prometheus remote write](/exporting/prometheus/remote_write/README.md) +- **Google Cloud Pub/Sub**: [Google Cloud Pub/Sub Service](/exporting/pubsub/README.md) +- **Graphite**: [Graphite](/exporting/graphite/README.md), [Prometheus remote + write](/exporting/prometheus/remote_write/README.md) +- **InfluxDB**: [Graphite](/exporting/graphite/README.md), [Prometheus remote + write](/exporting/prometheus/remote_write/README.md) +- **IRONdb**: [Prometheus remote write](/exporting/prometheus/remote_write/README.md) +- **JSON**: [JSON document databases](/exporting/json/README.md) +- **Kafka**: [Prometheus remote write](/exporting/prometheus/remote_write/README.md) +- **KairosDB**: [Graphite](/exporting/graphite/README.md), [OpenTSDB](/exporting/opentsdb/README.md) +- **M3DB**: [Prometheus remote write](/exporting/prometheus/remote_write/README.md) +- **MetricFire**: [Prometheus remote write](/exporting/prometheus/remote_write/README.md) +- **MongoDB**: [MongoDB](/exporting/mongodb/) +- **New Relic**: [Prometheus remote write](/exporting/prometheus/remote_write/README.md) +- **OpenTSDB**: [OpenTSDB](/exporting/opentsdb/README.md), [Prometheus remote + write](/exporting/prometheus/remote_write/README.md) +- **PostgreSQL**: [Prometheus remote write](/exporting/prometheus/remote_write/README.md) + via [PostgreSQL Prometheus Adapter](https://github.com/CrunchyData/postgresql-prometheus-adapter) +- **Prometheus**: [Prometheus scraper](/exporting/prometheus/README.md) +- **TimescaleDB**: [Prometheus remote write](/exporting/prometheus/remote_write/README.md), + [netdata-timescale-relay](/exporting/TIMESCALE.md) +- **QuasarDB**: [Prometheus remote write](/exporting/prometheus/remote_write/README.md) +- **SignalFx**: [Prometheus remote write](/exporting/prometheus/remote_write/README.md) +- **Splunk**: [Prometheus remote write](/exporting/prometheus/remote_write/README.md) +- **TiKV**: [Prometheus remote write](/exporting/prometheus/remote_write/README.md) +- **Thanos**: [Prometheus remote write](/exporting/prometheus/remote_write/README.md) +- **VictoriaMetrics**: [Prometheus remote write](/exporting/prometheus/remote_write/README.md) +- **Wavefront**: [Prometheus remote write](/exporting/prometheus/remote_write/README.md) + +Can't find your preferred external time-series database? Ask our [community](https://community.netdata.cloud/) for +solutions, or file an [issue on +GitHub](https://github.com/netdata/netdata/issues/new?labels=bug%2C+needs+triage&template=bug_report.md). + +## What's next? + +We recommend you read our document on [enabling a connector](/docs/export/enable-connector.md) to learn about the +process and discover important configuration options. If you would rather skip ahead, click on any of the above links to +connectors for their reference documentation, which outline any prerequisites to install for that connector, along with +connector-specific configuration options. + +Read about one possible use case for exporting metrics in our guide: [_Export and visualize Netdata metrics in +Graphite_](/docs/guides/export/export-netdata-metrics-graphite.md). + +### Related reference documentation + +- [Exporting engine reference](/exporting/README.md) +- [Backends reference (deprecated)](/backends/README.md) + +[](<>) diff --git a/docs/generator/buildhtml.sh b/docs/generator/buildhtml.sh deleted file mode 100755 index dbd303911..000000000 --- a/docs/generator/buildhtml.sh +++ /dev/null @@ -1,106 +0,0 @@ -#!/bin/bash - -# buildhtml.sh - -# Builds the html static site, using mkdocs - -set -e - -# Assumes that the script is executed either from the htmldoc folder (by netlify), or from the root repo dir (as originally intended) -currentdir=$(pwd | awk -F '/' '{print $NF}') -echo "$currentdir" -if [ "$currentdir" = "generator" ]; then - cd ../.. -fi -GENERATOR_DIR="docs/generator" -SRC_DIR="${GENERATOR_DIR}/src" -# Fetch go.d.plugin docs -GO_D_DIR="collectors/go.d.plugin" -rm -rf ${GO_D_DIR} -git clone https://github.com/netdata/go.d.plugin.git ${GO_D_DIR} - -# Copy all Netdata .md files to docs/generator/src. Exclude htmldoc itself and also the directory node_modules generatord by Netlify -echo "Copying files" -rm -rf ${SRC_DIR} -find . -type d \( -path ./${GENERATOR_DIR} -o -path ./node_modules \) -prune -o -name "*.md" -print | cpio -pd ${SRC_DIR} - -# Copy Netdata html resources -cp -a ./${GENERATOR_DIR}/custom ./${SRC_DIR}/ - -# Modify the first line of the main README.md, to enable proper static html generation -echo "Modifying README header" -sed -i -e '0,/# Netdata /s//# Netdata Documentation\n\n/' ${SRC_DIR}/README.md - -# Remove all GA tracking code -find ${SRC_DIR} -name "*.md" -print0 | xargs -0 sed -i -e 's/\[!\[analytics.*UA-64295674-3)\]()//g' - -# Remove specific files that don't belong in the documentation -declare -a EXCLUDE_LIST=( - "HISTORICAL_CHANGELOG.md" - "contrib/sles11/README.md" -) - -for f in "${EXCLUDE_LIST[@]}"; do - rm "${SRC_DIR}/$f" -done - -echo "Fetching localization project" -LOC_DIR=${GENERATOR_DIR}/localization -rm -rf ${LOC_DIR} -git clone https://github.com/netdata/localization.git ${LOC_DIR} - -echo "Preparing directories" -MKDOCS_CONFIG_FILE="${GENERATOR_DIR}/mkdocs.yml" -MKDOCS_DIR="doc" -DOCS_DIR=${GENERATOR_DIR}/${MKDOCS_DIR} -rm -rf ${DOCS_DIR} - -prep_html() { - lang="${1}" - echo "Creating ${lang} mkdocs.yaml" - - if [ "${lang}" == "en" ] ; then - SITE_DIR="build" - else - SITE_DIR="build/${lang}" - fi - - # Generate mkdocs.yaml - ${GENERATOR_DIR}/buildyaml.sh ${MKDOCS_DIR} ${SITE_DIR} ${lang}>${MKDOCS_CONFIG_FILE} - - echo "Fixing links" - - # Fix links (recursively, all types, executing replacements) - ${GENERATOR_DIR}/checklinks.sh -rax - - echo "Calling mkdocs" - - # Build html docs - mkdocs build --config-file="${MKDOCS_CONFIG_FILE}" - - # Fix edit buttons for the markdowns that are not on the main Netdata repo - find "${GENERATOR_DIR}/${SITE_DIR}/${GO_D_DIR}" -name "*.html" -print0 | xargs -0 sed -i -e 's/https:\/\/github.com\/netdata\/netdata\/blob\/master\/collectors\/go.d.plugin/https:\/\/github.com\/netdata\/go.d.plugin\/blob\/master/g' - if [ "${lang}" != "en" ] ; then - find "${GENERATOR_DIR}/${SITE_DIR}" -name "*.html" -print0 | xargs -0 sed -i -e 's/https:\/\/github.com\/netdata\/netdata\/blob\/master\/\S*md/https:\/\/github.com\/netdata\/localization\//g' - fi - - # Replace index.html with DOCUMENTATION/index.html. Since we're moving it up one directory, we need to remove ../ from the links - echo "Replacing index.html with DOCUMENTATION/index.html" - sed 's/\.\.\///g' ${GENERATOR_DIR}/${SITE_DIR}/DOCUMENTATION/index.html > ${GENERATOR_DIR}/${SITE_DIR}/index.html - -} - -for d in "en" $(find ${LOC_DIR} -mindepth 1 -maxdepth 1 -name .git -prune -o -type d -printf '%f ') ; do - echo "Preparing source for $d" - cp -r ${SRC_DIR} ${DOCS_DIR} - if [ "${d}" != "en" ] ; then - cp -a ${LOC_DIR}/${d}/* ${DOCS_DIR}/ - fi - prep_html $d - rm -rf ${DOCS_DIR} -done - -# Remove cloned projects and temp directories -rm -rf ${GO_D_DIR} ${LOC_DIR} ${DOCS_DIR} ${SRC_DIR} - -echo "Finished" diff --git a/docs/generator/buildyaml.sh b/docs/generator/buildyaml.sh deleted file mode 100755 index 04d6098fc..000000000 --- a/docs/generator/buildyaml.sh +++ /dev/null @@ -1,289 +0,0 @@ -#!/bin/bash - -GENERATOR_DIR="docs/generator" - -docs_dir="${1}" -site_dir="${2}" -language="${3}" - -cd ${GENERATOR_DIR}/${docs_dir} - -# create yaml nav subtree with all the files directly under a specific directory -# arguments: -# tabs - how deep do we show it in the hierarchy. Level 1 is the top level, max should probably be 3 -# directory - to get mds from to add them to the yaml -# file - can be left empty to include all files -# name - what do we call the relevant section on the navbar. Empty if no new section is required -# maxdepth - how many levels of subdirectories do I include in the yaml in this section. 1 means just the top level and is the default if left empty -# excludefirstlevel - Optional param. If passed, mindepth is set to 2, to exclude the READMEs in the first directory level - -navpart() { - tabs=$1 - dir=$2 - file=$3 - section=$4 - maxdepth=$5 - excludefirstlevel=$6 - spc="" - - i=1 - while [ ${i} -lt ${tabs} ]; do - spc=" $spc" - i=$((i + 1)) - done - - if [ -z "$file" ]; then file='*'; fi - if [[ -n $section ]]; then echo "$spc- ${section}:"; fi - if [ -z "$maxdepth" ]; then maxdepth=1; fi - if [[ -n $excludefirstlevel ]]; then mindepth=2; else mindepth=1; fi - - for f in $(find $dir -mindepth $mindepth -maxdepth $maxdepth -name "${file}.md" -printf '%h\0%d\0%p\n' | sort -t '\0' -n | awk -F '\0' '{print $3}'); do - # If I'm adding a section, I need the child links to be one level deeper than the requested level in "tabs" - if [ -z "$section" ]; then - echo "$spc- '$f'" - else - echo "$spc - '$f'" - fi - done -} - -echo -e 'site_name: Netdata Documentation -site_url: https://docs.netdata.cloud -repo_url: https://github.com/netdata/netdata -repo_name: GitHub -edit_uri: blob/master -site_description: Netdata Documentation -copyright: Netdata, 2019 -docs_dir: '${docs_dir}' -site_dir: '${site_dir}' -#use_directory_urls: false -strict: true -extra: - social: - - type: "github" - link: "https://github.com/netdata/netdata" - - type: "twitter" - link: "https://twitter.com/linuxnetdata" - - type: "facebook" - link: "https://www.facebook.com/linuxnetdata/" -theme: - name: "material" - palette: - primary: "blue grey" - accent: "light green" - custom_dir: custom/themes/material - favicon: custom/img/favicon.ico - language: '${language}' -extra_css: - - "https://cdnjs.cloudflare.com/ajax/libs/cookieconsent2/3.1.0/cookieconsent.min.css" - - "custom/css/netdata.css" -extra_javascript: - - "custom/javascripts/cookie-consent.js" - - "https://cdnjs.cloudflare.com/ajax/libs/cookieconsent2/3.1.0/cookieconsent.min.js" -markdown_extensions: - - extra - - abbr - - attr_list - - def_list - - fenced_code - - footnotes - - tables - - admonition - - meta - - sane_lists - - smarty - - toc: - permalink: True - separator: "-" - - wikilinks - - pymdownx.arithmatex - - pymdownx.betterem: - smart_enable: all - - pymdownx.caret - - pymdownx.critic - - pymdownx.details - - pymdownx.highlight: - pygments_style: manni - css_class: "highlight codehilite" - linenums_style: pymdownx-inline - - pymdownx.inlinehilite - - pymdownx.magiclink - - pymdownx.mark - - pymdownx.smartsymbols - - pymdownx.superfences - - pymdownx.tasklist: - custom_checkbox: true - - pymdownx.tilde - - pymdownx.betterem - - pymdownx.superfences - - markdown.extensions.footnotes - - markdown.extensions.attr_list - - markdown.extensions.def_list - - markdown.extensions.tables - - markdown.extensions.abbr - - pymdownx.extrarawhtml -nav:' - -navpart 1 . "README" "" - -navpart 1 . . "About Netdata" - -echo -ne " - 'docs/what-is-netdata.md' - - 'docs/Demo-Sites.md' - - 'docs/netdata-security.md' - - 'docs/anonymous-statistics.md' - - 'docs/Donations-netdata-has-received.md' - - 'docs/a-github-star-is-important.md' - - REDISTRIBUTED.md - - CHANGELOG.md - - SECURITY.md -- Why Netdata: - - 'docs/why-netdata/README.md' - - 'docs/why-netdata/1s-granularity.md' - - 'docs/why-netdata/unlimited-metrics.md' - - 'docs/why-netdata/meaningful-presentation.md' - - 'docs/why-netdata/immediate-results.md' -- Installation: - - 'packaging/installer/README.md' - - 'packaging/docker/README.md' - - 'packaging/installer/UPDATE.md' - - 'packaging/DISTRIBUTIONS.md' - - 'packaging/installer/UNINSTALL.md' -- 'docs/getting-started.md' -- Running Netdata: - - 'daemon/README.md' - - 'docs/configuration-guide.md' - - 'daemon/config/README.md' -" -navpart 2 web/server "" "Web server" -navpart 3 web/server "" "" 2 excludefirstlevel -echo -ne " - Running behind another web server: - - 'docs/Running-behind-nginx.md' - - 'docs/Running-behind-apache.md' - - 'docs/Running-behind-lighttpd.md' - - 'docs/Running-behind-caddy.md' - - 'docs/Running-behind-haproxy.md' -" -#navpart 2 system -navpart 2 database -navpart 2 database/engine -navpart 2 registry - -echo -ne " - 'docs/Performance.md' - - 'docs/netdata-for-IoT.md' - - 'docs/high-performance-netdata.md' -" - -navpart 1 . netdata-cloud "Netdata Cloud" -echo -ne " - - 'docs/netdata-cloud/README.md' - - 'docs/netdata-cloud/signing-in.md' - - 'docs/netdata-cloud/nodes-view.md' -" - -navpart 1 web "README" "Dashboards" -navpart 2 web/gui "" "" 3 - -navpart 1 collectors "" "Data collection" 1 -echo -ne " - 'docs/Add-more-charts-to-netdata.md' - - Internal plugins: -" - -navpart 3 collectors/proc.plugin -navpart 3 collectors/statsd.plugin -navpart 3 collectors/cgroups.plugin -navpart 3 collectors/idlejitter.plugin -navpart 3 collectors/tc.plugin -navpart 3 collectors/checks.plugin -navpart 3 collectors/diskspace.plugin -navpart 3 collectors/freebsd.plugin -navpart 3 collectors/macos.plugin - -navpart 2 collectors/plugins.d "" "External plugins" - -echo -ne " - Go: - - 'collectors/go.d.plugin/README.md' -" -navpart 4 collectors/go.d.plugin "" "Modules" 3 excludefirstlevel - -echo -ne " - Python: - - 'collectors/python.d.plugin/README.md' -" -navpart 4 collectors/python.d.plugin "" "Modules" 3 excludefirstlevel - -echo -ne " - Node.js: - - 'collectors/node.d.plugin/README.md' -" -navpart 4 collectors/node.d.plugin "" "Modules" 3 excludefirstlevel - -echo -ne " - BASH: - - 'collectors/charts.d.plugin/README.md' - - Modules: - - 'collectors/charts.d.plugin/ap/README.md' - - 'collectors/charts.d.plugin/apcupsd/README.md' - - 'collectors/charts.d.plugin/example/README.md' - - 'collectors/charts.d.plugin/libreswan/README.md' - - 'collectors/charts.d.plugin/nut/README.md' - - 'collectors/charts.d.plugin/opensips/README.md' - - Obsolete Modules: - - 'collectors/charts.d.plugin/mem_apps/README.md' - - 'collectors/charts.d.plugin/postfix/README.md' - - 'collectors/charts.d.plugin/tomcat/README.md' - - 'collectors/charts.d.plugin/sensors/README.md' - - 'collectors/charts.d.plugin/cpu_apps/README.md' - - 'collectors/charts.d.plugin/squid/README.md' - - 'collectors/charts.d.plugin/nginx/README.md' - - 'collectors/charts.d.plugin/hddtemp/README.md' - - 'collectors/charts.d.plugin/cpufreq/README.md' - - 'collectors/charts.d.plugin/mysql/README.md' - - 'collectors/charts.d.plugin/exim/README.md' - - 'collectors/charts.d.plugin/apache/README.md' - - 'collectors/charts.d.plugin/load_average/README.md' - - 'collectors/charts.d.plugin/phpfpm/README.md' -" - -navpart 3 collectors/apps.plugin -navpart 3 collectors/cups.plugin -navpart 3 collectors/fping.plugin -navpart 3 collectors/ioping.plugin -navpart 3 collectors/freeipmi.plugin -navpart 3 collectors/nfacct.plugin -navpart 3 collectors/xenstat.plugin -navpart 3 collectors/perf.plugin -navpart 3 collectors/slabinfo.plugin - - -echo -ne " - 'docs/Third-Party-Plugins.md' -" - -navpart 1 health README "Alarms and notifications" -navpart 2 health/notifications "" "" 1 -navpart 2 health/notifications "" "Supported notifications" 2 excludefirstlevel - -navpart 1 streaming "" "" 4 - -navpart 1 backends "" "Archiving to backends" 3 - -navpart 1 web/api "" "HTTP API" -navpart 2 web/api/exporters "" "Exporters" 2 -navpart 2 web/api/formatters "" "Formatters" 2 -navpart 2 web/api/badges "" "" 2 -navpart 2 web/api/health "" "" 2 -navpart 2 web/api/queries "" "Queries" 2 - -echo -ne "- Contributing to Netdata: - - CONTRIBUTING.md - - 'docs/contributing/contributing-documentation.md' - - 'docs/contributing/style-guide.md' - - CODE_OF_CONDUCT.md - - CONTRIBUTORS.md - - packaging/maintainers/README.md -" - -echo -ne "- Additional information: -" -navpart 2 packaging/makeself "" "" 4 -navpart 2 libnetdata "" "libnetdata" 4 -navpart 2 contrib -navpart 2 tests "" "" 2 -navpart 2 diagrams/data_structures diff --git a/docs/generator/checklinks.sh b/docs/generator/checklinks.sh deleted file mode 100755 index a453d8ff2..000000000 --- a/docs/generator/checklinks.sh +++ /dev/null @@ -1,334 +0,0 @@ -#!/bin/bash -# shellcheck disable=SC2181 - -# Doc link checker -# Validates and tries to fix all links that will cause issues either in the repo, or in the html site - -GENERATOR_DIR="docs/generator" -MKDOCS_DIR="doc" -DOCS_DIR=${GENERATOR_DIR}/${MKDOCS_DIR} - -dbg () { - if [ "$VERBOSE" -eq 1 ] ; then printf "%s\\n" "${1}" ; fi -} - -printhelp () { - echo "Usage: docs/generator/checklinks.sh [-r OR -f <fname>] [OPTIONS] - -r Recursively check all mds in all child directories, except docs/generator and node_modules (which is generatord by netlify) - -f Just check the passed md file - General Options: - -x Execute commands. By default the script runs in test mode with no files changed by the script (results and fixes are just shown). Use -x to have it apply the changes. - -u trys to follow URLs using curl - -v Outputs debugging messages - By default, nothing is actually checked. The following options tell it what to check: - -a Check all link types - -w Check wiki links (and just warn if you see one) - -b Check absolute links to the Netdata repo (and change them to relative). Only checks links to https://github.com/netdata/netdata/????/master* - -l Check relative links to the Netdata repo (and replace them with links that the html static site can live with, under docs/generator/src only) - -e Check external links, outside the wiki or the repo (useless without adding the -u option, to verify that they're not broken) - " -} - -fix () { - if [ "$EXECUTE" -eq 0 ] ; then - echo " - SHOULD EXECUTE: $1" - else - dbg " - EXECUTING: $1" - eval "$1" - fi -} - -testURL () { - if [ "$TESTURLS" -eq 0 ] ; then return 0 ; fi - dbg " - Testing URL $1" - curl -sS "$1" > /dev/null - if [ $? -gt 0 ] ; then - return 1 - fi - return 0 -} - -testinternal () { - # Check if the header referred to by the internal link exists in the same file - ff=${1} - ifile=${2} - ilnk=${3} - header=${ilnk//-/} - dbg " - Searching for \"$header\" in $ifile" - tr -d '[],_.:? `'< "$ifile" | sed 's/-//g' | grep -i "^\\#*$header\$" >/dev/null - if [ $? -eq 0 ] ; then - dbg " - $ilnk found in $ifile" - return 0 - else - echo " - ERROR: $ff - $ilnk header not found in file $ifile" - EXITCODE=1 - return 1 - fi -} - -testf () { - sf=$1 - tf=$2 - - if [ -f "$tf" ] ; then - dbg " - $tf exists" - return 0 - else - echo " - ERROR: $sf - $tf does not exist" - EXITCODE=1 - return 1 - fi -} - -ck_netdata_relative () { - f=${1} - rlnk=${2} - dbg " - Checking relative link $rlnk" - fpath="." - fname="$f" - # First ensure that the link works in the repo, then try to fix it in htmldocs - if [[ $f =~ ^(.*)/([^/]*)$ ]] ; then - fpath="${BASH_REMATCH[1]}" - fname="${BASH_REMATCH[2]}" - dbg " - Current file is at $fpath" - else - dbg " - Current file is at root directory" - fi - # Cases to handle: - # (#somelink) - # (path/) - # (path/#somelink) - # (path/filename.md) -> htmldoc (path/filename/) - # (path/filename.md#somelink) -> htmldoc (path/filename/#somelink) - # (path#somelink) -> htmldoc (path/#somelink) - # (path/someotherfile) -> htmldoc (absolutelink) - # (path) -> htmldoc (path/) - - TRGT="" - s="" - - case "$rlnk" in - \#* ) - dbg " - # (#somelink)" - testinternal "$f" "$f" "$rlnk" - ;; - */ ) - dbg " - # (path/)" - TRGT="$fpath/${rlnk}README.md" - testf "$f" "$TRGT" - if [ $? -eq 0 ] ; then - if [ "$fname" != "README.md" ] ; then s="../$rlnk"; fi - fi - ;; - */\#* ) - dbg " - # (path/#somelink)" - if [[ $rlnk =~ ^(.*)/#(.*)$ ]] ; then - TRGT="$fpath/${BASH_REMATCH[1]}/README.md" - LNK="#${BASH_REMATCH[2]}" - dbg " - Look for $LNK in $TRGT" - testf "$f" "$TRGT" - if [ $? -eq 0 ] ; then - testinternal "$f" "$TRGT" "$LNK" - if [ $? -eq 0 ] ; then - if [ "$fname" != "README.md" ] ; then s="../$rlnk"; fi - fi - fi - fi - ;; - *.md ) - dbg " - # (path/filename.md) -> htmldoc (path/filename/)" - testf "$f" "$fpath/$rlnk" - if [ $? -eq 0 ] ; then - if [[ $rlnk =~ ^(.*)/(.*).md$ ]] ; then - if [ "${BASH_REMATCH[2]}" = "README" ] ; then - s="${BASH_REMATCH[1]}/" - else - s="${BASH_REMATCH[1]}/${BASH_REMATCH[2]}/" - fi - if [ "$fname" != "README.md" ] ; then s="../$s"; fi - fi - fi - ;; - *.md\#* ) - dbg " - # (path/filename.md#somelink) -> htmldoc (path/filename/#somelink)" - if [[ $rlnk =~ ^(.*)#(.*)$ ]] ; then - TRGT="$fpath/${BASH_REMATCH[1]}" - LNK="#${BASH_REMATCH[2]}" - testf "$f" "$TRGT" - if [ $? -eq 0 ] ; then - testinternal "$f" "$TRGT" "$LNK" - if [ $? -eq 0 ] ; then - if [[ $lnk =~ ^(.*)/(.*).md#(.*)$ ]] ; then - if [ "${BASH_REMATCH[2]}" = "README" ] ; then - s="${BASH_REMATCH[1]}/#${BASH_REMATCH[3]}" - else - s="${BASH_REMATCH[1]}/${BASH_REMATCH[2]}/#${BASH_REMATCH[3]}" - fi - if [ "$fname" != "README.md" ] ; then s="../$s"; fi - fi - fi - fi - fi - ;; - *\#* ) - dbg " - # (path#somelink) -> (path/#somelink)" - if [[ $rlnk =~ ^(.*)#(.*)$ ]] ; then - TRGT="$fpath/${BASH_REMATCH[1]}/README.md" - LNK="#${BASH_REMATCH[2]}" - testf "$f" "$TRGT" - if [ $? -eq 0 ] ; then - testinternal "$f" "$TRGT" "$LNK" - if [ $? -eq 0 ] ; then - if [[ $rlnk =~ ^(.*)#(.*)$ ]] ; then - s="${BASH_REMATCH[1]}/#${BASH_REMATCH[2]}" - if [ "$fname" != "README.md" ] ; then s="../$s"; fi - fi - fi - fi - fi - ;; - * ) - if [ -d "$fpath/$rlnk" ] ; then - dbg " - # (path) -> htmldoc (path/)" - testf "$f" "$fpath/$rlnk/README.md" - if [ $? -eq 0 ] ; then - s="$rlnk/" - if [ "$fname" != "README.md" ] ; then s="../$s"; fi - fi - else - cd - >/dev/null - if [ -f "$fpath/$rlnk" ] ; then - dbg " - # (path/someotherfile) $rlnk" - if [ "$fpath" = "." ] ; then - s="https://github.com/netdata/netdata/tree/master/$rlnk" - else - s="https://github.com/netdata/netdata/tree/master/$fpath/$rlnk" - fi - else - echo " - ERROR: $f - $rlnk is neither a file or a directory. Giving up!" - EXITCODE=1 - fi - cd $DOCS_DIR >/dev/null - fi - ;; - esac - - if [[ ! -z $s ]] ; then - srch=$(echo "$rlnk" | sed 's/\//\\\//g') - rplc=$(echo "$s" | sed 's/\//\\\//g') - fix "sed -i 's/($srch)/($rplc)/g' $f" - fi -} - - -checklinks () { - f=$1 - dbg "Checking $f" - while read -r l ; do - for word in $l ; do - if [[ $word =~ .*\]\(([^\(\) ]*)\).* ]] ; then - lnk=$(echo "${BASH_REMATCH[1]}" | tr -d '<>') - if [ -z "$lnk" ] ; then continue ; fi - dbg " $lnk" - case "$lnk" in - mailto:* ) dbg " - Mailto link, ignoring" ;; - https://github.com/netdata/netdata/wiki* ) - dbg " - Wiki Link $lnk" - if [ "$CHKWIKI" -eq 1 ] ; then echo " - WARNING: $f - $lnk points to the wiki. Please replace it manually" ; fi - ;; - https://github.com/netdata/netdata/????/master* ) - echo " - ERROR: $f - $lnk is an absolute link to a Netdata file. Please convert to relative." - EXITCODE=1 - ;; - http* ) - dbg " - External link $lnk" - if [ "$CHKEXTERNAL" -eq 1 ] ; then - testURL "$lnk" - if [ $? -eq 1 ] ; then - echo " - ERROR: $f - $lnk is a broken link" - EXITCODE=1 - fi - fi - ;; - * ) - dbg " - Relative link $lnk" - if [ "$CHKRELATIVE" -eq 1 ] ; then ck_netdata_relative "$f" "$lnk" ; fi - ;; - esac - fi - done - done < "$f" -} - -TESTURLS=0 -VERBOSE=0 -RECURSIVE=0 -EXECUTE=0 -CHKWIKI=0 -CHKABSOLUTE=0 -CHKEXTERNAL=0 -CHKRELATIVE=0 -while getopts :f:rxuvwbela option -do - case "$option" in - f) - file=$OPTARG - ;; - r) - RECURSIVE=1 - ;; - x) - EXECUTE=1 - ;; - u) - TESTURLS=1 - ;; - v) - VERBOSE=1 - ;; - w) - CHKWIKI=1 - ;; - b) - CHKABSOLUTE=1 - ;; - e) - CHKEXTERNAL=1 - ;; - l) - CHKRELATIVE=1 - ;; - a) - CHKWIKI=1 - CHKABSOLUTE=1 - CHKEXTERNAL=1 - CHKRELATIVE=1 - ;; - *) - printhelp - exit 1 - ;; - esac -done - -EXITCODE=0 - -if [ -z "${file}" ] ; then - if [ $RECURSIVE -eq 0 ] ; then - printhelp - exit 1 - fi - cd ${DOCS_DIR} - for f in $(find . -type d \( -path ./${GENERATOR_DIR} -o -path ./node_modules \) -prune -o -name "*.md" -print); do - checklinks "$f" - done - cd - -else - if [ $RECURSIVE -eq 1 ] ; then - printhelp - exit 1 - fi - checklinks "$file" -fi - -exit $EXITCODE diff --git a/docs/generator/custom/css/netdata.css b/docs/generator/custom/css/netdata.css deleted file mode 100644 index 7b1934db4..000000000 --- a/docs/generator/custom/css/netdata.css +++ /dev/null @@ -1,96 +0,0 @@ -.md-nav__link { - white-space: nowrap; -} - -.md-typeset { - font-size: .75rem -} - -/* Underline text */ - -.md-typeset a:not(.nav-button):not(.md-icon):not(.headerlink) { - border-bottom: 1px solid #272b30; -} - -/* Custom styling for the new documentation homepage. - In particular, the three buttons for install/getting started/configuration. */ -.homepage-nav { - display: flex; - margin-top: 1.4rem; -} - -.homepage-nav div { - flex: 1; -} - -.homepage-nav .nav-install { - margin-right: 1rem; -} - -.homepage-nav .nav-configuration { - margin-left: 1rem; -} - -.nav-button { - border: 2px solid black; - border-radius: 4px; - display: block; - font-weight: 700; - margin: 0 auto; - padding: 0.6rem 0; - text-align: center; -} - -/* Hide the label at the top of the navigation menu. Does nothing. - Well, it does do something on mobile, and this media query makes - sure it's hidden only on screens wide enough to not use the mobile sidebar. */ -@media only screen and (min-width:76.25em) { - .md-nav--primary .md-nav__title { - display: none; - } -} - -/* Change the language selector dropdown to match new color. */ -.md-header-nav select#sel { - background-color: rgba(0,0,0,.26) !important; - padding: 3px; - margin-left: 5px; - margin-right: 20px; -} - -/* Add some whitespace to the bottom of each doc. */ -.md-content { - margin-bottom: 6rem; -} - -/* Make sure inline code in tables don't break. */ -.md-typeset__table code { - word-break: normal; -} - -/* Give code blocks a little more line height */ -.md-typeset pre { - line-height: 1.6; -} - -/* Show line numbers. */ -[data-linenos]:before { - border-right: .0625rem solid #ddd; - color: #999; - content: attr(data-linenos); - display: inline-block; - margin-left: -1.2rem; - margin-right: .7rem; - padding-left: 1.2rem; -} - -.md-typeset .highlight .hll { - display: inline; - margin: 0; - padding: 0; -} - -/* Bold the first item on the docs sidebar: Netdata Documentation */ -.md-nav--primary > .md-nav__list > .md-nav__item:first-of-type { - font-weight: 700; -}
\ No newline at end of file diff --git a/docs/generator/custom/img/favicon.ico b/docs/generator/custom/img/favicon.ico Binary files differdeleted file mode 100644 index 703716cd0..000000000 --- a/docs/generator/custom/img/favicon.ico +++ /dev/null diff --git a/docs/generator/custom/img/geography-16.png b/docs/generator/custom/img/geography-16.png Binary files differdeleted file mode 100644 index 48391f958..000000000 --- a/docs/generator/custom/img/geography-16.png +++ /dev/null diff --git a/docs/generator/custom/javascripts/cookie-consent.js b/docs/generator/custom/javascripts/cookie-consent.js deleted file mode 100644 index a5c65da49..000000000 --- a/docs/generator/custom/javascripts/cookie-consent.js +++ /dev/null @@ -1,15 +0,0 @@ -window.addEventListener("load", function(){ -window.cookieconsent.initialise({ - "palette": { - "popup": { - "background": "#000" - }, - "button": { - "background": "#f1d600" - } - }, - "content": { - "href": "https://docs.netdata.cloud/docs/privacy-policy/" - } -})}); - diff --git a/docs/generator/custom/themes/material/partials/footer.html b/docs/generator/custom/themes/material/partials/footer.html deleted file mode 100644 index 0631a3042..000000000 --- a/docs/generator/custom/themes/material/partials/footer.html +++ /dev/null @@ -1,67 +0,0 @@ -{% import "partials/language.html" as lang with context %} -<footer class="md-footer"> - {% if page.previous_page or page.next_page %} - <div class="md-footer-nav"> - <nav class="md-footer-nav__inner md-grid"> - {% if page.previous_page %} - <a href="{{ page.previous_page.url | url }}" title="{{ page.previous_page.title }}" class="md-flex md-footer-nav__link md-footer-nav__link--prev" rel="prev"> - <div class="md-flex__cell md-flex__cell--shrink"> - <i class="md-icon md-icon--arrow-back md-footer-nav__button"></i> - </div> - <div class="md-flex__cell md-flex__cell--stretch md-footer-nav__title"> - <span class="md-flex__ellipsis"> - <span class="md-footer-nav__direction"> - {{ lang.t("footer.previous") }} - </span> - {{ page.previous_page.title }} - </span> - </div> - </a> - {% endif %} - {% if page.next_page %} - <a href="{{ page.next_page.url | url }}" title="{{ page.next_page.title }}" class="md-flex md-footer-nav__link md-footer-nav__link--next" rel="next"> - <div class="md-flex__cell md-flex__cell--stretch md-footer-nav__title"> - <span class="md-flex__ellipsis"> - <span class="md-footer-nav__direction"> - {{ lang.t("footer.next") }} - </span> - {{ page.next_page.title }} - </span> - </div> - <div class="md-flex__cell md-flex__cell--shrink"> - <i class="md-icon md-icon--arrow-forward md-footer-nav__button"></i> - </div> - </a> - {% endif %} - </nav> - </div> - {% endif %} - <div class="md-footer-meta md-typeset"> - <div class="md-footer-meta__inner md-grid"> - <div class="md-footer-copyright"> - {% if config.copyright %} - <div class="md-footer-copyright__highlight"> - {{ config.copyright }} | <a href="/docs/privacy-policy/">Privacy Policy</a> | <a href="/docs/terms-of-use/">Terms of Use</a> - </div> - {% endif %} - </div> - {% block social %} - {% include "partials/social.html" %} - {% endblock %} - </div> - </div> -</footer> -<script>!function(e,a,t,n,o,c,i){e.GoogleAnalyticsObject=o,e.ga=e.ga||function(){(e.ga.q=e.ga.q||[]).push(arguments)},e.ga.l=1*new Date,c=a.createElement(t),i=a.getElementsByTagName(t)[0],c.async=1,c.src="https://www.google-analytics.com/analytics.js",i.parentNode.insertBefore(c,i)}(window,document,"script",0,"ga"),ga("create","UA-64295674-3",""),ga("set","anonymizeIp",!0),ga("send","pageview","/doc"+window.location.pathname);var links=document.getElementsByTagName("a");if(Array.prototype.map.call(links,function(a){a.host!=document.location.host&&a.addEventListener("click",function(){var e=a.getAttribute("data-md-action")||"follow";ga("send","event","outbound",e,a.href)})}),document.forms.search){var query=document.forms.search.query;query.addEventListener("blur",function(){if(this.value){var e=document.location.pathname;ga("send","pageview",e+"?q="+this.value)}})}</script> -<script> - let currentLang = getLanguage(); - - let sel = document.getElementById('sel'); - let opts = sel.options; - for (let opt, j = 0; opt = opts[j]; j++) { - if (opt.value == currentLang) { - sel.selectedIndex = j; - break; - } - } - -</script> diff --git a/docs/generator/custom/themes/material/partials/header.html b/docs/generator/custom/themes/material/partials/header.html deleted file mode 100644 index 85f874905..000000000 --- a/docs/generator/custom/themes/material/partials/header.html +++ /dev/null @@ -1,108 +0,0 @@ -<header class="md-header" data-md-component="header"> - <nav class="md-header-nav md-grid"> - <div class="md-flex"> - <div class="md-flex__cell md-flex__cell--shrink"> - <a href="{{ config.site_url | default(nav.homepage.url, true) | url }}" title="{{ config.site_name }}" class="md-header-nav__button md-logo"> - {% if config.theme.logo.icon %} - <i class="md-icon">{{ config.theme.logo.icon }}</i> - {% else %} - <img src="{{ config.theme.logo | url }}" width="24" height="24"> - {% endif %} - </a> - </div> - <div class="md-flex__cell md-flex__cell--shrink"> - <label class="md-icon md-icon--menu md-header-nav__button" for="__drawer"></label> - </div> - <div class="md-flex__cell md-flex__cell--stretch"> - <div class="md-flex__ellipsis md-header-nav__title" data-md-component="title"> - {% block site_name %} - {% if config.site_name == page.title %} - {{ config.site_name }} - {% else %} - <span class="md-header-nav__topic"> - {{ config.site_name }} - </span> - <span class="md-header-nav__topic"> - {{ page.title }} - </span> - {% endif %} - {% endblock %} - </div> - </div> - <div class="md-flex__cell md-flex__cell--shrink"> - {% block search_box %} - {% if "search" in config["plugins"] %} - <label class="md-icon md-icon--search md-header-nav__button" for="__search"></label> - {% include "partials/search.html" %} - {% endif %} - {% endblock %} - </div> - - <!-- netdata --> - <style> - .language-selector li { - list-style: none; - } - - .language-option.selected { - background-color: #ccc; - } - </style> - <script> - function getLanguage() { - const lang = window.location.pathname.split("/")[1]; - - if (lang.length == 0 || lang.length > 2) { - return "en"; - } - - return lang; - } - - function languagePrefix(lang) { - if (lang === "en") { - return ""; - } - - return `/${lang}`; - } - - function updatePathname(pathname, lang) { - if (currentLang !== "en") { - const parts = pathname.split("/"); - parts.shift(); - parts.shift(); - pathname = `/${parts.join("/")}`; - } - - return `${languagePrefix(lang)}${pathname}`; - } - - function setLanguage(sel) { - if (sel.value === currentLang) { - return; - } - - window.location.pathname = updatePathname(window.location.pathname, sel.value); - } - </script> - - <div style="vertical-align: middle; white-space: nowrap; padding-left: 20px;" class="md-flex__cell md-flex__cell--shrink"> - <img src="/custom/img/geography-16.png" style="vertical-align: middle;"/> - <select id="sel" onchange="setLanguage(this);" style="vertical-align: middle; background-color: #3f51b5; color: white; border: none;"> - <option href="#" value='en'>English</option> - <option href="#" value='zh'>中文</option> - <option href="#" value='pt'>Portugues-Brasil</option> - </select> - </div> - - {% if config.repo_url %} - <div class="md-flex__cell md-flex__cell--shrink"> - <div class="md-header-nav__source"> - {% include "partials/source.html" %} - </div> - </div> - {% endif %} - </div> - </nav> -</header> diff --git a/docs/generator/requirements.txt b/docs/generator/requirements.txt deleted file mode 100644 index ac01be7ae..000000000 --- a/docs/generator/requirements.txt +++ /dev/null @@ -1,2 +0,0 @@ -mkdocs>=1.0.1 -mkdocs-material diff --git a/docs/generator/runtime.txt b/docs/generator/runtime.txt deleted file mode 100644 index d70c8f8d8..000000000 --- a/docs/generator/runtime.txt +++ /dev/null @@ -1 +0,0 @@ -3.6 diff --git a/docs/get/README.md b/docs/get/README.md new file mode 100644 index 000000000..f89472de5 --- /dev/null +++ b/docs/get/README.md @@ -0,0 +1,158 @@ +<!-- +title: "Get Netdata" +description: "Time to get Netdata's monitoring and troubleshooting solution. Sign in to Cloud, download the Agent everywhere, and connect it all together." +custom_edit_url: https://github.com/netdata/netdata/edit/master/docs/get/README.md +--> + +# Get Netdata + +import { OneLineInstall } from '../src/components/OneLineInstall/' +import { Install, InstallBox } from '../src/components/InstallBox/' + +Netdata uses the open-source Netdata Agent and Netdata Cloud web application +[together](/docs/overview/what-is-netdata.md) to help you collect every metric, visualize the health of your nodes, and +troubleshoot complex performance problems. Once you've signed in to Netdata Cloud and installed the Netdata Agent on all +your nodes, you can claim your nodes and see their real-time metrics on a single interface. + +## Sign in to Netdata Cloud + +If you don't already have a free Netdata Cloud account, go ahead and [create one](https://app.netdata.cloud). + +Choose your preferred authentication method and follow the onboarding process to create your Space. + +## Install the Netdata Agent + +The Netdata Agent runs permanently on all your physical/virtual servers, containers, cloud deployments, and edge/IoT +devices. It runs on Linux distributions (**Ubuntu**, **Debian**, **CentOS**, and more), container/microservice platforms +(**Kubernetes** clusters, **Docker**), and many other operating systems (**FreeBSD**, **macOS**), with no `sudo` +required. + +> ⚠️ Many distributions ship with third-party packages of Netdata, which we cannot maintain or keep up-to-date. For the +> best experience, use one of the methods described or linked to below. + +The **recommended** way to install the Netdata Agent on a Linux system is our one-line [kickstart +script](/packaging/installer/methods/kickstart.md). This script automatically installs dependencies and builds Netdata +from its source code. + +<OneLineInstall /> + +Copy the script, paste it into your node's terminal, and hit `Enter`. + +Open your favorite browser and navigate to `http://localhost:19999` or `http://REMOTE-HOST:19999` to open the dashboard. + +<details> +<summary>Watch how the one-line installer works</summary> +<iframe width="820" height="460" src="https://www.youtube.com/embed/tVIp7ycK60A" frameborder="0" allow="accelerometer; autoplay; clipboard-write; encrypted-media; gyroscope; picture-in-picture" allowfullscreen></iframe> +</details> + +### Other operating systems/methods + +Want to install Netdata on a Kubernetes cluster, with Docker, or using a different method? Not a Linux user? Choose your +platform to see specific instructions. + +<Install> + <InstallBox + to="/docs/agent/packaging/installer/methods/kubernetes" + img="/img/index/methods/kubernetes.svg" + os="Kubernetes" /> + <InstallBox + to="/docs/agent/packaging/docker" + img="/img/index/methods/docker.svg" + os="Docker" /> + <InstallBox + to="/docs/agent/packaging/installer/methods/cloud-providers" + img="/img/index/methods/cloud.svg" + imgDark="/img/index/methods/cloud-dark.svg" + os="Cloud providers (GCP, AWS, Azure)" /> + <InstallBox + to="/docs/agent/packaging/installer/methods/packages" + img="/img/index/methods/package.svg" + imgDark="/img/index/methods/package-dark.svg" + os="Linux with .deb/.rpm" /> + <InstallBox + to="/docs/agent/packaging/installer/methods/kickstart-64" + img="/img/index/methods/static.svg" + imgDark="/img/index/methods/static-dark.svg" + os="Linux with static 64-bit binary" /> + <InstallBox + to="/docs/agent/packaging/installer/methods/manual" + img="/img/index/methods/git.svg" + imgDark="/img/index/methods/git-dark.svg" + os="Linux from Git" /> + <InstallBox + to="/docs/agent/packaging/installer/methods/freebsd" + img="/img/index/methods/freebsd.svg" + os="FreeBSD" /> + <InstallBox + to="/docs/agent/packaging/installer/methods/macos" + img="/img/index/methods/macos.svg" + os="MacOS" /> +</Install> + +Even more options available in our [packaging documentation](/packaging/installer/README.md#alternative-methods). + +## Claim your node on Netdata Cloud + +You need to [claim](/claim/README.md) your nodes to see them in Netdata Cloud. Claiming establishes a secure TLS +connection to Netdata Cloud using the [Agent-Cloud link](/aclk/README.md), and proves you have write and administrative +access to that node. + +When you view a node in Netdata Cloud, the Agent running on that node streams metrics, metadata, and alarm status to +Netdata Cloud, which in turn streams those metrics to your web browser. Netdata Cloud [does not +store](/docs/store/distributed-data-architecture.md#does-netdata-cloud-store-my-metrics) or log metrics values. + +To claim a node, you need to run the claiming script. In Netdata Cloud, click on your Space's name, then **Manage your +Space** in the dropdown. Click **Nodes** in the panel that appears. Copy the script and run it in your node's terminal. +The script looks like the following, with long strings instead of `TOKEN` and `ROOM1,ROOM2`: + +```bash +sudo netdata-claim.sh -token=TOKEN -rooms=ROOM1,ROOM2 -url=https://app.netdata.cloud +``` + +The script returns `Agent was successfully claimed.` after creating a new RSA pair and establishing the link to Netdata +Cloud. If the script returns an error, try our [troubleshooting tips](/claim/README.md#troubleshooting). + +> 💡 Our claiming reference guide also contains instructions for claiming [Docker +> containers](/claim/README.md#claim-an-agent-running-in-docker), [Kubernetes cluster parent +> pods](/claim/README.md#claim-an-agent-running-in-docker), via a [proxy](/claim/README.md#claim-through-a-proxy), and +> more. + +<details> +<summary>Watch how claiming nodes works</summary> +<iframe width="820" height="460" src="https://www.youtube.com/embed/UAzVvhMab8g" frameborder="0" allow="accelerometer; autoplay; clipboard-write; encrypted-media; gyroscope; picture-in-picture" allowfullscreen></iframe> +</details> + +For more information on the claiming process, why we implemented it, and how it works, see the [claim](/claim/README.md) +and [Agent-Cloud link](/aclk/README.md) reference docs. + +## Troubleshooting + +If you experience issues with installing the Netdata Agent, see our +[installation](/packaging/installer/README.md#troubleshooting-and-known-issues) reference. Our +[reinstall](/packaging/installer/REINSTALL.md) doc can help clean up your installation and get you back to monitoring. + +For Netdata Cloud issues, see the [Netdata Cloud reference docs](https://learn.netdata.cloud/docs/cloud). + +## What's next? + +At this point, you have set up your free Netdata Cloud account, installed the Netdata Agent on your node(s), and claimed +one or more nodes to your Space. You're ready to start monitoring, visualizing, and troubleshooting with Netdata. We +have two quickstart guides based on the scope of what you need to monitor. + +Interested in monitoring a single node? Check out our [single-node monitoring +quickstart](/docs/quickstart/single-node.md). + +If you're looking to monitor an entire infrastructure with Netdata, see the [infrastructure monitoring +quickstart](/docs/quickstart/infrastructure.md). + +Or, skip ahead to [Agent configuration](/docs/configure/nodes.md). + +### Related reference documentation + +- [Netdata Agent · Packaging & installer](/packaging/installer/README.md) +- [Netdata Agent · Reinstall Netdata](/packaging/installer/REINSTALL.md) +- [Netdata Agent · Update Netdata](/packaging/installer/UPDATE.md) +- [Netdata Agent · Agent-Cloud link](/aclk/README.md) +- [Netdata Agent · Agent claiming](/claim/README.md) + +[](<>) diff --git a/docs/getting-started.md b/docs/getting-started.md index 065da1c70..1ccab4247 100644 --- a/docs/getting-started.md +++ b/docs/getting-started.md @@ -1,26 +1,36 @@ -# Getting started guide +<!-- +title: "Get started guide" +date: 2020-05-04 +custom_edit_url: https://github.com/netdata/netdata/edit/master/docs/getting-started.md +--> -Thanks for trying Netdata! In this guide, we'll quickly walk you through the first steps you should take after getting -Netdata installed. +# Get started guide -Netdata can collect thousands of metrics in real-time without any configuration, but there are some valuable things to -know to get the most of out Netdata based on your needs. +Thanks for trying the Netdata Agent! In this getting started guide, we'll quickly walk you through the first steps you +should take after installing the Agent. -> If you haven't installed Netdata yet, visit the [installation instructions](../packaging/installer) for details, -> including our one-liner script, which automatically installs Netdata on almost all Linux distributions. +The Agent can collect thousands of metrics in real-time and use its database for long-term metrics storage without any +configuration, but there are some valuable things to know to get the most out of Netdata based on your needs. + +We'll skip right into some technical details, so if you're brand-new to monitoring the health and performance of systems +and applications, our [**step-by-step guide**](/docs/guides/step-by-step/step-00.md) might be a better fit. + +> If you haven't installed Netdata yet, visit the [installation instructions](/packaging/installer/README.md) for +> details, including our one-liner script, which automatically installs Netdata on almost all Linux distributions. ## Access the dashboard -Open up your web browser of choice and navigate to `http://YOUR-HOST:19999`. Welcome to Netdata! +Open up your web browser of choice and navigate to `http://NODE:19999`, replacing `NODE` with the IP address or hostname +of your Agent. Hit **Enter**. Welcome to Netdata!  +dashboard](https://user-images.githubusercontent.com/1153921/80825153-abaec600-8b94-11ea-8b17-1b770a2abaa9.gif) **What's next?**: -- Read more about the [standard Netdata dashboard](../web/gui/). -- Learn all the specifics of [using charts](../web/README.md#using-charts) or the differences between [charts, - context, and families](../web/README.md#charts-contexts-families). +- Read more about the [standard Netdata dashboard](/web/gui/). +- Learn all the specifics of [using charts](/web/README.md#using-charts) or the differences between [charts, + context, and families](/web/README.md#charts-contexts-families). ## Configuration basics @@ -39,12 +49,31 @@ Once you save your changes, [restart Netdata](#start-stop-and-restart-netdata) t **What's next?**: -- [Change how long Netdata stores metrics](#change-how-long-netdata-stores-metrics) by either increasing the `history` - option or switching to the database engine. -- Move Netdata's dashboard to a [different port](https://docs.netdata.cloud/web/server/) or enable TLS/HTTPS +- [Change how long Netdata stores metrics](#change-how-long-netdata-stores-metrics) by changing the `page cache size` + and `dbengine disk space` settings in `netdata.conf`. +- Move Netdata's dashboard to a [different port](/web/server/) or enable TLS/HTTPS encryption. -- See all the `netdata.conf` options in our [daemon configuration documentation](../daemon/config/). -- Run your own [registry](../registry/README.md#run-your-own-registry). +- See all the `netdata.conf` options in our [daemon configuration documentation](/daemon/config/). +- Run your own [registry](/registry/README.md#run-your-own-registry). + +## Change how long Netdata stores metrics + +Netdata can store long-term, historical metrics out of the box. A custom database uses RAM to store recent metrics, +ensuring dashboards and API queries are extremely responsive, while "spilling" historical metrics to disk. This +configuration keeps RAM usage low while allowing for long-term, on-disk metrics storage. + +You can tweak this custom _database engine_ to store a much larger dataset than your system's available RAM, +particularly if you allow Netdata to use slightly more RAM and disk space than the default configuration. + +Read our guide on [changing how long Netdata stores metrics](/docs/store/change-metrics-storage.md) to learn more and +use our the embedded database engine to figure out the exact settings you'll need to store historical metrics right in +the Agent's database. + +**What's next?**: + +- Learn more about the [memory requirements for the database + engine](/database/engine/README.md#memory-requirements) to understand how much RAM/disk space you should commit + to storing historical metrics. ## Collect data from more sources @@ -57,16 +86,16 @@ Netdata](#start-stop-and-restart-netdata). However, auto-detection only works if you installed the source using its standard installation procedure. If Netdata isn't collecting metrics after a restart, your source probably isn't configured correctly. Look at the [external plugin -documentation](../collectors/plugins.d/) to find the appropriate module for your source. Those pages will contain more -information about how to configure your source for auto-detection. +documentation](/collectors/plugins.d/) to find the appropriate module for your source. Those pages will contain +more information about how to configure your source for auto-detection. Some modules, like `chrony`, are disabled by default and must be enabled manually for auto-detection to work. Once Netdata detects a valid source of data, it will continue trying to collect data from it. For example, if Netdata is collecting data from an Nginx web server, and you shut Nginx down, Netdata will collect new data as soon as -you start the web server back up—no restart necessary. +you start the web server back up—no restart necessary. -### Configuring plugins +### Configure plugins Even if Netdata auto-detects your service/application, you might want to configure what, or how often, Netdata is collecting data. @@ -124,12 +153,12 @@ changes based on your particular Nginx setup. **What's next?**: -- Look at the [full list of data collection modules](Add-more-charts-to-netdata.md#available-data-collection-modules) +- Look at the [full list of data collection modules](/collectors/COLLECTORS.md) to configure your sources for auto-detection and monitoring. -- Improve the [performance](Performance.md) of Netdata on low-memory systems. +- Improve the [performance](/docs/guides/configure/performance.md) of Netdata on low-memory systems. - Configure `systemd` to expose [systemd services - utilization](../collectors/cgroups.plugin/README.md#monitoring-systemd-services) metrics automatically. -- [Reconfigure individual charts](../daemon/config/README.md#per-chart-configuration) in `netdata.conf`. + utilization](/collectors/cgroups.plugin/README.md#monitoring-systemd-services) metrics automatically. +- [Reconfigure individual charts](/daemon/config/README.md#per-chart-configuration) in `netdata.conf`. ## Health monitoring and alarms @@ -144,7 +173,7 @@ Edit your `/etc/netdata/netdata.conf` file and set the following: ``` If you want to keep health monitoring enabled, but turn email notifications off, edit your `health_alarm_notify.conf` -file with `edit-config`, or with your the text editor of your choice: +file with `edit-config`, or with the text editor of your choice: ```bash sudo /etc/netdata/edit-config health_alarm_notify.conf @@ -154,51 +183,28 @@ Find the `SEND_EMAIL="YES"` line and change it to `SEND_EMAIL="NO"`. **What's next?**: -- Write your own health alarm using the [examples](../health/README.md#examples). -- Add a new notification method, like [Slack](../health/notifications/slack/). - -## Change how long Netdata stores metrics - -By default, Netdata uses a custom database which uses both RAM and the disk to store metrics. Recent metrics are stored -in the system's RAM to keep access fast, while historical metrics are "spilled" to disk to keep RAM usage low. - -This custom database, which we call the _database engine_, allows you to store a much larger dataset than your system's -available RAM. - -If you're not sure whether you're using the database engine, or want to tweak the default settings to store even more -historical metrics, check out our tutorial: [**Changing how long Netdata stores -metrics**](../docs/tutorials/longer-metrics-storage.md). - -**What's next?**: - -- Learn more about the [memory requirements for the database engine](../database/engine/README.md#memory-requirements) - to understand how much RAM/disk space you should commit to storing historical metrics. -- Read up on the memory requirements of the [round-robin database](../database/), or figure out whether your system - has KSM enabled, which can [reduce the default database's memory usage](../database/README.md#ksm) by about 60%. - -## Monitoring multiple systems with Netdata - -If you have Netdata installed on multiple systems, you can have them all appear in the **My nodes** menu at the top-left -corner of the dashboard. +- Follow the [health quickstart](/health/QUICKSTART.md) to locate and edit existing health entities, and then + create your own. +- See all the alarm options via the [health configuration reference](/health/REFERENCE.md). +- Add a new notification method, like [Slack](/health/notifications/slack/). -To show all your servers in that menu, you need to [register for or sign in](../docs/netdata-cloud/signing-in.md) to -[Netdata Cloud](../docs/netdata-cloud/) from each system. Each system will then appear in the **My nodes** menu, which -you can use to navigate between your systems quickly. +## Monitor multiple systems with Netdata Cloud - +If you have the Agent installed on multiple nodes, you can use Netdata Cloud in two ways: Monitor the health and +performance of an entire infrastructure via the Netdata Cloud web application, or use the Visited Nodes menu that's +built into every dashboard. -Whenever you pan, zoom, highlight, select, or pause a chart, Netdata will synchronize those settings with any other -agent you visit via the My nodes menu. Even your scroll position is synchronized, so you'll see the same charts and -respective data for easy comparisons or root cause analysis. +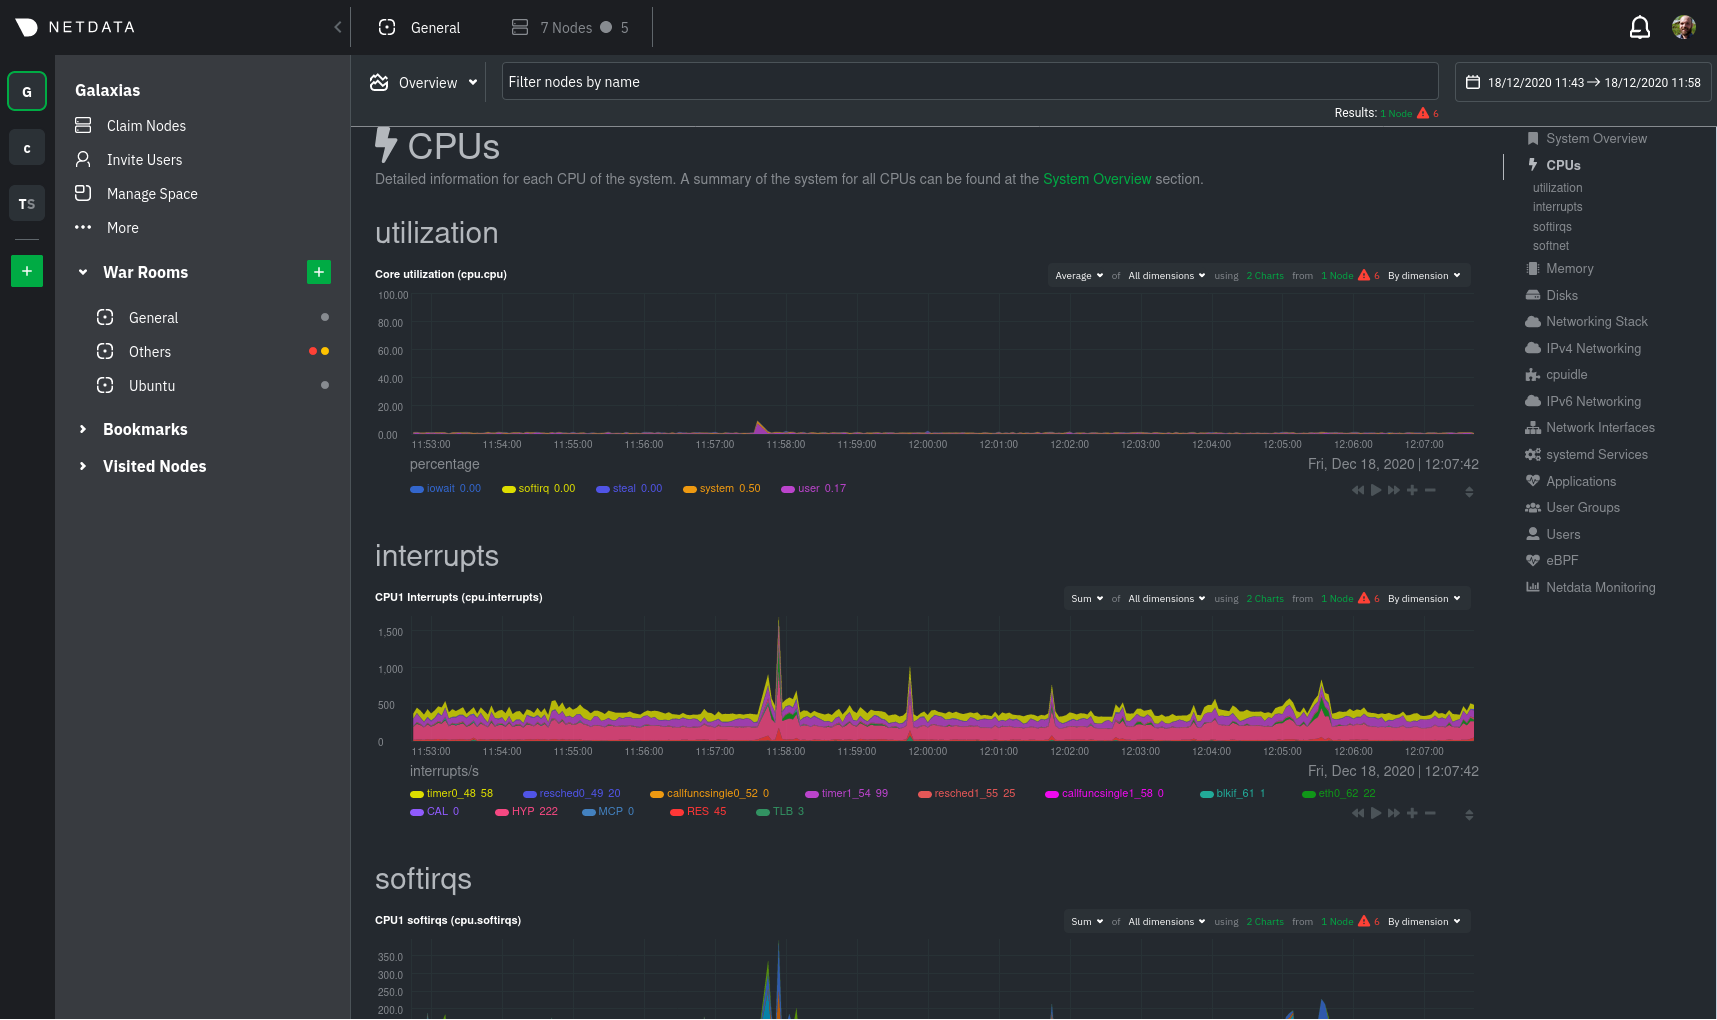 -You can now seamlessly track performance anomalies across your entire infrastructure! +You can use these features together or separately—the decision is up to you and the needs of your infrastructure. **What's next?**: -- Read up on how the [Netdata Cloud registry works](../registry/), and what kind of data it stores and sends to your - web browser. -- Familiarize yourself with the [Nodes View](../docs/netdata-cloud/nodes-view.md) +- Sign up for [Netdata Cloud](https://app.netdata.cloud). +- Read the [infrastructure monitoring quickstart](/docs/quickstart/infrastructure.md). +- Better understand how the Netdata Agent connects securely to Netdata Cloud with [claiming](/claim/README.md) and + [Agent-Cloud link](/aclk/README.md) documentation. ## Start, stop, and restart Netdata @@ -219,15 +225,16 @@ and `init.d`: ## What's next? Even after you've configured `netdata.conf`, tweaked alarms, learned the basics of performance troubleshooting, and -added all your systems to the **My nodes** menu, you've just gotten started with Netdata. +claimed all your systems in Netdata Cloud or added them to the Visited nodes menu, you've just gotten started with +Netdata. Take a look at some more advanced features and configurations: -- Centralize Netdata metrics from many systems with [streaming](../streaming) -- Enable long-term archiving of Netdata metrics via [backends](../backends) to time-series databases. -- Improve security by putting Netdata behind an [Nginx proxy with SSL](Running-behind-nginx.md). +- Centralize Netdata metrics from many systems with [streaming](/streaming/README.md) +- Enable long-term archiving of Netdata metrics via [exporting engine](/exporting/README.md) to time-series databases. +- Improve security by putting Netdata behind an [Nginx proxy with SSL](/docs/Running-behind-nginx.md). -Or, learn more about how you can contribute to [Netdata core](../CONTRIBUTING.md) or our -[documentation](../docs/contributing/contributing-documentation.md)! +Or, learn more about how you can contribute to [Netdata core](/CONTRIBUTING.md) or our +[documentation](/docs/contributing/contributing-documentation.md)! [](<>) diff --git a/docs/guides/collect-apache-nginx-web-logs.md b/docs/guides/collect-apache-nginx-web-logs.md new file mode 100644 index 000000000..215ced3ef --- /dev/null +++ b/docs/guides/collect-apache-nginx-web-logs.md @@ -0,0 +1,161 @@ +<!-- +title: "Monitor Nginx or Apache web server log files with Netdata" +custom_edit_url: https://github.com/netdata/netdata/edit/master/docs/guides/collect-apache-nginx-web-logs.md +--> + +# Monitor Nginx or Apache web server log files with Netdata + +Log files have been a critical resource for developers and system administrators who want to understand the health and +performance of their web servers, and Netdata is taking important steps to make them even more valuable. + +By parsing web server log files with Netdata, and seeing the volume of redirects, requests, or server errors over time, +you can better understand what's happening on your infrastructure. Too many bad requests? Maybe a recent deploy missed a +few small SVG icons. Too many requests? Time to batten down the hatches—it's a DDoS. + +Netdata has been capable of monitoring web log files for quite some time, thanks for the [weblog python.d +module](/collectors/python.d.plugin/web_log/README.md), but we recently refactored this module in Go, and that effort +comes with a ton of improvements. + +You can now use the [LTSV log format](http://ltsv.org/), track TLS and cipher usage, and the whole parser is faster than +ever. In one test on a system with SSD storage, the collector consistently parsed the logs for 200,000 requests in +200ms, using ~30% of a single core. To learn more about these improvements, see our [v1.19 release post](https://blog.netdata.cloud/posts/release-1.19/). + +The [go.d plugin](https://learn.netdata.cloud/docs/agent/collectors/go.d.plugin/modules/weblog/) is currently compatible +with [Nginx](https://nginx.org/en/) and [Apache](https://httpd.apache.org/). + +This guide will walk you through using the new Go-based web log collector to turn the logs these web servers +constantly write to into real-time insights into your infrastructure. + +## Set up your web servers + +As with all data sources, Netdata can auto-detect Nginx or Apache servers if you installed them using their standard +installation procedures. + +Almost all web server installations will need _no_ configuration to start collecting metrics. As long as your web server +has readable access log file, you can configure the web log plugin to access and parse it. + +## Configure the web log collector + +To use the Go version of this plugin, you need to explicitly enable it, and disable the deprecated Python version. +First, open `python.d.conf`: + +```bash +cd /etc/netdata/ # Replace with your Netdata configuration directory, if not /etc/netdata/ +./edit-config python.d.conf +``` + +Find the `web_log` line, uncomment it, and set it to `web_log: no`. Next, open the `go.d.conf` file for editing. + +```bash +./edit-config go.d.conf +``` + +Find the `web_log` line again, uncomment it, and set it to `web_log: yes`. + +Finally, restart Netdata with `service netdata restart`, or the appropriate method for your system. You should see +metrics in your Netdata dashboard! + +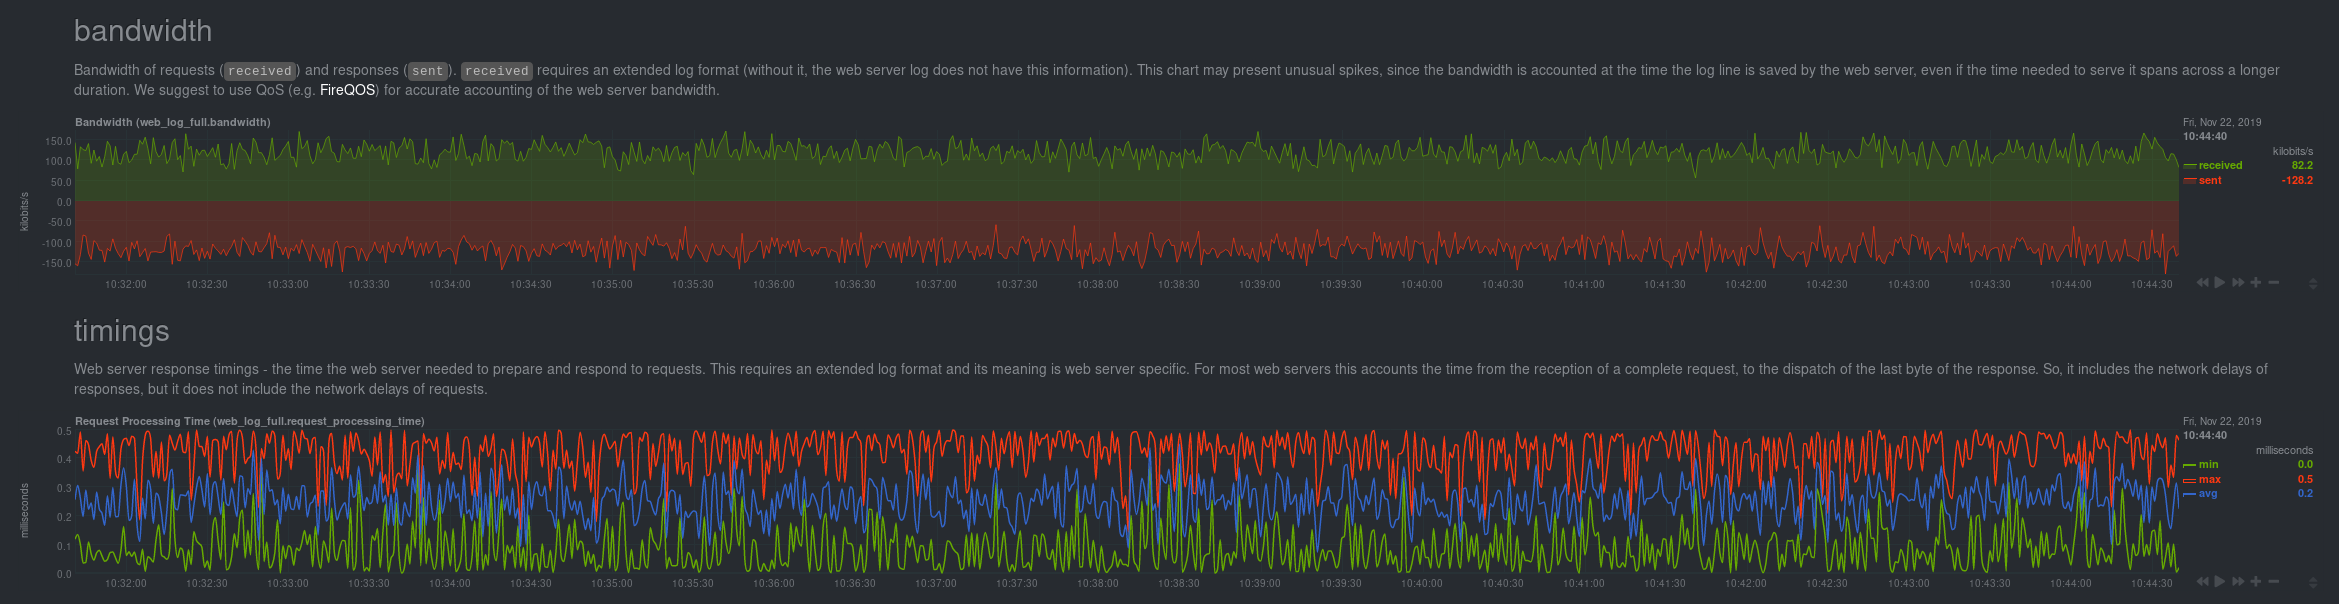 + +If you don't see web log charts, or **web log nginx**/**web log apache** menus on the right-hand side of your dashboard, +continue reading for other configuration options. + +## Custom configuration of the web log collector + +The web log collector's default configuration comes with a few example jobs that should cover most Linux distributions +and their default locations for log files: + +```yaml +# [ JOBS ] +jobs: +# NGINX +# debian, arch + - name: nginx + path: /var/log/nginx/access.log + +# gentoo + - name: nginx + path: /var/log/nginx/localhost.access_log + +# APACHE +# debian + - name: apache + path: /var/log/apache2/access.log + +# gentoo + - name: apache + path: /var/log/apache2/access_log + +# arch + - name: apache + path: /var/log/httpd/access_log + +# debian + - name: apache_vhosts + path: /var/log/apache2/other_vhosts_access.log + +# GUNICORN + - name: gunicorn + path: /var/log/gunicorn/access.log + + - name: gunicorn + path: /var/log/gunicorn/gunicorn-access.log +``` + +However, if your log files were not auto-detected, it might be because they are in a different location. Try the default +`web_log.conf` file. + +```bash +./edit-config go.d/web_log.conf +``` + +To create a new custom configuration, you need to set the `path` parameter to point to your web server's access log +file. You can give it a `name` as well, and set the `log_type` to `auto`. + +```yaml +jobs: + - name: example + path: /path/to/file.log + log_type: auto +``` + +Restart Netdata with `service netdata restart` or the appropriate method for your system. Netdata should pick up your +web server's access log and begin showing real-time charts! + +### Custom log formats and fields + +The web log collector is capable of parsing custom Nginx and Apache log formats and presenting them as charts, but we'll +leave that topic for a separate guide. + +We do have [extensive +documentation](https://learn.netdata.cloud/docs/agent/collectors/go.d.plugin/modules/weblog/#custom-log-format) on how +to build custom parsing for Nginx and Apache logs. + +## Tweak web log collector alarms + +Over time, we've created some default alarms for web log monitoring. These alarms are designed to work only when your +web server is receiving more than 120 requests per minute. Otherwise, there's simply not enough data to make conclusions +about what is "too few" or "too many." + +- [web log alarms](https://raw.githubusercontent.com/netdata/netdata/master/health/health.d/web_log.conf). + +You can also edit this file directly with `edit-config`: + +```bash +./edit-config health.d/weblog.conf +``` + +For more information about editing the defaults or writing new alarm entities, see our [health monitoring +documentation](/health/README.md). + +## What's next? + +Now that you have web log collection up and running, we recommend you take a look at the documentation for our +[python.d](/collectors/python.d.plugin/web_log/README.md) for some ideas of how you can turn these rather "boring" logs +into powerful real-time tools for keeping your servers happy. + +Don't forget to give GitHub user [Wing924](https://github.com/Wing924) a big 👍 for his hard work in starting up the Go +refactoring effort. + +[](<>) diff --git a/docs/guides/collect-unbound-metrics.md b/docs/guides/collect-unbound-metrics.md new file mode 100644 index 000000000..299464745 --- /dev/null +++ b/docs/guides/collect-unbound-metrics.md @@ -0,0 +1,138 @@ +<!-- +title: "Monitor Unbound DNS servers with Netdata" +date: 2020-03-31 +custom_edit_url: https://github.com/netdata/netdata/edit/master/docs/guides/collect-unbound-metrics.md +--> + +# Monitor Unbound DNS servers with Netdata + +[Unbound](https://nlnetlabs.nl/projects/unbound/about/) is a "validating, recursive, caching DNS resolver" from NLNet +Labs. In v1.19 of Netdata, we release a completely refactored collector for collecting real-time metrics from Unbound +servers and displaying them in Netdata dashboards. + +Unbound runs on FreeBSD, OpenBSD, NetBSD, macOS, Linux, and Windows, and supports DNS-over-TLS, which ensures that DNS +queries and answers are all encrypted with TLS. In theory, that should reduce the risk of eavesdropping or +man-in-the-middle attacks when communicating to DNS servers. + +This guide will show you how to collect dozens of essential metrics from your Unbound servers with minimal +configuration. + +## Set up your Unbound installation + +As with all data sources, Netdata can auto-detect Unbound servers if you installed them using the standard installation +procedure. + +Regardless of whether you're connecting to a local or remote Unbound server, you need to be able to access the server's +`remote-control` interface via an IP address, FQDN, or Unix socket. + +To set up the `remote-control` interface, you can use `unbound-control`. First, run `unbound-control-setup` to generate +the TLS key files that will encrypt connections to the remote interface. Then add the following to the end of your +`unbound.conf` configuration file. See the [Unbound +documentation](https://nlnetlabs.nl/documentation/unbound/howto-setup/#setup-remote-control) for more details on using +`unbound-control`, such as how to handle situations when Unbound is run under a unique user. + +```conf +# enable remote-control +remote-control: + control-enable: yes +``` + +Next, make your `unbound.conf`, `unbound_control.key`, and `unbound_control.pem` files readable by Netdata using [access +control lists](https://wiki.archlinux.org/index.php/Access_Control_Lists) (ACL). + +```bash +sudo setfacl -m user:netdata:r unbound.conf +sudo setfacl -m user:netdata:r unbound_control.key +sudo setfacl -m user:netdata:r unbound_control.pem +``` + +Finally, take note whether you're using Unbound in _cumulative_ or _non-cumulative_ mode. This will become relevant when +configuring the collector. + +## Configure the Unbound collector + +You may not need to do any more configuration to have Netdata collect your Unbound metrics. + +If you followed the steps above to enable `remote-control` and make your Unbound files readable by Netdata, that should +be enough. Restart Netdata with `service netdata restart`, or the appropriate method for your system. You should see +Unbound metrics in your Netdata dashboard! + + + +If that failed, you will need to manually configure `unbound.conf`. See the next section for details. + +### Manual setup for a local Unbound server + +To configure Netdata's Unbound collector module, navigate to your Netdata configuration directory (typically at +`/etc/netdata/`) and use `edit-config` to initialize and edit your Unbound configuration file. + +```bash +cd /etc/netdata/ # Replace with your Netdata configuration directory, if not /etc/netdata/ +sudo ./edit-config go.d/unbound.conf +``` + +The file contains all the global and job-related parameters. The `name` setting is required, and two Unbound servers +can't have the same name. + +> It is important you know whether your Unbound server is running in cumulative or non-cumulative mode, as a conflict +> between modes will create incorrect charts. + +Here are two examples for local Unbound servers, which may work based on your unique setup: + +```yaml +jobs: + - name: local + address: 127.0.0.1:8953 + cumulative: no + use_tls: yes + tls_skip_verify: yes + tls_cert: /path/to/unbound_control.pem + tls_key: /path/to/unbound_control.key + + - name: local + address: 127.0.0.1:8953 + cumulative: yes + use_tls: no +``` + +Netdata will attempt to read `unbound.conf` to get the appropriate `address`, `cumulative`, `use_tls`, `tls_cert`, and +`tls_key` parameters. + +Restart Netdata with `service netdata restart`, or the appropriate method for your system. + +### Manual setup for a remote Unbound server + +Collecting metrics from remote Unbound servers requires manual configuration. There are too many possibilities to cover +all remote connections here, but the [default `unbound.conf` +file](https://github.com/netdata/go.d.plugin/blob/master/config/go.d/unbound.conf) contains a few useful examples: + +```yaml +jobs: + - name: remote + address: 203.0.113.10:8953 + use_tls: no + + - name: remote_cumulative + address: 203.0.113.11:8953 + use_tls: no + cumulative: yes + + - name: remote + address: 203.0.113.10:8953 + cumulative: yes + use_tls: yes + tls_cert: /etc/unbound/unbound_control.pem + tls_key: /etc/unbound/unbound_control.key +``` + +To see all the available options, see the default [unbound.conf +file](https://github.com/netdata/go.d.plugin/blob/master/config/go.d/unbound.conf). + +## What's next? + +Now that you're collecting metrics from your Unbound servers, let us know how it's working for you! There's always room +for improvement or refinement based on real-world use cases. Feel free to [file an +issue](https://github.com/netdata/netdata/issues/new?labels=bug%2C+needs+triage&template=bug_report.md) with your +thoughts. + +[](<>) diff --git a/docs/guides/configure/performance.md b/docs/guides/configure/performance.md new file mode 100644 index 000000000..5f93a8cd4 --- /dev/null +++ b/docs/guides/configure/performance.md @@ -0,0 +1,235 @@ +<!-- +title: How to optimize the Netdata Agent's performance +description: "While the Netdata Agent is designed to monitor a system with only 1% CPU, you can optimize its performance for low-resource systems." +image: /img/seo/guides/configure/performance.png +custom_edit_url: https://github.com/netdata/netdata/edit/master/docs/guides/configure/performance.md +--> + +# How to optimize the Netdata Agent's performance + +We designed the Netdata Agent to be incredibly lightweight, even when it's collecting a few thousand dimensions every +second and visualizing that data into hundreds of charts. The Agent itself should never use more than 1% of a single CPU +core, roughly 100 MiB of RAM, and minimal disk I/O to collect, store, and visualize all this data. + +We take this scalability seriously. We have one user [running +Netdata](https://github.com/netdata/netdata/issues/1323#issuecomment-266427841) on a system with 144 cores and 288 +threads. Despite collecting 100,000 metrics every second, the Agent still only uses 9% CPU utilization on a +single core. + +But not everyone has such powerful systems at their disposal. For example, you might run the Agent on a cloud VM with +only 512 MiB of RAM, or an IoT device like a [Raspberry Pi](/docs/guides/monitor/pi-hole-raspberry-pi.md). In these +cases, reducing Netdata's footprint beyond its already diminutive size can pay big dividends, giving your services more +horsepower while still monitoring the health and the performance of the node, OS, hardware, and applications. + +## Prerequisites + +- A node running the Netdata Agent. +- Familiarity with configuring the Netdata Agent with `edit-config`. + +If you're not familiar with how to configure the Netdata Agent, read our [node configuration +doc](/docs/configure/nodes.md) before continuing with this guide. This guide assumes familiarity with the Netdata config +directory, using `edit-config`, and the process of uncommenting/editing various settings in `netdata.conf` and other +configuration files. + +## What affects Netdata's performance? + +Netdata's performance is primarily affected by **data collection/retention** and **clients accessing data**. + +You can configure almost all aspects of data collection/retention, and certain aspects of clients accessing data. For +example, you can't control how many users might be viewing a local Agent dashboard, [viewing an +infrastructure](/docs/visualize/overview-infrastructure.md) in real-time with Netdata Cloud, or running [Metric +Correlations](https://learn.netdata.cloud/docs/cloud/insights/metric-correlations). + +The Netdata Agent runs with the lowest possible [process scheduling +policy](/daemon/README.md#netdata-process-scheduling-policy), which is `nice 19`, and uses the `idle` process scheduler. +Together, these settings ensure that the Agent only gets CPU resources when the node has CPU resources to space. If the +node reaches 100% CPU utilization, the Agent is stopped first to ensure your applications get any available resources. +In addition, under heavy load, collectors that require disk I/O may stop and show gaps in charts. + +Let's walk through the best ways to improve the Netdata Agent's performance. + +## Reduce collection frequency + +The fastest way to improve the Agent's resource utilization is to reduce how often it collects metrics. + +### Global + +If you don't need per-second metrics, or if the Netdata Agent uses a lot of CPU even when no one is viewing that node's +dashboard, configure the Agent to collect metrics less often. + +Open `netdata.conf` and edit the `update every` setting. The default is `1`, meaning that the Agent collects metrics +every second. + +If you change this to `2`, Netdata enforces a minimum `update every` setting of 2 seconds, and collects metrics every +other second, which will effectively halve CPU utilization. Set this to `5` or `10` to collect metrics every 5 or 10 +seconds, respectively. + +```conf +[global] + update every = 5 +``` + +### Specific plugin or collector + +Every collector and plugin has its own `update every` setting, which you can also change in the `go.d.conf`, +`python.d.conf`, `node.d.conf`, or `charts.d.conf` files, or in individual collector configuration files. If the `update +every` for an individual collector is less than the global, the Netdata Agent uses the global setting. See the [enable +or configure a collector](/docs/collect/enable-configure.md) doc for details. + +To reduce the frequency of an [internal +plugin/collector](/docs/collect/how-collectors-work.md#collector-architecture-and-terminology), open `netdata.conf` and +find the appropriate section. For example, to reduce the frequency of the `apps` plugin, which collects and visualizes +metrics on application resource utilization: + +```conf +[plugin:apps] + update every = 5 +``` + +To [configure an individual collector](/docs/collect/enable-configure.md), open its specific configuration file with +`edit-config` and look for the `update_every` setting. For example, to reduce the frequency of the `nginx` collector, +run `sudo ./edit-config go.d/nginx.conf`: + +```conf +# [ GLOBAL ] +update_every: 10 +``` + +## Disable unneeded plugins or collectors + +If you know that you don't need an [entire plugin or a specific +collector](/docs/collect/how-collectors-work.md#collector-architecture-and-terminology), you can disable any of them. +Keep in mind that if a plugin/collector has nothing to do, it simply shuts down and does not consume system resources. +You will only improve the Agent's performance by disabling plugins/collectors that are actively collecting metrics. + +Open `netdata.conf` and scroll down to the `[plugins]` section. To disable any plugin, uncomment it and set the value to +`no`. For example, to explicitly keep the `proc` and `go.d` plugins enabled while disabling `python.d`, `charts.d`, and +`node.d`. + +```conf +[plugins] + proc = yes + python.d = no + charts.d = no + node.d = no + go.d = yes +``` + +Disable specific collectors by opening their respective plugin configuration files, uncommenting the line for the +collector, and setting its value to `no`. + +```bash +sudo ./edit-config go.d.conf +sudo ./edit-config python.d.conf +sudo ./edit-config node.d.conf +sudo ./edit-config charts.d.conf +``` + +For example, to disable a few Python collectors: + +```conf +modules: + apache: no + dockerd: no + fail2ban: no +``` + +## Lower memory usage for metrics retention + +Reduce the disk space that the [database engine](/database/engine/README.md) uses to retain metrics by editing +the `dbengine multihost disk space` option in `netdata.conf`. The default value is `256`, but can be set to a minimum of +`64`. By reducing the disk space allocation, Netdata also needs to store less metadata in the node's memory. + +The `page cache size` option also directly impacts Netdata's memory usage, but has a minimum value of `32`. + +Reducing the value of `dbengine multihost disk space` does slim down Netdata's resource usage, but it also reduces how +long Netdata retains metrics. Find the right balance of performance and metrics retention by using the [dbengine +calculator](/docs/store/change-metrics-storage.md#calculate-the-system-resources-ram-disk-space-needed-to-store-metrics). + +All the settings are found in the `[global]` section of `netdata.conf`: + +```conf +[global] + memory mode = dbengine + page cache size = 32 + dbengine multihost disk space = 256 +``` + +## Run Netdata behind Nginx + +A dedicated web server like Nginx provides far more robustness than the Agent's internal [web server](/web/README.md). +Nginx can handle more concurrent connections, reuse idle connections, and use fast gzip compression to reduce payloads. + +For details on installing Nginx as a proxy for the local Agent dashboard, see our [Nginx +doc](/docs/Running-behind-nginx.md). + +After you complete Nginx setup according to the doc linked above, we recommend setting `keepalive` to `1024`, and using +gzip compression with the following options in the `location /` block: + +```conf + location / { + ... + gzip on; + gzip_proxied any; + gzip_types *; + } +``` + +Finally, edit `netdata.conf` with the following settings: + +```conf +[global] + bind socket to IP = 127.0.0.1 + access log = none + disconnect idle web clients after seconds = 3600 + enable web responses gzip compression = no +``` + +## Disable/lower gzip compression for the dashboard + +If you choose not to run the Agent behind Nginx, you can disable or lower the Agent's web server's gzip compression. +While gzip compression does reduce the size of the HTML/CSS/JS payload, it does use additional CPU while a user is +looking at the local Agent dashboard. + +To disable gzip compression, open `netdata.conf` and find the `[web]` section: + +```conf +[web] + enable gzip compression = no +``` + +Or to lower the default compression level: + +```conf +[web] + enable gzip compression = yes + gzip compression level = 1 +``` + +## Disable logs + +If you installation is working correctly, and you're not actively auditing Netdata's logs, disable them in +`netdata.conf`. + +```conf +[global] + debug log = none + error log = none + access log = none +``` + +## What's next? + +We hope this guide helped you better understand how to optimize the performance of the Netdata Agent. + +Now that your Agent is running smoothly, we recommend you [secure your nodes](/docs/configure/nodes.md) if you haven't +already. + +Next, dive into some of Netdata's more complex features, such as configuring its health watchdog or exporting metrics to +an external time-series database. + +- [Interact with dashboards and charts](/docs/visualize/interact-dashboards-charts.md) +- [Configure health alarms](/docs/monitor/configure-alarms.md) +- [Export metrics to external time-series databases](/docs/export/external-databases.md) + +[](<>) diff --git a/docs/guides/deploy/ansible.md b/docs/guides/deploy/ansible.md new file mode 100644 index 000000000..8298fd00c --- /dev/null +++ b/docs/guides/deploy/ansible.md @@ -0,0 +1,174 @@ +<!-- +title: Deploy Netdata with Ansible +description: "Deploy an infrastructure monitoring solution in minutes with the Netdata Agent and Ansible. Use and customize a simple playbook for monitoring as code." +image: /img/seo/guides/deploy/ansible.png +custom_edit_url: https://github.com/netdata/netdata/edit/master/docs/guides/deploy/ansible.md +--> + +# Deploy Netdata with Ansible + +Netdata's [one-line kickstart](https://learn.netdata.cloud/docs/get) is zero-configuration, highly adaptable, and +compatible with tons of different operating systems and Linux distributions. You can use it on bare metal, VMs, +containers, and everything in-between. + +But what if you're trying to bootstrap an infrastructure monitoring solution as quickly as possible. What if you need to +deploy Netdata across an entire infrastructure with many nodes? What if you want to make this deployment reliable, +repeatable, and idempotent? What if you want to write and deploy your infrastructure or cloud monitoring system like +code? + +Enter [Ansible](https://ansible.com), a popular system provisioning, configuration management, and infrastructure as +code (IaC) tool. Ansible uses **playbooks** to glue many standardized operations together with a simple syntax, then run +those operations over standard and secure SSH connections. There's no agent to install on the remote system, so all you +have to worry about is your application and your monitoring software. + +Ansible has some competition from the likes of [Puppet](https://puppet.com/) or [Chef](https://www.chef.io/), but the +most valuable feature about Ansible is that every is **idempotent**. From the [Ansible +glossary](https://docs.ansible.com/ansible/latest/reference_appendices/glossary.html) + +> An operation is idempotent if the result of performing it once is exactly the same as the result of performing it +> repeatedly without any intervening actions. + +Idempotency means you can run an Ansible playbook against your nodes any number of times without affecting how they +operate. When you deploy Netdata with Ansible, you're also deploying _monitoring as code_. + +In this guide, we'll walk through the process of using an [Ansible +playbook](https://github.com/netdata/community/tree/main/netdata-agent-deployment/ansible-quickstart) to automatically +deploy the Netdata Agent to any number of distributed nodes, manage the configuration of each node, and claim them to +your Netdata Cloud account. You'll go from some unmonitored nodes to a infrastructure monitoring solution in a matter of +minutes. + +## Prerequisites + +- A Netdata Cloud account. [Sign in and create one](https://app.netdata.cloud) if you don't have one already. +- An administration system with [Ansible](https://www.ansible.com/) installed. +- One or more nodes that your administration system can access via [SSH public + keys](https://git-scm.com/book/en/v2/Git-on-the-Server-Generating-Your-SSH-Public-Key) (preferably password-less). + +## Download and configure the playbook + +First, download the +[playbook](https://github.com/netdata/community/tree/main/netdata-agent-deployment/ansible-quickstart), move it to the +current directory, and remove the rest of the cloned repository, as it's not required for using the Ansible playbook. + +```bash +git clone https://github.com/netdata/community.git +mv community/netdata-agent-deployment/ansible-quickstart . +rm -rf community +``` + +Next, `cd` into the Ansible directory. + +```bash +cd ansible-quickstart +``` + +### Edit the `hosts` file + +The `hosts` file contains a list of IP addresses or hostnames that Ansible will try to run the playbook against. The +`hosts` file that comes with the repository contains two example IP addresses, which you should replace according to the +IP address/hostname of your nodes. + +```conf +203.0.113.0 hostname=node-01 +203.0.113.1 hostname=node-02 +``` + +You can also set the `hostname` variable, which appears both on the local Agent dashboard and Netdata Cloud, or you can +omit the `hostname=` string entirely to use the system's default hostname. + +#### Set the login user (optional) + +If you SSH into your nodes as a user other than `root`, you need to configure `hosts` according to those user names. Use +the `ansible_user` variable to set the login user. For example: + +```conf +203.0.113.0 hostname=ansible-01 ansible_user=example +``` + +#### Set your SSH key (optional) + +If you use an SSH key other than `~/.ssh/id_rsa` for logging into your nodes, you can set that on a per-node basis in +the `hosts` file with the `ansible_ssh_private_key_file` variable. For example, to log into a Lightsail instance using +two different SSH keys supplied by AWS. + +```conf +203.0.113.0 hostname=ansible-01 ansible_ssh_private_key_file=~/.ssh/LightsailDefaultKey-us-west-2.pem +203.0.113.1 hostname=ansible-02 ansible_ssh_private_key_file=~/.ssh/LightsailDefaultKey-us-east-1.pem +``` + +### Edit the `vars/main.yml` file + +In order to claim your node(s) to your Space in Netdata Cloud, and see all their metrics in real-time in [composite +charts](/docs/visualize/overview-infrastructure.md) or perform [Metric +Correlations](https://learn.netdata.cloud/docs/cloud/insights/metric-correlations), you need to set the `claim_token` +and `claim_room` variables. + +To find your `claim_token` and `claim_room`, go to Netdata Cloud, then click on your Space's name in the top navigation, +then click on **Manage your Space**. Click on the **Nodes** tab in the panel that appears, which displays a script with +`token` and `room` strings. + + + +Copy those strings into the `claim_token` and `claim_rooms` variables. + +```yml +claim_token: XXXXX +claim_rooms: XXXXX +``` + +Change the `dbengine_multihost_disk_space` if you want to change the metrics retention policy by allocating more or less +disk space for storing metrics. The default is 2048 Mib, or 2 GiB. + +Because we're claiming this node to Netdata Cloud, and will view its dashboards there instead of via the IP address or +hostname of the node, the playbook disables that local dashboard by setting `web_mode` to `none`. This gives a small +security boost by not allowing any unwanted access to the local dashboard. + +You can read more about this decision, or other ways you might lock down the local dashboard, in our [node security +doc](https://learn.netdata.cloud/docs/configure/secure-nodes). + +> Curious about why Netdata's dashboard is open by default? Read our [blog +> post](https://www.netdata.cloud/blog/netdata-agent-dashboard/) on that zero-configuration design decision. + +## Run the playbook + +Time to run the playbook from your administration system: + +```bash +ansible-playbook -i hosts tasks/main.yml +``` + +Ansible first connects to your node(s) via SSH, then [collects +facts](https://docs.ansible.com/ansible/latest/user_guide/playbooks_vars_facts.html#ansible-facts) about the system. +This playbook doesn't use these facts, but you could expand it to provision specific types of systems based on the +makeup of your infrastructure. + +Next, Ansible makes changes to each node according to the `tasks` defined in the playbook, and +[returns](https://docs.ansible.com/ansible/latest/reference_appendices/common_return_values.html#changed) whether each +task results in a changed, failure, or was skipped entirely. + +The task to install Netdata will take a few minutes per node, so be patient! Once the playbook reaches the claiming +task, your nodes start populating your Space in Netdata Cloud. + +## What's next? + +Go use Netdata! + +If you need a bit more guidance for how you can use Netdata for health monitoring and performance troubleshooting, see +our [documentation](https://learn.netdata.cloud/docs). It's designed like a comprehensive guide, based on what you might +want to do with Netdata, so use those categories to dive in. + +Some of the best places to start: + +- [Enable or configure a collector](/docs/collect/enable-configure.md) +- [Supported collectors list](/collectors/COLLECTORS.md) +- [See an overview of your infrastructure](/docs/visualize/overview-infrastructure.md) +- [Interact with dashboards and charts](/docs/visualize/interact-dashboards-charts.md) +- [Change how long Netdata stores metrics](/docs/store/change-metrics-storage.md) + +We're looking for more deployment and configuration management strategies, whether via Ansible or other +provisioning/infrastructure as code software, such as Chef or Puppet, in our [community +repo](https://github.com/netdata/community). Anyone is able to fork the repo and submit a PR, either to improve this +playbook, extend it, or create an entirely new experience for deploying Netdata across entire infrastructure. + +[](<>) diff --git a/docs/guides/export/export-netdata-metrics-graphite.md b/docs/guides/export/export-netdata-metrics-graphite.md new file mode 100644 index 000000000..9a4a4f5ca --- /dev/null +++ b/docs/guides/export/export-netdata-metrics-graphite.md @@ -0,0 +1,184 @@ +<!-- +title: Export and visualize Netdata metrics in Graphite +description: "Use Netdata to collect and export thousands of metrics to Graphite for long-term storage or further analysis." +image: /img/seo/guides/export/export-netdata-metrics-graphite.png +--> + +# Export and visualize Netdata metrics in Graphite + +Collecting metrics is an essential part of monitoring any application, service, or infrastructure, but it's not the +final step for any developer, sysadmin, SRE, or DevOps engineer who's keeping an eye on things. To take meaningful +action on these metrics, you may need to develop a stack of monitoring tools that work in parallel to help you diagnose +anomalies and discover root causes faster. + +We designed Netdata with interoperability in mind. The Agent collects thousands of metrics every second, and then what +you do with them is up to you. You can [store metrics in the database engine](/docs/guides/longer-metrics-storage.md), +or send them to another time series database for long-term storage or further analysis using Netdata's [exporting +engine](/docs/export/external-databases.md). + +In this guide, we'll show you how to export Netdata metrics to [Graphite](https://graphiteapp.org/) for long-term +storage and further analysis. Graphite is a free open-source software (FOSS) tool that collects graphs numeric +time-series data, such as all the metrics collected by the Netdata Agent itself. Using Netdata and Graphite together, +you get more visibility into the health and performance of your entire infrastructure. + +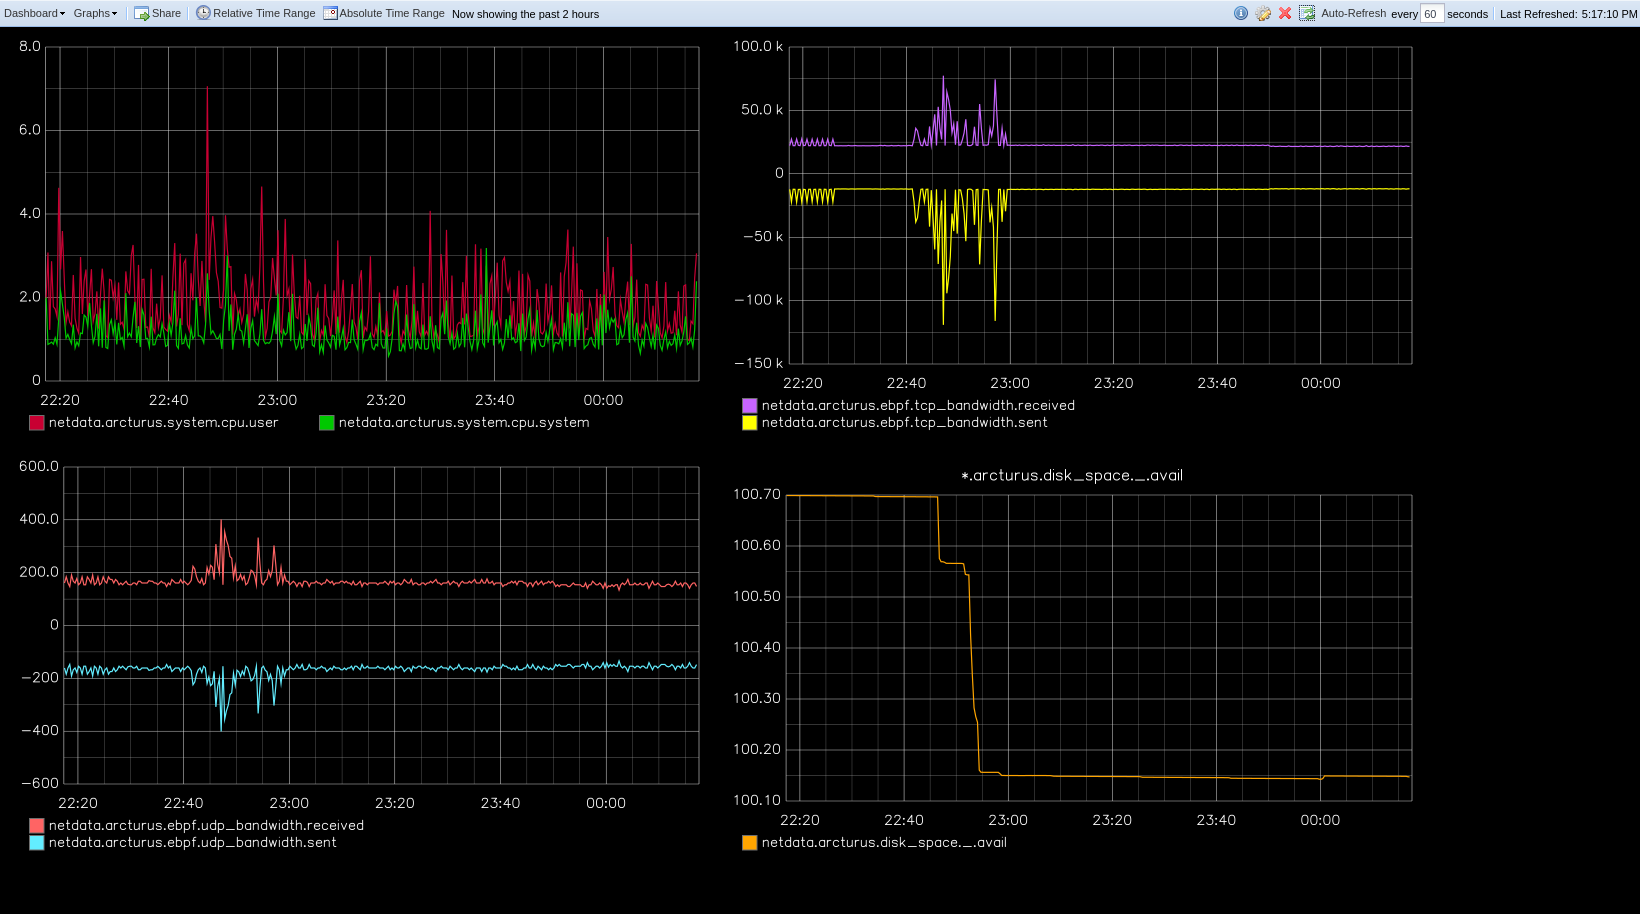 + +Let's get started. + +## Install the Netdata Agent + +If you don't have the Netdata Agent installed already, visit the [installation guide](/packaging/installer/README.md) +for the recommended instructions for your system. In most cases, you can use the one-line installation script: + +```bash +bash <(curl -Ss https://my-netdata.io/kickstart.sh) +``` + +Once installation finishes, open your browser and navigate to `http://NODE:19999`, replacing `NODE` with the IP address +or hostname of your system, to find the Agent dashboard. + +## Install Graphite via Docker + +For this guide, we'll install Graphite using Docker. See the [Docker documentation](https://docs.docker.com/get-docker/) +for details if you don't yet have it installed on your system. + +> If you already have Graphite installed, skip this step. If you want to install via a different method, see the +> [Graphite installation docs](https://graphite.readthedocs.io/en/latest/install.html), with the caveat that some +> configuration settings may be different. + +Start up the Graphite image with `docker run`. + +```bash +docker run -d \ + --name graphite \ + --restart=always \ + -p 80:80 \ + -p 2003-2004:2003-2004 \ + -p 2023-2024:2023-2024 \ + -p 8125:8125/udp \ + -p 8126:8126 \ + graphiteapp/graphite-statsd +``` + +Open your browser and navigate to `http://NODE`, to see the Graphite interface. Nothing yet, but we'll fix that soon +enough. + + + +## Enable the Graphite exporting connector + +You're now ready to begin exporting Netdata metrics to Graphite. + +Begin by using `edit-config` to open the `exporting.conf` file. + +```bash +cd /etc/netdata # Replace this path with your Netdata config directory +sudo ./edit-config exporting.conf +``` + +If you haven't already, enable the exporting engine by setting `enabled` to `yes` in the `[exporting:global]` section. + +```conf +[exporting:global] + enabled = yes +``` + +Next, configure the connector. Find the `[graphite:my_graphite_instance]` example section and uncomment the line. +Replace `my_graphite_instance` with a name of your choice. Let's go with `[graphite:netdata]`. Set `enabled` to `yes` +and uncomment the line. Your configuration should now look like this: + +```conf +[graphite:netdata] + enabled = yes + # destination = localhost + # data source = average + # prefix = netdata + # hostname = my_hostname + # update every = 10 + # buffer on failures = 10 + # timeout ms = 20000 + # send names instead of ids = yes + # send charts matching = * + # send hosts matching = localhost * +``` + +Set the `destination` setting to `localhost:2003`. By default, the Docker image for Graphite listens on port `2003` for +incoming metrics. If you installed Graphite a different way, or tweaked the `docker run` command, you may need to change +the port accordingly. + +```conf +[graphite:netdata] + enabled = yes + destination = localhost:2003 + ... +``` + +We'll not worry about the rest of the settings for now. Restart the Agent using `sudo service netdata restart`, or the +appropriate method for your system, to spin up the exporting engine. + +## See and organize Netdata metrics in Graphite + +Head back to the Graphite interface again, then click on the **Dashboard** link to get started with Netdata's exported +metrics. You can also navigate directly to `http://NODE/dashboard`. + +Let's switch the interface to help you understand which metrics Netdata is exporting to Graphite. Click on **Dashboard** +and **Configure UI**, then choose the **Tree** option. Refresh your browser to change the UI. + +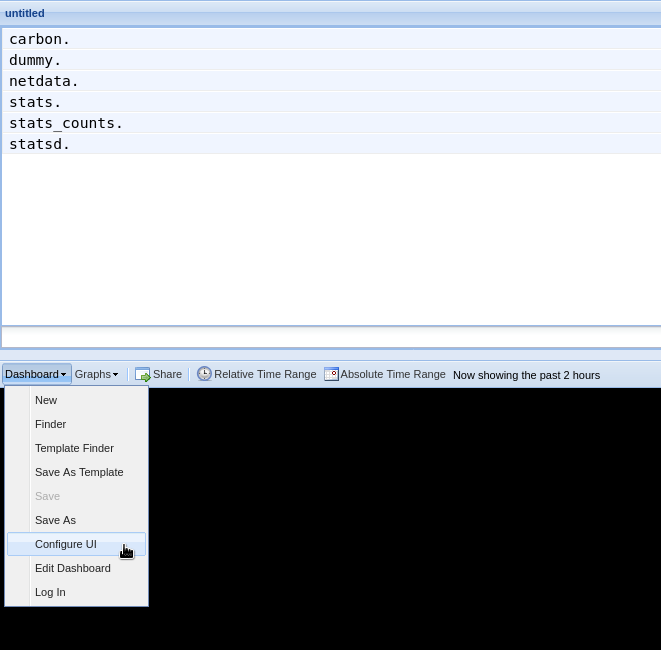 + +You should now see a tree of available contexts, including one that matches the hostname of the Agent exporting metrics. +In this example, the Agent's hostname is `arcturus`. + +Let's add some system CPU charts so you can monitor the long-term health of your system. Click through the tree to find +**hostname → system → cpu** metrics, then click on the **user** context. A chart with metrics from that context appears +in the dashboard. Add a few other system CPU charts to flesh things out. + +Next, let's combine one or two of these charts. Click and drag one chart onto the other, and wait until the green **Drop +to merge** dialog appears. Release to merge the charts. + +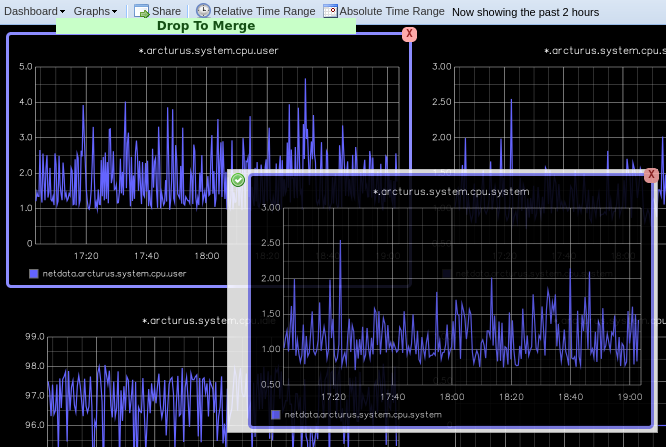 + +Finally, save your dashboard. Click **Dashboard**, then **Save As**, then choose a name. Your dashboard is now saved. + +Of course, this is just the beginning of the customization you can do with Graphite. You can change the time range, +share your dashboard with others, or use the composer to customize the size and appearance of specific charts. Learn +more about adding, modifying, and combining graphs in the [Graphite +docs](https://graphite.readthedocs.io/en/latest/dashboard.html). + +## Monitor the exporting engine + +As soon as the exporting engine begins, Netdata begins reporting metrics about the system's health and performance. + +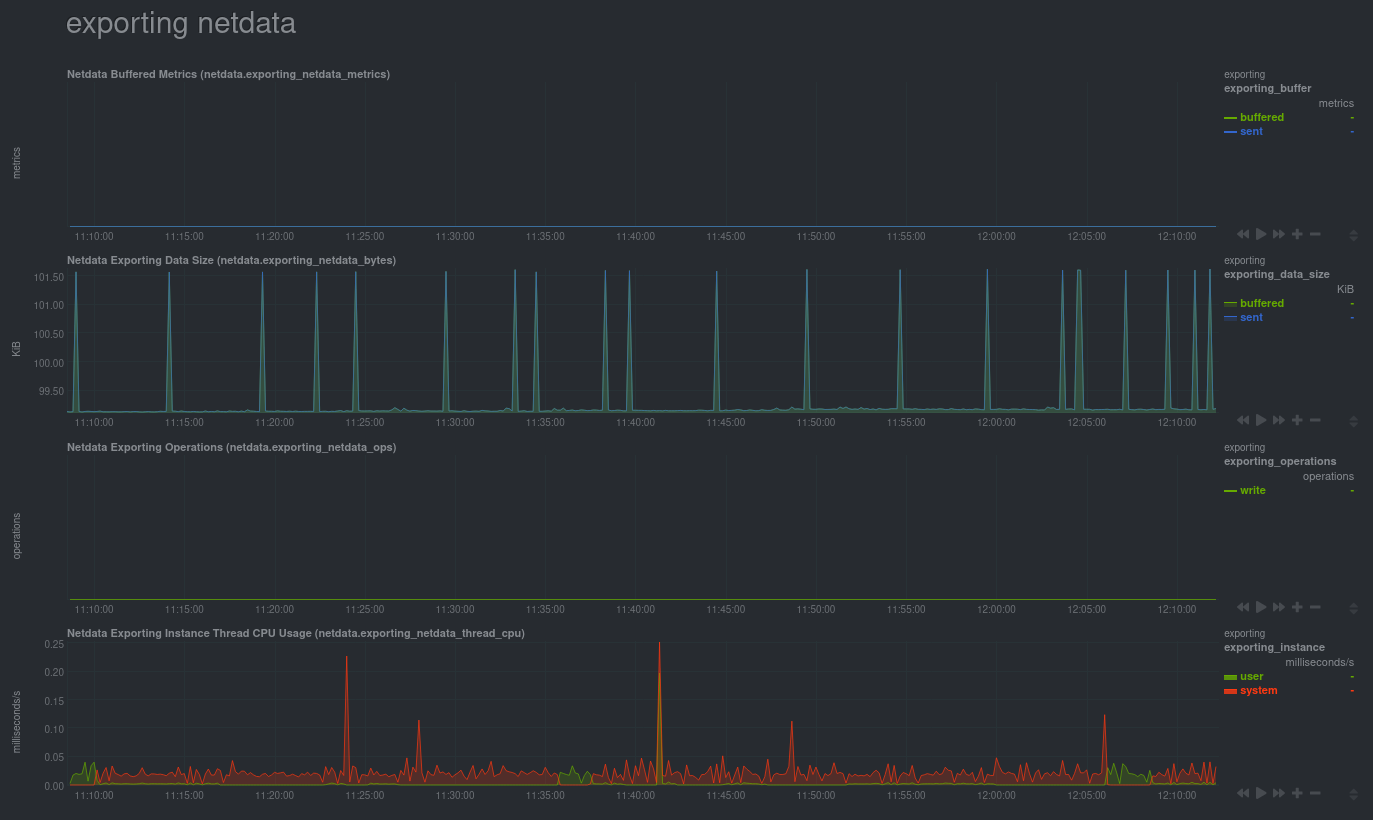 + +You can use these charts to verify that Netdata is properly exporting metrics to Graphite. You can even add these +exporting charts to your Graphite dashboard! + +### Add exporting charts to Netdata Cloud + +You can also show these exporting engine metrics on Netdata Cloud. If you don't have an account already, go [sign +in](https://app.netdata.cloud) and get started for free. If you need some help along the way, read the [get started with +Cloud guide](https://learn.netdata.cloud/docs/cloud/get-started). + +Add more metrics to a War Room's Nodes view by clicking on the **Add metric** button, then typing `exporting` into the +context field. Choose the exporting contexts you want to add, then click **Add**. You'll see these charts alongside any +others you've customized in Netdata Cloud. + +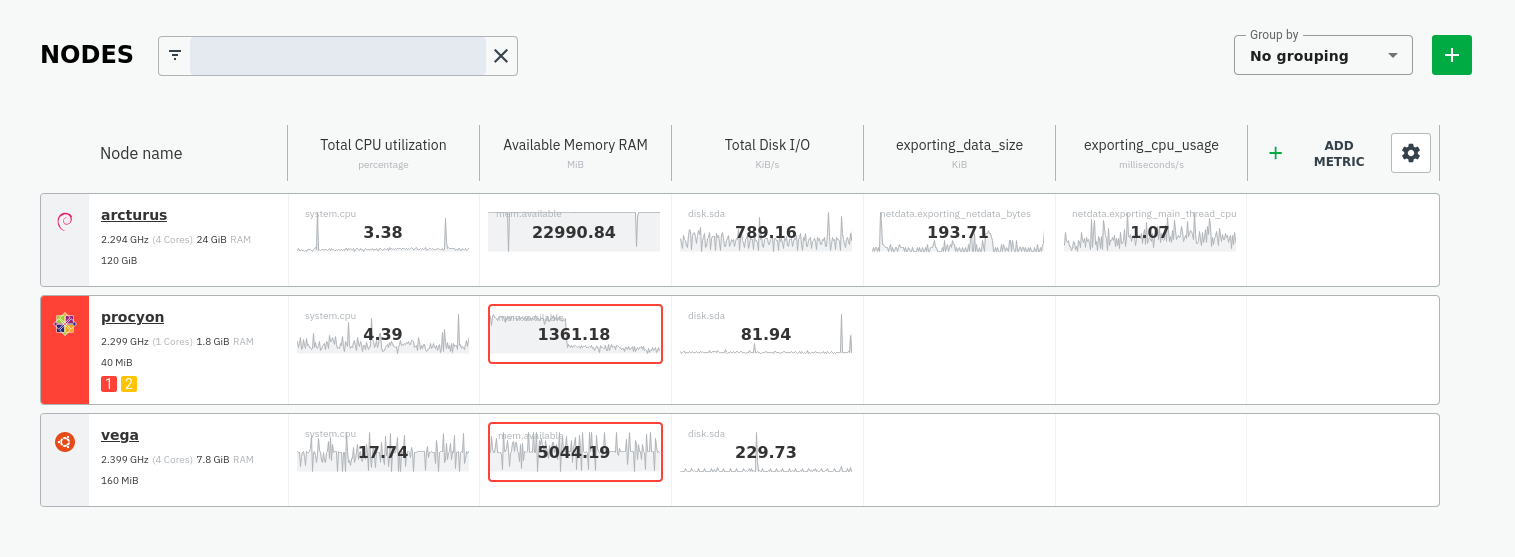 + +## What's next? + +What you do with your exported metrics is entirely up to you, but as you might have seen in the Graphite connector +configuration block, there are many other ways to tweak and customize which metrics you export to Graphite and how +often. + +For full details about each configuration option and what it does, see the [exporting reference +guide](/exporting/README.md). + +[](<>) diff --git a/docs/tutorials/longer-metrics-storage.md b/docs/guides/longer-metrics-storage.md index fb64ca01e..85b397f6d 100644 --- a/docs/tutorials/longer-metrics-storage.md +++ b/docs/guides/longer-metrics-storage.md @@ -1,13 +1,19 @@ +<!-- +title: "Change how long Netdata stores metrics" +description: "With a single configuration change, the Netdata Agent can store days, weeks, or months of metrics at its famous per-second granularity." +custom_edit_url: https://github.com/netdata/netdata/edit/master/docs/guides/longer-metrics-storage.md +--> + # Change how long Netdata stores metrics Netdata helps you collect thousands of system and application metrics every second, but what about storing them for the long term? -Many people think Netdata can only store about an hour's worth of real-time metrics, but that's just the default -configuration today. With the right settings, Netdata is quite capable of efficiently storing hours or days worth of -historical, per-second metrics without having to rely on a [backend](../../backends/). +Many people think Netdata can only store about an hour's worth of real-time metrics, but that's simply not true any +more. With the right settings, Netdata is quite capable of efficiently storing hours or days worth of historical, +per-second metrics without having to rely on an [exporting engine](/docs/export/external-databases.md). -This tutorial gives two options for configuring Netdata to store more metrics. **We recommend the default [database +This guide gives two options for configuring Netdata to store more metrics. **We recommend the default [database engine](#using-the-database-engine)**, but you can stick with or switch to the round-robin database if you prefer. Let's get started. @@ -29,9 +35,6 @@ using, check out your `netdata.conf` file and look for the `memory mode` setting If `memory mode` is set to anything but `dbengine`, change it and restart Netdata using the standard command for restarting services on your system. You're now using the database engine! -> Learn more about how we implemented the database engine, and our vision for its future, on our blog: [_How and why -> we're bringing long-term storage to Netdata_](https://blog.netdata.cloud/posts/db-engine/). - What makes the database engine efficient? While it's structured like a traditional database, the database engine splits data between RAM and disk. The database engine caches and indexes data on RAM to keep memory usage low, and then compresses older metrics onto disk for long-term storage. @@ -40,24 +43,23 @@ When the Netdata dashboard queries for historical metrics, the database engine w return relevant metrics for visualization in charts. Now, given that the database engine uses _both_ RAM and disk, there are two other settings to consider: `page cache -size` and `dbengine disk space`. +size` and `dbengine multihost disk space`. ```conf [global] page cache size = 32 - dbengine disk space = 256 + dbengine multihost disk space = 256 ``` `page cache size` sets the maximum amount of RAM (in MiB) the database engine will use for caching and indexing. -`dbengine disk space` sets the maximum disk space (again, in MiB) the database engine will use for storing compressed -metrics. - -Based on our testing, these default settings will retain about a day's worth of metrics when Netdata collects roughly -4,000 metrics every second. If you increase either `page cache size` or `dbengine disk space`, Netdata will retain even -more historical metrics. +`dbengine multihost disk space` sets the maximum disk space (again, in MiB) the database engine will use for storing +compressed metrics. The default settings retain about two day's worth of metrics on a system collecting 2,000 metrics +every second. -But before you change these options too dramatically, read up on the [database engine's memory -footprint](../../database/engine/README.md#memory-requirements). +[**See our database engine +calculator**](/docs/store/change-metrics-storage.md#calculate-the-system-resources-RAM-disk-space-needed-to-store-metrics) +to help you correctly set `dbengine multihost disk space` based on your needs. The calculator gives an accurate estimate +based on how many child nodes you have, how many metrics your Agent collects, and more. With the database engine active, you can back up your `/var/cache/netdata/dbengine/` folder to another location for redundancy. @@ -150,9 +152,9 @@ Now that you have either configured database engine or round-robin database engi probably want to see it in action! For more information about how to pan charts to view historical metrics, see our documentation on [using -charts](../../web/README.md#using-charts). +charts](/web/README.md#using-charts). -And if you'd now like to reduce Netdata's resource usage, view our [performance guide](../../docs/Performance.md) for -our best practices on optimization. +And if you'd now like to reduce Netdata's resource usage, view our [performance +guide](/docs/guides/configure/performance.md) for our best practices on optimization. -[](<>) +[](<>) diff --git a/docs/guides/monitor-cockroachdb.md b/docs/guides/monitor-cockroachdb.md new file mode 100644 index 000000000..fd0e7db64 --- /dev/null +++ b/docs/guides/monitor-cockroachdb.md @@ -0,0 +1,136 @@ +<!-- +title: "Monitor CockroachDB metrics with Netdata" +custom_edit_url: https://github.com/netdata/netdata/edit/master/docs/guides/monitor-cockroachdb.md +--> + +# Monitor CockroachDB metrics with Netdata + +[CockroachDB](https://github.com/cockroachdb/cockroach) is an open-source project that brings SQL databases into +scalable, disaster-resilient cloud deployments. Thanks to a [new CockroachDB +collector](https://learn.netdata.cloud/docs/agent/collectors/go.d.plugin/modules/cockroachdb/) released in +[v1.20](https://blog.netdata.cloud/posts/release-1.20/), you can now monitor any number of CockroachDB databases with +maximum granularity using Netdata. Collect more than 50 unique metrics and put them on interactive visualizations +designed for better visual anomaly detection. + +Netdata itself uses CockroachDB as part of its Netdata Cloud infrastructure, so we're happy to introduce this new +collector and help others get started with it straightaway. + +Let's dive in and walk through the process of monitoring CockroachDB metrics with Netdata. + +## What's in this guide + +- [Configure the CockroachDB collector](#configure-the-cockroachdb-collector) + - [Manual setup for a local CockroachDB database](#manual-setup-for-a-local-cockroachdb-database) +- [Tweak CockroachDB alarms](#tweak-cockroachdb-alarms) + +## Configure the CockroachDB collector + +Because _all_ of Netdata's collectors can auto-detect the services they monitor, you _shouldn't_ need to worry about +configuring CockroachDB. Netdata only needs to regularly query the database's `_status/vars` page to gather metrics and +display them on the dashboard. + +If your CockroachDB instance is accessible through `http://localhost:8080/` or `http://127.0.0.1:8080`, your setup is +complete. Restart Netdata with `service netdata restart`, or use the [appropriate +method](../getting-started.md#start-stop-and-restart-netdata) for your system, and refresh your browser. You should see +CockroachDB metrics in your Netdata dashboard! + +<figure> + <img src="https://user-images.githubusercontent.com/1153921/73564467-d7e36b00-441c-11ea-9ec9-b5d5ea7277d4.png" alt="CPU utilization charts from a CockroachDB database monitored by Netdata" /> + <figcaption>CPU utilization charts from a CockroachDB database monitored by Netdata</figcaption> +</figure> + +> Note: Netdata collects metrics from CockroachDB every 10 seconds, instead of our usual 1 second, because CockroachDB +> only updates `_status/vars` every 10 seconds. You can't change this setting in CockroachDB. + +If you don't see CockroachDB charts, you may need to configure the collector manually. + +### Manual setup for a local CockroachDB database + +To configure Netdata's CockroachDB collector, navigate to your Netdata configuration directory (typically at +`/etc/netdata/`) and use `edit-config` to initialize and edit your CockroachDB configuration file. + +```bash +cd /etc/netdata/ # Replace with your Netdata configuration directory, if not /etc/netdata/ +./edit-config go.d/cockroachdb.conf +``` + +Scroll down to the `[JOBS]` section at the bottom of the file. You will see the two default jobs there, which you can +edit, or create a new job with any of the parameters listed above in the file. Both the `name` and `url` values are +required, and everything else is optional. + +For a production cluster, you'll use either an IP address or the system's hostname. Be sure that your remote system +allows TCP communication on port 8080, or whichever port you have configured CockroachDB's [Admin +UI](https://www.cockroachlabs.com/docs/stable/monitoring-and-alerting.html#prometheus-endpoint) to listen on. + +```yaml +# [ JOBS ] +jobs: + - name: remote + url: http://203.0.113.0:8080/_status/vars + + - name: remote_hostname + url: http://cockroachdb.example.com:8080/_status/vars +``` + +For a secure cluster, use `https` in the `url` field instead. + +```yaml +# [ JOBS ] +jobs: + - name: remote + url: https://203.0.113.0:8080/_status/vars + tls_skip_verify: yes # If your certificate is self-signed + + - name: remote_hostname + url: https://cockroachdb.example.com:8080/_status/vars + tls_skip_verify: yes # If your certificate is self-signed +``` + +You can add as many jobs as you'd like based on how many CockroachDB databases you have—Netdata will create separate +charts for each job. Once you've edited `cockroachdb.conf` according to the needs of your infrastructure, restart +Netdata to see your new charts. + +<figure> + <img src="https://user-images.githubusercontent.com/1153921/73564469-d7e36b00-441c-11ea-8333-02ba0e1c294c.png" alt="Charts showing a node failure during a simulated test" /> + <figcaption>Charts showing a node failure during a simulated test</figcaption> +</figure> + +## Tweak CockroachDB alarms + +This release also includes eight pre-configured alarms for live nodes, such as whether the node is live, storage +capacity, issues with replication, and the number of SQL connections/statements. See [health.d/cockroachdb.conf on +GitHub](https://raw.githubusercontent.com/netdata/netdata/master/health/health.d/cockroachdb.conf) for details. + +You can also edit these files directly with `edit-config`: + +```bash +cd /etc/netdata/ # Replace with your Netdata configuration directory, if not /etc/netdata/ +./edit-config health.d/cockroachdb.conf # You may need to use `sudo` for write privileges +``` + +For more information about editing the defaults or writing new alarm entities, see our health monitoring [quickstart +guide](/health/QUICKSTART.md). + +## What's next? + +Now that you're collecting metrics from your CockroachDB databases, let us know how it's working for you! There's always +room for improvement or refinement based on real-world use cases. Feel free to [file an +issue](https://github.com/netdata/netdata/issues/new?labels=bug%2C+needs+triage&template=bug_report.md) with your +thoughts. + +Also, be sure to check out these useful resources: + +- [Netdata's CockroachDB + documentation](https://learn.netdata.cloud/docs/agent/collectors/go.d.plugin/modules/cockroachdb/) +- [Netdata's CockroachDB + configuration](https://github.com/netdata/go.d.plugin/blob/master/config/go.d/cockroachdb.conf) +- [Netdata's CockroachDB + alarms](https://github.com/netdata/netdata/blob/29d9b5e51603792ee27ef5a21f1de0ba8e130158/health/health.d/cockroachdb.conf) +- [CockroachDB homepage](https://www.cockroachlabs.com/product/) +- [CockroachDB documentation](https://www.cockroachlabs.com/docs/stable/) +- [`_status/vars` endpoint + docs](https://www.cockroachlabs.com/docs/stable/monitoring-and-alerting.html#prometheus-endpoint) +- [Monitor CockroachDB with + Prometheus](https://www.cockroachlabs.com/docs/stable/monitor-cockroachdb-with-prometheus.html) + +[](<>) diff --git a/docs/tutorials/monitor-hadoop-cluster.md b/docs/guides/monitor-hadoop-cluster.md index f5f3315ad..1ca2c03e1 100644 --- a/docs/tutorials/monitor-hadoop-cluster.md +++ b/docs/guides/monitor-hadoop-cluster.md @@ -1,3 +1,8 @@ +<!-- +title: "Monitor a Hadoop cluster with Netdata" +custom_edit_url: https://github.com/netdata/netdata/edit/master/docs/guides/monitor-hadoop-cluster.md +--> + # Monitor a Hadoop cluster with Netdata Hadoop is an [Apache project](https://hadoop.apache.org/) is a framework for processing large sets of data across a @@ -10,16 +15,16 @@ implementations. Netdata comes with built-in and pre-configured support for monitoring both HDFS and Zookeeper. -This tutorial assumes you have a Hadoop cluster, with HDFS and Zookeeper, running already. If you don't, please follow +This guide assumes you have a Hadoop cluster, with HDFS and Zookeeper, running already. If you don't, please follow the [official Hadoop instructions](http://hadoop.apache.org/docs/stable/hadoop-project-dist/hadoop-common/SingleCluster.html) or an alternative, like the guide available from [DigitalOcean](https://www.digitalocean.com/community/tutorials/how-to-install-hadoop-in-stand-alone-mode-on-ubuntu-18-04). -For more specifics on the collection modules used in this tutorial, read the respective pages in our documentation: +For more specifics on the collection modules used in this guide, read the respective pages in our documentation: -- [HDFS](../../collectors/go.d.plugin/modules/hdfs/README.md) -- [Zookeeper](../../collectors/go.d.plugin/modules/zookeeper/README.md) +- [HDFS](https://learn.netdata.cloud/docs/agent/collectors/go.d.plugin/modules/hdfs) +- [Zookeeper](https://learn.netdata.cloud/docs/agent/collectors/go.d.plugin/modules/zookeeper) ## Set up your HDFS and Zookeeper installations @@ -91,7 +96,7 @@ al-9866", If Netdata can't access the `/jmx` endpoint for either a NameNode or DataNode, it will not be able to auto-detect and collect metrics from your HDFS implementation. -Zookeeper auto-detection relies on an accessible client port and a whitelisted `mntr` command. For more details on +Zookeeper auto-detection relies on an accessible client port and a allow-listed `mntr` command. For more details on `mntr`, see Zookeeper's documentation on [cluster options](https://zookeeper.apache.org/doc/current/zookeeperAdmin.html#sc_clusterOptions) and [Zookeeper commands](https://zookeeper.apache.org/doc/current/zookeeperAdmin.html#sc_zkCommands). @@ -181,7 +186,7 @@ sudo /etc/netdata/edit-config health.d/zookeeper.conf ``` For more information about editing the defaults or writing new alarm entities, see our [health monitoring -documentation](../../health/README.md). +documentation](/health/README.md). ## What's next? @@ -196,4 +201,4 @@ issue](https://github.com/netdata/netdata/issues/new?labels=bug%2C+needs+triage& file](https://github.com/netdata/go.d.plugin/blob/master/config/go.d/zookeeper.conf) to understand how to configure global options or per-job options, timeouts, TLS certificates, and more. -[](<>) +[](<>) diff --git a/docs/guides/monitor/anomaly-detection.md b/docs/guides/monitor/anomaly-detection.md new file mode 100644 index 000000000..bb9dbc829 --- /dev/null +++ b/docs/guides/monitor/anomaly-detection.md @@ -0,0 +1,191 @@ +<!-- +title: "Detect anomalies in systems and applications" +description: "Detect anomalies in any system, container, or application in your infrastructure with machine learning and the open-source Netdata Agent." +image: /img/seo/guides/monitor/anomaly-detection.png +author: "Joel Hans" +author_title: "Editorial Director, Technical & Educational Resources" +author_img: "/img/authors/joel-hans.jpg" +custom_edit_url: https://github.com/netdata/netdata/edit/master/docs/guides/monitor/anomaly-detection.md +--> + +# Detect anomalies in systems and applications + +Beginning with v1.27, the [open-source Netdata Agent](https://github.com/netdata/netdata) is capable of unsupervised +[anomaly detection](https://en.wikipedia.org/wiki/Anomaly_detection) with machine learning (ML). As with all things +Netdata, the anomalies collector comes with preconfigured alarms and instant visualizations that require no query +languages or organizing metrics. You configure the collector to look at specific charts, and it handles the rest. + +Netdata's implementation uses a handful of functions in the [Python Outlier Detection (PyOD) +library](https://github.com/yzhao062/pyod/tree/master), which periodically runs a `train` function that learns what +"normal" looks like on your node and creates an ML model for each chart, then utilizes the +[`predict_proba()`](https://pyod.readthedocs.io/en/latest/api_cc.html#pyod.models.base.BaseDetector.predict_proba) and +[`predict()`](https://pyod.readthedocs.io/en/latest/api_cc.html#pyod.models.base.BaseDetector.predict) PyOD functions to +quantify how anomalous certain charts are. + +All these metrics and alarms are available for centralized monitoring in [Netdata Cloud](https://app.netdata.cloud). If +you choose to sign up for Netdata Cloud and [claim your nodes](/claim/README.md), you will have the ability to run +tailored anomaly detection on every node in your infrastructure, regardless of its purpose or workload. + +In this guide, you'll learn how to set up the anomalies collector to instantly detect anomalies in an Nginx web server +and/or the node that hosts it, which will give you the tools to configure parallel unsupervised monitors for any +application in your infrastructure. Let's get started. + +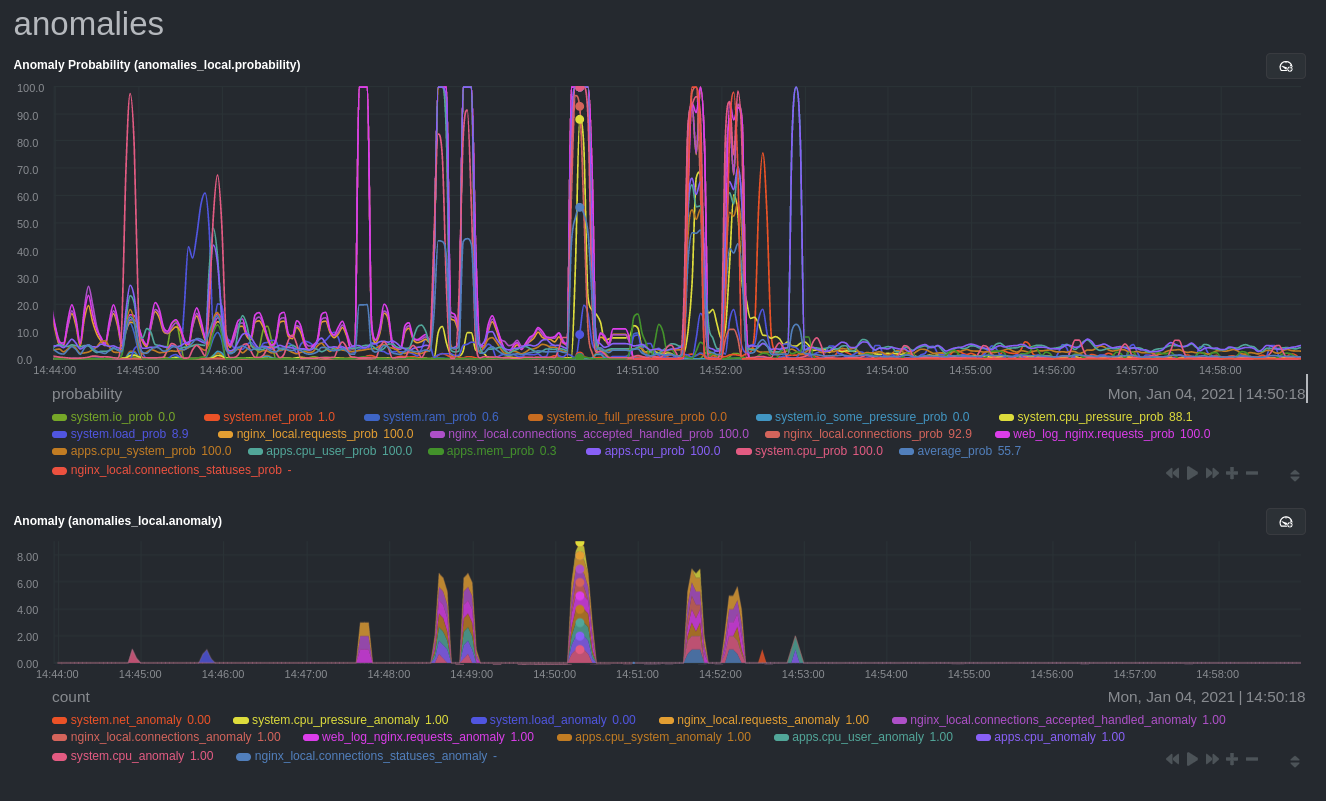 + +## Prerequisites + +- A node running the Netdata Agent. If you don't yet have that, [get Netdata](/docs/get/README.md). +- A Netdata Cloud account. [Sign up](https://app.netdata.cloud) if you don't have one already. +- Familiarity with configuring the Netdata Agent with [`edit-config`](/docs/configure/nodes.md). +- _Optional_: An Nginx web server running on the same node to follow the example configuration steps. + +## Install required Python packages + +The anomalies collector uses a few Python packages, available with `pip3`, to run ML training. It requires +[`numba`](http://numba.pydata.org/), [`scikit-learn`](https://scikit-learn.org/stable/), +[`pyod`](https://pyod.readthedocs.io/en/latest/), in addition to +[`netdata-pandas`](https://github.com/netdata/netdata-pandas), which is a package built by the Netdata team to pull data +from a Netdata Agent's API into a [Pandas](https://pandas.pydata.org/). Read more about `netdata-pandas` on its [package +repo](https://github.com/netdata/netdata-pandas) or in Netdata's [community +repo](https://github.com/netdata/community/tree/main/netdata-agent-api/netdata-pandas). + +```bash +# Become the netdata user +sudo su -s /bin/bash netdata + +# Install required packages for the netdata user +pip3 install --user netdata-pandas==0.0.32 numba==0.50.1 scikit-learn==0.23.2 pyod==0.8.3 +``` + +> If the `pip3` command fails, you need to install it. For example, on an Ubuntu system, use `sudo apt install +> python3-pip`. + +Use `exit` to become your normal user again. + +## Enable the anomalies collector + +Navigate to your [Netdata config directory](/docs/configure/nodes.md#the-netdata-config-directory) and use `edit-config` +to open the `python.d.conf` file. + +```bash +sudo ./edit-config python.d.conf +``` + +In `python.d.conf` file, search for the `anomalies` line. If the line exists, set the value to `yes`. Add the line +yourself if it doesn't already exist. Either way, the final result should look like: + +```conf +anomalies: yes +``` + +[Restart the Agent](/docs/configure/start-stop-restart.md) with `sudo systemctl restart netdata` to start up the +anomalies collector. By default, the model training process runs every 30 minutes, and uses the previous 4 hours of +metrics to establish a baseline for health and performance across the default included charts. + +> 💡 The anomaly collector may need 30-60 seconds to finish its initial training and have enough data to start +> generating anomaly scores. You may need to refresh your browser tab for the **Anomalies** section to appear in menus +> on both the local Agent dashboard or Netdata Cloud. + +## Configure the anomalies collector + +Open `python.d/anomalies.conf` with `edit-conf`. + +```bash +sudo ./edit-config python.d/anomalies.conf +``` + +The file contains many user-configurable settings with sane defaults. Here are some important settings that don't +involve tweaking the behavior of the ML training itself. + +- `charts_regex`: Which charts to train models for and run anomaly detection on, with each chart getting a separate + model. +- `charts_to_exclude`: Specific charts, selected by the regex in `charts_regex`, to exclude. +- `train_every_n`: How often to train the ML models. +- `train_n_secs`: The number of historical observations to train each model on. The default is 4 hours, but if your node + doesn't have historical metrics going back that far, consider [changing the metrics retention + policy](/docs/store/change-metrics-storage.md) or reducing this window. +- `custom_models`: A way to define custom models that you want anomaly probabilities for, including multi-node or + streaming setups. More on custom models in part 3 of this guide series. + +> ⚠️ Setting `charts_regex` with many charts or `train_n_secs` to a very large number will have an impact on the +> resources and time required to train a model for every chart. The actual performance implications depend on the +> resources available on your node. If you plan on changing these settings beyond the default, or what's mentioned in +> this guide, make incremental changes to observe the performance impact. Considering `train_max_n` to cap the number of +> observations actually used to train on. + +### Run anomaly detection on Nginx and log file metrics + +As mentioned above, this guide uses an Nginx web server to demonstrate how the anomalies collector works. You must +configure the collector to monitor charts from the +[Nginx](https://learn.netdata.cloud/docs/agent/collectors/go.d.plugin/modules/nginx) and [web +log](https://learn.netdata.cloud/docs/agent/collectors/go.d.plugin/modules/weblog) collectors. + +`charts_regex` allows for some basic regex, such as wildcards (`*`) to match all contexts with a certain pattern. For +example, `system\..*` matches with any chart wit ha context that begins with `system.`, and ends in any number of other +characters (`.*`). Note the escape character (`\`) around the first period to capture a period character exactly, and +not any character. + +Change `charts_regex` in `anomalies.conf` to the following: + +```conf + charts_regex: 'system\..*|nginx_local\..*|web_log_nginx\..*|apps.cpu|apps.mem' +``` + +This value tells the anomaly collector to train against every `system.` chart, every `nginx_local` chart, every +`web_log_nginx` chart, and specifically the `apps.cpu` and `apps.mem` charts. + +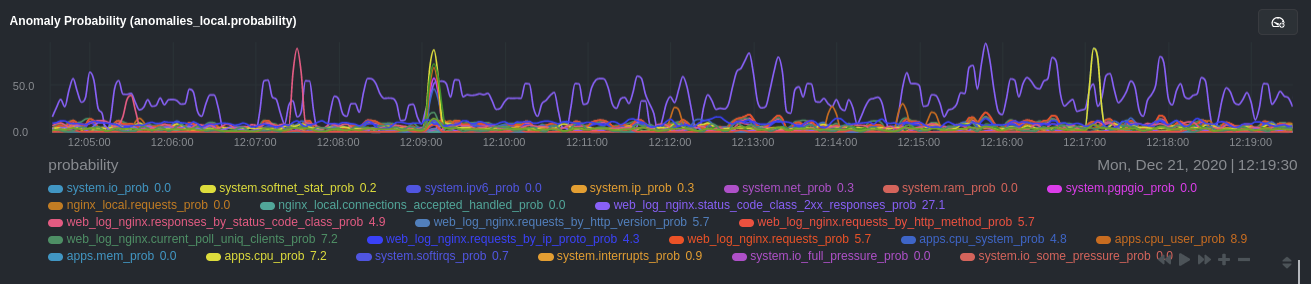 + +### Remove some metrics from anomaly detection + +As you can see in the above screenshot, this node is now looking for anomalies in many places. The result is a single +`anomalies_local.probability` chart with more than twenty dimensions, some of which the dashboard hides at the bottom of +a scroll-able area. In addition, training and analyzing the anomaly collector on many charts might require more CPU +utilization that you're willing to give. + +First, explicitly declare which `system.` charts to monitor rather than of all of them using regex (`system\..*`). + +```conf + charts_regex: 'system\.cpu|system\.load|system\.io|system\.net|system\.ram|nginx_local\..*|web_log_nginx\..*|apps.cpu|apps.mem' +``` + +Next, remove some charts with the `charts_to_exclude` setting. For this example, using an Nginx web server, focus on the +volume of requests/responses, not, for example, which type of 4xx response a user might receive. + +```conf + charts_to_exclude: 'web_log_nginx.excluded_requests,web_log_nginx.responses_by_status_code_class,web_log_nginx.status_code_class_2xx_responses,web_log_nginx.status_code_class_4xx_responses,web_log_nginx.current_poll_uniq_clients,web_log_nginx.requests_by_http_method,web_log_nginx.requests_by_http_version,web_log_nginx.requests_by_ip_proto' +``` + +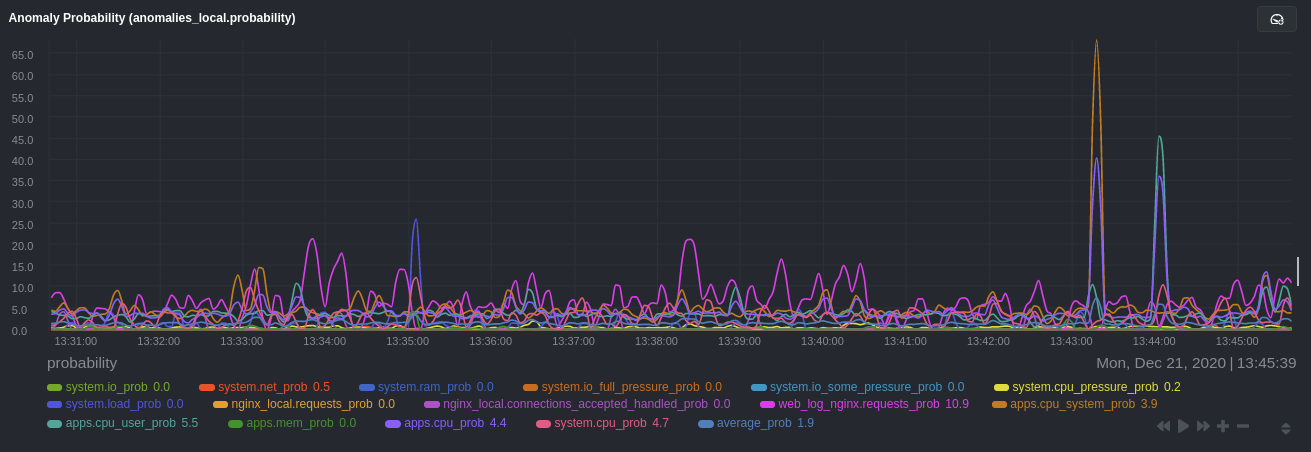 + +Apply the ideas behind the collector's regex and exclude settings to any other +[system](/docs/collect/system-metrics.md), [container](/docs/collect/container-metrics.md), or +[application](/docs/collect/application-metrics.md) metrics you want to detect anomalies for. + +## What's next? + +Now that you know how to set up unsupervised anomaly detection in the Netdata Agent, using an Nginx web server as an +example, it's time to apply that knowledge to other mission-critical parts of your infrastructure. If you're not sure +what to monitor next, check out our list of [collectors](/collectors/COLLECTORS.md) to see what kind of metrics Netdata +can collect from your systems, containers, and applications. + +For a more user-friendly anomaly detection experience, try out the [Metric +Correlations](https://learn.netdata.cloud/docs/cloud/insights/metric-correlations) feature in Netdata Cloud. Metric +Correlations runs only at your requests, removing unrelated charts from the dashboard to help you focus on root cause +analysis. + +Stay tuned for the next two parts of this guide, which provide more real-world context for the anomalies collector. +First, maximize the immediate value you get from anomaly detection by tracking preconfigured alarms, visualizing +anomalies in charts, and building a new dashboard tailored to your applications. Then, learn about creating custom ML +models, which help you holistically monitor an application or service by monitoring anomalies across a _cluster of +charts_. + +### Related reference documentation + +- [Netdata Agent · Anomalies collector](/collectors/python.d.plugin/anomalies/README.md) +- [Netdata Cloud · Metric Correlations](https://learn.netdata.cloud/docs/cloud/insights/metric-correlations) + +[](<>) diff --git a/docs/tutorials/dimension-templates.md b/docs/guides/monitor/dimension-templates.md index 741a8d70d..da1faed8b 100644 --- a/docs/tutorials/dimension-templates.md +++ b/docs/guides/monitor/dimension-templates.md @@ -1,25 +1,30 @@ +<!-- +title: "Use dimension templates to create dynamic alarms" +custom_edit_url: https://github.com/netdata/netdata/edit/master/docs/monitor/health/dimension-templates.md +--> + # Use dimension templates to create dynamic alarms Your ability to monitor the health of your systems and applications relies on your ability to create and maintain the best set of alarms for your particular needs. In v1.18 of Netdata, we introduced **dimension templates** for alarms, which simplifies the process of writing [alarm -entities](../../health/README.md#entities-in-the-health-files) for charts with many dimensions. +entities](/health/REFERENCE.md#health-entity-reference) for charts with many dimensions. Dimension templates can condense many individual entities into one—no more copy-pasting one entity and changing the `alarm`/`template` and `lookup` lines for each dimension you'd like to monitor. They are, however, an advanced health monitoring feature. For more basic instructions on creating your first alarm, -check out our [health monitoring documentation](../../health/), which also includes -[examples](../../health/README.md#examples). +check out our [health monitoring documentation](/health/README.md), which also includes +[examples](/health/REFERENCE.md#example-alarms). ## The fundamentals of `foreach` Our dimension templates update creates a new `foreach` parameter to the existing [`lookup` -line](../../health/README.md#alarm-line-lookup). This is where the magic happens. +line](/health/REFERENCE.md#alarm-line-lookup). This is where the magic happens. You use the `foreach` parameter to specify which dimensions you want to monitor with this single alarm. You can separate -them with a comma (`,`) or a pipe (`|`). You can also use a [Netdata simple pattern](../../libnetdata/simple_pattern/README.md) +them with a comma (`,`) or a pipe (`|`). You can also use a [Netdata simple pattern](/libnetdata/simple_pattern/README.md) to create many alarms with a regex-like syntax. The `foreach` parameter _has_ to be the last parameter in your `lookup` line, and if you have both `of` and `foreach` in @@ -90,7 +95,7 @@ Let's look at some other examples of how `foreach` works so you can best apply i In the last example, we used `foreach system,user,nice` to create three distinct alarms using dimension templates. But what if you want to quickly create alarms for _all_ the dimensions of a given chart? -Use a [simple pattern](../../libnetdata/simple_pattern/README.md)! One example of a simple pattern is a single wildcard +Use a [simple pattern](/libnetdata/simple_pattern/README.md)! One example of a simple pattern is a single wildcard (`*`). Instead of monitoring system CPU usage, let's monitor per-application CPU usage using the `apps.cpu` chart. Passing a @@ -109,11 +114,11 @@ This entity will now create alarms for every dimension in the `apps.cpu` chart. 10 or more dimensions, using the wildcard ensures you catch every CPU-hogging process. To learn more about how to use simple patterns with dimension templates, see our [simple patterns -documentation](../../libnetdata/simple_pattern/README.md). +documentation](/libnetdata/simple_pattern/README.md). ## Using `foreach` with alarm templates -Dimension templates also work with [alarm templates](../../health/README.md#entities-in-the-health-files). Alarm +Dimension templates also work with [alarm templates](/health/REFERENCE.md#alarm-line-alarm-or-template). Alarm templates help you create alarms for all the charts with a given context—for example, all the cores of your system's CPU. @@ -166,6 +171,6 @@ alarms that will help you better monitor the health of your systems. Or, at the very least, simplify your configuration files. For information about other advanced features in Netdata's health monitoring toolkit, check out our [health -documentation](../../health/). And if you have some cool alarms you built using dimension templates, +documentation](/health/README.md). And if you have some cool alarms you built using dimension templates, -[](<>) +[](<>) diff --git a/docs/guides/monitor/kubernetes-k8s-netdata.md b/docs/guides/monitor/kubernetes-k8s-netdata.md new file mode 100644 index 000000000..40af0e94e --- /dev/null +++ b/docs/guides/monitor/kubernetes-k8s-netdata.md @@ -0,0 +1,278 @@ +<!-- +title: "Monitor a Kubernetes (k8s) cluster with Netdata" +description: "Use Netdata's helmchart, service discovery plugin, and Kubelet/kube-proxy collectors for real-time visibility into your Kubernetes cluster." +image: /img/seo/guides/monitor/kubernetes-k8s-netdata.png +custom_edit_url: https://github.com/netdata/netdata/edit/master/docs/guides/monitor/kubernetes-k8s-netdata.md +--> + +# Monitor a Kubernetes cluster with Netdata + +While Kubernetes (k8s) might simplify the way you deploy, scale, and load-balance your applications, not all clusters +come with "batteries included" when it comes to monitoring. Doubly so for a monitoring stack that helps you actively +troubleshoot issues with your cluster. + +Some k8s providers, like GKE (Google Kubernetes Engine), do deploy clusters bundled with monitoring capabilities, such +as Google Stackdriver Monitoring. However, these pre-configured solutions might not offer the depth of metrics, +customization, or integration with your preferred alerting methods. + +Without this visibility, it's like you built an entire house and _then_ smashed your way through the finished walls to +add windows. + +At Netdata, we're working to build Kubernetes monitoring tools that add visibility without complexity while also helping +you actively troubleshoot anomalies or outages. Better yet, this toolkit includes a few complementary collectors that +let you monitor the many layers of a Kubernetes cluster entirely for free. + +We already have a few complementary tools and collectors for monitoring the many layers of a Kubernetes cluster, +_entirely for free_. These methods work together to help you troubleshoot performance or availability issues across +your k8s infrastructure. + +- A [Helm chart](https://github.com/netdata/helmchart), which bootstraps a Netdata Agent pod on every node in your + cluster, plus an additional parent pod for storing metrics and managing alarm notifications. +- A [service discovery plugin](https://github.com/netdata/agent-service-discovery), which discovers and creates + configuration files for [compatible + applications](https://github.com/netdata/helmchart#service-discovery-and-supported-services) and any endpoints + covered by our [generic Prometheus + collector](https://learn.netdata.cloud/docs/agent/collectors/go.d.plugin/modules/prometheus). With these + configuration files, Netdata collects metrics from any compatible applications as they run _inside_ of a pod. + Service discovery happens without manual intervention as pods are created, destroyed, or moved between nodes. +- A [Kubelet collector](https://learn.netdata.cloud/docs/agent/collectors/go.d.plugin/modules/k8s_kubelet), which runs + on each node in a k8s cluster to monitor the number of pods/containers, the volume of operations on each container, + and more. +- A [kube-proxy collector](https://learn.netdata.cloud/docs/agent/collectors/go.d.plugin/modules/k8s_kubeproxy), which + also runs on each node and monitors latency and the volume of HTTP requests to the proxy. +- A [cgroups collector](/collectors/cgroups.plugin/README.md), which collects CPU, memory, and bandwidth metrics for + each container running on your k8s cluster. + +By following this guide, you'll learn how to discover, explore, and take away insights from each of these layers in your +Kubernetes cluster. Let's get started. + +## Prerequisites + +To follow this guide, you need: + +- A working cluster running Kubernetes v1.9 or newer. +- The [kubectl](https://kubernetes.io/docs/reference/kubectl/overview/) command line tool, within [one minor version + difference](https://kubernetes.io/docs/tasks/tools/install-kubectl/#before-you-begin) of your cluster, on an + administrative system. +- The [Helm package manager](https://helm.sh/) v3.0.0 or newer on the same administrative system. + +**You need to install the Netdata Helm chart on your cluster** before you proceed. See our [Kubernetes installation +process](/packaging/installer/methods/kubernetes.md) for details. + +This guide uses a 3-node cluster, running on Digital Ocean, as an example. This cluster runs CockroachDB, Redis, and +Apache, which we'll use as examples of how to monitor a Kubernetes cluster with Netdata. + +```bash +kubectl get nodes +NAME STATUS ROLES AGE VERSION +pool-0z7557lfb-3fnbf Ready <none> 51m v1.17.5 +pool-0z7557lfb-3fnbx Ready <none> 51m v1.17.5 +pool-0z7557lfb-3fnby Ready <none> 51m v1.17.5 + +kubectl get pods +NAME READY STATUS RESTARTS AGE +cockroachdb-0 1/1 Running 0 44h +cockroachdb-1 1/1 Running 0 44h +cockroachdb-2 1/1 Running 1 44h +cockroachdb-init-q7mp6 0/1 Completed 0 44h +httpd-6f6cb96d77-4zlc9 1/1 Running 0 2m47s +httpd-6f6cb96d77-d9gs6 1/1 Running 0 2m47s +httpd-6f6cb96d77-xtpwn 1/1 Running 0 11m +netdata-child-5p2m9 2/2 Running 0 42h +netdata-child-92qvf 2/2 Running 0 42h +netdata-child-djc6w 2/2 Running 0 42h +netdata-parent-0 1/1 Running 0 42h +redis-6bb94d4689-6nn6v 1/1 Running 0 73s +redis-6bb94d4689-c2fk2 1/1 Running 0 73s +redis-6bb94d4689-tjcz5 1/1 Running 0 88s +``` + +## Explore Netdata's Kubernetes charts + +The Helm chart installs and enables everything you need for visibility into your k8s cluster, including the service +discovery plugin, Kubelet collector, kube-proxy collector, and cgroups collector. + +To get started, open your browser and navigate to your cluster's Netdata dashboard. See our [Kubernetes installation +instructions](/packaging/installer/methods/kubernetes.md) for how to access the dashboard based on your cluster's +configuration. + +You'll see metrics from the parent pod as soon as you navigate to the dashboard: + +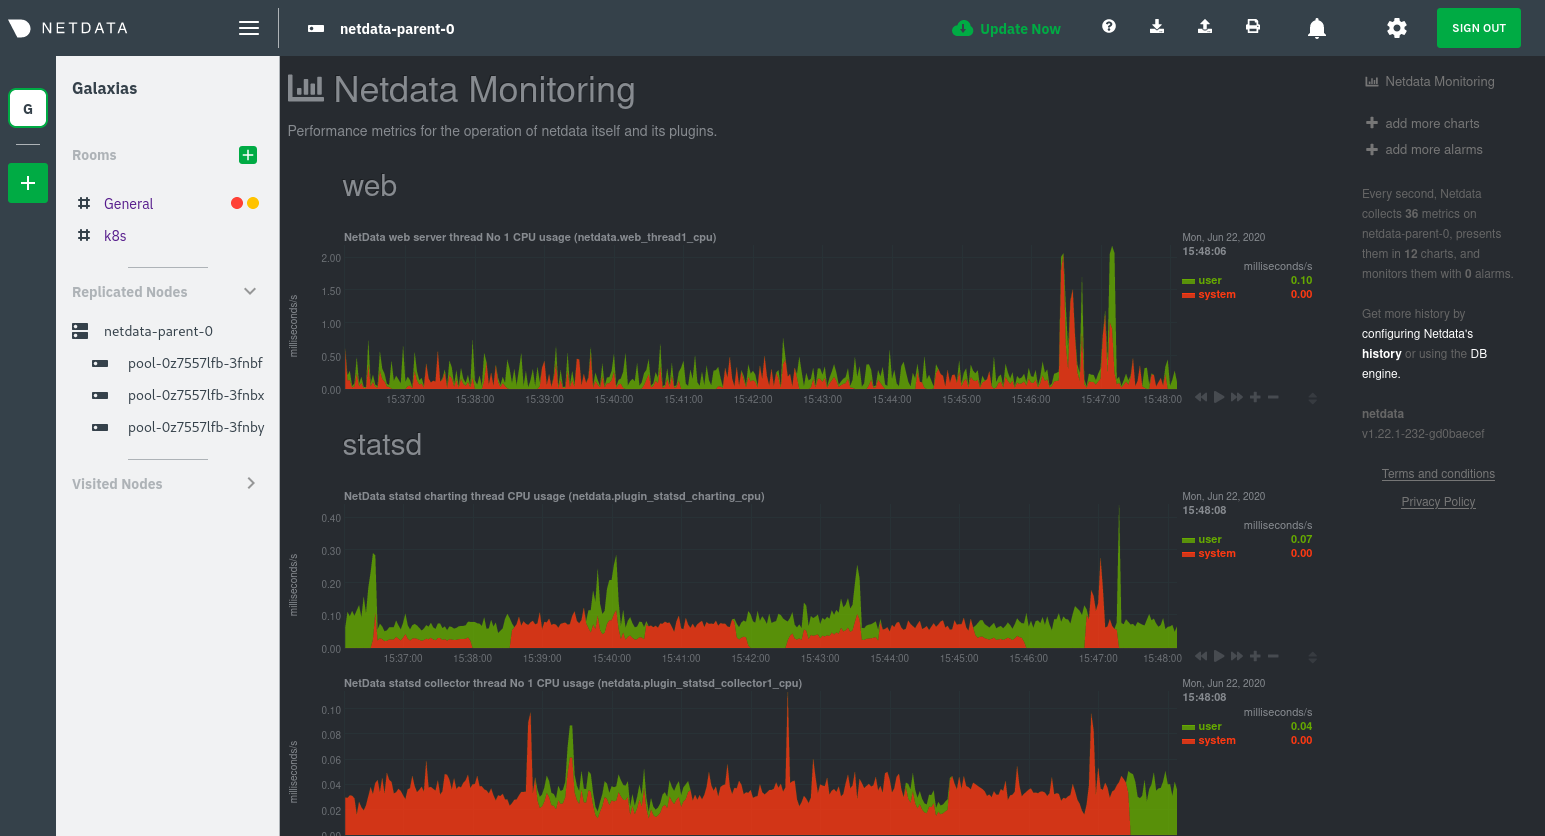 + +Remember that the parent pod is responsible for storing metrics from all the child pods and sending alarms. + +Take note of the **Replicated Nodes** menu, which shows not only the parent pod, but also the three child pods. This +example cluster has three child pods, but the number of child pods depends entirely on the number of nodes in your +cluster. + +You'll use the links in the **Replicated Nodes** menu to navigate between the various pods in your cluster. Let's do +that now to explore the pod-level Kubernetes monitoring Netdata delivers. + +### Pods + +Click on any of the nodes under **netdata-parent-0**. Netdata redirects you to a separate instance of the Netdata +dashboard, run by the Netdata child pod, which visualizes thousands of metrics from that node. + +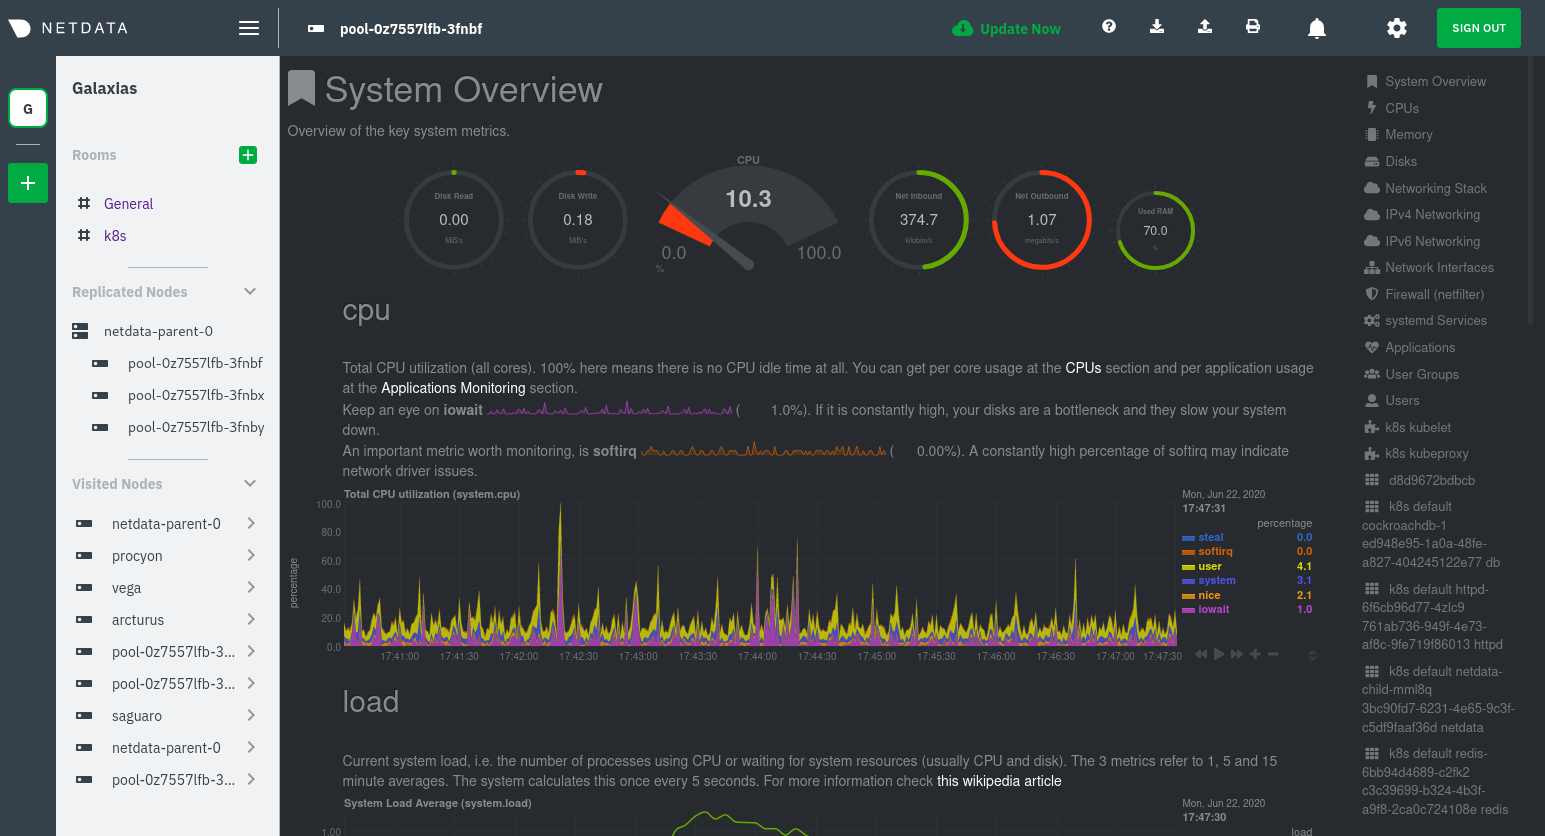 + +From this dashboard, you can see all the familiar charts showing the health and performance of an individual node, just +like you would if you installed Netdata on a single physical system. Explore CPU, memory, bandwidth, networking, and +more. + +You can use the menus on the right-hand side of the dashboard to navigate between different sections of charts and +metrics. + +For example, click on the **Applications** section to view per-application metrics, collected by +[apps.plugin](/collectors/apps.plugin/README.md). The first chart you see is **Apps CPU Time (100% = 1 core) +(apps.cpu)**, which shows the CPU utilization of various applications running on the node. You shouldn't be surprised to +find Netdata processes (`netdata`, `sd-agent`, and more) alongside Kubernetes processes (`kubelet`, `kube-proxy`, and +`containers`). + +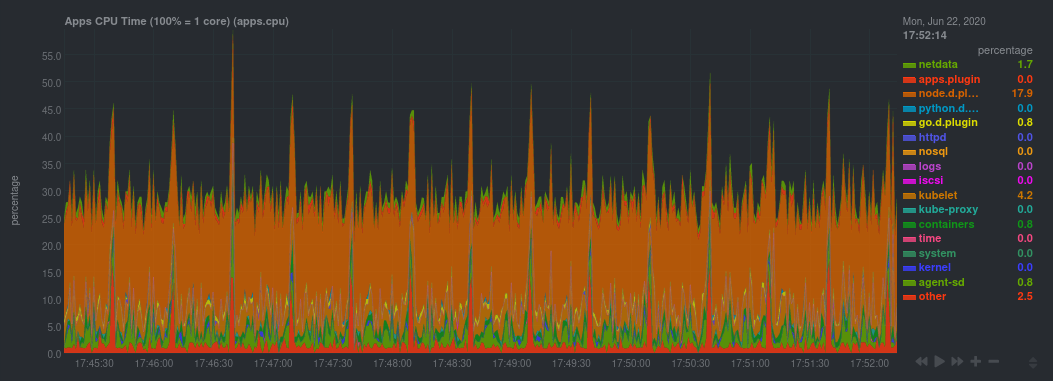 + +Beneath the **Applications** section, you'll begin to see sections for **k8s kubelet**, **k8s kubeproxy**, and long +strings that start with **k8s**, which are sections for metrics collected by +[`cgroups.plugin`](/collectors/cgroups.plugin/README.md). Let's skip over those for now and head further down to see +Netdata's service discovery in action. + +### Service discovery (services running inside of pods) + +Thanks to Netdata's service discovery feature, you monitor containerized applications running in k8s pods with zero +configuration or manual intervention. Service discovery is like a watchdog for created or deleted pods, recognizing the +service they run based on the image name and port and immediately attempting to apply a logical default configuration. + +Service configuration supports [popular +applications](https://github.com/netdata/helmchart#service-discovery-and-supported-services), plus any endpoints covered +by our [generic Prometheus collector](https://learn.netdata.cloud/docs/agent/collectors/go.d.plugin/modules/prometheus), +which are automatically added or removed from Netdata as soon as the pods are created or destroyed. + +You can find these service discovery sections near the bottom of the menu. The names for these sections follow a +pattern: the name of the detected service, followed by a string of the module name, pod TUID, service type, port +protocol, and port number. See the graphic below to help you identify service discovery sections. + +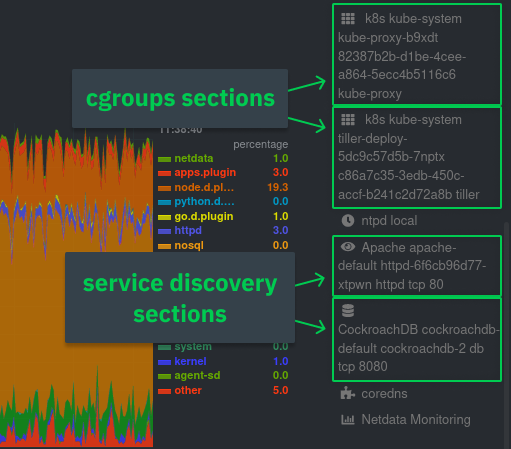 + +For example, the first service discovery section shows metrics for a pod running an Apache web server running on port 80 +in a pod named `httpd-6f6cb96d77-xtpwn`. + +> If you don't see any service discovery sections, it's either because your services are not compatible with service +> discovery or you changed their default configuration, such as the listening port. See the [list of supported +> services](https://github.com/netdata/helmchart#service-discovery-and-supported-services) for details about whether +> your installed services are compatible with service discovery, or read the [configuration +> instructions](/packaging/installer/methods/kubernetes.md#configure-service-discovery) to change how it discovers the +> supported services. + +Click on any of these service discovery sections to see metrics from that particular service. For example, click on the +**Apache apache-default httpd-6f6cb96d77-xtpwn httpd tcp 80** section brings you to a series of charts populated by the +[Apache collector](https://learn.netdata.cloud/docs/agent/collectors/go.d.plugin/modules/apache) itself. + +With service discovery, you can now see valuable metrics like requests, bandwidth, workers, and more for this pod. + +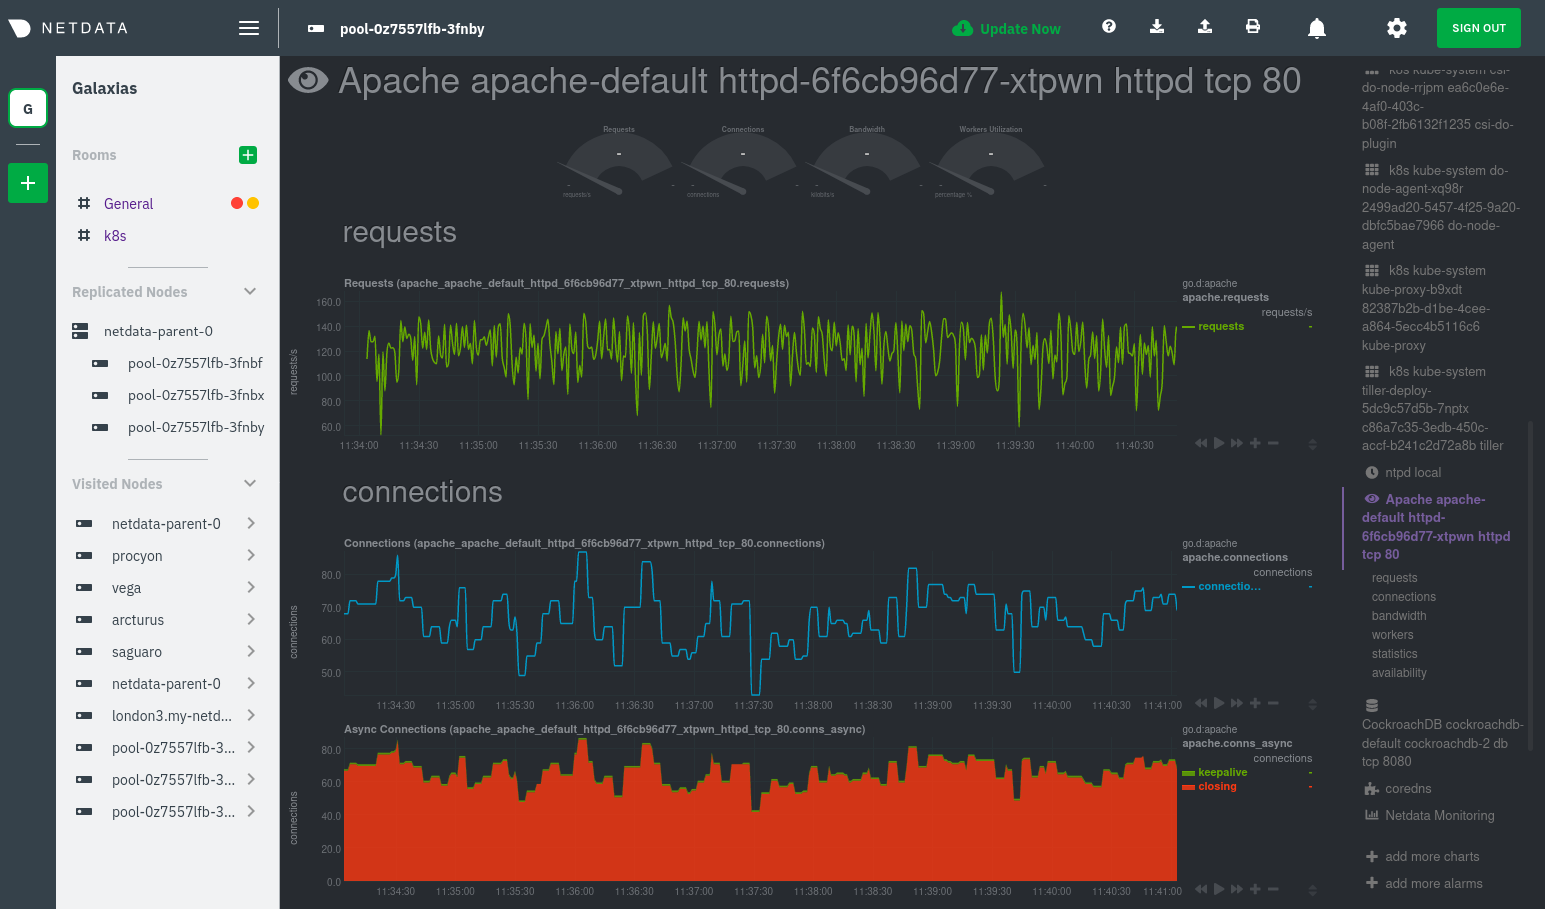 + +The same goes for metrics coming from the CockroachDB pod running on this same node. + +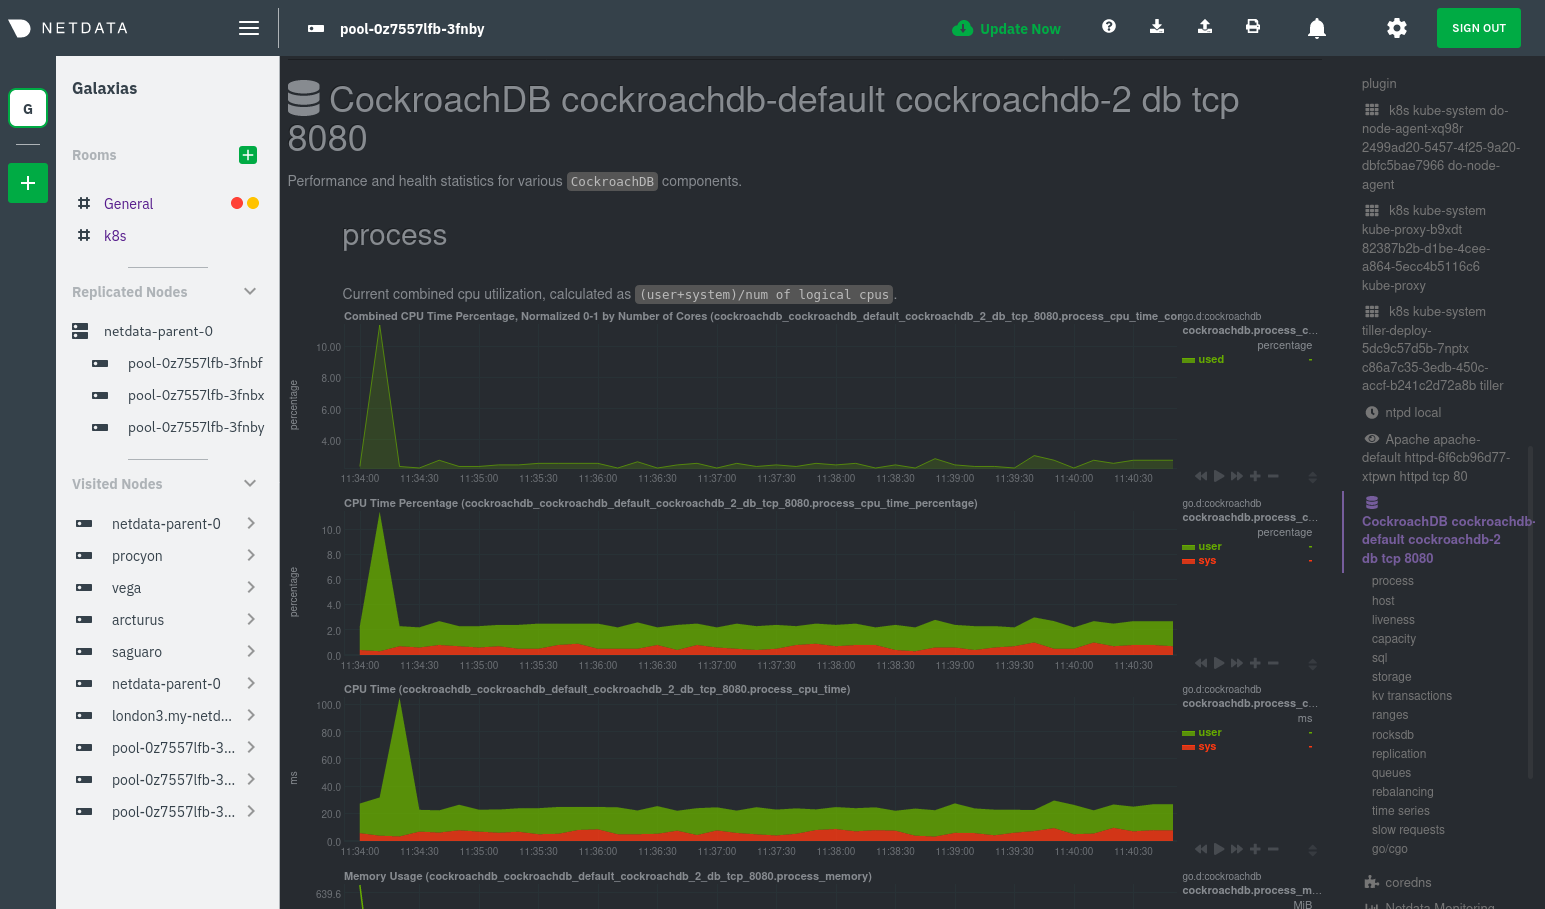 + +Service discovery helps you monitor the health of specific applications running on your Kubernetes cluster, which in +turn gives you a complete resource when troubleshooting your infrastructure's health and performance. + +### Kubelet + +Let's head back up the menu to the **k8s kubelet** section. Kubelet is an agent that runs on every node in a cluster. It +receives a set of PodSpecs from the Kubernetes Control Plane and ensures the pods described there are both running and +healthy. Think of it as a manager for the various pods on that node. + +Monitoring each node's Kubelet can be invaluable when diagnosing issues with your Kubernetes cluster. For example, you +can see when the volume of running containers/pods has dropped. + +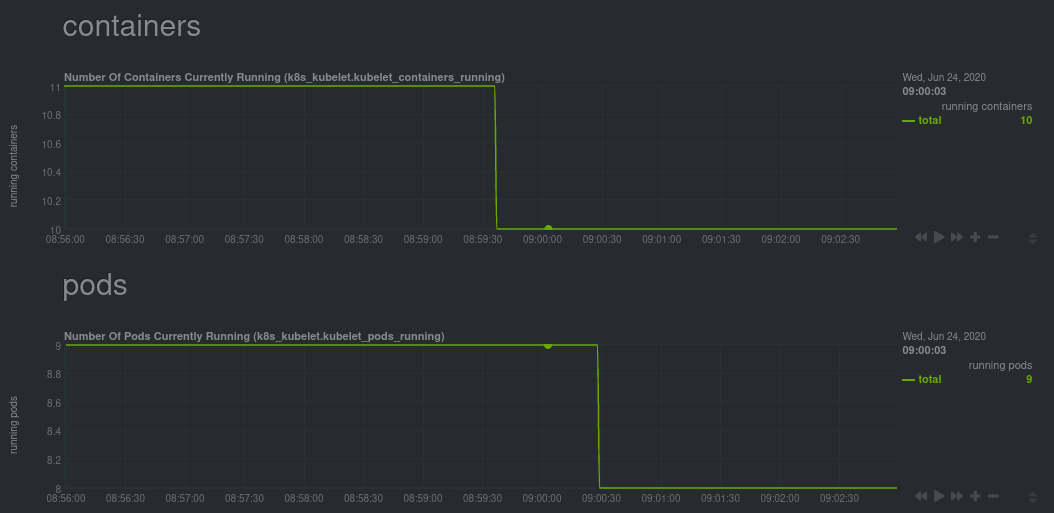 + +This drop might signal a fault or crash in a particular Kubernetes service or deployment (see `kubectl get services` or +`kubectl get deployments` for more details). If the number of pods increases, it may be because of something more +benign, like another member of your team scaling up a service with `kubectl scale`. + +You can also view charts for the Kubelet API server, the volume of runtime/Docker operations by type, +configuration-related errors, and the actual vs. desired numbers of volumes, plus a lot more. + +Kubelet metrics are collected and visualized thanks to the [kubelet +collector](https://learn.netdata.cloud/docs/agent/collectors/go.d.plugin/modules/k8s_kubelet), which is enabled with +zero configuration on most Kubernetes clusters with standard configurations. + +### kube-proxy + +Scroll down into the **k8s kubeproxy** section to see metrics about the network proxy that runs on each node in your +Kubernetes cluster. kube-proxy allows for pods to communicate with each other and accept sessions from outside your +cluster. + +With Netdata, you can monitor how often your k8s proxies are syncing proxy rules between nodes. Dramatic changes in +these figures could indicate an anomaly in your cluster that's worthy of further investigation. + +kube-proxy metrics are collected and visualized thanks to the [kube-proxy +collector](https://learn.netdata.cloud/docs/agent/collectors/go.d.plugin/modules/k8s_kubeproxy), which is enabled with +zero configuration on most Kubernetes clusters with standard configurations. + +### Containers + +We can finally talk about the final piece of Kubernetes monitoring: containers. Each Kubernetes pod is a set of one or +more cooperating containers, sharing the same namespace, all of which are resourced and tracked by the cgroups feature +of the Linux kernel. Netdata automatically detects and monitors each running container by interfacing with the cgroups +feature itself. + +You can find these sections beneath **Users**, **k8s kubelet**, and **k8s kubeproxy**. Below, a number of containers +devoted to running services like CockroachDB, Apache, Redis, and more. + +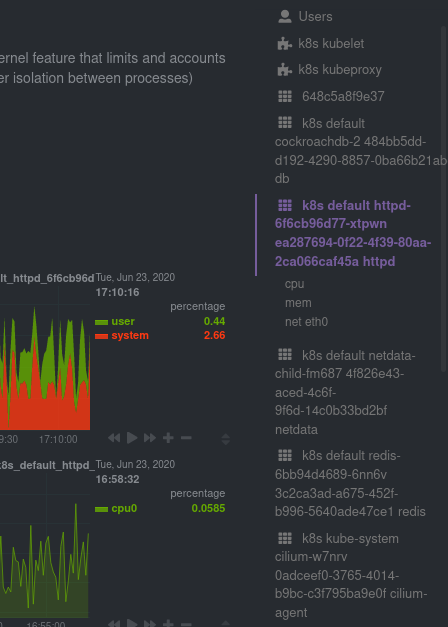 + +Let's look at the section devoted to the container that runs the Apache pod named `httpd-6f6cb96d77-xtpwn`, as described +in the previous part on [service discovery](#service-discovery-services-running-inside-of-pods). + +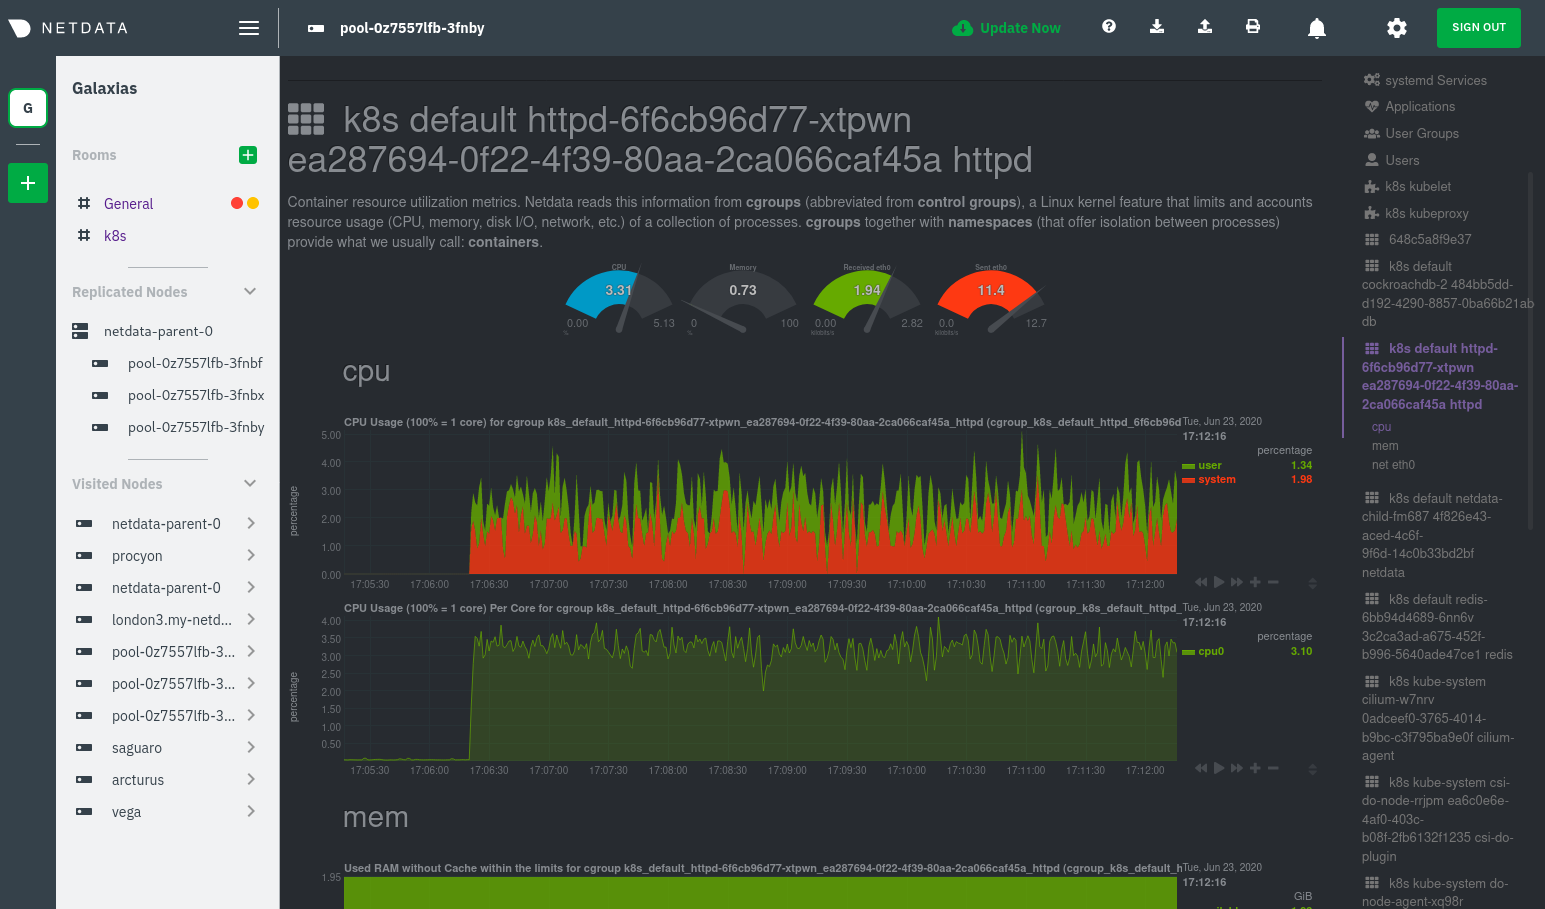 + +At first glance, these sections might seem redundant. You might ask, "Why do I need both a service discovery section +_and_ a container section? It's just one pod, after all!" + +The difference is that while the service discovery section shows _Apache_ metrics, the equivalent cgroups section shows +that container's CPU, memory, and bandwidth usage. You can use the two sections in conjunction to monitor the health and +performance of your pods and the services they run. + +For example, let's say you get an alarm notification from `netdata-parent-0` saying the +`ea287694-0f22-4f39-80aa-2ca066caf45a` container (also known as the `httpd-6f6cb96d77-xtpwn` pod) is using 99% of its +available RAM. You can then hop over to the **Apache apache-default httpd-6f6cb96d77-xtpwn httpd tcp 80** section to +further investigate why Apache is using an unexpected amount of RAM. + +All container metrics, whether they're managed by Kubernetes or the Docker service directly, are collected by the +[cgroups collector](/collectors/cgroups.plugin/README.md). Because this collector integrates with the cgroups Linux +kernel feature itself, monitoring containers requires zero configuration on most Kubernetes clusters. + +## What's next? + +After following this guide, you should have a more comprehensive understanding of how to monitor your Kubernetes cluster +with Netdata. With this setup, you can monitor the health and performance of all your nodes, pods, services, and k8s +agents. Pre-configured alarms will tell you when something goes awry, and this setup gives you every per-second metric +you need to make informed decisions about your cluster. + +The best part of monitoring a Kubernetes cluster with Netdata is that you don't have to worry about constantly running +complex `kubectl` commands to see hundreds of highly granular metrics from your nodes. And forget about using `kubectl +exec -it pod bash` to start up a shell on a pod to find and diagnose an issue with any given pod on your cluster. + +And with service discovery, all your compatible pods will automatically appear and disappear as they scale up, move, or +scale down across your cluster. + +To monitor your Kubernetes cluster with Netdata, start by [installing the Helm +chart](/packaging/installer/methods/kubernetes.md) if you haven't already. The Netdata Agent is open source and entirely +free for every cluster and every organization, whether you have 10 or 10,000 pods. A few minutes and one `helm install` +later and you'll have started on the path of building an effective platform for troubleshooting the next performance or +availability issue on your Kubernetes cluster. + +[](<>) diff --git a/docs/guides/monitor/pi-hole-raspberry-pi.md b/docs/guides/monitor/pi-hole-raspberry-pi.md new file mode 100644 index 000000000..a180466fb --- /dev/null +++ b/docs/guides/monitor/pi-hole-raspberry-pi.md @@ -0,0 +1,163 @@ +<!-- +title: "Monitor Pi-hole (and a Raspberry Pi) with Netdata" +description: "Monitor Pi-hole metrics, plus Raspberry Pi system metrics, in minutes and completely for free with Netdata's open-source monitoring agent." +image: /img/seo/guides/monitor/netdata-pi-hole-raspberry-pi.png +custom_edit_url: https://github.com/netdata/netdata/edit/master/docs/guides/monitor/pi-hole-raspberry-pi.md +--> + +# Monitor Pi-hole (and a Raspberry Pi) with Netdata + +Between intrusive ads, invasive trackers, and vicious malware, many techies and homelab enthusiasts are advancing their +networks' security and speed with a tiny computer and a powerful piece of software: [Pi-hole](https://pi-hole.net/). + +Pi-hole is a DNS sinkhole that prevents unwanted content from even reaching devices on your home network. It blocks ads +and malware at the network, instead of using extensions/add-ons for individual browsers, so you'll stop seeing ads in +some of the most intrusive places, like your smart TV. Pi-hole can even [improve your network's speed and reduce +bandwidth](https://discourse.pi-hole.net/t/will-pi-hole-slow-down-my-network/2048). + +Most Pi-hole users run it on a [Raspberry Pi](https://www.raspberrypi.org/products/raspberry-pi-4-model-b/) (hence the +name), a credit card-sized, super-capable computer that costs about $35. + +And to keep tabs on how both Pi-hole and the Raspberry Pi are working to protect your network, you can use the +open-source [Netdata monitoring agent](https://github.com/netdata/netdata). + +To get started, all you need is a [Raspberry Pi](https://www.raspberrypi.org/products/raspberry-pi-4-model-b/) with +Raspbian installed. This guide uses a Raspberry Pi 4 Model B and Raspbian GNU/Linux 10 (buster). This guide assumes +you're connecting to a Raspberry Pi remotely over SSH, but you could also complete all these steps on the system +directly using a keyboard, mouse, and monitor. + +## Why monitor Pi-hole and a Raspberry Pi with Netdata? + +Netdata helps you monitor and troubleshoot all kinds of devices and the applications they run, including IoT devices +like the Raspberry Pi and applications like Pi-hole. + +After a two-minute installation and with zero configuration, you'll be able to see all of Pi-hole's metrics, including +the volume of queries, connected clients, DNS queries per type, top clients, top blocked domains, and more. + +With Netdata installed, you can also monitor system metrics and any other applications you might be running. By default, +Netdata collects metrics on CPU usage, disk IO, bandwidth, per-application resource usage, and a ton more. With the +Raspberry Pi used for this guide, Netdata automatically collects about 1,500 metrics every second! + +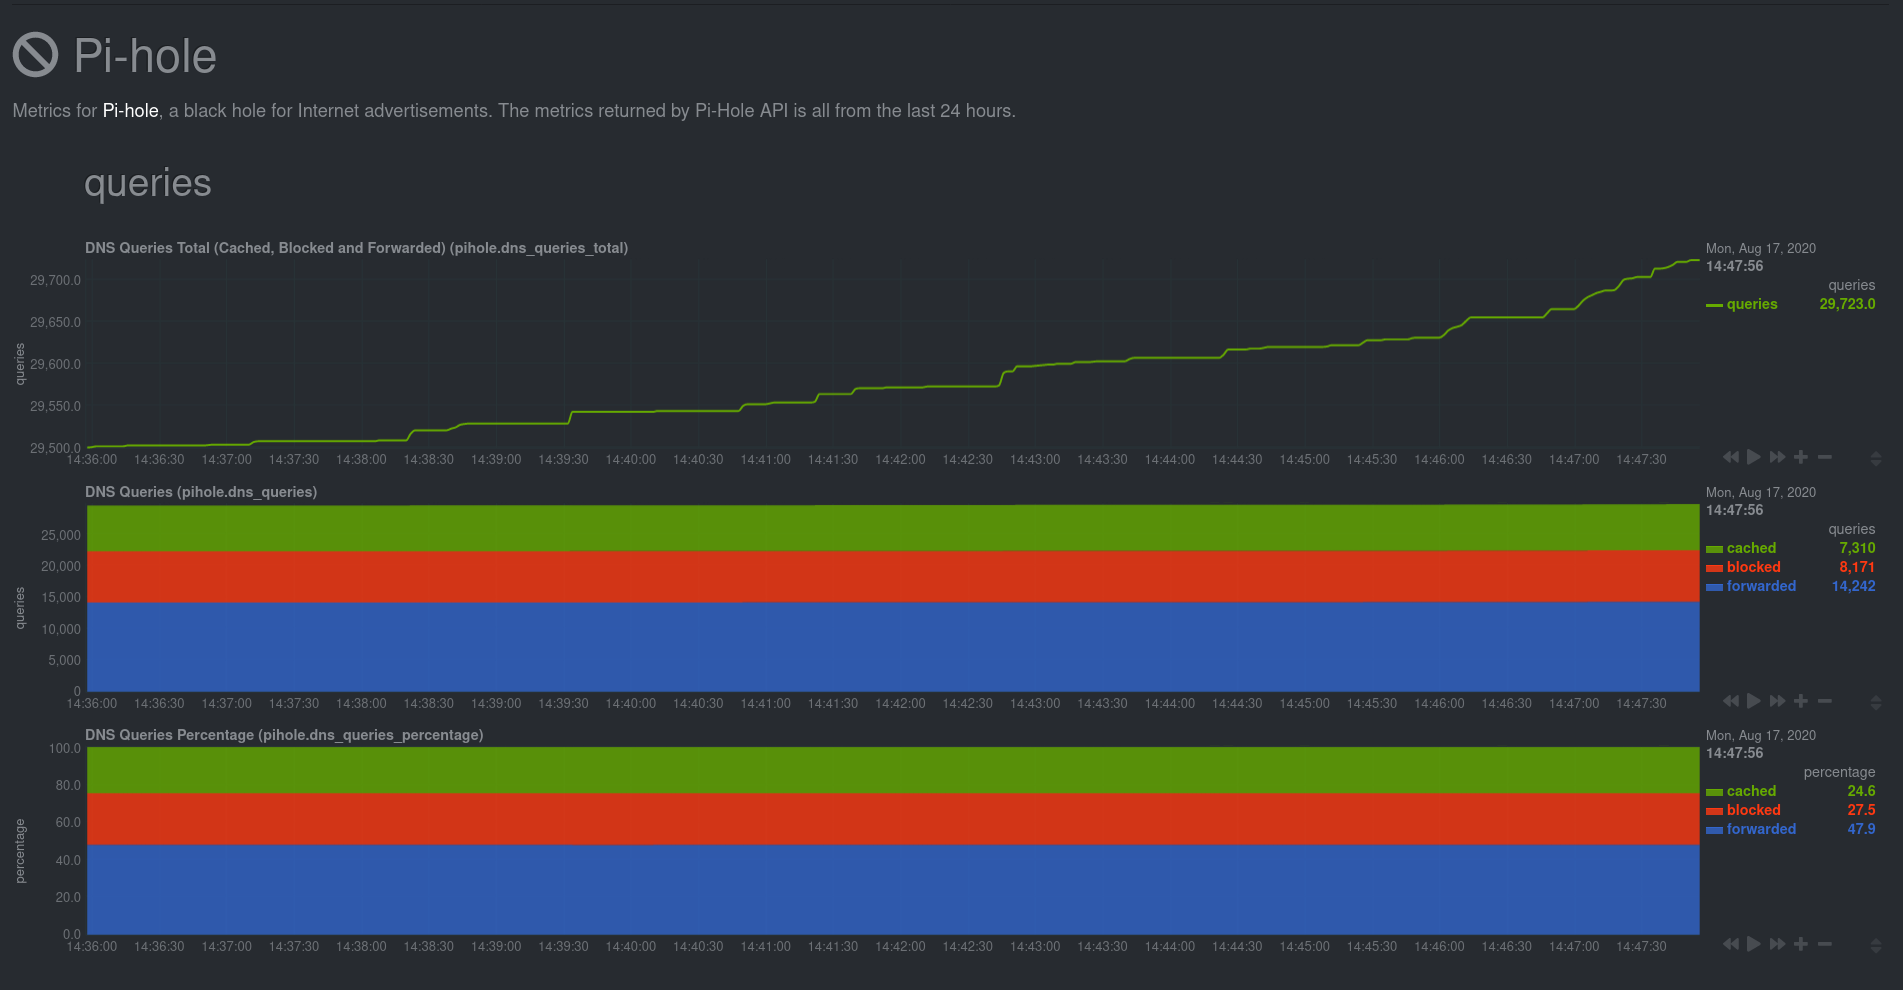 + +## Install Netdata + +Let's start by installing Netdata first so that it can start collecting system metrics as soon as possible for the most +possible historic data. + +> ⚠️ Don't install Netdata using `apt` and the default package available in Raspbian. The Netdata team does not maintain +> this package, and can't guarantee it works properly. + +On Raspberry Pis running Raspbian, the best way to install Netdata is our one-line kickstart script. This script asks +you to install dependencies, then compiles Netdata from source via [GitHub](https://github.com/netdata/netdata). + +```bash +bash <(curl -Ss https://my-netdata.io/kickstart.sh) +``` + +Once installed on a Raspberry Pi 4 with no accessories, Netdata starts collecting roughly 1,500 metrics every second and +populates its dashboard with more than 250 charts. + +Open your browser of choice and navigate to `http://NODE:19999/`, replacing `NODE` with the IP address of your Raspberry +Pi. Not sure what that IP is? Try running `hostname -I | awk '{print $1}'` from the Pi itself. + +You'll see Netdata's dashboard and a few hundred real-time, +[interactive](https://learn.netdata.cloud/guides/step-by-step/step-02#interact-with-charts) charts. Feel free to +explore, but let's turn our attention to installing Pi-hole. + +## Install Pi-Hole + +Like Netdata, Pi-hole has a one-line script for simple installation. From your Raspberry Pi, run the following: + +```bash +curl -sSL https://install.pi-hole.net | bash +``` + +The installer will help you set up Pi-hole based on the topology of your network. Once finished, you should set up your +devices—or your router for system-wide sinkhole protection—to [use Pi-hole as their DNS +service](https://discourse.pi-hole.net/t/how-do-i-configure-my-devices-to-use-pi-hole-as-their-dns-server/245). You've +finished setting up Pi-hole at this point. + +As far as configuring Netdata to monitor Pi-hole metrics, there's nothing you actually need to do. Netdata's [Pi-hole +collector](https://learn.netdata.cloud/docs/agent/collectors/go.d.plugin/modules/pihole) will autodetect the new service +running on your Raspberry Pi and immediately start collecting metrics every second. + +Restart Netdata with `sudo service netdata restart` to start Netdata, which will then recognize that Pi-hole is running +and start a per-second collection job. When you refresh your Netdata dashboard or load it up again in a new tab, you'll +see a new entry in the menu for **Pi-hole** metrics. + +## Use Netdata to explore and monitor your Raspberry Pi and Pi-hole + +By the time you've reached this point in the guide, Netdata has already collected a ton of valuable data about your +Raspberry Pi, Pi-hole, and any other apps/services you might be running. Even a few minutes of collecting 1,500 metrics +per second adds up quickly. + +You can now use Netdata's synchronized charts to zoom, highlight, scrub through time, and discern how an anomaly in one +part of your system might affect another. + + + +If you're completely new to Netdata, look at our [step-by-step guide](/docs/guides/step-by-step/step-00.md) for a +walkthrough of all its features. For a more expedited tour, see the [get started guide](/docs/getting-started.md). + +### Enable temperature sensor monitoring + +You need to manually enable Netdata's built-in [temperature sensor +collector](https://learn.netdata.cloud/docs/agent/collectors/charts.d.plugin/sensors) to start collecting metrics. + +> Netdata uses a few plugins to manage its [collectors](/collectors/REFERENCE.md), each using a different language: Go, +> Python, Node.js, and Bash. While our Go collectors are undergoing the most active development, we still support the +> other languages. In this case, you need to enable a temperature sensor collector that's written in Bash. + +First, open the `charts.d.conf` file for editing. You should always use the `edit-config` script to edit Netdata's +configuration files, as it ensures your settings persist across updates to the Netdata Agent. + +```bash +cd /etc/netdata +sudo ./edit-config charts.d.conf +``` + +Uncomment the `sensors=force` line and save the file. Restart Netdata with `sudo service netdata restart` to enable +Raspberry Pi temperature sensor monitoring. + +### Storing historical metrics on your Raspberry Pi + +By default, Netdata allocates 256 MiB in disk space to store historical metrics inside the [database +engine](/database/engine/README.md). On the Raspberry Pi used for this guide, Netdata collects 1,500 metrics every +second, which equates to storing 3.5 days worth of historical metrics. + +You can increase this allocation by editing `netdata.conf` and increasing the `dbengine multihost disk space` setting to +more than 256. + +```yaml +[global] + dbengine multihost disk space = 512 +``` + +Use our [database sizing +calculator](/docs/store/change-metrics-storage.md#calculate-the-system-resources-RAM-disk-space-needed-to-store-metrics) +and [guide on storing historical metrics](/docs/guides/longer-metrics-storage.md) to help you determine the right +setting for your Raspberry Pi. + +## What's next? + +Now that you're monitoring Pi-hole and your Raspberry Pi with Netdata, you can extend its capabilities even further, or +configure Netdata to more specific goals. + +Most importantly, you can always install additional services and instantly collect metrics from many of them with our +[300+ integrations](/collectors/COLLECTORS.md). + +- [Optimize performance](/docs/guides/configure/performance.md) using tweaks developed for IoT devices. +- [Stream Raspberry Pi metrics](/streaming/README.md) to a parent host for easy access or longer-term storage. +- [Tweak alarms](/health/QUICKSTART.md) for either Pi-hole or the health of your Raspberry Pi. +- [Export metrics to external databases](/exporting/README.md) with the exporting engine. + +Or, head over to [our guides](https://learn.netdata.cloud/guides/) for even more experiments and insights into +troubleshooting the health of your systems and services. + +If you have any questions about using Netdata to monitor your Raspberry Pi, Pi-hole, or any other applications, head on +over to our [community forum](https://community.netdata.cloud/). + +[](<>) diff --git a/docs/guides/monitor/process.md b/docs/guides/monitor/process.md new file mode 100644 index 000000000..893e6b704 --- /dev/null +++ b/docs/guides/monitor/process.md @@ -0,0 +1,299 @@ +<!-- +title: Monitor any process in real-time with Netdata +description: "Tap into Netdata's powerful collectors, with per-second utilization metrics for every process, to troubleshoot faster and make data-informed decisions." +image: /img/seo/guides/monitor/process.png +custom_edit_url: https://github.com/netdata/netdata/edit/master/docs/guides/monitor/process.md +--> + +# Monitor any process in real-time with Netdata + +Netdata is more than a multitude of generic system-level metrics and visualizations. Instead of providing only a bird's +eye view of your system, leaving you to wonder exactly _what_ is taking up 99% CPU, Netdata also gives you visibility +into _every layer_ of your node. These additional layers give you context, and meaningful insights, into the true health +and performance of your infrastructure. + +One of these layers is the _process_. Every time a Linux system runs a program, it creates an independent process that +executes the program's instructions in parallel with anything else happening on the system. Linux systems track the +state and resource utilization of processes using the [`/proc` filesystem](https://en.wikipedia.org/wiki/Procfs), and +Netdata is designed to hook into those metrics to create meaningful visualizations out of the box. + +While there are a lot of existing command-line tools for tracking processes on Linux systems, such as `ps` or `top`, +only Netdata provides dozens of real-time charts, at both per-second and event frequency, without you having to write +SQL queries or know a bunch of arbitrary command-line flags. + +With Netdata's process monitoring, you can: + +- Benchmark/optimize performance of standard applications, like web servers or databases +- Benchmark/optimize performance of custom applications +- Troubleshoot CPU/memory/disk utilization issues (why is my system's CPU spiking right now?) +- Perform granular capacity planning based on the specific needs of your infrastructure +- Search for leaking file descriptors +- Investigate zombie processes + +... and much more. Let's get started. + +## Prerequisites + +- One or more Linux nodes running the [Netdata Agent](/docs/get/README.md). If you need more time to understand + Netdata before following this guide, see the [infrastructure](/docs/quickstart/infrastructure.md) or + [single-node](/docs/quickstart/single-node.md) monitoring quickstarts. +- A general understanding of how to [configure the Netdata Agent](/docs/configure/nodes.md) using `edit-config`. +- A Netdata Cloud account. [Sign up](https://app.netdata.cloud) if you don't have one already. + +## How does Netdata do process monitoring? + +The Netdata Agent already knows to look for hundreds of [standard applications that we support via +collectors](/collectors/COLLECTORS.md), and groups them based on their purpose. Let's say you want to monitor a MySQL +database using its process. The Netdata Agent already knows to look for processes with the string `mysqld` in their +name, along with a few others, and puts them into the `sql` group. This `sql` group then becomes a dimension in all +process-specific charts. + +The process and groups settings are used by two unique and powerful collectors. + +[**`apps.plugin`**](/collectors/apps.plugin/README.md) looks at the Linux process tree every second, much like `top` or +`ps fax`, and collects resource utilization information on every running process. It then automatically adds a layer of +meaningful visualization on top of these metrics, and creates per-process/application charts. + +[**`ebpf.plugin`**](/collectors/ebpf.plugin/README.md): Netdata's extended Berkeley Packet Filter (eBPF) collector +monitors Linux kernel-level metrics for file descriptors, virtual filesystem IO, and process management, and then hands +process-specific metrics over to `apps.plugin` for visualization. The eBPF collector also collects and visualizes +metrics on an _event frequency_, which means it captures every kernel interaction, and not just the volume of +interaction at every second in time. That's even more precise than Netdata's standard per-second granularity. + +### Per-process metrics and charts in Netdata + +With these collectors working in parallel, Netdata visualizes the following per-second metrics for _any_ process on your +Linux systems: + +- CPU utilization (`apps.cpu`) + - Total CPU usage + - User/system CPU usage (`apps.cpu_user`/`apps.cpu_system`) +- Disk I/O + - Physical reads/writes (`apps.preads`/`apps.pwrites`) + - Logical reads/writes (`apps.lreads`/`apps.lwrites`) + - Open unique files (if a file is found open multiple times, it is counted just once, `apps.files`) +- Memory + - Real Memory Used (non-shared, `apps.mem`) + - Virtual Memory Allocated (`apps.vmem`) + - Minor page faults (i.e. memory activity, `apps.minor_faults`) +- Processes + - Threads running (`apps.threads`) + - Processes running (`apps.processes`) + - Carried over uptime (since the last Netdata Agent restart, `apps.uptime`) + - Minimum uptime (`apps.uptime_min`) + - Average uptime (`apps.uptime_average`) + - Maximum uptime (`apps.uptime_max`) + - Pipes open (`apps.pipes`) +- Swap memory + - Swap memory used (`apps.swap`) + - Major page faults (i.e. swap activity, `apps.major_faults`) +- Network + - Sockets open (`apps.sockets`) +- eBPF file + - Number of calls to open files. (`apps.file_open`) + - Number of files closed. (`apps.file_closed`) + - Number of calls to open files that returned errors. + - Number of calls to close files that returned errors. +- eBPF syscall + - Number of calls to delete files. (`apps.file_deleted`) + - Number of calls to `vfs_write`. (`apps.vfs_write_call`) + - Number of calls to `vfs_read`. (`apps.vfs_read_call`) + - Number of bytes written with `vfs_write`. (`apps.vfs_write_bytes`) + - Number of bytes read with `vfs_read`. (`apps.vfs_read_bytes`) + - Number of calls to write a file that returned errors. + - Number of calls to read a file that returned errors. +- eBPF process + - Number of process created with `do_fork`. (`apps.process_create`) + - Number of threads created with `do_fork` or `__x86_64_sys_clone`, depending on your system's kernel version. (`apps.thread_create`) + - Number of times that a process called `do_exit`. (`apps.task_close`) +- eBPF net + - Number of bytes sent. (`apps.bandwidth_sent`) + - Number of bytes received. (`apps.bandwidth_recv`) + +As an example, here's the per-process CPU utilization chart, including a `sql` group/dimension. + +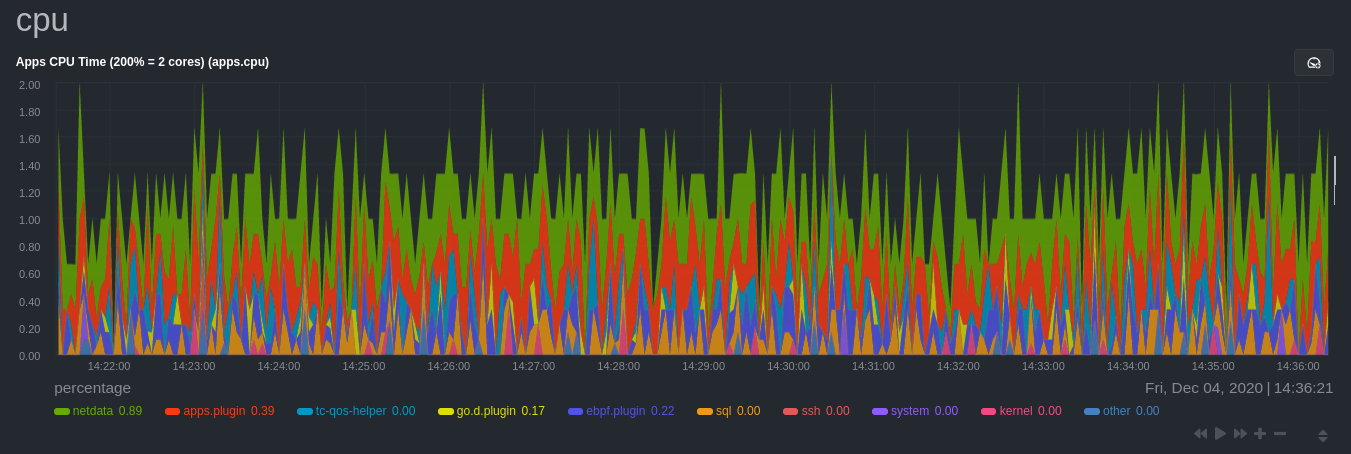 + +## Configure the Netdata Agent to recognize a specific process + +To monitor any process, you need to make sure the Netdata Agent is aware of it. As mentioned above, the Agent is already +aware of hundreds of processes, and collects metrics from them automatically. + +But, if you want to change the grouping behavior, add an application that isn't yet supported in the Netdata Agent, or +monitor a custom application, you need to edit the `apps_groups.conf` configuration file. + +Navigate to your [Netdata config directory](/docs/configure/nodes.md) and use `edit-config` to edit the file. + +```bash +cd /etc/netdata # Replace this with your Netdata config directory if not at /etc/netdata. +sudo ./edit-config apps_groups.conf +``` + +Inside the file are lists of process names, oftentimes using wildcards (`*`), that the Netdata Agent looks for and +groups together. For example, the Netdata Agent looks for processes starting with `mysqld`, `mariad`, `postgres`, and +others, and groups them into `sql`. That makes sense, since all these processes are for SQL databases. + +```conf +sql: mysqld* mariad* postgres* postmaster* oracle_* ora_* sqlservr +``` + +These groups are then reflected as [dimensions](/web/README.md#dimensions) within Netdata's charts. + + + +See the following two sections for details based on your needs. If you don't need to configure `apps_groups.conf`, jump +down to [visualizing process metrics](#visualize-process-metrics). + +### Standard applications (web servers, databases, containers, and more) + +As explained above, the Netdata Agent is already aware of most standard applications you run on Linux nodes, and you +shouldn't need to configure it to discover them. + +However, if you're using multiple applications that the Netdata Agent groups together you may want to separate them for +more precise monitoring. If you're not running any other types of SQL databases on that node, you don't need to change +the grouping, since you know that any MySQL is the only process contributing to the `sql` group. + +Let's say you're using both MySQL and PostgreSQL databases on a single node, and want to monitor their processes +independently. Open the `apps_groups.conf` file as explained in the [section +above](#configure-the-netdata-agent-to-recognize-a-specific-process) and scroll down until you find the `database +servers` section. Create new groups for MySQL and PostgreSQL, and move their process queries into the unique groups. + +```conf +# ----------------------------------------------------------------------------- +# database servers + +mysql: mysqld* +postgres: postgres* +sql: mariad* postmaster* oracle_* ora_* sqlservr +``` + +Restart Netdata with `service netdata restart`, or the appropriate method for your system, to start collecting +utilization metrics from your application. Time to [visualize your process metrics](#visualize-process-metrics). + +### Custom applications + +Let's assume you have an application that runs on the process `custom-app`. To monitor eBPF metrics for that application +separate from any others, you need to create a new group in `apps_groups.conf` and associate that process name with it. + +Open the `apps_groups.conf` file as explained in the [section +above](#configure-the-netdata-agent-to-recognize-a-specific-process). Scroll down to `# NETDATA processes accounting`. +Above that, paste in the following text, which creates a new `custom-app` group with the `custom-app` process. Replace +`custom-app` with the name of your application's Linux process. `apps_groups.conf` should now look like this: + +```conf +... +# ----------------------------------------------------------------------------- +# Custom applications to monitor with apps.plugin and ebpf.plugin + +custom-app: custom-app + +# ----------------------------------------------------------------------------- +# NETDATA processes accounting +... +``` + +Restart Netdata with `service netdata restart`, or the appropriate method for your system, to start collecting +utilization metrics from your application. + +## Visualize process metrics + +Now that you're collecting metrics for your process, you'll want to visualize them using Netdata's real-time, +interactive charts. Find these visualizations in the same section regardless of whether you use [Netdata +Cloud](https://app.netdata.cloud) for infrastructure monitoring, or single-node monitoring with the local Agent's +dashboard at `http://localhost:19999`. + +If you need a refresher on all the available per-process charts, see the [above +list](#per-process-metrics-and-charts-in-netdata). + +### Using Netdata's application collector (`apps.plugin`) + +`apps.plugin` puts all of its charts under the **Applications** section of any Netdata dashboard. + +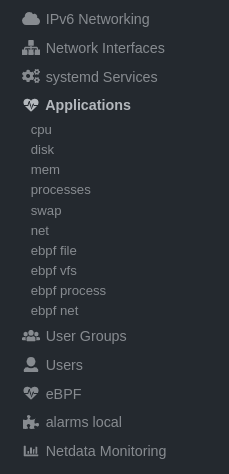 + +Let's continue with the MySQL example. We can create a [test +database](https://www.digitalocean.com/community/tutorials/how-to-measure-mysql-query-performance-with-mysqlslap) in +MySQL to generate load on the `mysql` process. + +`apps.plugin` immediately collects and visualizes this activity `apps.cpu` chart, which shows an increase in CPU +utilization from the `sql` group. There is a parallel increase in `apps.pwrites`, which visualizes writes to disk. + +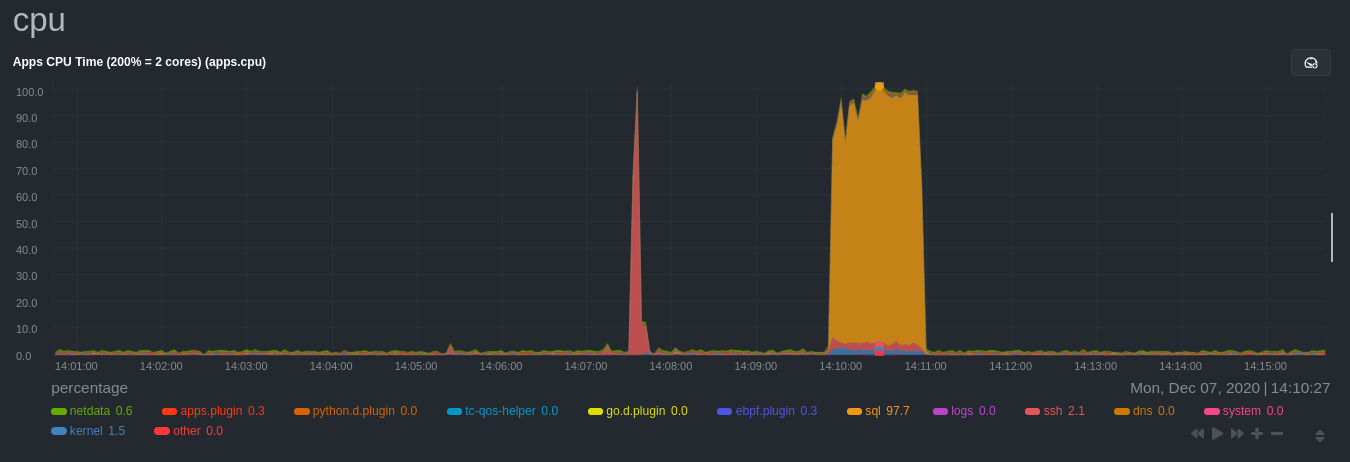 + +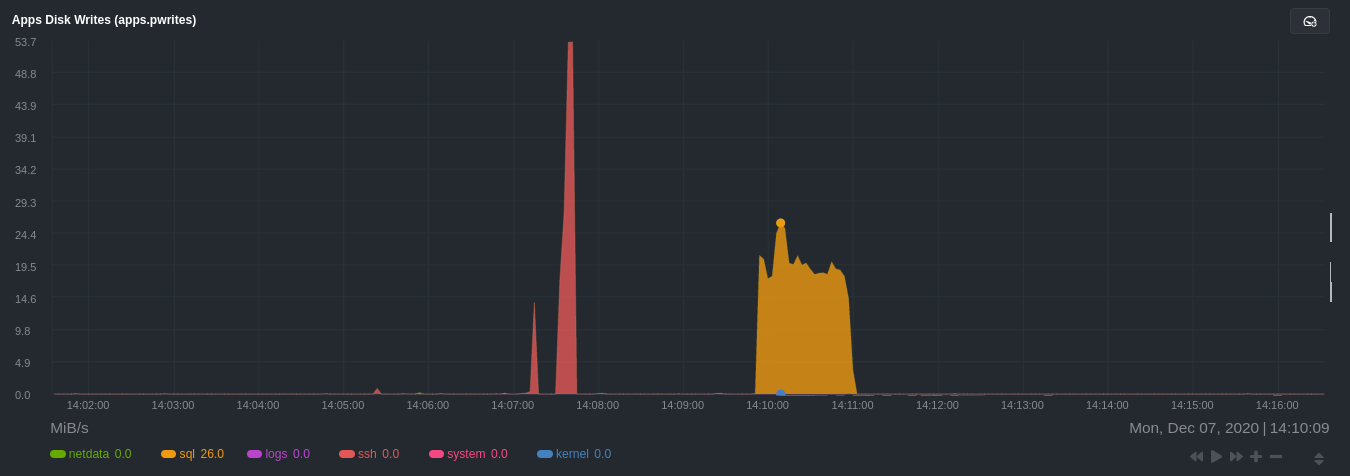 + +Next, the `mysqlslap` utility queries the database to provide some benchmarking load on the MySQL database. It won't +look exactly like a production database executing lots of user queries, but it gives you an idea into the possibility of +these visualizations. + +```bash +sudo mysqlslap --user=sysadmin --password --host=localhost --concurrency=50 --iterations=10 --create-schema=employees --query="SELECT * FROM dept_emp;" --verbose +``` + +The following per-process disk utilization charts show spikes under the `sql` group at the same time `mysqlslap` was run +numerous times, with slightly different concurrency and query options. + +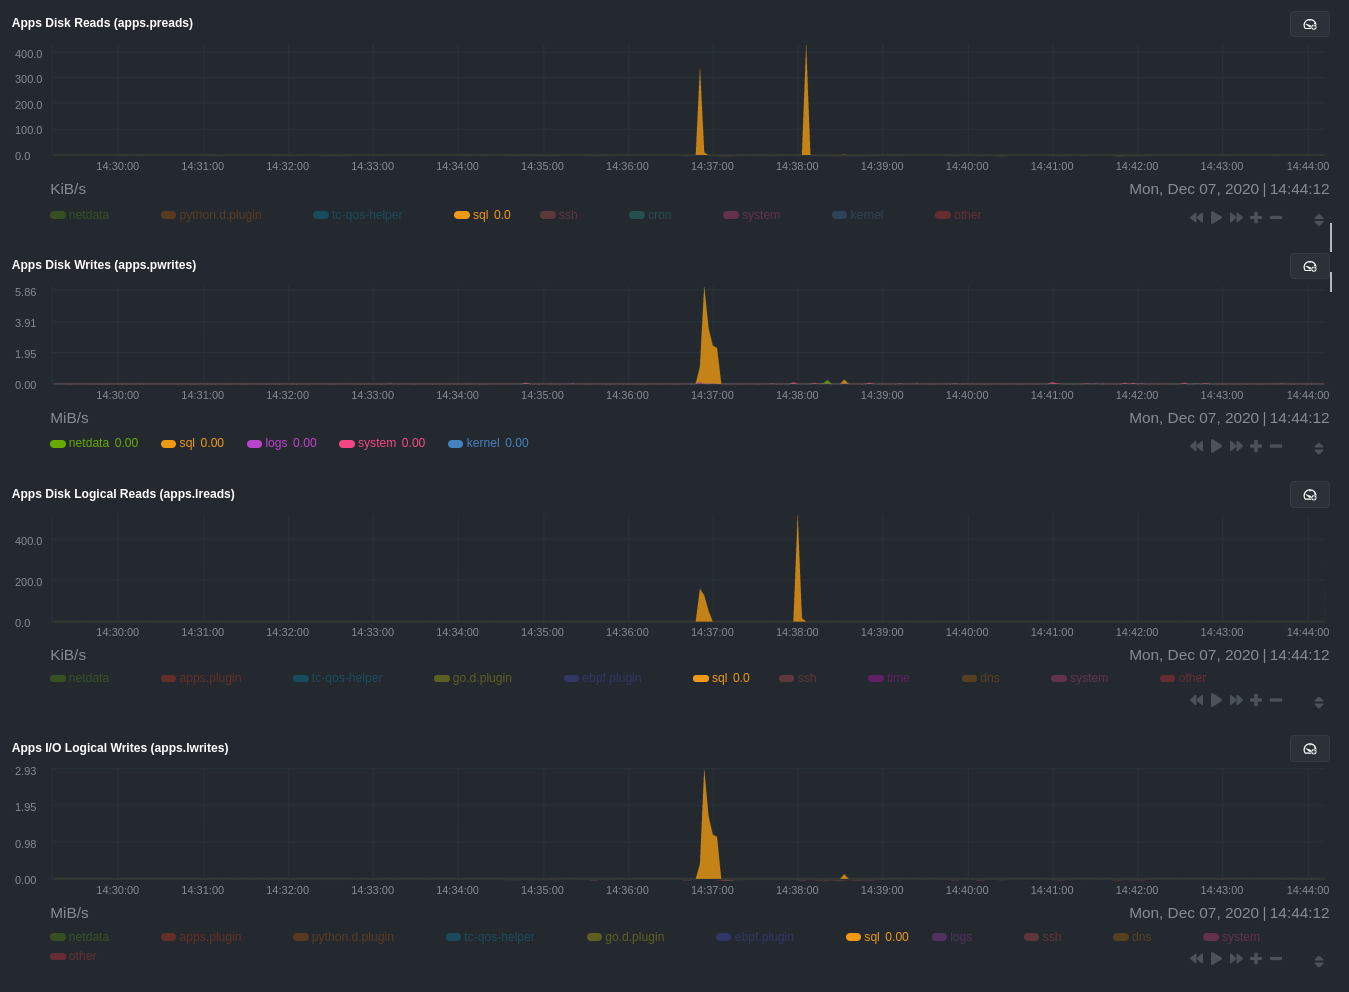 + +> 💡 Click on any dimension below a chart in Netdata Cloud (or to the right of a chart on a local Agent dashboard), to +> visualize only that dimension. This can be particularly useful in process monitoring to separate one process' +> utilization from the rest of the system. + +### Using Netdata's eBPF collector (`ebpf.plugin`) + +Netdata's eBPF collector puts its charts in two places. Of most importance to process monitoring are the **ebpf file**, +**ebpf syscall**, **ebpf process**, and **ebpf net** sub-sections under **Applications**, shown in the above screenshot. + +For example, running the above workload shows the entire "story" how MySQL interacts with the Linux kernel to open +processes/threads to handle a large number of SQL queries, then subsequently close the tasks as each query returns the +relevant data. + +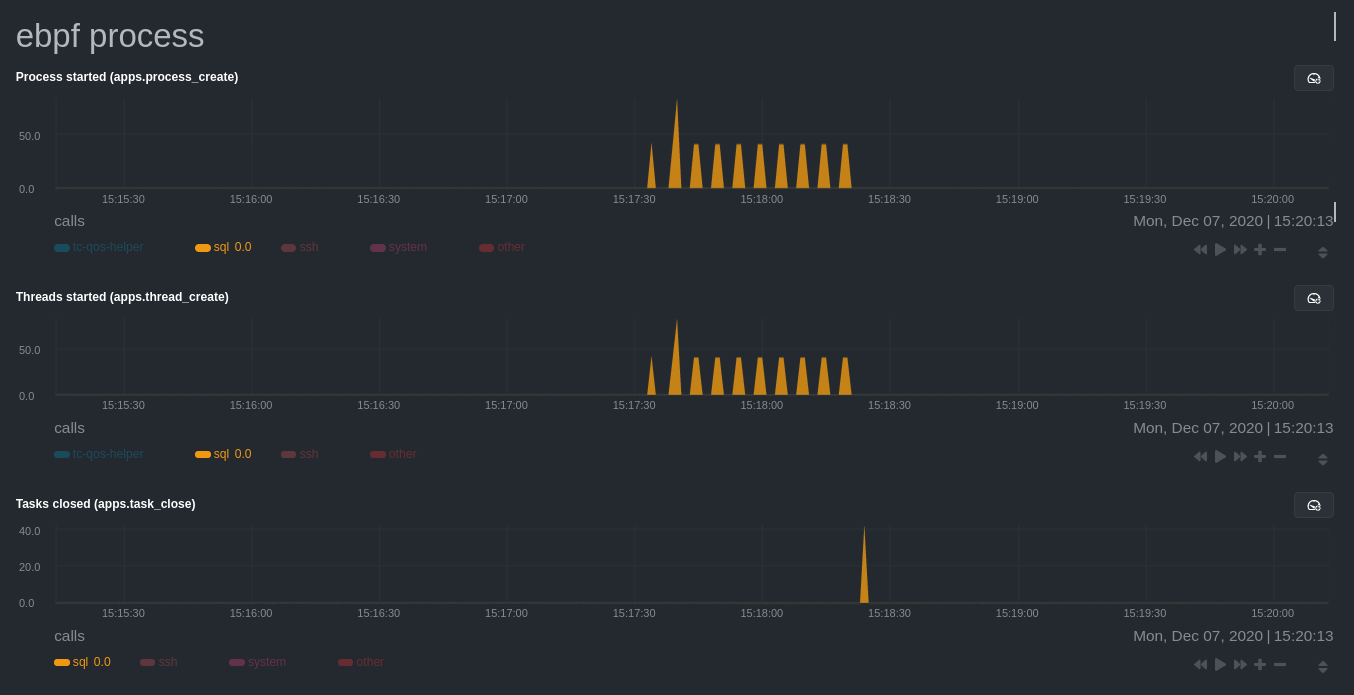 + +`ebpf.plugin` visualizes additional eBPF metrics, which are system-wide and not per-process, under the **eBPF** section. + +## What's next? + +Now that you have `apps_groups.conf` configured correctly, and know where to find per-process visualizations throughout +Netdata's ecosystem, you can precisely monitor the health and performance of any process on your node using per-second +metrics. + +For even more in-depth troubleshooting, see our guide on [monitoring and debugging applications with +eBPF](/docs/guides/troubleshoot/monitor-debug-applications-ebpf.md). + +If the process you're monitoring also has a [supported collector](/collectors/COLLECTORS.md), now is a great time to set +that up if it wasn't autodetected. With both process utilization and application-specific metrics, you should have every +piece of data needed to discover the root cause of an incident. See our [collector +setup](/docs/collect/enable-configure.md) doc for details. + +[Create new dashboards](/docs/visualize/create-dashboards.md) in Netdata Cloud using charts from `apps.plugin`, +`ebpf.plugin`, and application-specific collectors to build targeted dashboards for monitoring key processes across your +infrastructure. + +Try running [Metric Correlations](https://learn.netdata.cloud/docs/cloud/insights/metric-correlations) on a node that's +running the process(es) you're monitoring. Even if nothing is going wrong at the moment, Netdata Cloud's embedded +intelligence helps you better understand how a MySQL database, for example, might influence a system's volume of memory +page faults. And when an incident is afoot, use Metric Correlations to reduce mean time to resolution (MTTR) and +cognitive load. + +If you want more specific metrics from your custom application, check out Netdata's [statsd +support](/collectors/statsd.plugin/README.md). With statd, you can send detailed metrics from your application to +Netdata and visualize them with per-second granularity. Netdata's statsd collector works with dozens of [statsd server +implementations](https://github.com/etsy/statsd/wiki#client-implementations), which work with most application +frameworks. + +### Related reference documentation + +- [Netdata Agent · `apps.plugin`](/collectors/apps.plugin/README.md) +- [Netdata Agent · `ebpf.plugin`](/collectors/ebpf.plugin/README.md) +- [Netdata Agent · Dashboards](/web/README.md#dimensions) +- [Netdata Agent · MySQL collector](https://learn.netdata.cloud/docs/agent/collectors/go.d.plugin/modules/mysql) + +[](<>) diff --git a/docs/guides/monitor/stop-notifications-alarms.md b/docs/guides/monitor/stop-notifications-alarms.md new file mode 100644 index 000000000..587880ab1 --- /dev/null +++ b/docs/guides/monitor/stop-notifications-alarms.md @@ -0,0 +1,92 @@ +<!-- +title: "Stop notifications for individual alarms" +custom_edit_url: https://github.com/netdata/netdata/edit/master/docs/guides/monitor/stop-notifications-alarms.md +--> + +# Stop notifications for individual alarms + +In this short tutorial, you'll learn how to stop notifications for individual alarms in Netdata's health +monitoring system. We also refer to this process as _silencing_ the alarm. + +Why silence alarms? We designed Netdata's pre-configured alarms for production systems, so they might not be +relevant if you run Netdata on your laptop or a small virtual server. If they're not helpful, they can be a distraction +to real issues with health and performance. + +Silencing individual alarms is an excellent solution for situations where you're not interested in seeing a specific +alarm but don't want to disable a [notification system](/health/notifications/README.md) entirely. + +## Find the alarm configuration file + +To silence an alarm, you need to know where to find its configuration file. + +Let's use the `system.cpu` chart as an example. It's the first chart you'll see on most Netdata dashboards. + +To figure out which file you need to edit, open up Netdata's dashboard and, click the **Alarms** button at the top +of the dashboard, followed by clicking on the **All** tab. + +In this example, we're looking for the `system - cpu` entity, which, when opened, looks like this: + +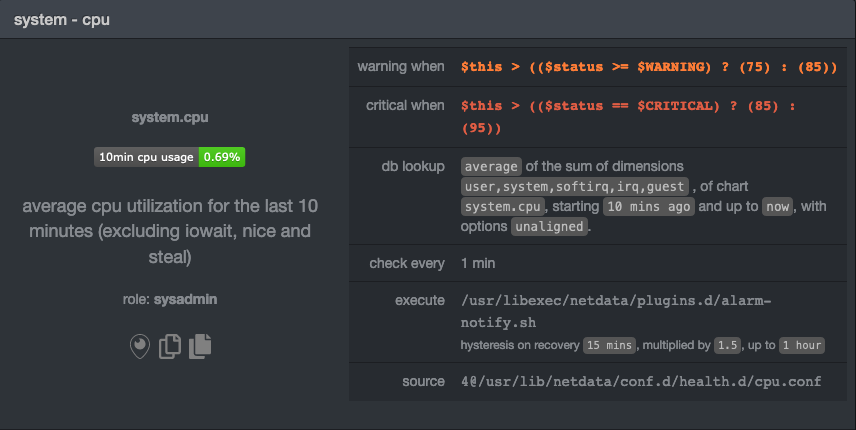 + +In the `source` row, you see that this chart is getting its configuration from +`4@/usr/lib/netdata/conf.d/health.d/cpu.conf`. The relevant part of begins at `health.d`: `health.d/cpu.conf`. That's +the file you need to edit if you want to silence this alarm. + +For more information about editing or referencing health configuration files on your system, see the [health +quickstart](/health/QUICKSTART.md#edit-health-configuration-files). + +## Edit the file to enable silencing + +To edit `health.d/cpu.conf`, use `edit-config` from inside of your Netdata configuration directory. + +```bash +cd /etc/netdata/ # Replace with your Netdata configuration directory, if not /etc/netdata/ +./edit-config health.d/cpu.conf +``` + +> You may need to use `sudo` or another method of elevating your privileges. + +The beginning of the file looks like this: + +```yaml +template: 10min_cpu_usage + on: system.cpu + os: linux + hosts: * + lookup: average -10m unaligned of user,system,softirq,irq,guest + units: % + every: 1m + warn: $this > (($status >= $WARNING) ? (75) : (85)) + crit: $this > (($status == $CRITICAL) ? (85) : (95)) + delay: down 15m multiplier 1.5 max 1h + info: average cpu utilization for the last 10 minutes (excluding iowait, nice and steal) + to: sysadmin +``` + +To silence this alarm, change `sysadmin` to `silent`. + +```yaml + to: silent +``` + +Use one of the available [methods](/health/QUICKSTART.md#reload-health-configuration) to reload your health configuration + and ensure you get no more notifications about that alarm**. + +You can add `to: silent` to any alarm you'd rather not bother you with notifications. + +## What's next? + +You should now know the fundamentals behind silencing any individual alarm in Netdata. + +To learn about _all_ of Netdata's health configuration possibilities, visit the [health reference +guide](/health/REFERENCE.md), or check out other [tutorials on health monitoring](/health/README.md#tutorials). + +Or, take better control over how you get notified about alarms via the [notification +system](/health/notifications/README.md). + +You can also use Netdata's [Health Management API](/web/api/health/README.md#health-management-api) to control health +checks and notifications while Netdata runs. With this API, you can disable health checks during a maintenance window or +backup process, for example. + +[](<>) diff --git a/docs/guides/monitor/visualize-monitor-anomalies.md b/docs/guides/monitor/visualize-monitor-anomalies.md new file mode 100644 index 000000000..f37dadc62 --- /dev/null +++ b/docs/guides/monitor/visualize-monitor-anomalies.md @@ -0,0 +1,147 @@ +<!-- +title: "Monitor and visualize anomalies with Netdata (part 2)" +description: "Using unsupervised anomaly detection and machine learning, get notified " +image: /img/seo/guides/monitor/visualize-monitor-anomalies.png +author: "Joel Hans" +author_title: "Editorial Director, Technical & Educational Resources" +author_img: "/img/authors/joel-hans.jpg" +custom_edit_url: https://github.com/netdata/netdata/edit/master/docs/guides/monitor/visualize-monitor-anomalies.md +--> + +# Monitor and visualize anomalies with Netdata (part 2) + +Welcome to part 2 of our series of guides on using _unsupervised anomaly detection_ to detect issues with your systems, +containers, and applications using the open-source Netdata Agent. For an introduction to detecting anomalies and +monitoring associated metrics, see [part 1](/docs/guides/monitor/anomaly-detection.md), which covers prerequisites and +configuration basics. + +With anomaly detection in the Netdata Agent set up, you will now want to visualize and monitor which charts have +anomalous data, when, and where to look next. + +> 💡 In certain cases, the anomalies collector doesn't start immediately after restarting the Netdata Agent. If this +> happens, you won't see the dashboard section or the relevant [charts](#visualize-anomalies-in-charts) right away. Wait +> a minute or two, refresh, and look again. If the anomalies charts and alarms are still not present, investigate the +> error log with `less /var/log/netdata/error.log | grep anomalies`. + +## Test anomaly detection + +Time to see the Netdata Agent's unsupervised anomaly detection in action. To trigger anomalies on the Nginx web server, +use `ab`, otherwise known as [Apache Bench](https://httpd.apache.org/docs/2.4/programs/ab.html). Despite its name, it +works just as well with Nginx web servers. Install it on Ubuntu/Debian systems with `sudo apt install apache2-utils`. + +> 💡 If you haven't followed the guide's example of using Nginx, an easy way to test anomaly detection on your node is +> to use the `stress-ng` command, which is available on most Linux distributions. Run `stress-ng --cpu 0` to create CPU +> stress or `stress-ng --vm 0` for RAM stress. Each test will cause some "collateral damage," in that you may see CPU +> utilization rise when running the RAM test, and vice versa. + +The following test creates a minimum of 10,000,000 requests for Nginx to handle, with a maximum of 10 at any given time, +with a run time of 60 seconds. If your system can handle those 10,000,000 in less than 60 seconds, `ab` will keep +sending requests until the timer runs out. + +```bash +ab -k -c 10 -t 60 -n 10000000 http://127.0.0.1/ +``` + +Let's see how Netdata detects this anomalous behavior and propagates information to you through preconfigured alarms and +dashboards that automatically organize anomaly detection metrics into meaningful charts to help you begin root cause +analysis (RCA). + +## Monitor anomalies with alarms + +The anomalies collector creates two "classes" of alarms for each chart captured by the `charts_regex` setting. All these +alarms are preconfigured based on your [configuration in +`anomalies.conf`](/docs/guides/monitor/anomaly-detection.md#configure-the-anomalies-collector). With the `charts_regex` +and `charts_to_exclude` settings from [part 1](/docs/guides/monitor/anomaly-detection.md) of this guide series, the +Netdata Agent creates 32 alarms driven by unsupervised anomaly detection. + +The first class triggers warning alarms when the average anomaly probability for a given chart has stayed above 50% for +at least the last two minutes. + +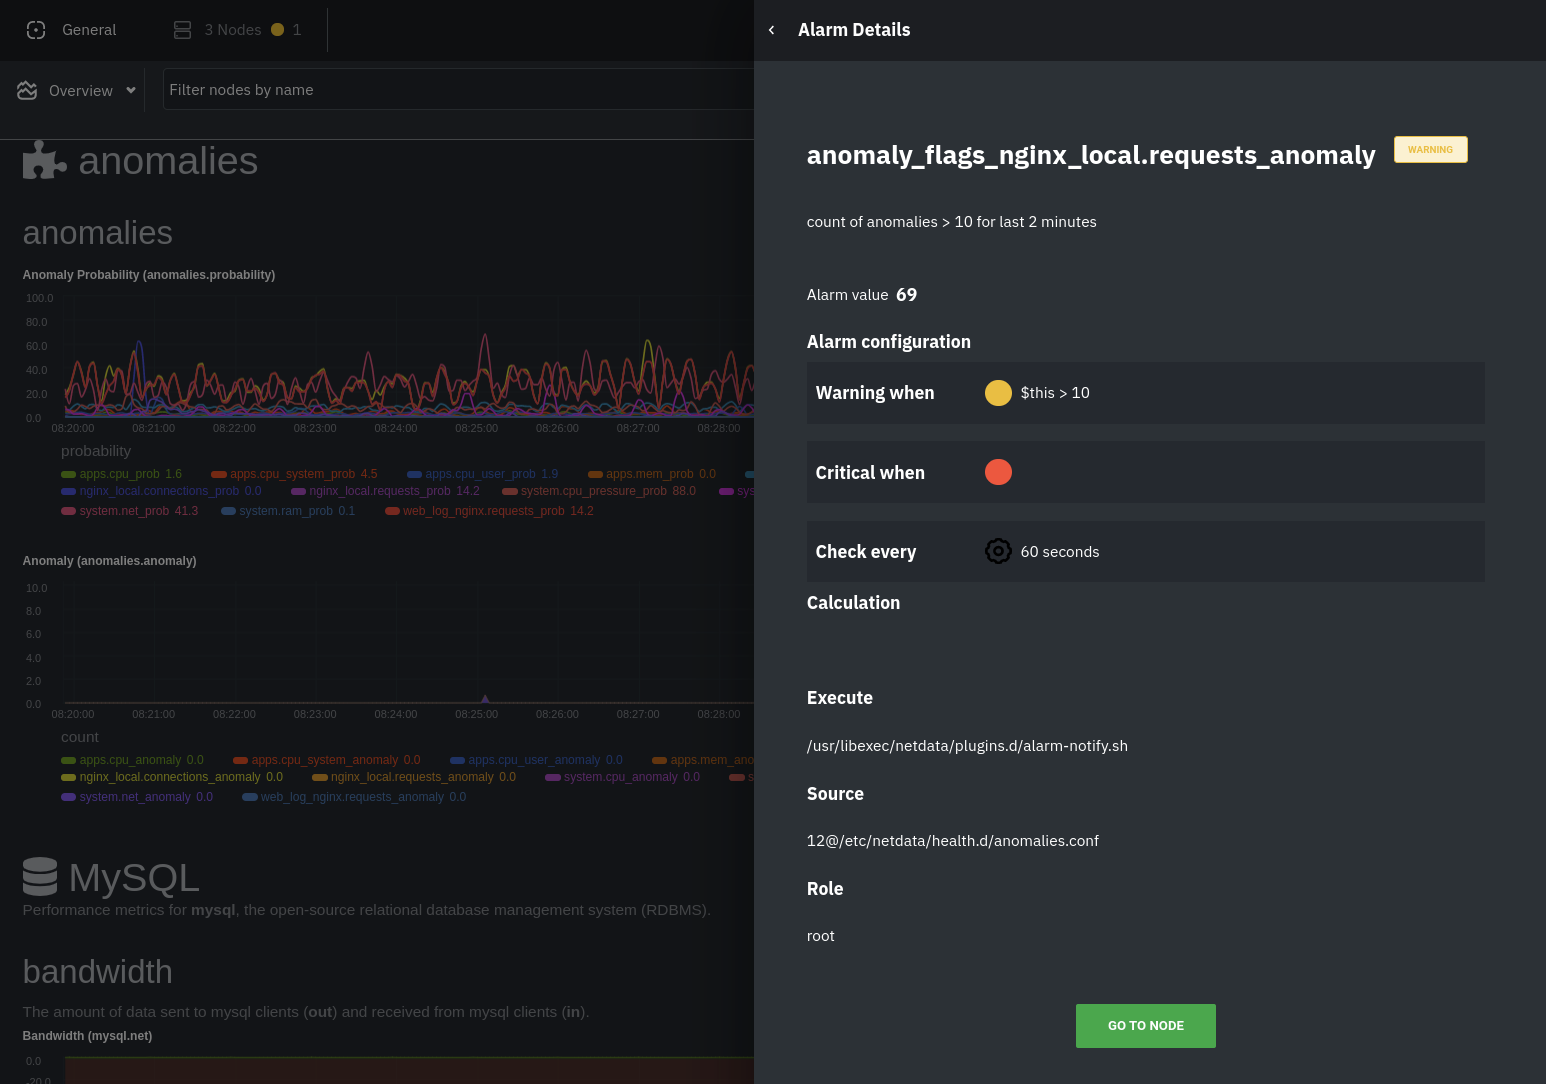 + +The second class triggers warning alarms when the number of anomalies in the last two minutes hits 10 or higher. + +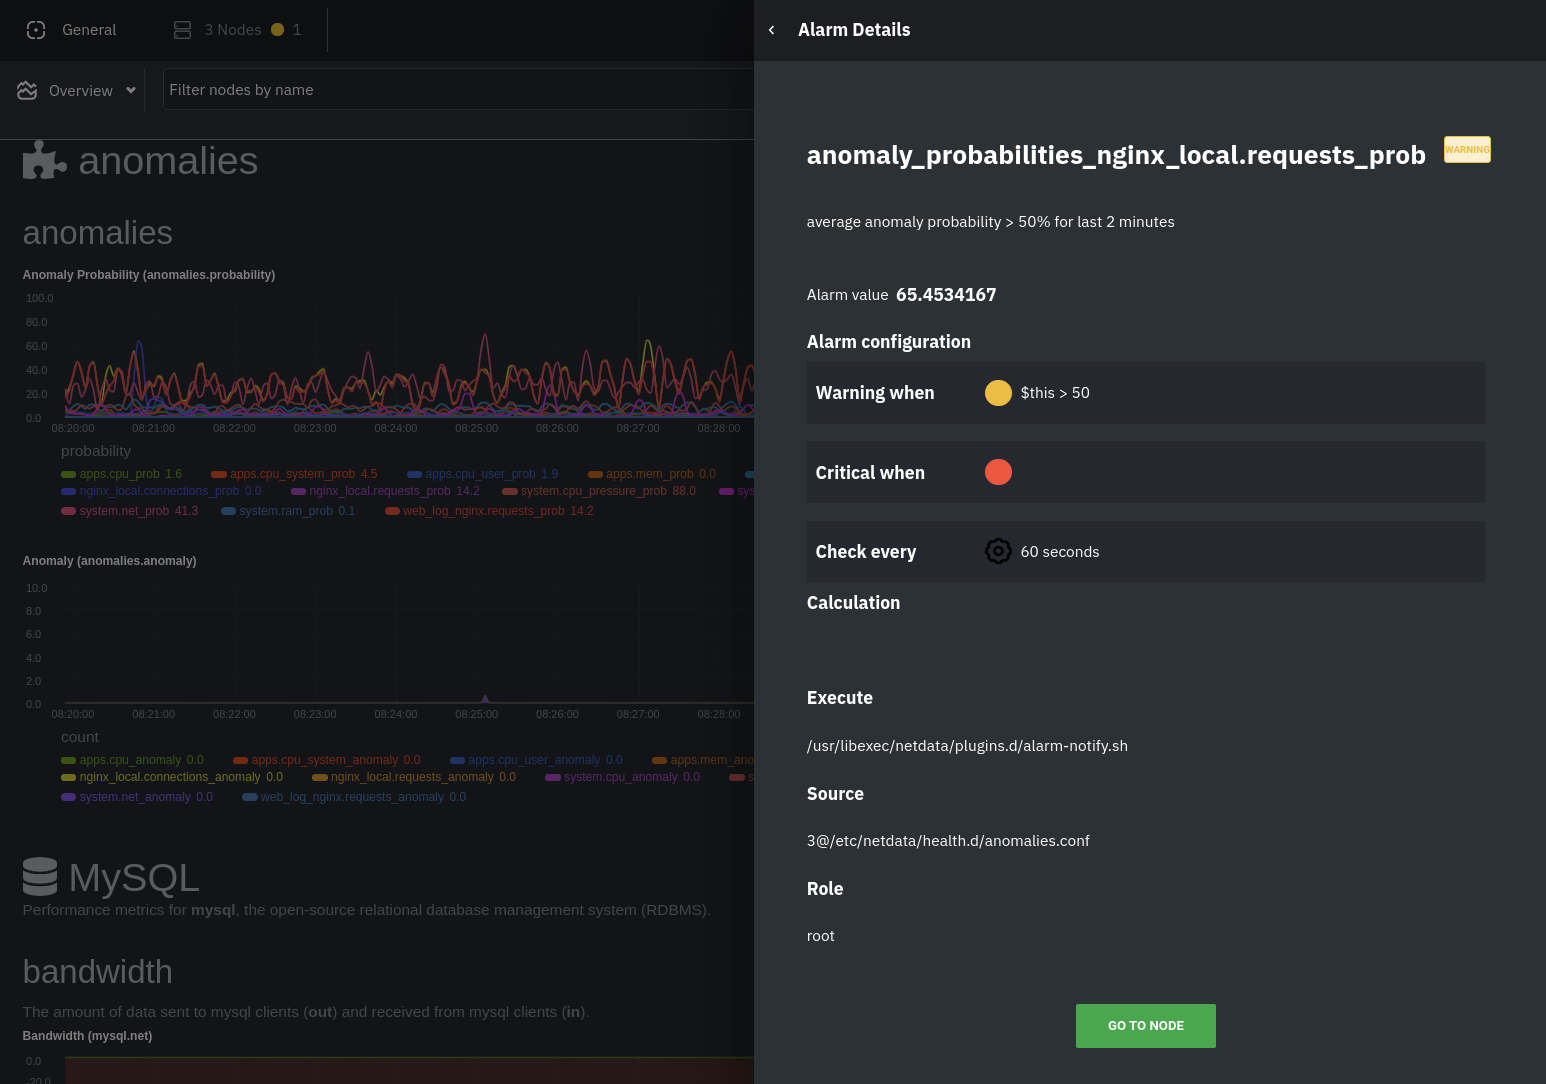 + +If you see either of these alarms in Netdata Cloud, the local Agent dashboard, or on your preferred notification +platform, it's a safe bet that the node's current metrics have deviated from normal. That doesn't necessarily mean +there's a full-blown incident, depending on what application/service you're using anomaly detection on, but it's worth +further investigation. + +As you use the anomalies collector, you may find that the default settings provide too many or too few genuine alarms. +In this case, [configure the alarm](/docs/monitor/configure-alarms.md) with `sudo ./edit-config +health.d/anomalies.conf`. Take a look at the `lookup` line syntax in the [health +reference](/health/REFERENCE.md#alarm-line-lookup) to understand how the anomalies collector automatically creates +alarms for any dimension on the `anomalies_local.probability` and `anomalies_local.anomaly` charts. + +## Visualize anomalies in charts + +In either [Netdata Cloud](https://app.netdata.cloud) or the local Agent dashboard at `http://NODE:19999`, click on the +**Anomalies** [section](/web/gui/README.md#sections) to see the pair of anomaly detection charts, which are +preconfigured to visualize per-second anomaly metrics based on your [configuration in +`anomalies.conf`](/docs/guides/monitor/anomaly-detection.md#configure-the-anomalies-collector). + +These charts have the contexts `anomalies.probability` and `anomalies.anomaly`. Together, these charts +create meaningful visualizations for immediately recognizing not only that something is going wrong on your node, but +give context as to where to look next. + +The `anomalies_local.probability` chart shows the probability that the latest observed data is anomalous, based on the +trained model. The `anomalies_local.anomaly` chart visualizes 0→1 predictions based on whether the latest observed +data is anomalous based on the trained model. Both charts share the same dimensions, which you configured via +`charts_regex` and `charts_to_exclude` in [part 1](/docs/guides/monitor/anomaly-detection.md). + +In other words, the `probability` chart shows the amplitude of the anomaly, whereas the `anomaly` chart provides quick +yes/no context. + +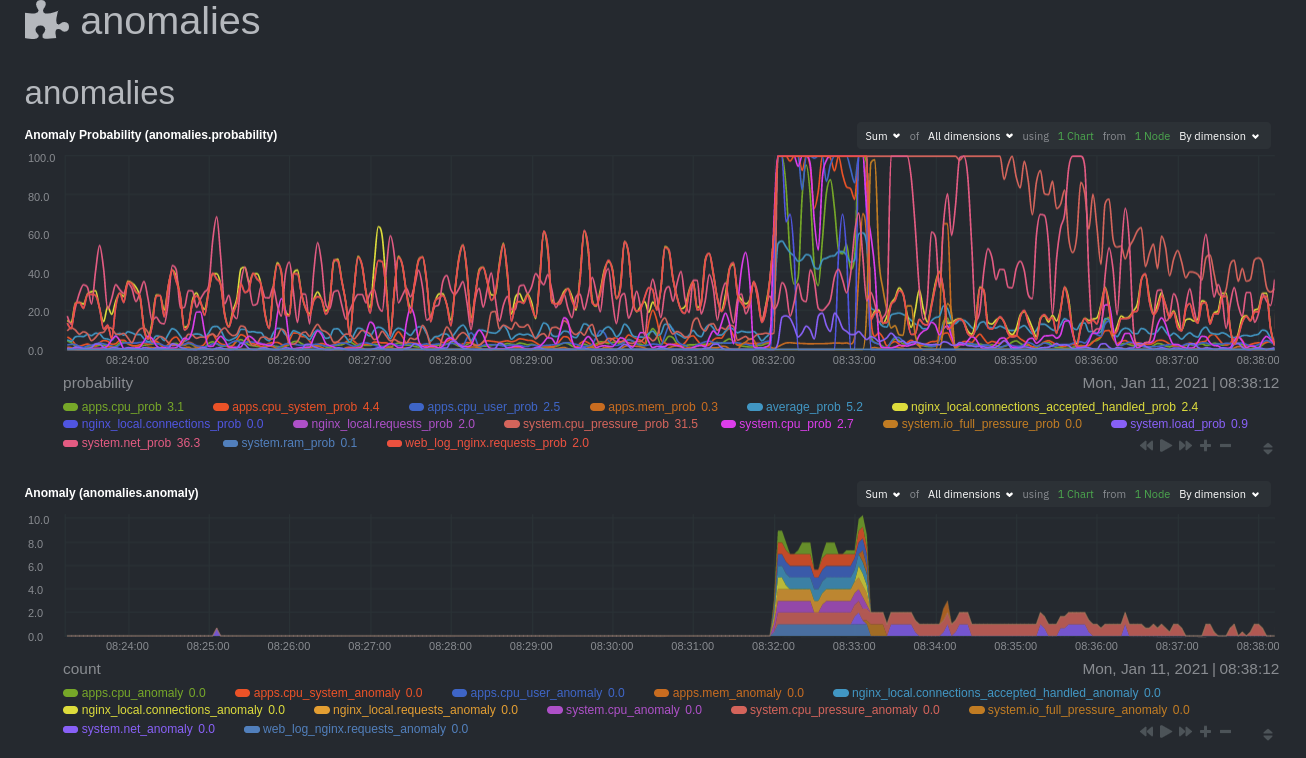 + +Before `08:32:00`, both charts show little in the way of verified anomalies. Based on the metrics the anomalies +collector has trained on, a certain percentage of anomaly probability score is normal, as seen in the +`web_log_nginx_requests_prob` dimension and a few others. What you're looking for is large deviations from the "noise" +in the `anomalies.probability` chart, or any increments to the `anomalies.anomaly` chart. + +Unsurprisingly, the stress test that began at `08:32:00` caused significant changes to these charts. The three +dimensions that immediately shot to 100% anomaly probability, and remained there during the test, were +`web_log_nginx.requests_prob`, `nginx_local.connections_accepted_handled_prob`, and `system.cpu_pressure_prob`. + +## Build an anomaly detection dashboard + +[Netdata Cloud](https://app.netdata.cloud) features a drag-and-drop [dashboard +editor](/docs/visualize/create-dashboards.md) that helps you create entirely new dashboards with charts targeted for +your specific applications. + +For example, here's a dashboard designed for visualizing anomalies present in an Nginx web server, including +documentation about why the dashboard exists and where to look next based on what you're seeing: + +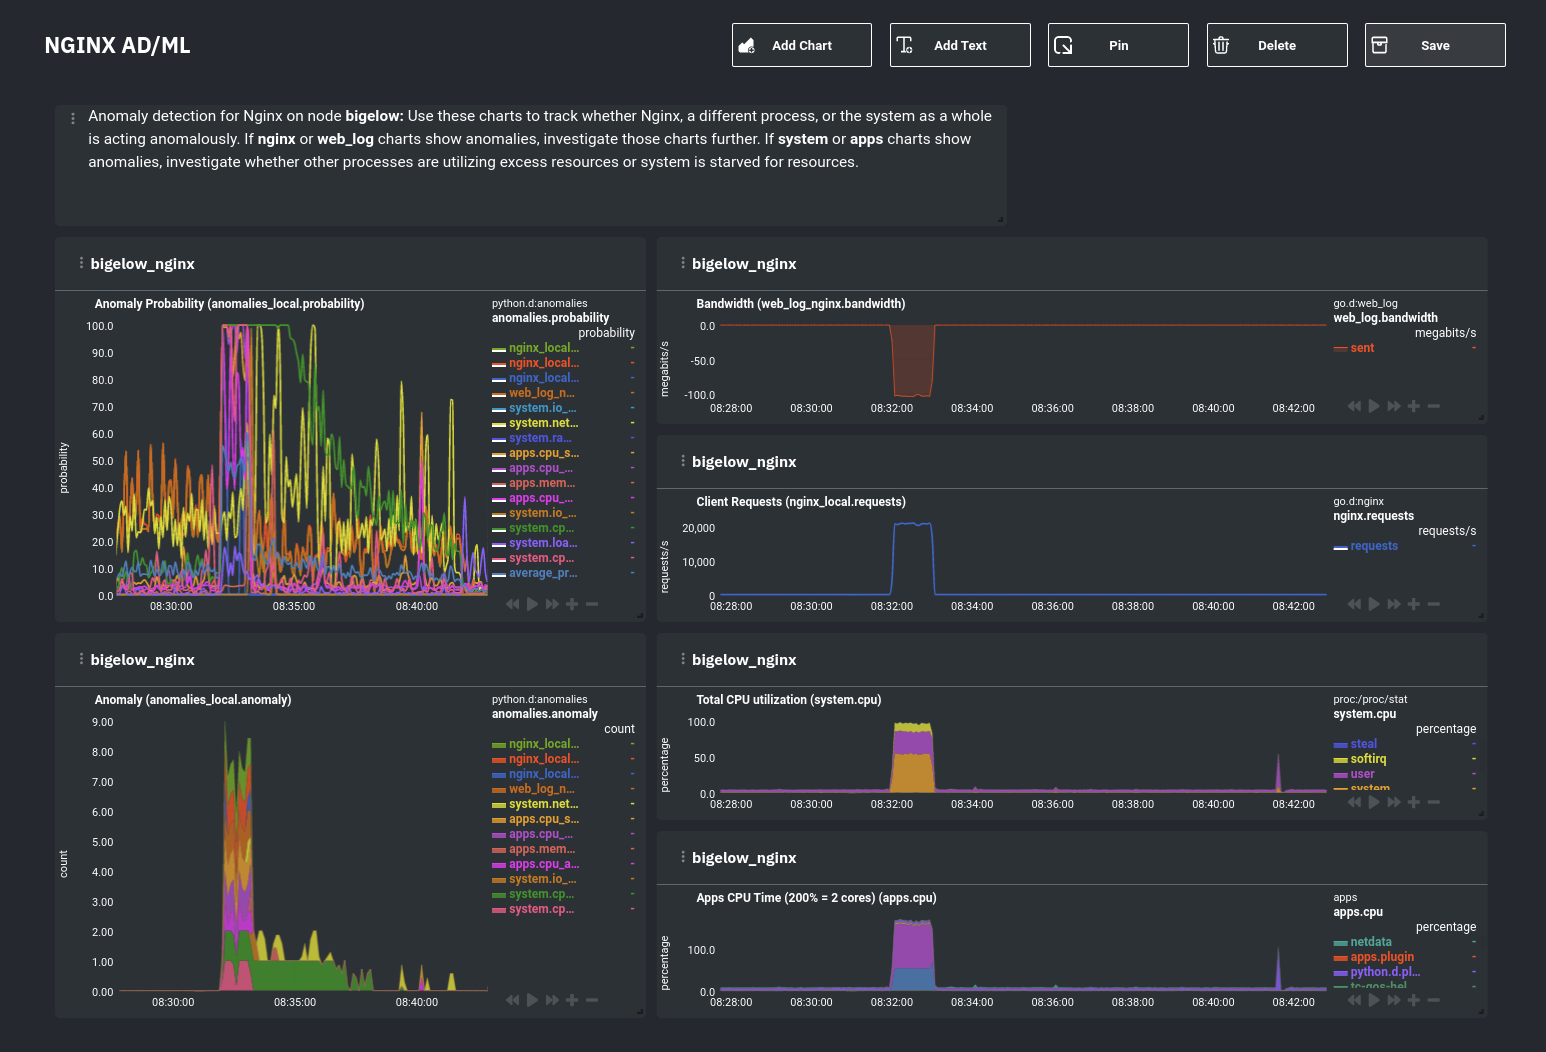 + +Use the anomaly charts for instant visual identification of potential anomalies, and then Nginx-specific charts, in the +right column, to validate whether the probability and anomaly counters are showing a valid incident worth further +investigation using [Metric Correlations](https://learn.netdata.cloud/docs/cloud/insights/metric-correlations) to narrow +the dashboard into only the charts relevant to what you're seeing from the anomalies collector. + +## What's next? + +Between this guide and [part 1](/docs/guides/monitor/anomaly-detection.md), which covered setup and configuration, you +now have a fundamental understanding of how unsupervised anomaly detection in Netdata works, from root cause to alarms +to preconfigured or custom dashboards. + +We'd love to hear your feedback on the anomalies collector. Hop over to the [community +forum](https://community.netdata.cloud/t/anomalies-collector-feedback-megathread/767), and let us know if you're already getting value from +unsupervised anomaly detection, or would like to see something added to it. You might even post a custom configuration +that works well for monitoring some other popular application, like MySQL, PostgreSQL, Redis, or anything else we +[support through collectors](/collectors/COLLECTORS.md). + +In part 3 of this series on unsupervised anomaly detection using Netdata, we'll create a custom model to apply +unsupervised anomaly detection to an entire mission-critical application. Stay tuned! + +### Related reference documentation + +- [Netdata Agent · Anomalies collector](/collectors/python.d.plugin/anomalies/README.md) +- [Netdata Cloud · Build new dashboards](https://learn.netdata.cloud/docs/cloud/visualize/dashboards) + +[](<>) diff --git a/docs/guides/step-by-step/step-00.md b/docs/guides/step-by-step/step-00.md new file mode 100644 index 000000000..794366645 --- /dev/null +++ b/docs/guides/step-by-step/step-00.md @@ -0,0 +1,115 @@ +<!-- +title: "The step-by-step Netdata guide" +date: 2020-03-31 +custom_edit_url: https://github.com/netdata/netdata/edit/master/docs/guides/step-by-step/step-00.md +--> + +# The step-by-step Netdata guide + +Welcome to Netdata! We're glad you're interested in our health monitoring and performance troubleshooting system. + +Because Netdata is entirely open-source software, you can use it free of charge, whether you want to monitor one or ten +thousand systems! All our code is hosted on [GitHub](https://github.com/netdata/netdata). + +This guide is designed to help you understand what Netdata is, what it's capable of, and how it'll help you make +faster and more informed decisions about the health and performance of your systems and applications. If you're +completely new to Netdata, or have never tried health monitoring/performance troubleshooting systems before, this +guide is perfect for you. + +If you have monitoring experience, or would rather get straight into configuring Netdata to your needs, you can jump +straight into code and configurations with our [getting started guide](/docs/getting-started.md). + +> This guide contains instructions for Netdata installed on a Linux system. Many of the instructions will work on +> other supported operating systems, like FreeBSD and macOS, but we can't make any guarantees. + +## Where to go if you need help + +No matter where you are in this Netdata guide, if you need help, head over to our [GitHub +repository](https://github.com/netdata/netdata/). That's where we collect questions from users, help fix their bugs, and +point people toward documentation that explains what they're having trouble with. + +Click on the **issues** tab to see all the conversations we're having with Netdata users. Use the search bar to find +previously-written advice for your specific problem, and if you don't see any results, hit the **New issue** button to +send us a question. + +Or, if that's too complicated, feel free to send this guide's author [an email](mailto:joel@netdata.cloud). + +## Before we get started + +Let's make sure you have Netdata installed on your system! + +> If you already installed Netdata, feel free to skip to [Step 1: Netdata's building blocks](step-01.md). + +The easiest way to install Netdata on a Linux system is our `kickstart.sh` one-line installer. Run this on your system +and let it take care of the rest. + +This script will install Netdata from source, keep it up to date with nightly releases, connects to the Netdata +[registry](/registry/README.md), and sends [_anonymous statistics_](/docs/anonymous-statistics.md) about how you use +Netdata. We use this information to better understand how we can improve the Netdata experience for all our users. + +```bash +bash <(curl -Ss https://my-netdata.io/kickstart.sh) +``` + +Once finished, you'll have Netdata installed, and you'll be set up to get _nightly updates_ to get the latest features, +improvements, and bugfixes. + +If this method doesn't work for you, or you want to use a different process, visit our [installation +documentation](/packaging/installer/README.md) for details. + +## Netdata fundamentals + +[Step 1. Netdata's building blocks](step-01.md) + +In this introductory step, we'll talk about the fundamental ideas, philosophies, and UX decisions behind Netdata. + +[Step 2. Get to know Netdata's dashboard](step-02.md) + +Visit Netdata's dashboard to explore, manipulate charts, and check out alarms. Get your first taste of visual anomaly +detection. + +[Step 3. Monitor more than one system with Netdata](step-03.md) + +While the dashboard lets you quickly move from one agent to another, Netdata Cloud is our SaaS solution for monitoring +the health of many systems. We'll cover its features and the benefits of using Netdata Cloud on top of the dashboard. + +[Step 4. The basics of configuring Netdata](step-04.md) + +While Netdata can monitor thousands of metrics in real-time without any configuration, you may _want_ to tweak some +settings based on your system's resources. + +## Intermediate steps + +[Step 5. Health monitoring alarms and notifications](step-05.md) + +Learn how to tune, silence, and write custom alarms. Then enable notifications so you never miss a change in health +status or performance anomaly. + +[Step 6. Collect metrics from more services and apps](step-06.md) + +Learn how to enable/disable collection plugins and configure a collection plugin job to add more charts to your Netdata +dashboard and begin monitoring more apps and services, like MySQL, Nginx, MongoDB, and hundreds more. + +[Step 7. Netdata's dashboard in depth](step-07.md) + +Now that you configured your Netdata monitoring agent to your exact needs, you'll dive back into metrics snapshots, +updates, and the dashboard's settings. + +## Advanced steps + +[Step 8. Building your first custom dashboard](step-08.md) + +Using simple HTML, CSS, and JavaScript, we'll build a custom dashboard that displays essential information in any format +you choose. You can even monitor many systems from a single HTML file. + +[Step 9. Long-term metrics storage](step-09.md) + +By default, Netdata can store lots of real-time metrics, but you can also tweak our custom database engine to your +heart's content. Want to take your Netdata metrics elsewhere? We're happy to help you archive data to Prometheus, +MongoDB, TimescaleDB, and others. + +[Step 10. Set up a proxy](step-10.md) + +Run Netdata behind an Nginx proxy to improve performance, and enable TLS/HTTPS for better security. + +[](<>) diff --git a/docs/guides/step-by-step/step-01.md b/docs/guides/step-by-step/step-01.md new file mode 100644 index 000000000..cdcfcd7a2 --- /dev/null +++ b/docs/guides/step-by-step/step-01.md @@ -0,0 +1,156 @@ +<!-- +title: "Step 1. Netdata's building blocks" +custom_edit_url: https://github.com/netdata/netdata/edit/master/docs/guides/step-by-step/step-01.md +--> + +# Step 1. Netdata's building blocks + +Netdata is a distributed and real-time _health monitoring and performance troubleshooting toolkit_ for monitoring your +systems and applications. + +Because the monitoring agent is highly-optimized, you can install it all your physical systems, containers, IoT devices, +and edge devices without disrupting their core function. + +By default, and without configuration, Netdata delivers real-time insights into everything happening on the system, from +CPU utilization to packet loss on every network device. Netdata can also auto-detect metrics from hundreds of your +favorite services and applications, like MySQL/MariaDB, Docker, Nginx, Apache, MongoDB, and more. + +All metrics are automatically-updated, providing interactive dashboards that allow you to dive in, discover anomalies, +and figure out the root cause analysis of any issue. + +Best of all, Netdata is entirely free, open-source software! Solo developers and enterprises with thousands of systems +can both use it free of charge. We're hosted on [GitHub](https://github.com/netdata/netdata). + +Want to learn about the history of Netdata, and what inspired our CEO to build it in the first place, and where we're +headed? Read Costa's comprehensive blog post: _[Redefining monitoring with Netdata (and how it came to +be)](https://blog.netdata.cloud/posts/redefining-monitoring-netdata/)_. + +## What you'll learn in this step + +In the first step of the Netdata guide, you'll learn about: + +- [Netdata's core features](#netdatas-core-features) +- [Why you should use Netdata](#why-you-should-use-netdata) +- [How Netdata has complementary systems, not competitors](#how-netdata-has-complementary-systems-not-competitors) + +Let's get started! + +## Netdata's core features + +Netdata has only been around for a few years, but it's a complex piece of software. Here are just some of the features +we'll cover throughout this guide. + +- A sophisticated **dashboard**, which we'll cover in [step 2](step-02.md). The real-time, highly-granular dashboard, + with hundreds of charts, is your main source of information about the health and performance of your systems/ + applications. We designed the dashboard with anomaly detection and quick analysis in mind. We'll return to + dashboard-related topics in both [step 7](step-07.md) and [step 8](step-08.md). +- **Long-term metrics storage** by default. With our new database engine, you can store days, weeks, or months of + per-second historical metrics. Or you can archive metrics to another database, like MongoDB or Prometheus. We'll + cover all these options in [step 9](step-09.md). +- **No configuration necessary**. Without any configuration, you'll get thousands of real-time metrics and hundreds of + alarms designed by our community of sysadmin experts. But you _can_ configure Netdata in a lot of ways, some of + which we'll cover in [step 4](step-04.md). +- **Distributed, per-system installation**. Instead of centralizing metrics in one location, you install Netdata on + _every_ system, and each system is responsible for its metrics. Having distributed agents reduces cost and lets + Netdata run on devices with little available resources, such as IoT and edge devices, without affecting their core + purpose. +- **Sophisticated health monitoring** to ensure you always know when an anomaly hits. In [step 5](step-05.md), we dive + into how you can tune alarms, write your own alarm, and enable two types of notifications. +- **High-speed, low-resource collectors** that allow you to collect thousands of metrics every second while using only + a fraction of your system's CPU resources and a few MiB of RAM. +- **Netdata Cloud** is our SaaS toolkit that helps Netdata users monitor the health and performance of entire + infrastructures, whether they are two or two thousand (or more!) systems. We'll cover Netdata Cloud in [step + 3](step-03.md). + +## Why you should use Netdata + +Because you care about the health and performance of your systems and applications, and all of the awesome features we +just mentioned. And it's free! + +All these may be valid reasons, but let's step back and talk about Netdata's _principles_ for health monitoring and +performance troubleshooting. We have a lot of [complementary +systems](#how-netdata-has-complementary-systems-not-competitors), and we think there's a good reason why Netdata should +always be your first choice when troubleshooting an anomaly. + +We built Netdata on four principles. + +### Per-second data collection + +Our first principle is per-second data collection for all metrics. + +That matters because you can't monitor a 2-second service-level agreement (SLA) with 10-second metrics. You can't detect +quick anomalies if your metrics don't show them. + +How do we solve this? By decentralizing monitoring. Each node is responsible for collecting metrics, triggering alarms, +and building dashboards locally, and we work hard to ensure it does each step (and others) with remarkable efficiency. +For example, Netdata can [collect 100,000 metrics](https://github.com/netdata/netdata/issues/1323) every second while +using only 9% of a single server-grade CPU core! + +By decentralizing monitoring and emphasizing speed at every turn, Netdata helps you scale your health monitoring and +performance troubleshooting to an infrastructure of every size. _And_ you get to keep per-second metrics in long-term +storage thanks to the database engine. + +### Unlimited metrics + +We believe all metrics are fundamentally important, and all metrics should be available to the user. + +If you don't collect _all_ the metrics a system creates, you're only seeing part of the story. It's like saying you've +read a book after skipping all but the last ten pages. You only know the ending, not everything that leads to it. + +Most monitoring solutions exist to poke you when there's a problem, and then tell you to use a dozen different console +tools to find the root cause. Netdata prefers to give you every piece of information you might need to understand why an +anomaly happened. + +### Meaningful presentation + +We want every piece of Netdata's dashboard not only to look good and update every second, but also provide context as to +what you're looking at and why it matters. + +The principle of meaningful presentation is fundamental to our dashboard's user experience (UX). We could have put +charts in a grid or hidden some behind tabs or buttons. We instead chose to stack them vertically, on a single page, so +you can visually see how, for example, a jump in disk usage can also increase system load. + +Here's an example of a system undergoing a disk stress test: + +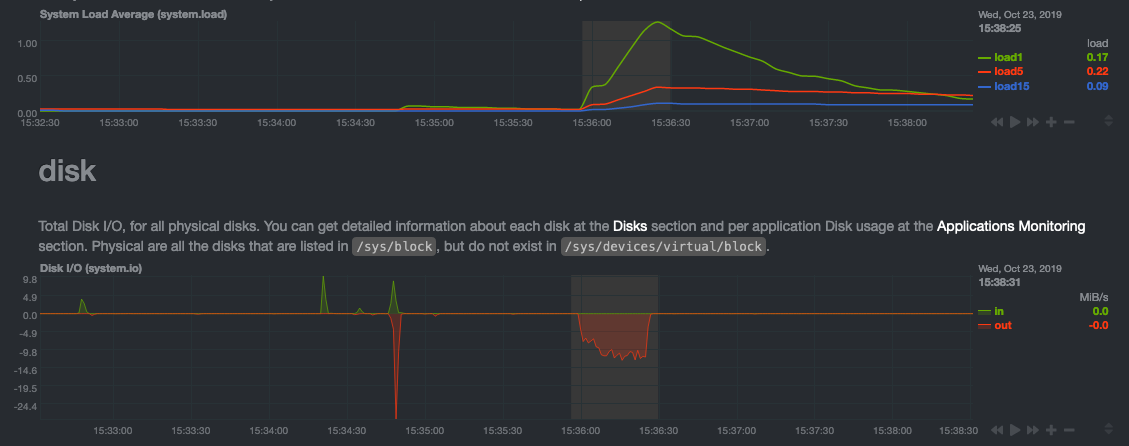 + +> For the curious, here's the command: `stress-ng --fallocate 4 --fallocate-bytes 4g --timeout 1m --metrics --verify +> --times`! + +### Immediate results + +Finally, Netdata should be usable from the moment you install it. + +As we've talked about, and as you'll learn in the following nine steps, Netdata comes installed with: + +- Auto-detected metrics +- Human-readable units +- Metrics that are structured into charts, families, and contexts +- Automatically generated dashboards +- Charts designed for visual anomaly detection +- Hundreds of pre-configured alarms + +By standardizing your monitoring infrastructure, Netdata tries to make at least one part of your administrative tasks +easy! + +## How Netdata has complementary systems, not competitors + +We'll cover this quickly, as you're probably eager to get on with using Netdata itself. + +We don't want to lock you in to using Netdata by itself, and forever. By supporting [archiving to +external databases](/exporting/README.md) like Graphite, Prometheus, OpenTSDB, MongoDB, and others, you can use Netdata _in +conjunction_ with software that might seem like our competitors. + +We don't want to "wage war" with another monitoring solution, whether it's commercial, open-source, or anything in +between. We just want to give you all the metrics every second, and what you do with them next is your business, not +ours. Our mission is helping people create more extraordinary infrastructures! + +## What's next? + +We think it's imperative you understand why we built Netdata the way we did. But now that we have that behind us, let's +get right into that dashboard you've heard so much about. + +[Next: Get to know Netdata's dashboard →](step-02.md) + +[](<>) diff --git a/docs/guides/step-by-step/step-02.md b/docs/guides/step-by-step/step-02.md new file mode 100644 index 000000000..c87712c9a --- /dev/null +++ b/docs/guides/step-by-step/step-02.md @@ -0,0 +1,208 @@ +<!-- +title: "Step 2. Get to know Netdata's dashboard" +date: 2020-05-04 +custom_edit_url: https://github.com/netdata/netdata/edit/master/docs/guides/step-by-step/step-02.md +--> + +# Step 2. Get to know Netdata's dashboard + +Welcome to Netdata proper! Now that you understand how Netdata works, how it's built, and why we built it, you can start +working with the dashboard directly. + +This step-by-step guide assumes you've already installed Netdata on a system of yours. If you haven't yet, hop back over +to ["step 0"](step-00.md#before-we-get-started) for information about our one-line installer script. Or, view the +[installation docs](/packaging/installer/README.md) to learn more. Once you have Netdata installed, you can hop back +over here and dig in. + +## What you'll learn in this step + +In this step of the Netdata guide, you'll learn how to: + +- [Visit and explore the dashboard](#visit-and-explore-the-dashboard) +- [Explore available charts using menus](#explore-available-charts-using-menus) +- [Read the descriptions accompanying charts](#read-the-descriptions-accompanying-charts) +- [Interact with charts](#interact-with-charts) +- [See raised alarms and the alarm log](#see-raised-alarms-and-the-alarm-log) + +Let's get started! + +## Visit and explore the dashboard + +Netdata's dashboard is where you interact with your system's metrics. Time to open it up and start exploring. Open up +your browser of choice. + +Open up your web browser of choice and navigate to `http://NODE:19999`, replacing `NODE` with the IP address or hostname +of your Agent. If you're unsure, try `http://localhost:19999` first. Hit **Enter**. Welcome to Netdata! + + + +> From here on out in this guide, we'll refer to the address you use to view your dashboard as `NODE`. Be sure to +> replace it with either `localhost`, the IP address, or the hostname of your system. + +## Explore available charts using menus + +**Menus** are located on the right-hand side of the Netdata dashboard. You can use these to navigate to the +charts you're interested in. + + + +Netdata shows all its charts on a single page, so you can also scroll up and down using the mouse wheel, your +touchscreen/touchpad, or the scrollbar. + +Both menus and the items displayed beneath them, called **submenus**, are populated automatically by Netdata based on +what it's collecting. If you run Netdata on many different systems using different OS types or versions, the +menus and submenus may look a little different for each one. + +To learn more about menus, see our documentation about [navigating the standard +dashboard](/web/gui/README.md#metrics-menus). + +> ❗ By default, Netdata only creates and displays charts if the metrics are _not zero_. So, you may be missing some +> charts, menus, and submenus if those charts have zero metrics. You can change this by changing the **Which dimensions +> to show?** setting to **All**. In addition, if you start Netdata and immediately load the dashboard, not all +> charts/menus/submenus may be displayed, as some collectors can take a while to initialize. + +## Read the descriptions accompanying charts + +Many charts come with a short description of what dimensions the chart is displaying and why they matter. + +For example, here's the description that accompanies the **swap** chart. + + + +If you're new to health monitoring and performance troubleshooting, we recommend you spend some time reading these +descriptions and learning more at the pages linked above. + +## Understand charts, dimensions, families, and contexts + +A **chart** is an interactive visualization of one or more collected/calculated metrics. You can see the name (also +known as its unique ID) of a chart by looking at the top-left corner of a chart and finding the parenthesized text. On a +Linux system, one of the first charts on the dashboard will be the system CPU chart, with the name `system.cpu`: + + + +A **dimension** is any value that gets shown on a chart. The value can be raw data or calculated values, such as +percentages, aggregates, and more. Most charts will have more than one dimension, in which case it will display each in +a different color. Here, a `system.cpu` chart is showing many dimensions, such as `user`, `system`, `softirq`, `irq`, +and more. + +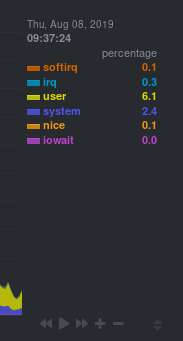 + +A **family** is _one_ instance of a monitored hardware or software resource that needs to be monitored and displayed +separately from similar instances. For example, if your system has multiple partitions, Netdata will create different +families for `/`, `/boot`, `/home`, and so on. Same goes for entire disks, network devices, and more. + + + +A **context** groups several charts based on the types of metrics being collected and displayed. For example, the +**Disk** section often has many contexts: `disk.io`, `disk.ops`, `disk.backlog`, `disk.util`, and so on. Netdata uses +this context to create individual charts and then groups them by family. You can always see the context of any chart by +looking at its name or hovering over the chart's date. + +It's important to understand these differences, as Netdata uses charts, dimensions, families, and contexts to create +health alarms and configure collectors. To read even more about the differences between all these elements of the +dashboard, and how they affect other parts of Netdata, read our [dashboards +documentation](/web/README.md#charts-contexts-families). + +## Interact with charts + +We built Netdata to be a big sandbox for learning more about your systems and applications. Time to play! + +Netdata's charts are fully interactive. You can pan through historical metrics, zoom in and out, select specific +timeframes for further analysis, resize charts, and more. + +Best of all, Whenever you use a chart in this way, Netdata synchronizes all the other charts to match it. + + + +### Pan, zoom, highlight, and reset charts + +You can change how charts show their metrics in a few different ways, each of which have a few methods: + +| Change | Method #1 | Method #2 | Method #3 | +| ------------------------------------------------- | ----------------------------------- | --------------------------------------------------------- | ---------------------------------------------------------- | +| **Reset** charts to default auto-refreshing state | `double click` | `double tap` (touchpad/touchscreen) | | +| **Select** a certain timeframe | `ALT` + `mouse selection` | `⌘` + `mouse selection` (macOS) | | +| **Pan** forward or back in time | `click and drag` | `touch and drag` (touchpad/touchscreen) | | +| **Zoom** to a specific timeframe | `SHIFT` + `mouse selection` | | | +| **Zoom** in/out | `SHIFT`/`ALT` + `mouse scrollwheel` | `SHIFT`/`ALT` + `two-finger pinch` (touchpad/touchscreen) | `SHIFT`/`ALT` + `two-finger scroll` (touchpad/touchscreen) | + +These interactions can also be triggered using the icons on the bottom-right corner of every chart. They are, +respectively, `Pan Left`, `Reset`, `Pan Right`, `Zoom In`, and `Zoom Out`. + +### Show and hide dimensions + +Each dimension can be hidden by clicking on it. Hiding dimensions simplifies the chart and can help you better discover +exactly which aspect of your system is behaving strangely. + +### Resize charts + +Additionally, resize charts by clicking-and-dragging the icon on the bottom-right corner of any chart. To restore the +chart to its original height, double-click the same icon. + + + +To learn more about other options and chart interactivity, read our [dashboard documentation](/web/README.md). + +## See raised alarms and the alarm log + +Aside from performance troubleshooting, the Agent helps you monitor the health of your systems and applications. That's +why every Netdata installation comes with dozens of pre-configured alarms that trigger alerts when your system starts +acting strangely. + +Find the **Alarms** button in the top navigation bring up a modal that shows currently raised alarms, all running +alarms, and the alarms log. + +Here is an example of a raised `system.cpu` alarm, followed by the full list and alarm log: + + + +And a static screenshot of the raised CPU alarm: + + + +The alarm itself is named *system - cpu**, and its context is `system.cpu`. Beneath that is an auto-updating badge that +shows the latest value the chart that triggered the alarm. + +With the three icons beneath that and the **role** designation, you can: + +1. Scroll to the chart associated with this raised alarm. +2. Copy a link to the badge to your clipboard. +3. Copy the code to embed the badge onto another web page using an `<embed>` element. + +The table on the right-hand side displays information about the alarm's configuration. In above example, Netdata +triggers a warning alarm when CPU usage is between 75 and 85%, and a critical alarm when above 85%. It's a _little_ more +complicated than that, but we'll get into more complex health entity configurations in a later step. + +The `calculation` field is the equation used to calculate those percentages, and the `check every` field specifies how +often Netdata should be calculating these metrics to see if the alarm should remain triggered. + +The `execute` field tells Netdata how to notify you about this alarm, and the `source` field lets you know where you can +find the configuration file, if you'd like to edit its configuration. + +We'll cover alarm configuration in more detail later in the guide, so don't worry about it too much for now! Right +now, it's most important that you understand how to see alarms, and parse their details, if and when they appear on your +system. + +## What's next? + +In this step of the Netdata guide, you learned how to: + +- Visit the dashboard +- Explore available charts (using the right-side menu) +- Read the descriptions accompanying charts +- Interact with charts +- See raised alarms and the alarm log + +Next, you'll learn how to monitor multiple nodes through the dashboard. + +[Next: Monitor more than one system with Netdata →](step-03.md) + +[](<>) diff --git a/docs/guides/step-by-step/step-03.md b/docs/guides/step-by-step/step-03.md new file mode 100644 index 000000000..2319adb44 --- /dev/null +++ b/docs/guides/step-by-step/step-03.md @@ -0,0 +1,91 @@ +<!-- +title: "Step 3. Monitor more than one system with Netdata" +date: 2020-05-01 +custom_edit_url: https://github.com/netdata/netdata/edit/master/docs/guides/step-by-step/step-03.md +--> + +# Step 3. Monitor more than one system with Netdata + +The Netdata agent is _distributed_ by design. That means each agent operates independently from any other, collecting +and creating charts only for the system you installed it on. We made this decision a long time ago to [improve security +and performance](step-01.md). + +You might be thinking, "So, now I have to remember all these IP addresses, and type them into my browser +manually, to move from one system to another? Maybe I should just make a bunch of bookmarks. What's a few more tabs +on top of the hundred I have already?" + +We get it. That's why we built [Netdata Cloud](https://learn.netdata.cloud/docs/cloud/), which connects many distributed +agents for a seamless experience when monitoring an entire infrastructure of Netdata-monitored nodes. + + + +## What you'll learn in this step + +In this step of the Netdata guide, we'll talk about the following: + +- [Why you should use Netdata Cloud](#why-use-netdata-cloud) +- [Get started with Netdata Cloud](#get-started-with-netdata-cloud) +- [Navigate between dashboards with Visited Nodes](#navigate-between-dashboards-with-visited-nodes) + +## Why use Netdata Cloud? + +Our [Cloud documentation](https://learn.netdata.cloud/docs/cloud/) does a good job (we think!) of explaining why Cloud +gives you a ton of value at no cost: + +> Netdata Cloud gives you real-time visibility for your entire infrastructure. With Netdata Cloud, you can run all your +> distributed Agents in headless mode _and_ access the real-time metrics and insightful charts from their dashboards. +> View key metrics and active alarms at-a-glance, and then seamlessly dive into any of your distributed dashboards +> without leaving Cloud's centralized interface. + +You can add as many nodes and team members as you need, and as our free and open source Agent gets better with more +features, new collectors for more applications, and improved UI, so will Cloud. + +## Get started with Netdata Cloud + +Signing in, onboarding, and claiming your first nodes only takes a few minutes, and we have a [Get started with +Cloud](https://learn.netdata.cloud/docs/cloud/get-started) guide to help you walk through every step. + +Or, if you're feeling confident, dive right in. + +<p><a href="https://app.netdata.cloud" className="button button--lg">Sign in to Cloud</a></p> + +When you finish that guide, circle back to this step in the guide to learn how to use the Visited Nodes feature on +top of Cloud's centralized web interface. + +## Navigate between dashboards with Visited Nodes + +To add nodes to your visited nodes, you first need to navigate to that node's dashboard, then click the **Sign in** +button at the top of the dashboard. On the screen that appears, which states your node is requesting access to your +Netdata Cloud account, sign in with your preferred method. + +Cloud redirects you back to your node's dashboard, which is now connected to your Netdata Cloud account. You can now see the menu populated by a single visited node. + + + +If you previously went through the Cloud onboarding process to create a Space and War Room, you will also see these +alongside your visited nodes. You can click on your Space or any of your War Rooms to navigate to Netdata Cloud and +continue monitoring your infrastructure from there. + + + +To add other visited nodes, navigate to their dashboard and sign in to Cloud by clicking on the **Sign in** button. This +process connects that node to your Cloud account and further populates the menu. + +Once you've added more than one node, you can use the menu to switch between various dashboards without remembering IP +addresses or hostnames or saving bookmarks for every node you want to monitor. + + + +## What's next? + +Now that you have a Netdata Cloud account with a claimed node (or a few!) and can navigate between your dashboards with +Visited nodes, it's time to learn more about how you can configure Netdata to your liking. From there, you'll be able to +customize your Netdata experience to your exact infrastructure and the information you need. + +[Next: The basics of configuring Netdata →](step-04.md) + +[](<>) diff --git a/docs/guides/step-by-step/step-04.md b/docs/guides/step-by-step/step-04.md new file mode 100644 index 000000000..0495145f4 --- /dev/null +++ b/docs/guides/step-by-step/step-04.md @@ -0,0 +1,144 @@ +<!-- +title: "Step 4. The basics of configuring Netdata" +date: 2020-03-31 +custom_edit_url: https://github.com/netdata/netdata/edit/master/docs/guides/step-by-step/step-04.md +--> + +# Step 4. The basics of configuring Netdata + +Welcome to the fourth step of the Netdata guide. + +Since the beginning, we've covered the building blocks of Netdata, dashboard basics, and how you can monitor many +individual systems using many distributed Netdata agents. + +Next up: configuration. + +## What you'll learn in this step + +We'll talk about Netdata's default configuration, and then you'll learn how to do the following: + +- [Find your `netdata.conf` file](#find-your-netdataconf-file) +- [Use edit-config to open `netdata.conf`](#use-edit-config-to-open-netdataconf) +- [Navigate the structure of `netdata.conf`](#the-structure-of-netdataconf) +- [Edit your `netdata.conf` file](#edit-your-netdataconf-file) + +## Find your `netdata.conf` file + +Netdata primarily uses the `netdata.conf` file to configure its core functionality. `netdata.conf` resides within your +**Netdata config directory**. + +The location of that directory and `netdata.conf` depends on your operating system and the method you used to install +Netdata. + +The most reliable method of finding your Netdata config directory is loading your `netdata.conf` on your browser. Open a +tab and navigate to `http://HOST:19999/netdata.conf`. Your browser will load a text document that looks like this: + +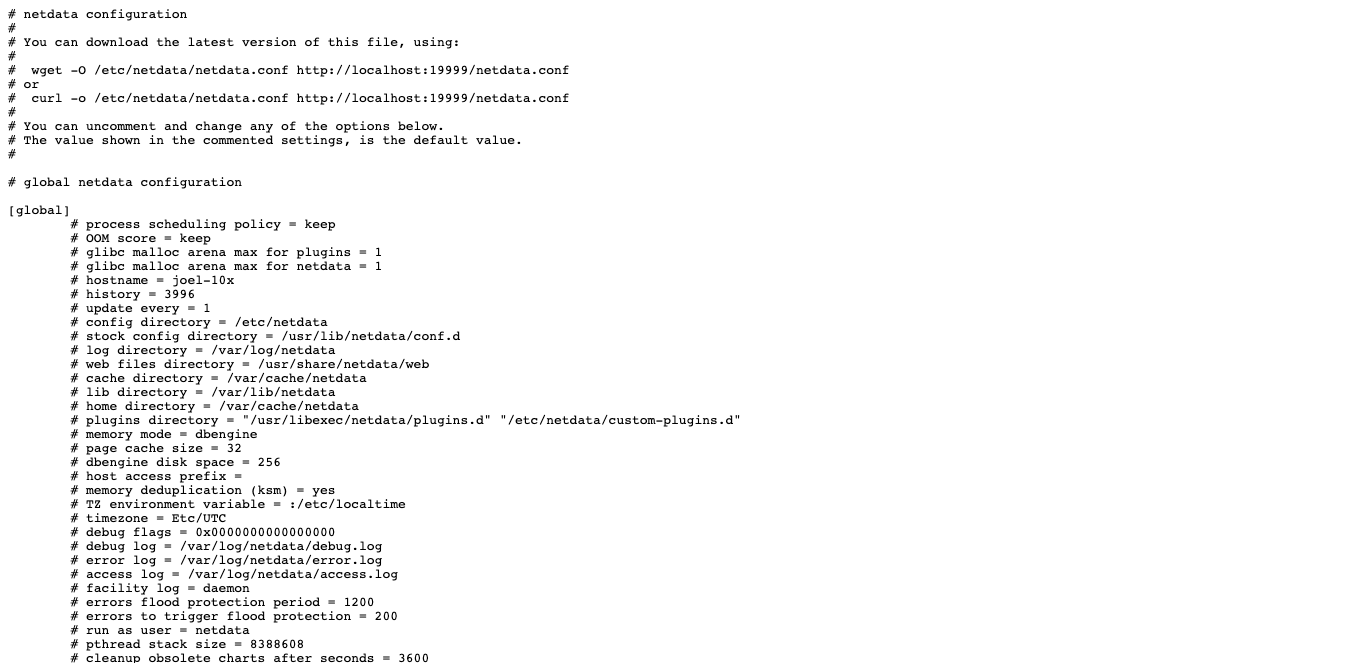 + +Look for the line that begins with `# config directory = `. The text after that will be the path to your Netdata config +directory. + +In the system represented by the screenshot, the line reads: `config directory = /etc/netdata`. That means +`netdata.conf`, and all the other configuration files, can be found at `/etc/netdata`. + +> For more details on where your Netdata config directory is, take a look at our [installation +> instructions](/packaging/installer/README.md). + +For the rest of this guide, we'll assume you're editing files or running scripts from _within_ your **Netdata +configuration directory**. + +## Use edit-config to open `netdata.conf` + +Inside your Netdata config directory, there is a helper scripted called `edit-config`. This script will open existing +Netdata configuration files using a text editor. Or, if the configuration file doesn't yet exist, the script will copy +an example file to your Netdata config directory and then allow you to edit it before saving it. + +> `edit-config` will use the `EDITOR` environment variable on your system to edit the file. On many systems, that is +> defaulted to `vim` or `nano`. We highly recommend `nano` for beginners. To change this variable for the current +> session (it will revert to the default when you reboot), export a new value: `export EDITOR=nano`. Or, [make the +> change permanent](https://stackoverflow.com/questions/13046624/how-to-permanently-export-a-variable-in-linux). + +Let's give it a shot. Navigate to your Netdata config directory. To use `edit-config` on `netdata.conf`, you need to +have permissions to edit the file. On Linux/macOS systems, you can usually use `sudo` to elevate your permissions. + +```bash +cd /etc/netdata # Replace this path with your Netdata config directory, if different as found in the steps above +sudo ./edit-config netdata.conf +``` + +You should now see `netdata.conf` your editor! Let's walk through how the file is structured. + +## The structure of `netdata.conf` + +There are two main parts of the file to note: **sections** and **options**. + +The `netdata.conf` file is broken up into various **sections**, such as `[global]`, `[web]`, and `[registry]`. Each +section contains the configuration options for some core component of Netdata. + +Each section also contains many **options**. Options have a name and a value. With the option `config directory = +/etc/netdata`, `config directory` is the name, and `/etc/netdata` is the value. + +Most lines are **commented**, in that they start with a hash symbol (`#`), and the value is set to a sane default. To +tell Netdata that you'd like to change any option from its default value, you must **uncomment** it by removing that +hash. + +### Edit your `netdata.conf` file + +Let's try editing the options in `netdata.conf` to see how the process works. + +First, add a fake option to show you how Netdata loads its configuration files. Add a `test` option under the `[global]` +section and give it the value of `1`. + +```conf +[global] + test = 1 +``` + +Restart Netdata with `service restart netdata` or the [appropriate +alternative](/docs/getting-started.md#start-stop-and-restart-netdata) for your system. + +Now, open up your browser and navigate to `http://HOST:19999/netdata.conf`. You'll see that Netdata has recognized +that our fake option isn't valid and added a notice that Netdata will ignore it. + +Here's the process in GIF form! + + + +Now, let's make a slightly more substantial edit to `netdata.conf`: change the Agent's name. + +If you edit the value of the `hostname` option, you can change the name of your Netdata Agent on the dashboard and a +handful of other places, like the Visited nodes menu _and_ Netdata Cloud. + +Use `edit-config` to change the `hostname` option to a name like `hello-world`. Be sure to uncomment it! + +```conf +[global] + hostname = hello-world +``` + +Once you're done, restart Netdata and refresh the dashboard. Say hello to your renamed agent! + + + +Netdata has dozens upon dozens of options you can change. To see them all, read our [daemon +configuration](/daemon/config/README.md), or hop into our popular guide on [increasing long-term metrics +storage](/docs/guides/longer-metrics-storage.md). + +## What's next? + +At this point, you should be comfortable with getting to your Netdata directory, opening and editing `netdata.conf`, and +seeing your changes reflected in the dashboard. + +Netdata has many more configuration files that you might want to change, but we'll cover those in the following steps of +this guide. + +In the next step, we're going to cover one of Netdata's core functions: monitoring the health of your systems via alarms +and notifications. You'll learn how to disable alarms, create new ones, and push notifications to the system of your +choosing. + +[Next: Health monitoring alarms and notifications →](step-05.md) + +[](<>) diff --git a/docs/guides/step-by-step/step-05.md b/docs/guides/step-by-step/step-05.md new file mode 100644 index 000000000..5e627632d --- /dev/null +++ b/docs/guides/step-by-step/step-05.md @@ -0,0 +1,343 @@ +<!-- +title: "Step 5. Health monitoring alarms and notifications" +custom_edit_url: https://github.com/netdata/netdata/edit/master/docs/guides/step-by-step/step-05.md +--> + +# Step 5. Health monitoring alarms and notifications + +In the fifth step of the Netdata guide, we're introducing you to one of our core features: **health monitoring**. + +To accurately monitor the health of your systems and applications, you need to know _immediately_ when there's something +strange going on. Netdata's alarm and notification systems are essential to keeping you informed. + +Netdata comes with hundreds of pre-configured alarms that don't require configuration. They were designed by our +community of system administrators to cover the most important parts of production systems, so, in many cases, you won't +need to edit them. + +Luckily, Netdata's alarm and notification system are incredibly adaptable to your infrastructure's unique needs. + +## What you'll learn in this step + +We'll talk about Netdata's default configuration, and then you'll learn how to do the following: + +- [Tune Netdata's pre-configured alarms](#tune-netdatas-pre-configured-alarms) +- [Write your first health entity](#write-your-first-health-entity) +- [Enable Netdata's notification systems](#enable-netdatas-notification-systems) + +## Tune Netdata's pre-configured alarms + +First, let's tune an alarm that came pre-configured with your Netdata installation. + +The first chart you see on any Netdata dashboard is the `system.cpu` chart, which shows the system's CPU utilization +across all cores. To figure out which file you need to edit to tune this alarm, click the **Alarms** button at the top +of the dashboard, click on the **All** tab, and find the **system - cpu** alarm entity. + + + +Look at the `source` row in the table. This means the `system.cpu` chart sources its health alarms from +`4@/usr/lib/netdata/conf.d/health.d/cpu.conf`. To tune these alarms, you'll need to edit the alarm file at +`health.d/cpu.conf`. Go to your [Netdata config directory](step-04.md#find-your-netdataconf-file) and use the +`edit-config` script. + +```bash +sudo ./edit-config health.d/cpu.conf +``` + +The first **health entity** in that file looks like this: + +```yaml +template: 10min_cpu_usage + on: system.cpu + os: linux + hosts: * + lookup: average -10m unaligned of user,system,softirq,irq,guest + units: % + every: 1m + warn: $this > (($status >= $WARNING) ? (75) : (85)) + crit: $this > (($status == $CRITICAL) ? (85) : (95)) + delay: down 15m multiplier 1.5 max 1h + info: average cpu utilization for the last 10 minutes (excluding iowait, nice and steal) + to: sysadmin +``` + +Let's say you want to tune this alarm to trigger warning and critical alarms at a lower CPU utilization. You can change +the `warn` and `crit` lines to the values of your choosing. For example: + +```yaml + warn: $this > (($status >= $WARNING) ? (60) : (75)) + crit: $this > (($status == $CRITICAL) ? (75) : (85)) +``` + +You _can_ [restart Netdata](/docs/getting-started.md#start-stop-and-restart-netdata) to enable your tune, but you can +also reload _only_ the health monitoring component using one of the available [methods](/health/QUICKSTART.md#reload-health-configuration). + +You can also tune any other aspect of the default alarms. To better understand how each line in a health entity works, +read our [health documentation](/health/README.md). + +### Silence an individual alarm + +Many Netdata users don't need all the default alarms enabled. Instead of disabling any given alarm, or even _all_ +alarms, you can silence individual alarms by changing one line in a given health entity. Let's look at that +`health/cpu.conf` file again. + +```yaml +template: 10min_cpu_usage + on: system.cpu + os: linux + hosts: * + lookup: average -10m unaligned of user,system,softirq,irq,guest + units: % + every: 1m + warn: $this > (($status >= $WARNING) ? (75) : (85)) + crit: $this > (($status == $CRITICAL) ? (85) : (95)) + delay: down 15m multiplier 1.5 max 1h + info: average cpu utilization for the last 10 minutes (excluding iowait, nice and steal) + to: sysadmin +``` + +To silence this alarm, change `sysadmin` to `silent`. + +```yaml + to: silent +``` + +Use `netdatacli reload-health` to reload your health configuration. You can add `to: silent` to any alarm you'd rather not +bother you with notifications. + +## Write your first health entity + +The best way to understand how health entities work is building your own and experimenting with the options. To start, +let's build a health entity that triggers an alarm when system RAM usage goes above 80%. + +The first line in a health entity will be `alarm:`. This is how you name your entity. You can give it any name you +choose, but the only symbols allowed are `.` and `_`. Let's call the alarm `ram_usage`. + +```yaml + alarm: ram_usage +``` + +> You'll see some funky indentation in the lines coming up. Don't worry about it too much! Indentation is not important +> to how Netdata processes entities, and it will make sense when you're done. + +Next, you need to specify which chart this entity listens via the `on:` line. You're declaring that you want this alarm +to check metrics on the `system.ram` chart. + +```yaml + on: system.ram +``` + +Now comes the `lookup`. This line specifies what metrics the alarm is looking for, what duration of time it's looking +at, and how to process the metrics into a more usable format. + +```yaml +lookup: average -1m percentage of used +``` + +Let's take a moment to break this line down. + +- `average`: Calculate the average of all the metrics collected. +- `-1m`: Use metrics from 1 minute ago until now to calculate that average. +- `percentage`: Clarify that you want to calculate a percentage of RAM usage. +- `of used`: Specify which dimension (`used`) on the `system.ram` chart you want to monitor with this entity. + +In other words, you're taking 1 minute's worth of metrics from the `used` dimension on the `system.ram` chart, +calculating their average, and returning it as a percentage. + +You can move on to the `units` line, which lets Netdata know that we're working with a percentage and not an absolute +unit. + +```yaml + units: % +``` + +Next, the `every` line tells Netdata how often to perform the calculation you specified in the `lookup` line. For +certain alarms, you might want to use a shorter duration, which you can specify using values like `10s`. + +```yaml + every: 1m +``` + +We'll put the next two lines—`warn` and `crit`—together. In these lines, you declare at which percentage you want to +trigger a warning or critical alarm. Notice the variable `$this`, which is the value calculated by the `lookup` line. +These lines will trigger a warning if that average RAM usage goes above 80%, and a critical alert if it's above 90%. + +```yaml + warn: $this > 80 + crit: $this > 90 +``` + +> ❗ Most default Netdata alarms come with more complicated `warn` and `crit` lines. You may have noticed the line `warn: +> $this > (($status >= $WARNING) ? (75) : (85))` in one of the health entity examples above, which is an example of +> using the [conditional operator for hysteresis](/health/REFERENCE.md#special-use-of-the-conditional-operator). +> Hysteresis is used to keep Netdata from triggering a ton of alerts if the metric being tracked quickly goes above and +> then falls below the threshold. For this very simple example, we'll skip hysteresis, but recommend implementing it in +> your future health entities. + +Finish off with the `info` line, which creates a description of the alarm that will then appear in any +[notification](#enable-netdatas-notification-systems) you set up. This line is optional, but it has value—think of it as +documentation for a health entity! + +```yaml + info: The percentage of RAM being used by the system. +``` + +Here's what the entity looks like in full. Now you can see why we indented the lines, too. + +```yaml + alarm: ram_usage + on: system.ram +lookup: average -1m percentage of used + units: % + every: 1m + warn: $this > 80 + crit: $this > 90 + info: The percentage of RAM being used by the system. +``` + +What about what it looks like on the Netdata dashboard? + +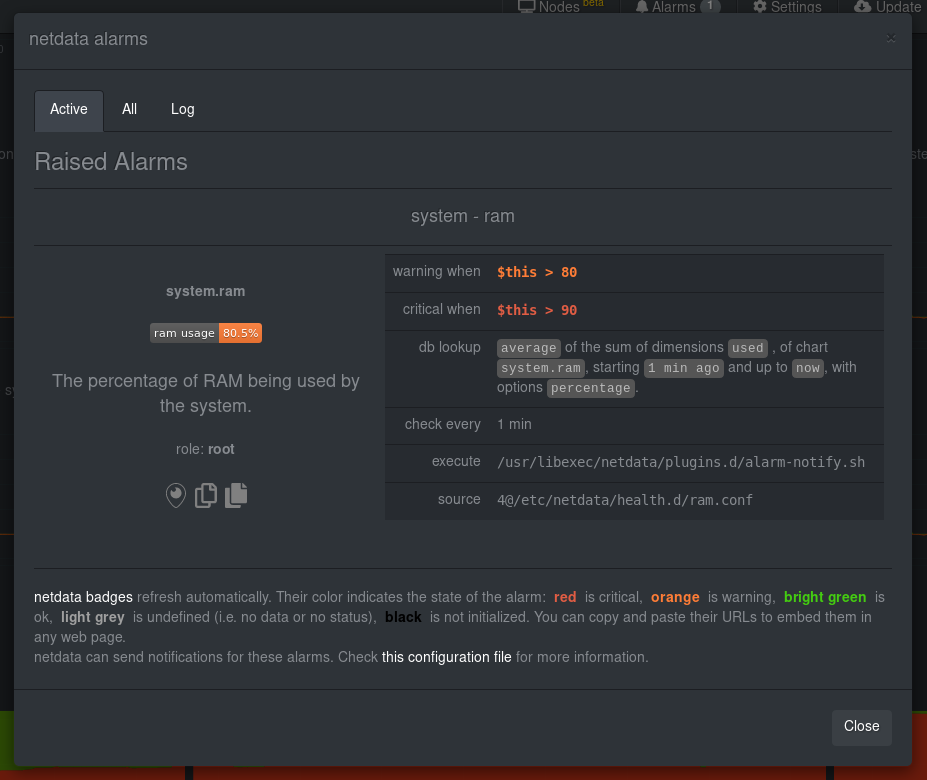 + +If you'd like to try this alarm on your system, you can install a small program called +[stress](http://manpages.ubuntu.com/manpages/disco/en/man1/stress.1.html) to create a synthetic load. Use the command +below, and change the `8G` value to a number that's appropriate for the amount of RAM on your system. + +```bash +stress -m 1 --vm-bytes 8G --vm-keep +``` + +Netdata is capable of understanding much more complicated entities. To better understand how they work, read the [health +documentation](/health/README.md), look at some [examples](/health/REFERENCE.md#example-alarms), and open the files +containing the default entities on your system. + +## Enable Netdata's notification systems + +Health alarms, while great on their own, are pretty useless without some way of you knowing they've been triggered. +That's why Netdata comes with a notification system that supports more than a dozen services, such as email, Slack, +Discord, PagerDuty, Twilio, Amazon SNS, and much more. + +To see all the supported systems, visit our [notifications documentation](/health/notifications/). + +We'll cover email and Slack notifications here, but with this knowledge you should be able to enable any other type of +notifications instead of or in addition to these. + +### Email notifications + +To use email notifications, you need `sendmail` or an equivalent installed on your system. Linux systems use `sendmail` +or similar programs to, unsurprisingly, send emails to any inbox. + +> Learn more about `sendmail` via its [documentation](http://www.postfix.org/sendmail.1.html). + +Edit the `health_alarm_notify.conf` file, which resides in your Netdata directory. + +```bash +sudo ./edit-config health_alarm_notify.conf +``` + +Look for the following lines: + +```conf +# if a role recipient is not configured, an email will be send to: +DEFAULT_RECIPIENT_EMAIL="root" +# to receive only critical alarms, set it to "root|critical" +``` + +Change the value of `DEFAULT_RECIPIENT_EMAIL` to the email address at which you'd like to receive notifications. + +```conf +# if a role recipient is not configured, an email will be sent to: +DEFAULT_RECIPIENT_EMAIL="me@example.com" +# to receive only critical alarms, set it to "root|critical" +``` + +Test email notifications system by first becoming the Netdata user and then asking Netdata to send a test alarm: + +```bash +sudo su -s /bin/bash netdata +/usr/libexec/netdata/plugins.d/alarm-notify.sh test +``` + +You should see output similar to this: + +```bash +# SENDING TEST WARNING ALARM TO ROLE: sysadmin +2019-10-17 18:23:38: alarm-notify.sh: INFO: sent email notification for: hostname test.chart.test_alarm is WARNING to 'me@example.com' +# OK + +# SENDING TEST CRITICAL ALARM TO ROLE: sysadmin +2019-10-17 18:23:38: alarm-notify.sh: INFO: sent email notification for: hostname test.chart.test_alarm is CRITICAL to 'me@example.com' +# OK + +# SENDING TEST CLEAR ALARM TO ROLE: sysadmin +2019-10-17 18:23:39: alarm-notify.sh: INFO: sent email notification for: hostname test.chart.test_alarm is CLEAR to 'me@example.com' +# OK +``` + +... and you should get three separate emails, one for each test alarm, in your inbox! (Be sure to check your spam +folder.) + +## Enable Slack notifications + +If you're one of the many who spend their workday getting pinged with GIFs by your colleagues, why not add Netdata +notifications to the mix? It's a great way to immediately see, collaborate around, and respond to anomalies in your +infrastructure. + +To get Slack notifications working, you first need to add an [incoming +webhook](https://slack.com/apps/A0F7XDUAZ-incoming-webhooks) to the channel of your choice. Click the green **Add to +Slack** button, choose the channel, and click the **Add Incoming WebHooks Integration** button. + +On the following page, you'll receive a **Webhook URL**. That's what you'll need to configure Netdata, so keep it handy. + +Time to dive back into your `health_alarm_notify.conf` file: + +```bash +sudo ./edit-config health_alarm_notify.conf +``` + +Look for the `SLACK_WEBHOOK_URL=" "` line and add the incoming webhook URL you got from Slack: + +```conf +SLACK_WEBHOOK_URL="https://hooks.slack.com/services/XXXXXXXXX/XXXXXXXXX/XXXXXXXXXXXX" +``` + +A few lines down, edit the `DEFAULT_RECIPIENT_SLACK` line to contain a single hash `#` character. This instructs Netdata +to send a notification to the channel you configured with the incoming webhook. + +```conf +DEFAULT_RECIPIENT_SLACK="#" +``` + +Time to test the notifications again! + +```bash +sudo su -s /bin/bash netdata +/usr/libexec/netdata/plugins.d/alarm-notify.sh test +``` + +You should receive three notifications in your Slack channel. + +Congratulations! You're set up with two awesome ways to get notified about any change in the health of your systems or +applications. + +To further configure your email or Slack notification setup, or to enable other notification systems, check out the +following documentation: + +- [Email notifications](/health/notifications/email/README.md) +- [Slack notifications](/health/notifications/slack/README.md) +- [Netdata's notification system](/health/notifications/README.md) + +## What's next? + +In this step, you learned the fundamentals of Netdata's health monitoring tools: alarms and notifications. You should be +able to tune default alarms, silence them, and understand some of the basics of writing health entities. And, if you so +chose, you'll now have both email and Slack notifications enabled. + +You're coming along quick! + +Next up, we're going to cover how Netdata collects its metrics, and how you can get Netdata to collect real-time metrics +from hundreds of services with almost no configuration on your part. Onward! + +[Next: Collect metrics from more services and apps →](step-06.md) + +[](<>) diff --git a/docs/guides/step-by-step/step-06.md b/docs/guides/step-by-step/step-06.md new file mode 100644 index 000000000..bb1f23494 --- /dev/null +++ b/docs/guides/step-by-step/step-06.md @@ -0,0 +1,122 @@ +<!-- +title: "Step 6. Collect metrics from more services and apps" +custom_edit_url: https://github.com/netdata/netdata/edit/master/guides/docs/step-by-step/step-06.md +--> + +# Step 6. Collect metrics from more services and apps + +When Netdata _starts_, it auto-detects dozens of **data sources**, such as database servers, web servers, and more. + +To auto-detect and collect metrics from a source you just installed, you need to [restart +Netdata](/docs/getting-started.md#start-stop-and-restart-netdata). + +However, auto-detection only works if you installed the source using its standard installation +procedure. If Netdata isn't collecting metrics after a restart, your source probably isn't configured +correctly. + +Check out the [collectors that come pre-installed with Netdata](/collectors/COLLECTORS.md) to find the module for the +source you want to monitor. + +## What you'll learn in this step + +We'll begin with an overview on Netdata's collector architecture, and then dive into the following: + +- [Netdata's collector architecture](#netdatas-collector-architecture) +- [Enable and disable plugins](#enable-and-disable-plugins) +- [Enable the Nginx collector as an example](#example-enable-the-nginx-collector) + +## Netdata's collector architecture + +Many Netdata users never have to configure collector or worry about which plugin orchestrator they want to use. + +But, if you want to configure collector or write a collector for your custom source, it's important to understand the +underlying architecture. + +By default, Netdata collects a lot of metrics every second using any number of discrete collector. Collectors, in turn, +are organized and manged by plugins. **Internal** plugins collect system metrics, **external** plugins collect +non-system metrics, and **orchestrator** plugins group individual collectors together based on the programming language +they were built in. + +These modules are primarily written in [Go](https://learn.netdata.cloud/docs/agent/collectors/go.d.plugin/) (`go.d`) and +[Python](/collectors/python.d.plugin/README.md), although some use [Bash](/collectors/charts.d.plugin/README.md) +(`charts.d`) or [Node.js](/collectors/node.d.plugin/README.md) (`node.d`). + +## Enable and disable plugins + +You don't need to explicitly enable plugins to auto-detect properly configured sources, but it's useful to know how to +enable or disable them. + +One reason you might want to _disable_ plugins is to improve Netdata's performance on low-resource systems, like +ephemeral nodes or edge devices. Disabling orchestrator plugins like `python.d` can save significant resources if you're +not using any of its data collector modules. + +You can enable or disable plugins in the `[plugin]` section of `netdata.conf`. This section features a list of all the +plugins with a boolean setting (`yes` or `no`) to enable or disable them. Be sure to uncomment the line by removing the +hash (`#`)! + +Enabled: + +```conf +[plugins] + # node.d = yes +``` + +Disabled: + +```conf +[plugins] + node.d = no +``` + +When you explicitly disable a plugin this way, it won't auto-collect metrics using its collectors. + +## Example: Enable the Nginx collector + +To help explain how the auto-detection process works, let's use an Nginx web server as an example. + +Even if you don't have Nginx installed on your system, we recommend you read through the following section so you can +apply the process to other data sources, such as Apache, Redis, Memcached, and more. + +The Nginx collector, which helps Netdata collect metrics from a running Nginx web server, is part of the +`python.d.plugin` external plugin _orchestrator_. + +In order for Netdata to auto-detect an Nginx web server, you need to enable `ngx_http_stub_status_module` and pass the +`stub_status` directive in the `location` block of your Nginx configuration file. + +You can confirm if the `stub_status` Nginx module is already enabled or not by using following command: + +```sh +nginx -V 2>&1 | grep -o with-http_stub_status_module +``` + +If this command returns nothing, you'll need to [enable this module](https://www.nginx.com/blog/monitoring-nginx/). + +Next, edit your `/etc/nginx/sites-enabled/default` file to include a `location` block with the following: + +```conf + location /stub_status { + stub_status; + } +``` + +Restart Netdata using `service netdata restart` or the [correct +alternative](/docs/getting-started.md#start-stop-and-restart-netdata) for your system, and Netdata will auto-detect +metrics from your Nginx web server! + +While not necessary for most auto-detection and collection purposes, you can also configure the Nginx collector itself +by editing its configuration file: + +```sh +./edit-config python.d/nginx.conf +``` + +After configuring any source, or changing the configuration files for their respective modules, always restart Netdata. + +## What's next? + +Now that you've learned the fundamentals behind configuring data sources for auto-detection, it's time to move back to +the dashboard to learn more about some of its more advanced features. + +[Next: Netdata's dashboard in depth →](step-07.md) + +[](<>) diff --git a/docs/guides/step-by-step/step-07.md b/docs/guides/step-by-step/step-07.md new file mode 100644 index 000000000..f2f665575 --- /dev/null +++ b/docs/guides/step-by-step/step-07.md @@ -0,0 +1,114 @@ +<!-- +title: "Step 7. Netdata's dashboard in depth" +date: 2020-05-04 +custom_edit_url: https://github.com/netdata/netdata/edit/master/docs/guides/step-by-step/step-07.md +--> + +# Step 7. Netdata's dashboard in depth + +Welcome to the seventh step of the Netdata guide! + +This step of the guide aims to get you more familiar with the features of the dashboard not previously mentioned in +[step 2](/docs/guides/step-by-step/step-02.md). + +## What you'll learn in this step + +In this step of the Netdata guide, you'll learn how to: + +- [Change the dashboard's settings](#change-the-dashboards-settings) +- [Check if there's an update to Netdata](#check-if-theres-an-update-to-netdata) +- [Export and import a snapshot](#export-and-import-a-snapshot) + +Let's get started! + +## Change the dashboard's settings + +The settings area at the top of your Netdata dashboard houses browser settings. These settings do not affect the +operation of your Netdata server/daemon. They take effect immediately and are permanently saved to browser local storage +(except the refresh on focus / always option). + +You can see the **Performance**, **Synchronization**, **Visual**, and **Locale** tabs on the dashboard settings modal. + + + +To change any setting, click on the toggle button. We recommend you spend some time reading the descriptions for each setting to understand them before making changes. + +Pay particular attention to the following settings, as they have dramatic impacts on the performance and appearance of +your Netdata dashboard: + +- When to refresh the charts? +- How to handle hidden charts? +- Which chart refresh policy to use? +- Which theme to use? +- Do you need help? + +Some settings are applied immediately, and others are only reflected after you refresh the page. + +## Check if there's an update to Netdata + +You can always check if there is an update available from the **Update** area of your Netdata dashboard. + + + +If an update is available, you'll see a modal similar to the one above. + +When you use the [automatic one-line installer script](/packaging/installer/README.md) attempt to update every day. If +you choose to update it manually, there are [several well-documented methods](/packaging/installer/UPDATE.md) to achieve +that. However, it is best practice for you to first go over the [changelog](/CHANGELOG.md). + +## Export and import a snapshot + +Netdata can export and import snapshots of the contents of your dashboard at a given time. Any Netdata agent can import +a snapshot created by any other Netdata agent. + +Snapshot files include all the information of the dashboard, including the URL of the origin server, its unique ID, and +chart data queries for the visible timeframe. While snapshots are not in real-time, and thus won't update with new +metrics, you can still pan, zoom, and highlight charts as you see fit. + +Snapshots can be incredibly useful for diagnosing anomalies after they've already happened. Let's say Netdata triggered +an alarm while you were sleeping. In the morning, you can look up the exact moment the alarm was raised, export a +snapshot, and send it to a colleague for further analysis. + +> ❗ Know how you shouldn't go around downloading software from suspicious-looking websites? Same policy goes for loading +> snapshots from untrusted or anonymous sources. Importing a snapshot loads quite a bit of data into your web browser, +> and so you should always err on the side of protecting your system. + +To export a snapshot, click on the **export** icon. + + + +Edit the snapshot file name and select your desired compression method. Click on **Export**. + +When the export is complete, your browser will prompt you to save the `.snapshot` file to your machine. You can now +share this file with any other Netdata user via email, Slack, or even to help describe your Netdata experience when +[filing an issue](https://github.com/netdata/netdata/issues/new/choose) on GitHub. + +To import a snapshot, click on the **import** icon. + + + +Select the Netdata snapshot file to import. Once the file is loaded, the dashboard will update with critical information +about the snapshot and the system from which it was taken. Click **import** to render it. + +Your Netdata dashboard will load data contained in the snapshot into charts. Because the snapshot only covers a certain +period, it won't update with new metrics. + +An imported snapshot is also temporary. If you reload your browser tab, Netdata will remove the snapshot data and +restore your real-time dashboard for your machine. + +## What's next? + +In this step of the Netdata guide, you learned how to: + +- Change the dashboard's settings +- Check if there's an update to Netdata +- Export or import a snapshot + +Next, you'll learn how to build your first custom dashboard! + +[Next: Build your first custom dashboard →](step-08.md) + +[](<>) diff --git a/docs/guides/step-by-step/step-08.md b/docs/guides/step-by-step/step-08.md new file mode 100644 index 000000000..76a1b0775 --- /dev/null +++ b/docs/guides/step-by-step/step-08.md @@ -0,0 +1,395 @@ +<!-- +title: "Step 8. Build your first custom dashboard" +custom_edit_url: https://github.com/netdata/netdata/edit/master/docs/guides/step-by-step/step-08.md +--> + +# Step 8. Build your first custom dashboard + +In previous steps of the guide, you have learned how several sections of the Netdata dashboard worked. + +This step will show you how to set up a custom dashboard to fit your unique needs. If nothing else, Netdata is really, +really flexible. 🤸 + +## What you'll learn in this step + +In this step of the Netdata guide, you'll learn: + +- [Why you might want a custom dashboard](#why-should-i-create-a-custom-dashboard) +- [How to create and prepare your `custom-dashboard.html` file](#create-and-prepare-your-custom-dashboardhtml-file) +- [Where to add `dashboard.js` to your custom dashboard file](#add-dashboardjs-to-your-custom-dashboard-file) +- [How to add basic styling](#add-some-basic-styling) +- [How to add charts of different types, shapes, and sizes](#creating-your-dashboards-charts) + +Let's get on with it! + +## Why should I create a custom dashboard? + +Because it's cool! + +But there are way more reasons than that, most of which will prove more valuable to you. + +You could use custom dashboards to aggregate real-time data from multiple Netdata agents in one place. Or, you could put +all the charts with metrics collected from your custom application via `statsd` and perform application performance +monitoring from a single dashboard. You could even use a custom dashboard and a standalone web server to create an +enriched public status page for your service, and give your users something fun to look at while they're waiting for the +503 errors to clear up! + +Netdata's custom dashboarding capability is meant to be as flexible as your ideas. We hope you can take these +fundamental ideas and turn them into something amazing. + +## Create and prepare your `custom-dashboard.html` file + +By default, Netdata stores its web server files at `/usr/share/netdata/web`. As with finding the location of your +`netdata.conf` file, you can double-check this location by loading up `http://HOST:19999/netdata.conf` in your browser +and finding the value of the `web files directory` option. + +To create your custom dashboard, create a file at `/usr/share/netdata/web/custom-dashboard.html` and copy in the +following: + +```html +<!DOCTYPE html> +<html lang="en"> +<head> + <title>My custom dashboard</title> + + <meta http-equiv="Content-Type" content="text/html; charset=utf-8" /> + <meta charset="utf-8"> + <meta http-equiv="X-UA-Compatible" content="IE=edge,chrome=1"> + <meta name="viewport" content="width=device-width, initial-scale=1"> + <meta name="apple-mobile-web-app-capable" content="yes"> + <meta name="apple-mobile-web-app-status-bar-style" content="black-translucent"> + + <!-- Add dashboard.js here! --> + +</head> +<body> + + <main class="container"> + + <h1>My custom dashboard</h1> + + <!-- Add charts here! --> + + </main> + +</body> +</html> +``` + +Try visiting `http://HOST:19999/custom-dashboard.html` in your browser. + +If you get a blank page with this text: `Access to file is not permitted: /usr/share/netdata/web/custom-dashboard.html`. +You can fix this error by changing the dashboard file's permissions to make it owned by the `netdata` user. + +```bash +sudo chown netdata:netdata /usr/share/netdata/web/custom-dashboard.html +``` + +Reload your browser, and you should see a blank page with the title: **Your custom dashboard**! + +## Add `dashboard.js` to your custom dashboard file + +You need to include the `dashboard.js` file of a Netdata agent to add Netdata charts. Add the following to the `<head>` +of your custom dashboard page and change `HOST` according to your setup. + +```html + <!-- Add dashboard.js here! --> + <script type="text/javascript" src="http://HOST:19999/dashboard.js"></script> +``` + +When you add `dashboard.js` to any web page, it loads several JavaScript and CSS files to create and style charts. It +also scans the page for elements that define charts, builds them, and refreshes with new metrics. + +> If you enabled SSL on your Netdata dashboard already, you'll need to use `https://` to grab the `dashboard.js` file. + +## Add some basic styling + +While not necessary, let's add some basic styling to make our dashboard look a little nicer. We're putting some +basic CSS into a `<style>` tag inside of the page's `<head>` element. + +```html + <!-- Add dashboard.js here! --> + <script type="text/javascript" src="http://HOST:19999/dashboard.js"></script> + + <style> + .wrap { + max-width: 1280px; + margin: 0 auto; + } + + h1 { + margin-bottom: 30px; + text-align: center; + } + + .charts { + display: flex; + flex-flow: row wrap; + justify-content: space-around; + } + </style> + +</head> +``` + +## Creating your dashboard's charts + +Time to create a chart! + +You need to create a `<div>` for each new chart. Each `<div>` element accepts a few `data-` attributes, some of which +are required and some of which are optional. + +Let's cover a few important ones. And while we do it, we'll create a custom dashboard that shows a few CPU-related +charts on a single page. + +### The chart unique ID (required) + +You need to specify the unique ID of a chart to show it on your custom dashboard. If you forgot how to find the unique +ID, head back over to [step 2](/docs/guides/step-by-step/step-02.md#understand-charts-dimensions-families-and-contexts) +for a re-introduction. + +You can then put this unique ID into a `<div>` element with the `data-netdata` attribute. Put this in the `<body>` of +your custom dashboard file beneath the helpful comment. + +```html +<body> + + <main class="wrap"> + + <h1>My custom dashboard</h1> + + <div class="charts"> + + <!-- Add charts here! --> + <div data-netdata="system.cpu"></div> + + </div> + + </main> + +</body> +``` + +Reload the page, and you should see a real-time `system.cpu` chart! + +... and a whole lot of white space. Let's fix that by adding a few more charts. + +```html + <!-- Add charts here! --> + <div data-netdata="system.cpu"></div> + <div data-netdata="apps.cpu"></div> + <div data-netdata="groups.cpu"></div> + <div data-netdata="users.cpu"></div> +``` + +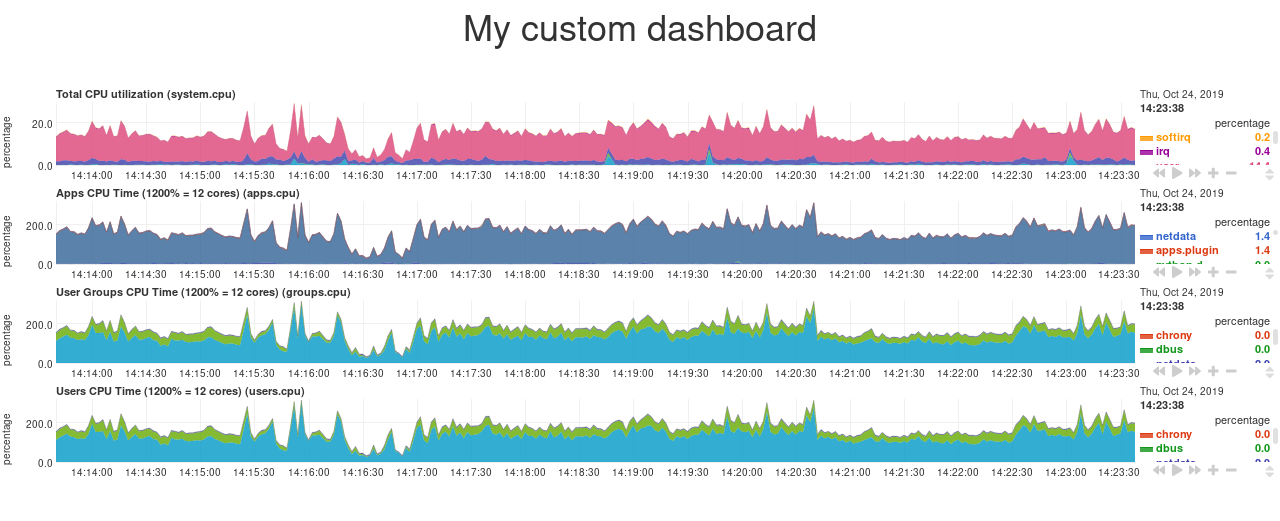 + +### Set chart duration + +By default, these charts visualize 10 minutes of Netdata metrics. Let's get a little more granular on this dashboard. To +do so, add a new `data-after=""` attribute to each chart. + +`data-after` takes a _relative_ number of seconds from _now_. So, by putting `-300` as the value, you're asking the +custom dashboard to display the _last 5 minutes_ (`5m * 60s = 300s`) of data. + +```html + <!-- Add charts here! --> + <div data-netdata="system.cpu" + data-after="-300"> + </div> + <div data-netdata="apps.cpu" + data-after="-300"> + </div> + <div data-netdata="groups.cpu" + data-after="-300"> + </div> + <div data-netdata="users.cpu" + data-after="-300"> + </div> +``` + +### Set chart size + +You can set the size of any chart using the `data-height=""` and `data-width=""` attributes. These attributes can be +anything CSS accepts for width and height (e.g. percentages, pixels, em/rem, calc, and so on). + +Let's make the charts a little taller and allow them to fit side-by-side for a more compact view. Add +`data-height="200px"` and `data-width="50%"` to each chart. + +```html + <div data-netdata="system.cpu" + data-after="-300" + data-height="250px" + data-width="50%"></div> + <div data-netdata="apps.cpu" + data-after="-300" + data-height="250px" + data-width="50%"></div> + <div data-netdata="groups.cpu" + data-after="-300" + data-height="250px" + data-width="50%"></div> + <div data-netdata="users.cpu" + data-after="-300" + data-height="250px" + data-width="50%"></div> +``` + +Now we're getting somewhere! + +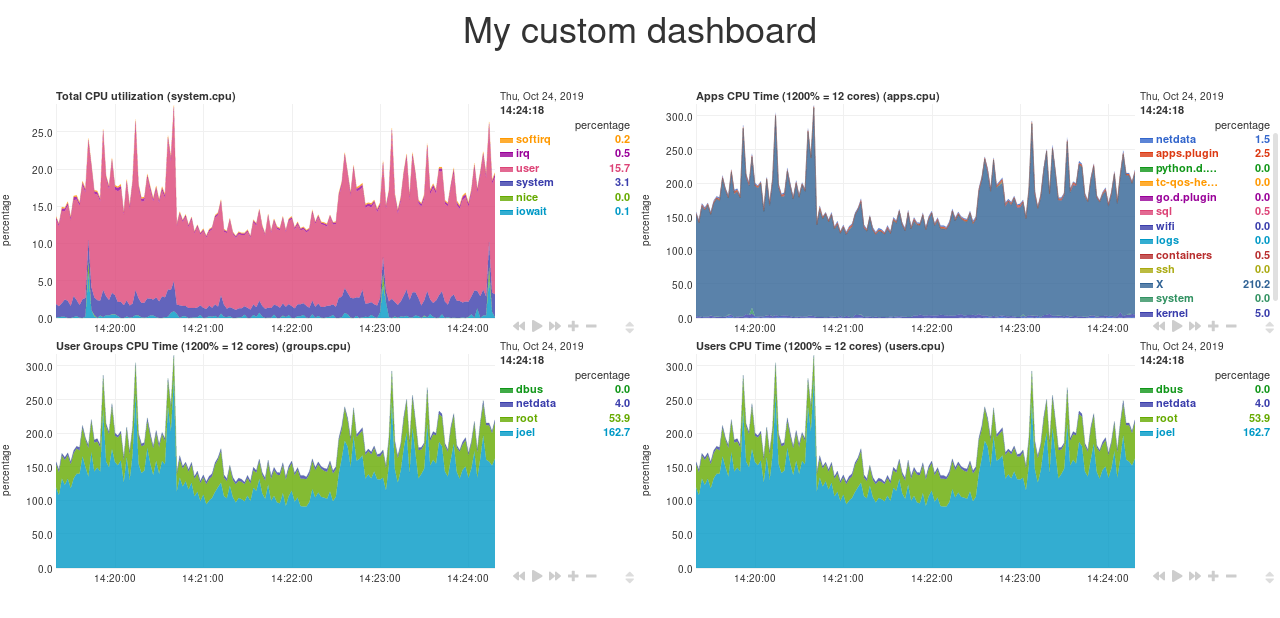 + +## Final touches + +While we already have a perfectly workable dashboard, let's add some final touches to make it a little more pleasant on +the eyes. + +First, add some extra CSS to create some vertical whitespace between the top and bottom row of charts. + +```html + <style> + ... + + .charts > div { + margin-bottom: 6rem; + } + </style> +``` + +To create horizontal whitespace, change the value of `data-width="50%"` to `data-width="calc(50% - 2rem)"`. + +```html + <div data-netdata="system.cpu" + data-after="-300" + data-height="250px" + data-width="calc(50% - 2rem)"></div> + <div data-netdata="apps.cpu" + data-after="-300" + data-height="250px" + data-width="calc(50% - 2rem)"></div> + <div data-netdata="groups.cpu" + data-after="-300" + data-height="250px" + data-width="calc(50% - 2rem)"></div> + <div data-netdata="users.cpu" + data-after="-300" + data-height="250px" + data-width="calc(50% - 2rem)"></div> +``` + +Told you the `data-width` and `data-height` attributes can take any CSS values! + +Prefer a dark theme? Add this to your `<head>` _above_ where you added `dashboard.js`: + +```html + <script> + var netdataTheme = 'slate'; + </script> + + <!-- Add dashboard.js here! --> + <script type="text/javascript" src="https://HOST/dashboard.js"></script> +``` + +Refresh the dashboard to give your eyes a break from all that blue light! + +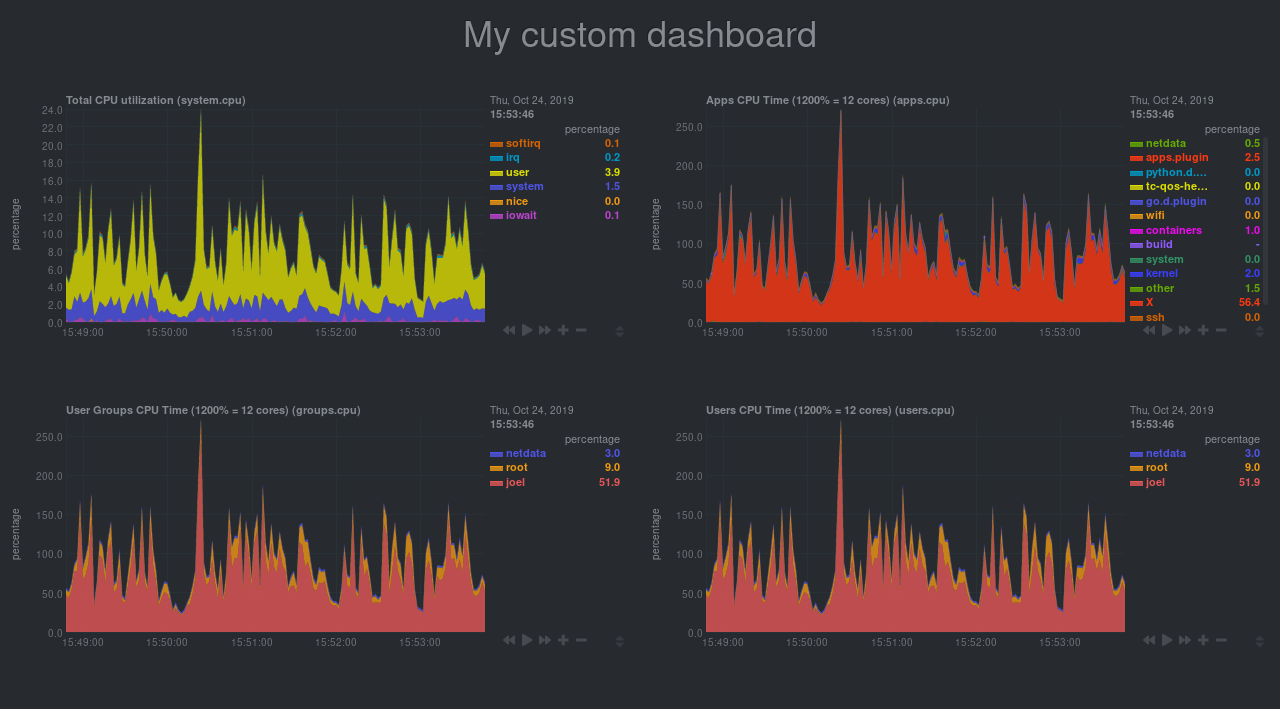 + +## The final `custom-dashboard.html` + +In case you got lost along the way, here's the final version of the `custom-dashboard.html` file: + +```html +<!DOCTYPE html> +<html lang="en"> +<head> + <title>My custom dashboard</title> + + <meta http-equiv="Content-Type" content="text/html; charset=utf-8" /> + <meta charset="utf-8"> + <meta http-equiv="X-UA-Compatible" content="IE=edge,chrome=1"> + <meta name="viewport" content="width=device-width, initial-scale=1"> + <meta name="apple-mobile-web-app-capable" content="yes"> + <meta name="apple-mobile-web-app-status-bar-style" content="black-translucent"> + + <script> + var netdataTheme = 'slate'; + </script> + + <!-- Add dashboard.js here! --> + <script type="text/javascript" src="http://localhost:19999/dashboard.js"></script> + + <style> + .wrap { + max-width: 1280px; + margin: 0 auto; + } + + h1 { + margin-bottom: 30px; + text-align: center; + } + + .charts { + display: flex; + flex-flow: row wrap; + justify-content: space-around; + } + + .charts > div { + margin-bottom: 6rem; + position: relative; + } + </style> + +</head> +<body> + + <main class="wrap"> + + <h1>My custom dashboard</h1> + + <div class="charts"> + + <!-- Add charts here! --> + <div data-netdata="system.cpu" + data-after="-300" + data-height="250px" + data-width="calc(50% - 2rem)"></div> + <div data-netdata="apps.cpu" + data-after="-300" + data-height="250px" + data-width="calc(50% - 2rem)"></div> + <div data-netdata="groups.cpu" + data-after="-300" + data-height="250px" + data-width="calc(50% - 2rem)"></div> + <div data-netdata="users.cpu" + data-after="-300" + data-height="250px" + data-width="calc(50% - 2rem)"></div> + + </div> + + </main> + +</body> +</html> +``` + +## What's next? + +In this guide, you learned the fundamentals of building a custom Netdata dashboard. You should now be able to add more +charts to your `custom-dashboard.html`, change the charts that are already there, and size them according to your needs. + +Of course, the custom dashboarding features covered here are just the beginning. Be sure to read up on our [custom +dashboard documentation](/web/gui/custom/README.md) for details on how you can use other chart libraries, pull metrics +from multiple Netdata agents, and choose which dimensions a given chart shows. + +Next, you'll learn how to store long-term historical metrics in Netdata! + +[Next: Long-term metrics storage →](/docs/guides/step-by-step/step-09.md) + +[](<>) diff --git a/docs/guides/step-by-step/step-09.md b/docs/guides/step-by-step/step-09.md new file mode 100644 index 000000000..636ffea1f --- /dev/null +++ b/docs/guides/step-by-step/step-09.md @@ -0,0 +1,164 @@ +<!-- +title: "Step 9. Long-term metrics storage" +custom_edit_url: https://github.com/netdata/netdata/edit/master/docs/guides/step-by-step/step-09.md +--> + +# Step 9. Long-term metrics storage + +By default, Netdata stores metrics in a custom database we call the [database engine](/database/engine/README.md), which +stores recent metrics in your system's RAM and "spills" historical metrics to disk. By using both RAM and disk, the +database engine helps you store a much larger dataset than the amount of RAM your system has. + +On a system that's collecting 2,000 metrics every second, the database engine's default configuration will store about +two day's worth of metrics in RAM and on disk. + +That's a lot of metrics. We're talking 345,600,000 individual data points. And the database engine does it with a tiny +a portion of the RAM available on most systems. + +To store _even more_ metrics, you have two options. First, you can tweak the database engine's options to expand the RAM +or disk it uses. Second, you can archive metrics to an external database. For that, we'll use MongoDB as examples. + +## What you'll learn in this step + +In this step of the Netdata guide, you'll learn how to: + +- [Tweak the database engine's settings](#tweak-the-database-engines-settings) +- [Archive metrics to an external database](#archive-metrics-to-an-external-database) + - [Use the MongoDB database](#archive-metrics-via-the-mongodb-exporting-connector) + +Let's get started! + +## Tweak the database engine's settings + +If you're using Netdata v1.18.0 or higher, and you haven't changed your `memory mode` settings before following this +guide, your Netdata agent is already using the database engine. + +Let's look at your `netdata.conf` file again. Under the `[global]` section, you'll find three connected options. + +```conf +[global] + # memory mode = dbengine + # page cache size = 32 + # dbengine disk space = 256 +``` + +The `memory mode` option is set, by default, to `dbengine`. `page cache size` determines the amount of RAM, in MiB, that +the database engine dedicates to caching the metrics it's collecting. `dbengine disk space` determines the amount of +disk space, in MiB, that the database engine will use to store these metrics once they've been "spilled" to disk.. + +You can uncomment and change either `page cache size` or `dbengine disk space` based on how much RAM and disk you want +the database engine to use. The higher those values, the more metrics Netdata will store. If you change them to 64 and +512, respectively, the database engine should store about four day's worth of data on a system collecting 2,000 metrics +every second. + +[**See our database engine calculator**](/docs/store/change-metrics-storage.md) to help you correctly set `dbengine disk +space` based on your needs. The calculator gives an accurate estimate based on how many child nodes you have, how many +metrics your Agent collects, and more. + +```conf +[global] + memory mode = dbengine + page cache size = 64 + dbengine disk space = 512 +``` + +After you've made your changes, [restart Netdata](/docs/getting-started.md#start-stop-and-restart-netdata). + +To confirm the database engine is working, go to your Netdata dashboard and click on the **Netdata Monitoring** menu on +the right-hand side. You can find `dbengine` metrics after `queries`. + +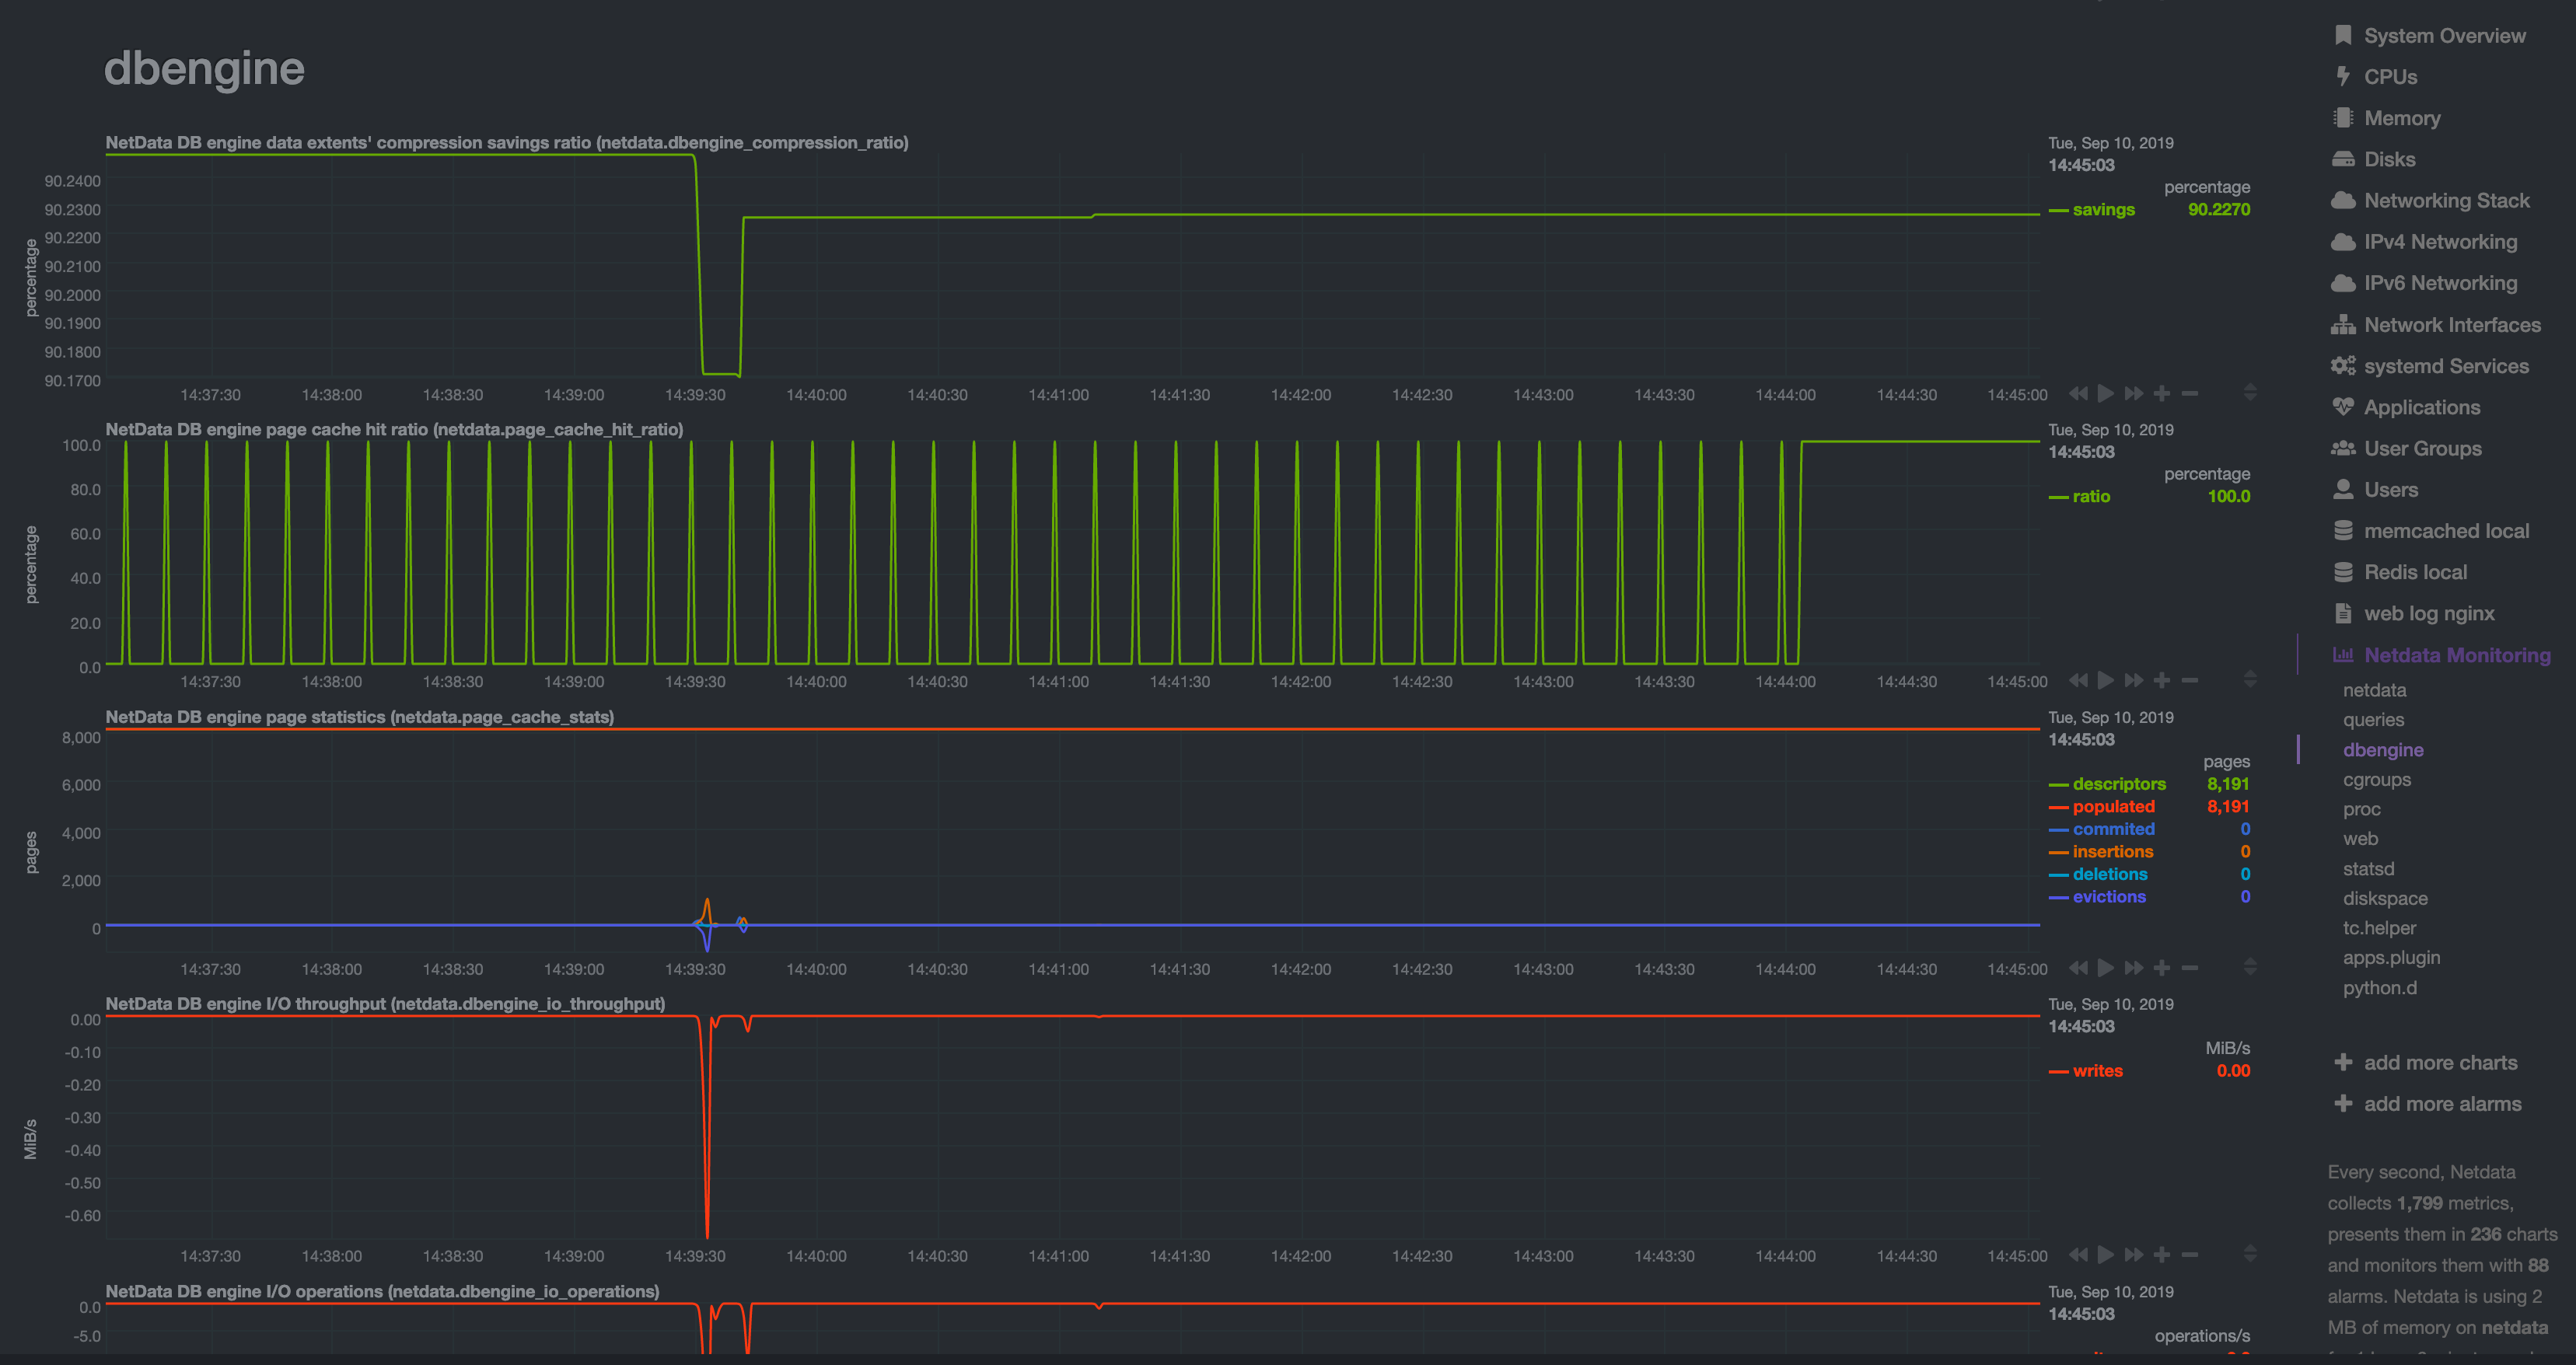 + +## Archive metrics to an external database + +You can archive all the metrics collected by Netdata to **external databases**. The supported databases and services +include Graphite, OpenTSDB, Prometheus, AWS Kinesis Data Streams, Google Cloud Pub/Sub, MongoDB, and the list is always +growing. + +As we said in [step 1](/docs/guides/step-by-step/step-01.md), we have only complimentary systems, not competitors! We're +happy to support these archiving methods and are always working to improve them. + +A lot of Netdata users archive their metrics to one of these databases for long-term storage or further analysis. Since +Netdata collects so many metrics every second, they can quickly overload small devices or even big servers that are +aggregating metrics streaming in from other Netdata agents. + +We even support resampling metrics during archiving. With resampling enabled, Netdata will archive only the average or +sum of every X seconds of metrics. This reduces the sheer amount of data, albeit with a little less accuracy. + +How you archive metrics, or if you archive metrics at all, is entirely up to you! But let's cover two easy archiving +methods, MongoDB and Prometheus remote write, to get you started. + +### Archive metrics via the MongoDB exporting connector + +Begin by installing MongoDB its dependencies via the correct package manager for your system. + +```bash +sudo apt-get install mongodb # Debian/Ubuntu +sudo dnf install mongodb # Fedora +sudo yum install mongodb # CentOS +``` + +Next, install the one essential dependency: v1.7.0 or higher of +[libmongoc](http://mongoc.org/libmongoc/current/installing.html). + +```bash +sudo apt-get install libmongoc-1.0-0 libmongoc-dev # Debian/Ubuntu +sudo dnf install mongo-c-driver mongo-c-driver-devel # Fedora +sudo yum install mongo-c-driver mongo-c-driver-devel # CentOS +``` + +Next, create a new MongoDB database and collection to store all these archived metrics. Use the `mongo` command to start +the MongoDB shell, and then execute the following command: + +```mongodb +use netdata +db.createCollection("netdata_metrics") +``` + +Next, Netdata needs to be [reinstalled](/packaging/installer/REINSTALL.md) in order to detect that the required +libraries to make this exporting connection exist. Since you most likely installed Netdata using the one-line installer +script, all you have to do is run that script again. Don't worry—any configuration changes you made along the way will +be retained! + +```bash +bash <(curl -Ss https://my-netdata.io/kickstart.sh) +``` + +Now, from your Netdata config directory, initialize and edit a `exporting.conf` file to tell Netdata where to find the +database you just created. + +```sh +./edit-config exporting.conf +``` + +Add the following section to the file: + +```conf +[mongodb:my_mongo_instance] + enabled = yes + destination = mongodb://localhost + database = netdata + collection = netdata_metrics +``` + +[Restart](/docs/getting-started.md#start-stop-and-restart-netdata) Netdata to enable the MongoDB exporting connector. +Click on the **Netdata Monitoring** menu and check out the **exporting my mongo instance** sub-menu. You should start +seeing these charts fill up with data about the exporting process! + +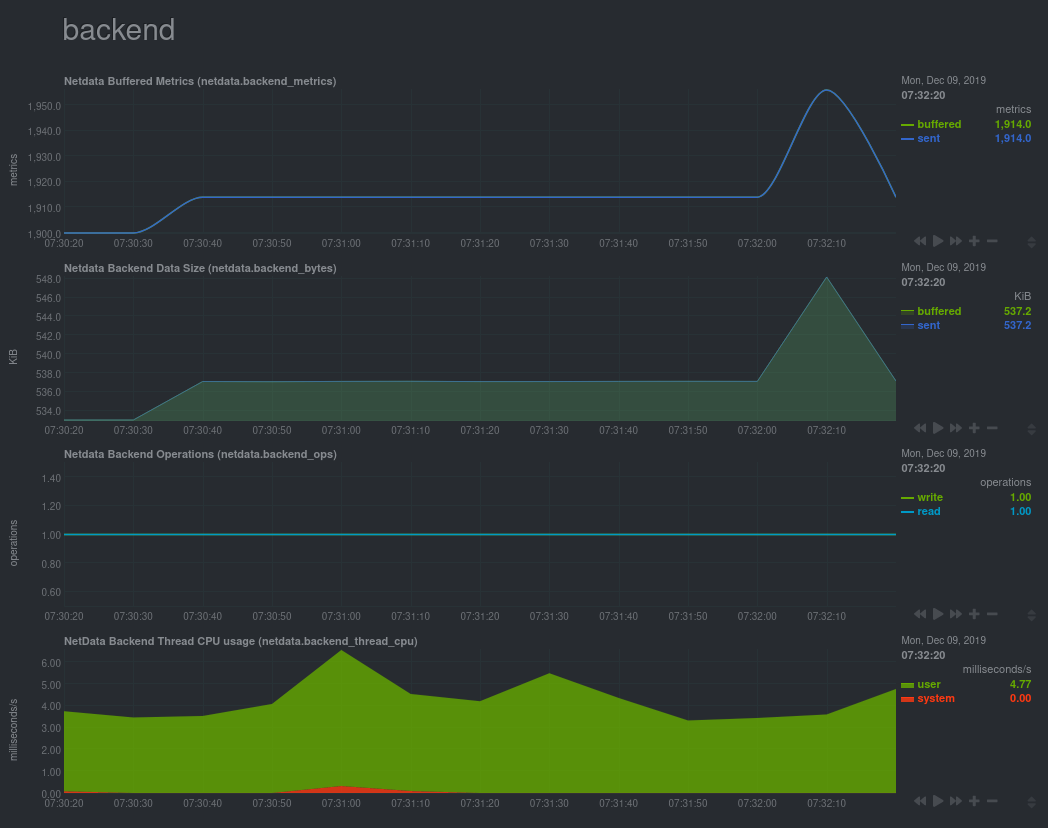 + +If you'd like to try connecting Netdata to another database, such as Prometheus or OpenTSDB, read our [exporting +documentation](/exporting/README.md). + +## What's next? + +You're getting close to the end! In this step, you learned how to make the most of the database engine, or archive +metrics to MongoDB for long-term storage. + +In the last step of this step-by-step guide, we'll put our sysadmin hat on and use Nginx to proxy traffic to and from +our Netdata dashboard. + +[Next: Set up a proxy →](/docs/guides/step-by-step/step-10.md) + +[](<>) diff --git a/docs/guides/step-by-step/step-10.md b/docs/guides/step-by-step/step-10.md new file mode 100644 index 000000000..28ab47c67 --- /dev/null +++ b/docs/guides/step-by-step/step-10.md @@ -0,0 +1,230 @@ +<!-- +title: "Step 10. Set up a proxy" +custom_edit_url: https://github.com/netdata/netdata/edit/master/docs/guides/step-by-step/step-10.md +--> + +# Step 10. Set up a proxy + +You're almost through! At this point, you should be pretty familiar with now Netdata works and how to configure it to +your liking. + +In this step of the guide, we're going to add a proxy in front of Netdata. We're doing this for both improved +performance and security, so we highly recommend following these steps. Doubly so if you installed Netdata on a +publicly-accessible remote server. + +> ❗ If you installed Netdata on the machine you're currently using (e.g. on `localhost`), and have been accessing +> Netdata at `http://localhost:19999`, you can skip this step of the guide. In most cases, there is no benefit to +> setting up a proxy for a service running locally. + +> ❗❗ This guide requires more advanced administration skills than previous parts. If you're still working on your +> Linux administration skills, and would rather get back to Netdata, you might want to [skip this +> step](step-99.md) for now and return to it later. + +## What you'll learn in this step + +In this step of the Netdata guide, you'll learn: + +- [What a proxy is and the benefits of using one](#wait-whats-a-proxy) +- [How to connect Netdata to Nginx](#connect-netdata-to-nginx) +- [How to enable HTTPS in Nginx](#enable-https-in-nginx) +- [How to secure your Netdata dashboard with a password](#secure-your-netdata-dashboard-with-a-password) + +Let's dive in! + +## Wait. What's a proxy? + +A proxy is a middleman between the internet and a service you're running on your system. Traffic from the internet at +large enters your system through the proxy, which then routes it to the service. + +A proxy is often used to enable encrypted HTTPS connections with your browser, but they're also useful for load +balancing, performance, and password-protection. + +We'll use [Nginx](https://nginx.org/en/) for this step of the guide, but you can also use +[Caddy](https://caddyserver.com/) as a simple proxy if you prefer. + +## Required before you start + +You need three things to run a proxy using Nginx: + +- Nginx and Certbot installed on your system +- A fully qualified domain name +- A subdomain for Netdata that points to your system + +### Nginx and Certbot + +This step of the guide assumes you can install Nginx on your system. Here are the easiest methods to do so on Debian, +Ubuntu, Fedora, and CentOS systems. + +```bash +sudo apt-get install nginx # Debian/Ubuntu +sudo dnf install nginx # Fedora +sudo yum install nginx # CentOS +``` + +Check out [Nginx's installation +instructions](https://docs.nginx.com/nginx/admin-guide/installing-nginx/installing-nginx-open-source/) for details on +other Linux distributions. + +Certbot is a tool to help you create and renew certificate+key pairs for your domain. Visit their +[instructions](https://certbot.eff.org/instructions) to get a detailed installation process for your operating system. + +### Fully qualified domain name + +The only other true prerequisite of using a proxy is a **fully qualified domain name** (FQDN). In other words, a domain +name like `example.com`, `netdata.cloud`, or `github.com`. + +If you don't have a domain name, you won't be able to use a proxy the way we'll describe here. + +Because we strongly recommend running Netdata behind a proxy, the cost of a domain name is worth the benefit. If you +don't have a preferred domain registrar, try [Google Domains](https://domains.google/), +[Cloudflare](https://www.cloudflare.com/products/registrar/), or [Namecheap](https://www.namecheap.com/). + +### Subdomain for Netdata + +Any of the three domain registrars mentioned above, and most registrars in general, will allow you to create new DNS +entries for your domain. + +To create a subdomain for Netdata, use your registrar's DNS settings to create an A record for a `netdata` subdomain. +Point the A record to the IP address of your system. + +Once finished with the steps below, you'll be able to access your dashboard at `http://netdata.example.com`. + +## Connect Netdata to Nginx + +The first part of enabling the proxy is to create a new server for Nginx. + +Use your favorite text editor to create a file at `/etc/nginx/sites-available/netdata`, copy in the following +configuration, and change the `server_name` line to match your domain. + +```nginx +upstream backend { + server 127.0.0.1:19999; + keepalive 64; +} + +server { + listen 80; + + # Change `example.com` to match your domain name. + server_name netdata.example.com; + + location / { + proxy_set_header X-Forwarded-Host $host; + proxy_set_header X-Forwarded-Server $host; + proxy_set_header X-Forwarded-For $proxy_add_x_forwarded_for; + proxy_pass http://backend; + proxy_http_version 1.1; + proxy_pass_request_headers on; + proxy_set_header Connection "keep-alive"; + proxy_store off; + } +} +``` + +Save and close the file. + +Test your configuration file by running `sudo nginx -t`. + +If that returns no errors, it's time to make your server available. Run the command to create a symbolic link in the +`sites-enabled` directory. + +```bash +sudo ln -s /etc/nginx/sites-available/netdata /etc/nginx/sites-enabled/netdata +``` + +Finally, restart Nginx to make your changes live. Open your browser and head to `http://netdata.example.com`. You should +see your proxied Netdata dashboard! + +## Enable HTTPS in Nginx + +All this proxying doesn't mean much if we can't take advantage of one of the biggest benefits: encrypted HTTPS +connections! Let's fix that. + +Certbot will automatically get a certificate, edit your Nginx configuration, and get HTTPS running in a single step. Run +the following: + +```bash +sudo certbot --nginx +``` + +> See this error after running `sudo certbot --nginx`? +> +> ``` +> Saving debug log to /var/log/letsencrypt/letsencrypt.log +> The requested nginx plugin does not appear to be installed` +> ``` +> +> You must install `python-certbox-nginx`. On Ubuntu or Debian systems, you can run `sudo apt-get install +> python-certbot-nginx` to download and install this package. + +You'll be prompted with a few questions. At the `Which names would you like to activate HTTPS for?` question, hit +`Enter`. Next comes this question: + +```bash +Please choose whether or not to redirect HTTP traffic to HTTPS, removing HTTP access. +- - - - - - - - - - - - - - - - - - - - - - - - - - - - - - - - - - - - - - - - +1: No redirect - Make no further changes to the webserver configuration. +2: Redirect - Make all requests redirect to secure HTTPS access. Choose this for +new sites, or if you're confident your site works on HTTPS. You can undo this +change by editing your web server's configuration. +- - - - - - - - - - - - - - - - - - - - - - - - - - - - - - - - - - - - - - - - +``` + +You _do_ want to force HTTPS, so hit `2` and then `Enter`. Nginx will now ensure all attempts to access +`netdata.example.com` use HTTPS. + +Certbot will automatically renew your certificate whenever it's needed, so you're done configuring your proxy. Open your +browser again and navigate to `https://netdata.example.com`, and you'll land on an encrypted, proxied Netdata dashboard! + +## Secure your Netdata dashboard with a password + +Finally, let's take a moment to put your Netdata dashboard behind a password. This step is optional, but you might not +want _anyone_ to access the metrics in your proxied dashboard. + +Run the below command after changing `user` to the username you want to use to log in to your dashboard. + +```bash +sudo sh -c "echo -n 'user:' >> /etc/nginx/.htpasswd" +``` + +Then run this command to create a password: + +```bash +sudo sh -c "openssl passwd -apr1 >> /etc/nginx/.htpasswd" +``` + +You'll be prompted to create a password. Next, open your Nginx configuration file at +`/etc/nginx/sites-available/netdata` and add these two lines under `location / {`: + +```nginx + location / { + auth_basic "Restricted Content"; + auth_basic_user_file /etc/nginx/.htpasswd; + ... +``` + +Save, exit, and restart Nginx. Then try visiting your dashboard one last time. You'll see a prompt for the username and +password you just created. + +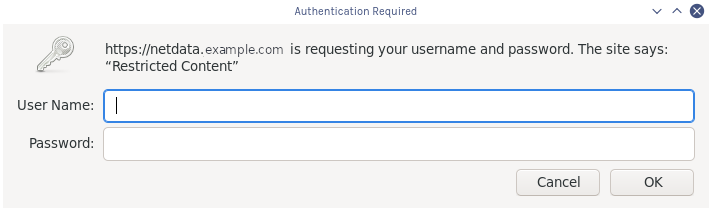 + +Your Netdata dashboard is now a touch more secure. + +## What's next? + +You're a real sysadmin now! + +If you want to configure your Nginx proxy further, check out the following: + +- [Running Netdata behind Nginx](/docs/Running-behind-nginx.md) +- [How to optimize Netdata's performance](/docs/guides/configure/performance.md) +- [Enabling TLS on Netdata's dashboard](/web/server/README.md#enabling-tls-support) + +And... you're _almost_ done with the Netdata guide. + +For some celebratory emoji and a clap on the back, head on over to our final step. + +[Next: The end. →](step-99.md) + +[](<>) diff --git a/docs/guides/step-by-step/step-99.md b/docs/guides/step-by-step/step-99.md new file mode 100644 index 000000000..3b893d5a3 --- /dev/null +++ b/docs/guides/step-by-step/step-99.md @@ -0,0 +1,51 @@ +<!-- +title: "Step ∞. You're finished!" +custom_edit_url: https://github.com/netdata/netdata/edit/master/docs/guides/step-by-step/step-99.md +--> + +# Step ∞. You're finished! + +Congratulations. 🎉 + +You've completed the step-by-step Netdata guide. That means you're well on your way to becoming an expert in using +our toolkit for health monitoring and performance troubleshooting. + +But, perhaps more importantly, also that much closer to being an expert in the _fundamental skills behind health +monitoring and performance troubleshooting_, which you can take with you to any job or project. + +And that is the entire point of this guide, and Netdata's [documentation](https://learn.netdata.cloud) as a +whole—give you every resource possible to help you build faster, more resilient systems, services, and applications. + +Along the way, you learned how to: + +- Navigate Netdata's dashboard and visually detect anomalies using its charts. +- Monitor multiple systems using Netdata agents connected together with your browser and Netdata Cloud. +- Edit your `netdata.conf` file to tweak Netdata to your liking. +- Tune existing alarms and create entirely new ones, plus get notifications about alarms on your favorite services. +- Take advantage of Netdata's auto-detection capabilities to ensure your applications/services are monitored with + little to no configuration. +- Use advanced features within Netdata's dashboard. +- Build a custom dashboard using `dashboard.js`. +- Save more historical metrics with the database engine or archive metrics to MongoDB. +- Put Netdata behind a proxy to enable HTTPS and improve performance. + +Seems like a lot, right? Well, we hope it felt manageable and, yes, even _fun_. + +## What's next? + +Now that you're at the end of our step-by-step Netdata guide, the next steps are entirely up to you. In fact, you're +just at the beginning of your journey into health monitoring and performance troubleshooting. + +Our documentation exists to put every Netdata resource in front of you as easily and coherently as we possibly can. +Click around, search, and find new mountains to climb. + +If that feels like too much possibility to you, why not one of these options: + +- Share your experience with Netdata and this guide. Be sure to [@mention](https://twitter.com/linuxnetdata) us on + Twitter! +- Contribute to what we do. Browse our [open issues](https://github.com/netdata/netdata/issues) and check out out + [contributions doc](/CONTRIBUTING.md) for ideas of how you can pitch in. + +We can't wait to see what you monitor next! Bon voyage! ⛵ + +[](<>) diff --git a/docs/guides/troubleshoot/monitor-debug-applications-ebpf.md b/docs/guides/troubleshoot/monitor-debug-applications-ebpf.md new file mode 100644 index 000000000..342193c58 --- /dev/null +++ b/docs/guides/troubleshoot/monitor-debug-applications-ebpf.md @@ -0,0 +1,268 @@ +<!-- +title: "Monitor, troubleshoot, and debug applications with eBPF metrics" +description: "Use Netdata's built-in eBPF metrics collector to monitor, troubleshoot, and debug your custom application using low-level kernel feedback." +image: /img/seo/guides/troubleshoot/monitor-debug-applications-ebpf.png +custom_edit_url: https://github.com/netdata/netdata/edit/master/docs/guides/troubleshoot/monitor-debug-applications-ebpf.md +--> + +# Monitor, troubleshoot, and debug applications with eBPF metrics + +When trying to troubleshoot or debug a finicky application, there's no such thing as too much information. At Netdata, +we developed programs that connect to the [_extended Berkeley Packet Filter_ (eBPF) virtual +machine](/collectors/ebpf.plugin/README.md) to help you see exactly how specific applications are interacting with the +Linux kernel. With these charts, you can root out bugs, discover optimizations, diagnose memory leaks, and much more. + +This means you can see exactly how often, and in what volume, the application creates processes, opens files, writes to +filesystem using virtual filesystem (VFS) functions, and much more. Even better, the eBPF collector gathers metrics at +an _event frequency_, which is even faster than Netdata's beloved 1-second granularity. When you troubleshoot and debug +applications with eBPF, rest assured you miss not even the smallest meaningful event. + +Using this guide, you'll learn the fundamentals of setting up Netdata to give you kernel-level metrics from your +application so that you can monitor, troubleshoot, and debug to your heart's content. + +## Configure `apps.plugin` to recognize your custom application + +To start troubleshooting an application with eBPF metrics, you need to ensure your Netdata dashboard collects and +displays those metrics independent from any other process. + +You can use the `apps_groups.conf` file to configure which applications appear in charts generated by +[`apps.plugin`](/collectors/apps.plugin/README.md). Once you edit this file and create a new group for the application +you want to monitor, you can see how it's interacting with the Linux kernel via real-time eBPF metrics. + +Let's assume you have an application that runs on the process `custom-app`. To monitor eBPF metrics for that application +separate from any others, you need to create a new group in `apps_groups.conf` and associate that process name with it. + +Open the `apps_groups.conf` file in your Netdata configuration directory. + +```bash +cd /etc/netdata # Replace this path with your Netdata config directory +sudo ./edit-config apps_groups.conf +``` + +Scroll down past the explanatory comments and stop when you see `# NETDATA processes accounting`. Above that, paste in +the following text, which creates a new `dev` group with the `custom-app` process. Replace `custom-app` with the name of +your application's process name. + +Your file should now look like this: + +```conf +... +# ----------------------------------------------------------------------------- +# Custom applications to monitor with apps.plugin and ebpf.plugin + +dev: custom-app + +# ----------------------------------------------------------------------------- +# NETDATA processes accounting +... +``` + +Restart Netdata with `sudo service netdata restart` or the appropriate method for your system to begin seeing metrics +for this particular group+process. You can also add additional processes to the same group. + +You can set up `apps_groups.conf` to more show more precise eBPF metrics for any application or service running on your +system, even if it's a standard package like Redis, Apache, or any other [application/service Netdata collects +from](/collectors/COLLECTORS.md). + +```conf +# ----------------------------------------------------------------------------- +# Custom applications to monitor with apps.plugin and ebpf.plugin + +dev: custom-app +database: *redis* +apache: *apache* + +# ----------------------------------------------------------------------------- +# NETDATA processes accounting +... +``` + +Now that you have `apps_groups.conf` set up to monitor your application/service, you can also set up the eBPF collector +to show other charts that will help you debug and troubleshoot how it interacts with the Linux kernel. + +## Configure the eBPF collector to monitor errors + +The eBPF collector has [two possible modes](/collectors/ebpf.plugin#ebpf-load-mode): `entry` and `return`. The default +is `entry`, and only monitors calls to kernel functions, but the `return` also monitors and charts _whether these calls +return in error_. + +Let's turn on the `return` mode for more granularity when debugging Firefox's behavior. + +```bash +cd /etc/netdata # Replace this path with your Netdata config directory +sudo ./edit-config ebpf.conf +``` + +Replace `entry` with `return`: + +```conf +[global] + ebpf load mode = return + disable apps = no + +[ebpf programs] + process = yes + network viewer = yes +``` + +Restart Netdata with `sudo service netdata restart` or the appropriate method for your system. + +## Get familiar with per-application eBPF metrics and charts + +Visit the Netdata dashboard at `http://NODE:19999`, replacing `NODE` with the hostname or IP of the system you're using +to monitor this application. Scroll down to the **Applications** section. These charts now feature a `firefox` dimension +with metrics specific to that process. + +Pay particular attention to the charts in the **ebpf file**, **ebpf syscall**, **ebpf process**, and **ebpf net** +sub-sections. These charts are populated by low-level Linux kernel metrics thanks to eBPF, and showcase the volume of +calls to open/close files, call functions like `do_fork`, IO activity on the VFS, and much more. + +See the [eBPF collector documentation](/collectors/ebpf.plugin/README.md#integration-with-appsplugin) for the full list +of per-application charts. + +Let's show some examples of how you can first identify normal eBPF patterns, then use that knowledge to identify +anomalies in a few simulated scenarios. + +For example, the following screenshot shows the number of open files, failures to open files, and closed files on a +Debian 10 system. The first spike is from configuring/compiling a small C program, then from running Apache's `ab` tool +to benchmark an Apache web server. + +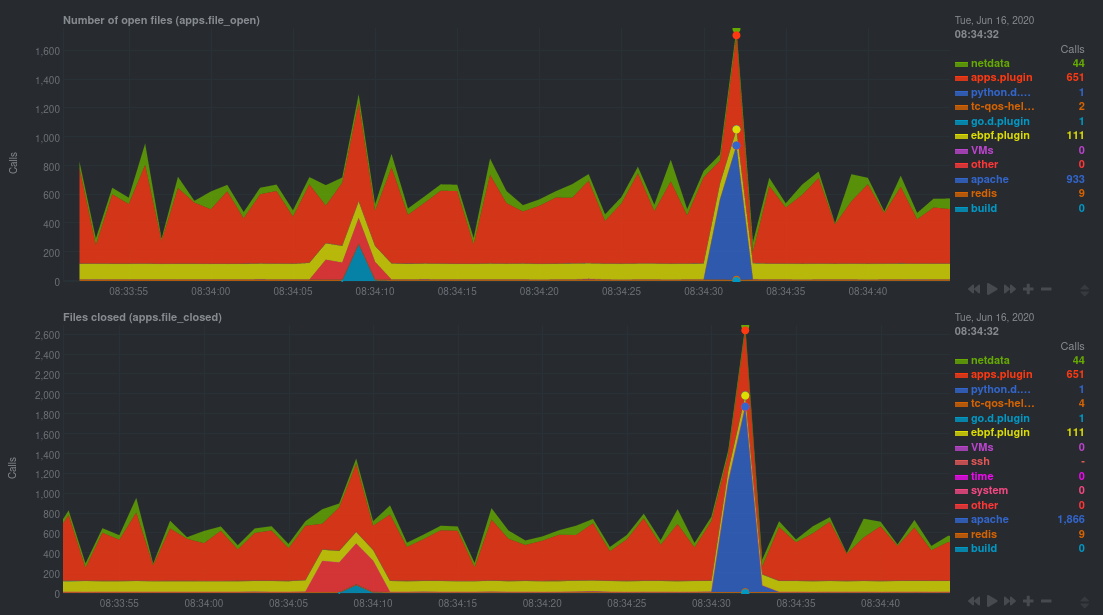 + +In these charts, you can see first a spike in syscalls to open and close files from the configure/build process, +followed by a similar spike from the Apache benchmark. + +> 👋 Don't forget that you can view chart data directly via Netdata's API! +> +> For example, open your browser and navigate to `http://NODE:19999/api/v1/data?chart=apps.file_open`, replacing `NODE` +> with the IP address or hostname of your Agent. The API returns JSON of that chart's dimensions and metrics, which you +> can use in other operations. +> +> To see other charts, replace `apps.file_open` with the context of the chart you want to see data for. +> +> To see all the API options, visit our [Swagger +> documentation](https://editor.swagger.io/?url=https://raw.githubusercontent.com/netdata/netdata/master/web/api/netdata-swagger.yaml) +> and look under the **/data** section. + +## Troubleshoot and debug applications with eBPF + +The actual method of troubleshooting and debugging any application with Netdata's eBPF metrics depends on the +application, its place within your stack, and the type of issue you're trying to root cause. This guide won't be able to +explain how to troubleshoot _any_ application with eBPF metrics, but it should give you some ideas on how to start with +your own systems. + +The value of using Netdata to collect and visualize eBPF metrics is that you don't have to rely on existing (complex) +command line eBPF programs or, even worse, write your own eBPF program to get the information you need. + +Let's walk through some scenarios where you might find value in eBPF metrics. + +### Benchmark application performance + +You can use eBPF metrics to profile the performance of your applications, whether they're custom or a standard Linux +service, like a web server or database. + +For example, look at the charts below. The first spike represents running a Redis benchmark _without_ pipelining +(`redis-benchmark -n 1000000 -t set,get -q`). The second spike represents the same benchmark _with_ pipelining +(`redis-benchmark -n 1000000 -t set,get -q -P 16`). + +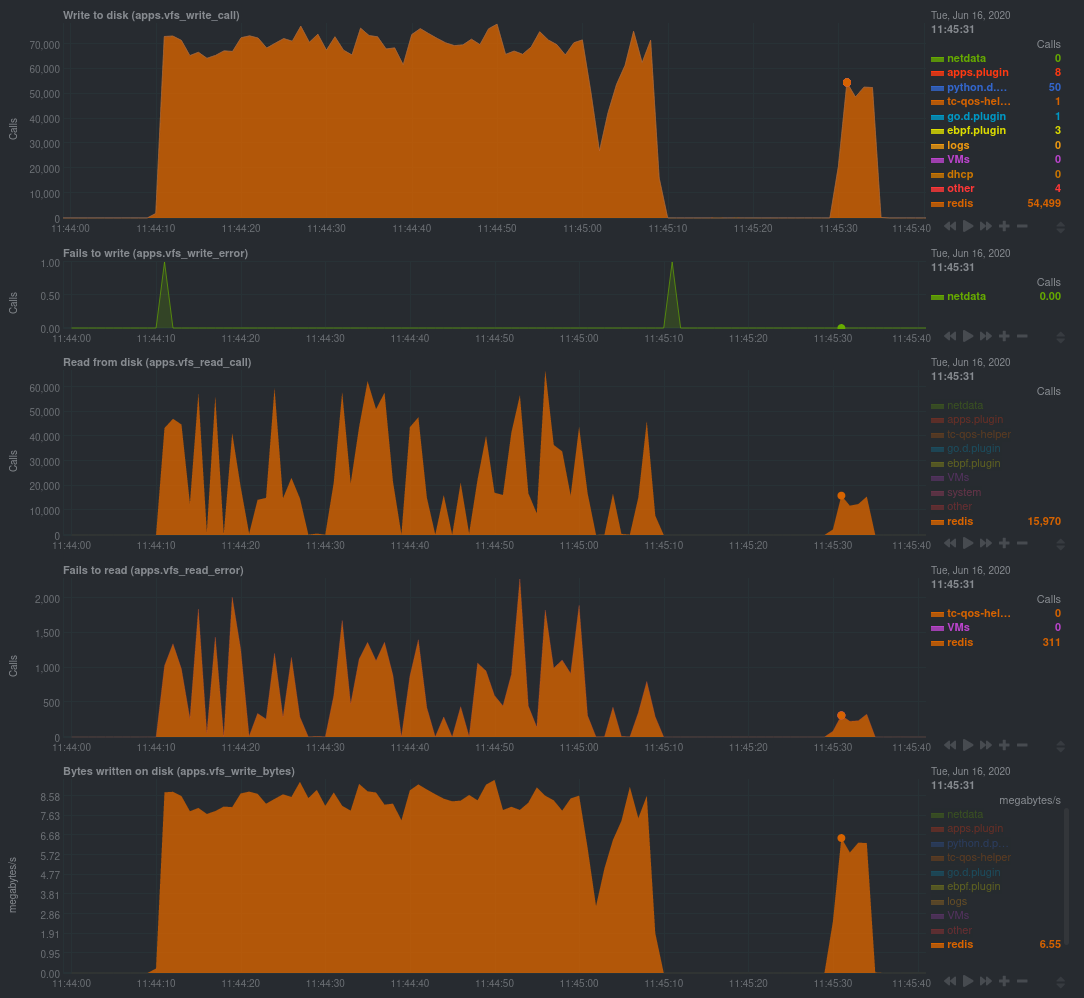 + +The performance optimization is clear from the speed at which the benchmark finished (the horizontal length of the +spike) and the reduced write/read syscalls and bytes written to disk. + +You can run similar performance benchmarks against any application, view the results on a Linux kernel level, and +continuously improve the performance of your infrastructure. + +### Inspect for leaking file descriptors + +If your application runs fine and then only crashes after a few hours, leaking file descriptors may be to blame. + +Check the **Number of open files (apps.file_open)** and **Files closed (apps.file_closed)** for discrepancies. These +metrics should be more or less equal. If they diverge, with more open files than closed, your application may not be +closing file descriptors properly. + +See, for example, the volume of files opened and closed by `apps.plugin` itself. Because the eBPF collector is +monitoring these syscalls at an event level, you can see at any given second that the open and closed numbers as equal. + +This isn't to say Netdata is _perfect_, but at least `apps.plugin` doesn't have a file descriptor problem. + +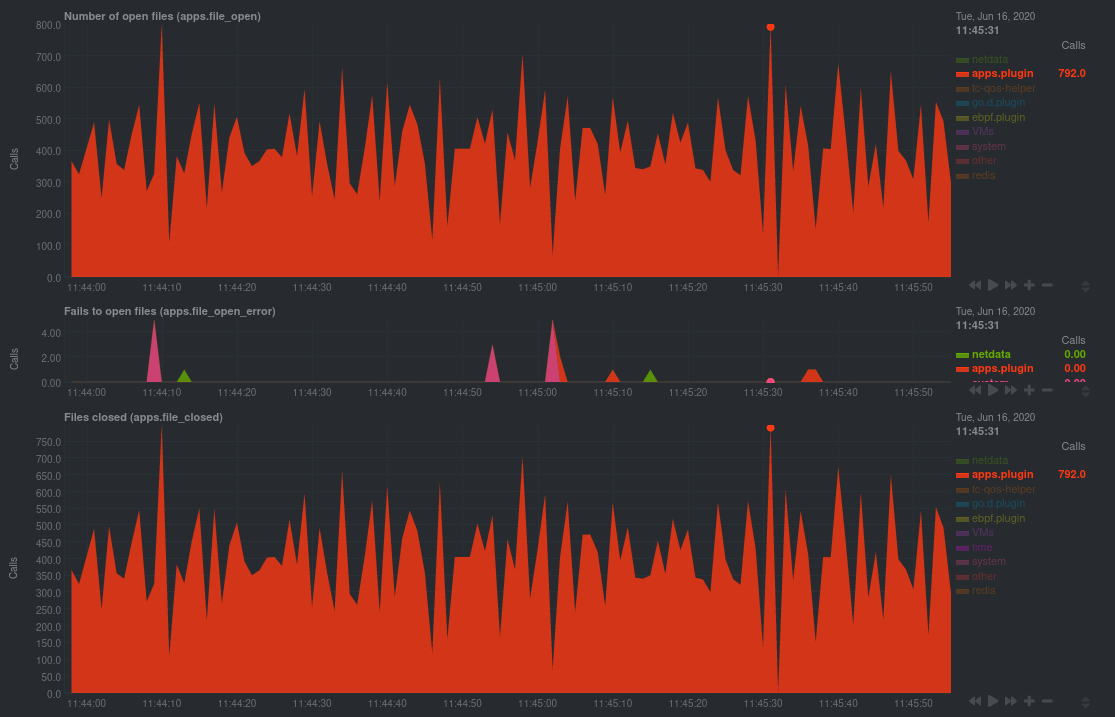 + +### Pin down syscall failures + +If you enabled the eBPF collector's `return` mode as mentioned [in a previous +step](#configure-the-ebpf-collector-to-monitor-errors), you can view charts related to how often a given application's +syscalls return in failure. + +By understanding when these failures happen, and when, you might be able to diagnose a bug in your application. + +To diagnose potential issues with an application, look at the **Fails to open files (apps.file_open_error)**, **Fails to +close files (apps.file_close_error)**, **Fails to write (apps.vfs_write_error)**, and **Fails to read +(apps.vfs_read_error)** charts for failed syscalls coming from your application. If you see any, look to the surrounding +charts for anomalies at the same time frame, or correlate with other activity in the application or on the system to get +closer to the root cause. + +### Investigate zombie processes + +Look for the trio of **Process started (apps.process_create)**, **Threads started (apps.thread_create)**, and **Tasks +closed (apps.task_close)** charts to investigate situations where an application inadvertently leaves [zombie +processes](https://en.wikipedia.org/wiki/Zombie_process). + +These processes, which are terminated and don't use up system resources, can still cause issues if your system runs out +of available PIDs to allocate. + +For example, the chart below demonstrates a [zombie factory +program](https://www.refining-linux.org/archives/7-Dr.-Frankenlinux-or-how-to-create-zombie-processes.html) in action. + +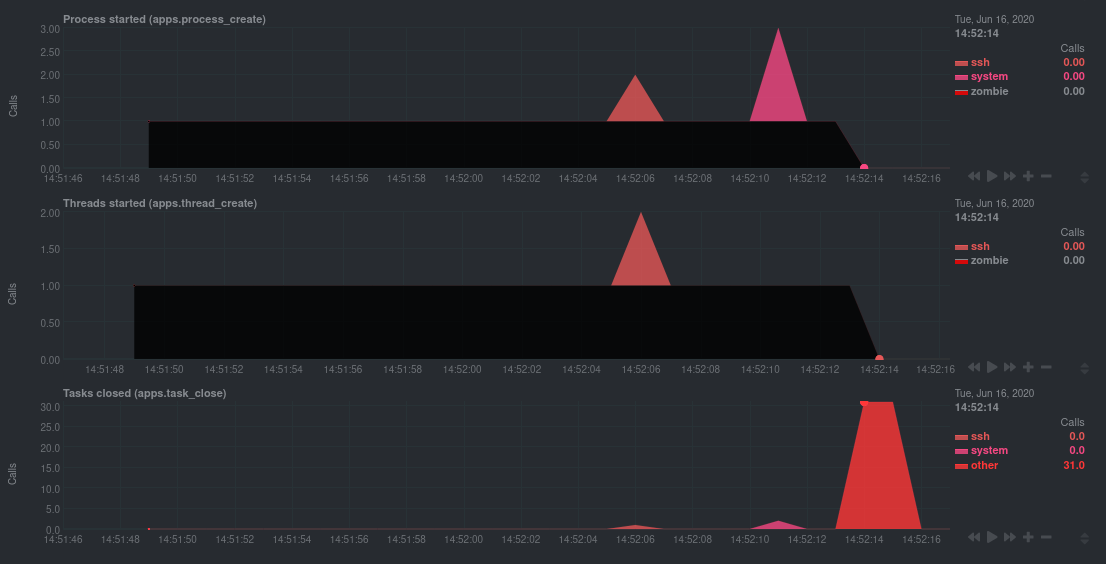 + +Starting at 14:51:49, Netdata sees the `zombie` group creating one new process every second, but no closed tasks. This +continues for roughly 30 seconds, at which point the factory program was killed with `SIGINT`, which results in the 31 +closed tasks in the subsequent second. + +Zombie processes may not be catastrophic, but if you're developing an application on Linux, you should eliminate them. +If a service in your stack creates them, you should consider filing a bug report. + +## View eBPF metrics in Netdata Cloud + +You can also show per-application eBPF metrics in Netdata Cloud. This could be particularly useful if you're running the +same application on multiple systems and want to correlate how it performs on each target, or if you want to share your +findings with someone else on your team. + +If you don't already have a Netdata Cloud account, go [sign in](https://app.netdata.cloud) and get started for free. +Read the [get started with Cloud guide](https://learn.netdata.cloud/docs/cloud/get-started) for a walkthrough of node +claiming and other fundamentals. + +Once you've added one or more nodes to a Space in Netdata Cloud, you can see aggregated eBPF metrics in the [Overview +dashboard](/docs/visualize/overview-infrastructure.md) under the same **Applications** or **eBPF** sections that you +find on the local Agent dashboard. Or, [create new dashboards](/docs/visualize/create-dashboards.md) using eBPF metrics +from any number of distributed nodes to see how your application interacts with multiple Linux kernels on multiple Linux +systems. + +Now that you can see eBPF metrics in Netdata Cloud, you can [invite your +team](https://learn.netdata.cloud/docs/cloud/manage/invite-your-team) and share your findings with others. + +## What's next? + +Debugging and troubleshooting an application takes a special combination of practice, experience, and sheer luck. With +Netdata's eBPF metrics to back you up, you can rest assured that you see every minute detail of how your application +interacts with the Linux kernel. + +If you're still trying to wrap your head around what we offer, be sure to read up on our accompanying documentation and +other resources on eBPF monitoring with Netdata: + +- [eBPF collector](/collectors/ebpf.plugin/README.md) +- [eBPF's integration with `apps.plugin`](/collectors/apps.plugin/README.md#integration-with-ebpf) +- [Linux eBPF monitoring with Netdata](https://www.netdata.cloud/blog/linux-ebpf-monitoring-with-netdata/) + +The scenarios described above are just the beginning when it comes to troubleshooting with eBPF metrics. We're excited +to explore others and see what our community dreams up. If you have other use cases, whether simulated or real-world, +we'd love to hear them: [info@netdata.cloud](mailto:info@netdata.cloud). + +Happy troubleshooting! + +[](<>) diff --git a/docs/guides/using-host-labels.md b/docs/guides/using-host-labels.md new file mode 100644 index 000000000..6d4af2e5d --- /dev/null +++ b/docs/guides/using-host-labels.md @@ -0,0 +1,212 @@ +<!-- +title: "Use host labels to organize systems, metrics, and alarms" +custom_edit_url: https://github.com/netdata/netdata/edit/master/docs/guides/using-host-labels.md +--> + +# Use host labels to organize systems, metrics, and alarms + +When you use Netdata to monitor and troubleshoot an entire infrastructure, whether that's dozens or hundreds of systems, +you need sophisticated ways of keeping everything organized. You need alarms that adapt to the system's purpose, or +whether the parent or child in a streaming setup. You need properly-labeled metrics archiving so you can sort, +correlate, and mash-up your data to your heart's content. You need to keep tabs on ephemeral Docker containers in a +Kubernetes cluster. + +You need **host labels**: a powerful new way of organizing your Netdata-monitored systems. We introduced host labels in +[v1.20 of Netdata](https://blog.netdata.cloud/posts/release-1.20/), and they come pre-configured out of the box. + +Let's take a peek into how to create host labels and apply them across a few of Netdata's features to give you more +organization power over your infrastructure. + +## Create unique host labels + +Host labels are defined in `netdata.conf`. To create host labels, open that file using `edit-config`. + +```bash +cd /etc/netdata # Replace this path with your Netdata config directory, if different +sudo ./edit-config netdata.conf +``` + +Create a new `[host labels]` section defining a new host label and its value for the system in question. Make sure not +to violate any of the [host label naming rules](/docs/configuration-guide.md#netdata-labels). + +```conf +[host labels] + type = webserver + location = us-seattle + installed = 20200218 +``` + +Once you've written a few host labels, you need to enable them. Instead of restarting the entire Netdata service, you +can reload labels using the helpful `netdatacli` tool: + +```bash +netdatacli reload-labels +``` + +Your host labels will now be enabled. You can double-check these by using `curl http://HOST-IP:19999/api/v1/info` to +read the status of your agent. For example, from a VPS system running Debian 10: + +```json +{ + ... + "host_labels": { + "_is_k8s_node": "false", + "_is_parent": "false", + "_virt_detection": "systemd-detect-virt", + "_container_detection": "none", + "_container": "unknown", + "_virtualization": "kvm", + "_architecture": "x86_64", + "_kernel_version": "4.19.0-6-amd64", + "_os_version": "10 (buster)", + "_os_name": "Debian GNU/Linux", + "type": "webserver", + "location": "seattle", + "installed": "20200218" + }, + ... +} +``` + +You may have noticed a handful of labels that begin with an underscore (`_`). These are automatic labels. + +### Automatic labels + +When Netdata starts, it captures relevant information about the system and converts them into automatically-generated +host labels. You can use these to logically organize your systems via health entities, exporting metrics, +parent-child status, and more. + +They capture the following: + +- Kernel version +- Operating system name and version +- CPU architecture, system cores, CPU frequency, RAM, and disk space +- Whether Netdata is running inside of a container, and if so, the OS and hardware details about the container's host +- Whether Netdata is running inside K8s node +- What virtualization layer the system runs on top of, if any +- Whether the system is a streaming parent or child + +If you want to organize your systems without manually creating host tags, try the automatic labels in some of the +features below. + +## Host labels in streaming + +You may have noticed the `_is_parent` and `_is_child` automatic labels from above. Host labels are also now +streamed from a child to its parent node, which concentrates an entire infrastructure's OS, hardware, container, +and virtualization information in one place: the parent. + +Now, if you'd like to remind yourself of how much RAM a certain child node has, you can access +`http://localhost:19999/host/CHILD_HOSTNAME/api/v1/info` and reference the automatically-generated host labels from the +child system. It's a vastly simplified way of accessing critical information about your infrastructure. + +> ⚠️ Because automatic labels for child nodes are accessible via API calls, and contain sensitive information like +> kernel and operating system versions, you should secure streaming connections with SSL. See the [streaming +> documentation](/streaming/README.md#securing-streaming-communications) for details. You may also want to use +> [access lists](/web/server/README.md#access-lists) or [expose the API only to LAN/localhost +> connections](/docs/netdata-security.md#expose-netdata-only-in-a-private-lan). + +You can also use `_is_parent`, `_is_child`, and any other host labels in both health entities and metrics +exporting. Speaking of which... + +## Host labels in health entities + +You can use host labels to logically organize your systems by their type, purpose, or location, and then apply specific +alarms to them. + +For example, let's use configuration example from earlier: + +```conf +[host labels] + type = webserver + location = us-seattle + installed = 20200218 +``` + +You could now create a new health entity (checking if disk space will run out soon) that applies only to any host +labeled `webserver`: + +```yaml + template: disk_fill_rate + on: disk.space + lookup: max -1s at -30m unaligned of avail + calc: ($this - $avail) / (30 * 60) + every: 15s + host labels: type = webserver +``` + +Or, by using one of the automatic labels, for only webserver systems running a specific OS: + +```yaml + host labels: _os_name = Debian* +``` + +In a streaming configuration where a parent node is triggering alarms for its child nodes, you could create health +entities that apply only to child nodes: + +```yaml + host labels: _is_child = true +``` + +Or when ephemeral Docker nodes are involved: + +```yaml + host labels: _container = docker +``` + +Of course, there are many more possibilities for intuitively organizing your systems with host labels. See the [health +documentation](/health/REFERENCE.md#alarm-line-host-labels) for more details, and then get creative! + +## Host labels in metrics exporting + +If you have enabled any metrics exporting via our experimental [exporters](/exporting/README.md), any new host +labels you created manually are sent to the destination database alongside metrics. You can change this behavior by +editing `exporting.conf`, and you can even send automatically-generated labels on with exported metrics. + +```conf +[exporting:global] +enabled = yes +send configured labels = yes +send automatic labels = no +``` + +You can also change this behavior per exporting connection: + +```conf +[opentsdb:my_instance3] +enabled = yes +destination = localhost:4242 +data source = sum +update every = 10 +send charts matching = system.cpu +send configured labels = no +send automatic labels = yes +``` + +By applying labels to exported metrics, you can more easily parse historical metrics with the labels applied. To learn +more about exporting, read the [documentation](/exporting/README.md). + +## What's next? + +Host labels are a brand-new feature to Netdata, and yet they've already propagated deeply into some of its core +functionality. We're just getting started with labels, and will keep the community apprised of additional functionality +as it's made available. You can also track [issue #6503](https://github.com/netdata/netdata/issues/6503), which is where +the Netdata team first kicked off this work. + +It should be noted that while the Netdata dashboard does not expose either user-configured or automatic host labels, API +queries _do_ showcase this information. As always, we recommend you secure Netdata + +- [Expose Netdata only in a private LAN](/docs/netdata-security.md#expose-netdata-only-in-a-private-lan) +- [Enable TLS/SSL for web/API requests](/web/server/README.md#enabling-tls-support) +- Put Netdata behind a proxy + - [Use an authenticating web server in proxy + mode](/docs/netdata-security.md#use-an-authenticating-web-server-in-proxy-mode) + - [Nginx proxy](/docs/Running-behind-nginx.md) + - [Apache proxy](/docs/Running-behind-apache.md) + - [Lighttpd](/docs/Running-behind-lighttpd.md) + - [Caddy](/docs/Running-behind-caddy.md) + +If you have issues or questions around using host labels, don't hesitate to [file an +issue](https://github.com/netdata/netdata/issues/new?labels=bug%2C+needs+triage&template=bug_report.md) on GitHub. We're +excited to make host labels even more valuable to our users, which we can only do with your input. + +[](<>) diff --git a/docs/high-performance-netdata.md b/docs/high-performance-netdata.md deleted file mode 100644 index 3b33c03f1..000000000 --- a/docs/high-performance-netdata.md +++ /dev/null @@ -1,150 +0,0 @@ -# High performance Netdata - -If you plan to run a Netdata public on the internet, you will get the most performance out of it by following these rules: - -## 1. run behind nginx - -The internal web server is optimized to provide the best experience with few clients connected to it. Normally a web browser will make 4-6 concurrent connections to a web server, so that it can send requests in parallel. To best serve a single client, Netdata spawns a thread for each connection it receives (so 4-6 threads per connected web browser). - -If you plan to have your Netdata public on the internet, this strategy wastes resources. It provides a lock-free environment so each thread is autonomous to serve the browser, but it does not scale well. Running Netdata behind nginx, idle connections to Netdata can be reused, thus improving significantly the performance of Netdata. - -In the following nginx configuration we do the following: - -- allow nginx to maintain up to 1024 idle connections to Netdata (so Netdata will have up to 1024 threads waiting for requests) - -- allow nginx to compress the responses of Netdata (later we will disable gzip compression at Netdata) - -- we disable wordpress pingback attacks and allow only GET, HEAD and OPTIONS requests. - -```conf -upstream backend { - server 127.0.0.1:19999; - keepalive 1024; -} - -server { - listen *:80; - server_name my.web.server.name; - - location / { - proxy_set_header X-Forwarded-Host $host; - proxy_set_header X-Forwarded-Server $host; - proxy_set_header X-Forwarded-For $proxy_add_x_forwarded_for; - proxy_pass http://backend; - proxy_http_version 1.1; - proxy_pass_request_headers on; - proxy_set_header Connection "keep-alive"; - proxy_store off; - gzip on; - gzip_proxied any; - gzip_types *; - - # Block any HTTP requests other than GET, HEAD, and OPTIONS - limit_except GET HEAD OPTIONS { - deny all; - } - } - - # WordPress Pingback Request Denial - if ($http_user_agent ~* "WordPress") { - return 403; - } - -} -``` - -Then edit `/etc/netdata/netdata.conf` and set these config options: - -``` -[global] - bind socket to IP = 127.0.0.1 - access log = none - disconnect idle web clients after seconds = 3600 - enable web responses gzip compression = no -``` - -These options: - -- `[global].bind socket to IP = 127.0.0.1` makes Netdata listen only for requests from localhost (nginx). -- `[global].access log = none` disables the access.log of Netdata. It is not needed since Netdata only listens for requests on 127.0.0.1 and thus only nginx can access it. nginx has its own access.log for your record. -- `[global].disconnect idle web clients after seconds = 3600` will kill inactive web threads after an hour of inactivity. -- `[global].enable web responses gzip compression = no` disables gzip compression at Netdata (nginx will compress the responses). - -## 2. increase open files limit (non-systemd) - -By default Linux limits open file descriptors per process to 1024. This means that less than half of this number of client connections can be accepted by both nginx and Netdata. To increase them, create 2 new files: - -1. `/etc/security/limits.d/nginx.conf`, with these contents: - -``` -nginx soft nofile 10000 -nginx hard nofile 30000 -``` - -2. `/etc/security/limits.d/netdata.conf`, with these contents: - -``` -netdata soft nofile 10000 -netdata hard nofile 30000 -``` - -and to activate them, run: - -```sh -sysctl -p -``` - -## 2b. increase open files limit (systemd) - -Thanks to [@leleobhz](https://github.com/netdata/netdata/issues/655#issue-163932584), this is what you need to raise the limits using systemd: - -This is based on <https://ma.ttias.be/increase-open-files-limit-in-mariadb-on-centos-7-with-systemd/> and here worked as following: - -1. Create the folders in /etc: - -``` -mkdir -p /etc/systemd/system/netdata.service.d -mkdir -p /etc/systemd/system/nginx.service.d -``` - -2. Create limits.conf in each folder as following: - -``` -[Service] -LimitNOFILE=30000 -``` - -3. Reload systemd daemon list and restart services: - -```sh -systemctl daemon-reload -systemctl restart netdata.service -systemctl restart nginx.service -``` - -You can check limits with following commands: - -```sh -cat /proc/$(ps aux | grep "nginx: master process" | grep -v grep | awk '{print $2}')/limits | grep "Max open files" -cat /proc/$(ps aux | grep "\/[n]etdata " | head -n1 | grep -v grep | awk '{print $2}')/limits | grep "Max open files" -``` - -View of the files: - -```sh -# tree /etc/systemd/system/*service.d/etc/systemd/system/netdata.service.d -/etc/systemd/system/netdata.service.d -└── limits.conf -/etc/systemd/system/nginx.service.d -└── limits.conf - -0 directories, 2 files - -# cat /proc/$(ps aux | grep "nginx: master process" | grep -v grep | awk '{print $2}')/limits | grep "Max open files" -Max open files 30000 30000 files - -# cat /proc/$(ps aux | grep "netdata" | head -n1 | grep -v grep | awk '{print $2}')/limits | grep "Max open files" -Max open files 30000 30000 files -``` - -[](<>) diff --git a/docs/monitor/configure-alarms.md b/docs/monitor/configure-alarms.md new file mode 100644 index 000000000..2a977955b --- /dev/null +++ b/docs/monitor/configure-alarms.md @@ -0,0 +1,148 @@ +<!-- +title: "Configure health alarms" +description: "Netdata's health monitoring watchdog is incredibly adaptable to your infrastructure's unique needs, with configurable health alarms." +custom_edit_url: https://github.com/netdata/netdata/edit/master/docs/monitor/configure-alarms.md +--> + +# Configure health alarms + +Netdata's health watchdog is highly configurable, with support for dynamic thresholds, hysteresis, alarm templates, and +more. You can tweak any of the existing alarms based on your infrastructure's topology or specific monitoring needs, or +create new entities. + +You can use health alarms in conjunction with any of Netdata's [collectors](/docs/collect/how-collectors-work.md) (see +the [supported collector list](/collectors/COLLECTORS.md)) to monitor the health of your systems, containers, and +applications in real time. + +While you can see active alarms both on the local dashboard and Netdata Cloud, all health alarms are configured _per +node_ via individual Netdata Agents. If you want to deploy a new alarm across your +[infrastructure](/docs/quickstart/infrastructure.md), you must configure each node with the same health configuration +files. + +## Edit health configuration files + +All of Netdata's [health configuration files](/health/REFERENCE.md#health-configuration-files) are in Netdata's config +directory, inside the `health.d/` directory. Navigate to your [Netdata config directory](/docs/configure/nodes.md) and +use `edit-config` to make changes to any of these files. + +For example, to edit the `cpu.conf` health configuration file, run: + +```bash +sudo ./edit-config health.d/cpu.conf +``` + +Each health configuration file contains one or more health _entities_, which always begin with `alarm:` or `template:`. +For example, here is the first health entity in `health.d/cpu.conf`: + +```yaml +template: 10min_cpu_usage + on: system.cpu + os: linux + hosts: * + lookup: average -10m unaligned of user,system,softirq,irq,guest + units: % + every: 1m + warn: $this > (($status >= $WARNING) ? (75) : (85)) + crit: $this > (($status == $CRITICAL) ? (85) : (95)) + delay: down 15m multiplier 1.5 max 1h + info: average cpu utilization for the last 10 minutes (excluding iowait, nice and steal) + to: sysadmin +``` + +To tune this alarm to trigger warning and critical alarms at a lower CPU utilization, change the `warn` and `crit` lines +to the values of your choosing. For example: + +```yaml + warn: $this > (($status >= $WARNING) ? (60) : (75)) + crit: $this > (($status == $CRITICAL) ? (75) : (85)) +``` + +Save the file and [reload Netdata's health configuration](#reload-health-configuration) to make your changes live. + +### Silence an individual alarm + +Instead of disabling an alarm altogether, or even disabling _all_ alarms, you can silence individual alarms by changing +one line in a given health entity. To silence any single alarm, change the `to:` line in its entity to `silent`. + +```yaml + to: silent +``` + +## Write a new health entity + +While tuning existing alarms may work in some cases, you may need to write entirely new health entities based on how +your systems, containers, and applications work. + +Read Netdata's [health reference](/health/REFERENCE.md#health-entity-reference) for a full listing of the format, +syntax, and functionality of health entities. + +To write a new health entity into a new file, navigate to your [Netdata config directory](/docs/configure/nodes.md), +then use `touch` to create a new file in the `health.d/` directory. Use `edit-config` to start editing the file. + +As an example, let's create a `ram-usage.conf` file. + +```bash +sudo touch health.d/ram-usage.conf +sudo ./edit-config health.d/ram-usage.conf +``` + +For example, here is a health entity that triggers a warning alarm when a node's RAM usage rises above 80%, and a +critical alarm above 90%: + +```yaml + alarm: ram_usage + on: system.ram +lookup: average -1m percentage of used + units: % + every: 1m + warn: $this > 80 + crit: $this > 90 + info: The percentage of RAM being used by the system. +``` + +Let's look into each of the lines to see how they create a working health entity. + +- `alarm`: The name for your new entity. The name needs to follow these requirements: + - Any alphabet letter or number. + - The symbols `.` and `_`. + - Cannot be `chart name`, `dimension name`, `family name`, or `chart variable names`. +- `on`: Which chart the entity listens to. +- `lookup`: Which metrics the alarm monitors, the duration of time to monitor, and how to process the metrics into a + usable format. + - `average`: Calculate the average of all the metrics collected. + - `-1m`: Use metrics from 1 minute ago until now to calculate that average. + - `percentage`: Clarify that we're calculating a percentage of RAM usage. + - `of used`: Specify which dimension (`used`) on the `system.ram` chart you want to monitor with this entity. +- `units`: Use percentages rather than absolute units. +- `every`: How often to perform the `lookup` calculation to decide whether or not to trigger this alarm. +- `warn`/`crit`: The value at which Netdata should trigger a warning or critical alarm. This example uses simple + syntax, but most pre-configured health entities use + [hysteresis](/health/REFERENCE.md#special-usage-of-the-conditional-operator) to avoid superfluous notifications. +- `info`: A description of the alarm, which will appear in the dashboard and notifications. + +In human-readable format: + +> This health entity, named **ram_usage**, watches the **system.ram** chart. It looks up the last **1 minute** of +> metrics from the **used** dimension and calculates the **average** of all those metrics in a **percentage** format, +> using a **% unit**. The entity performs this lookup **every minute**. +> +> If the average RAM usage percentage over the last 1 minute is **more than 80%**, the entity triggers a warning alarm. +> If the usage is **more than 90%**, the entity triggers a critical alarm. + +When you finish writing this new health entity, [reload Netdata's health configuration](#reload-health-configuration) to +see it live on the local dashboard or Netdata Cloud. + +## Reload health configuration + +To make any changes to your health configuration live, you must reload Netdata's health monitoring system. To do that +without restarting all of Netdata, run `netdatacli reload-health` or `killall -USR2 netdata`. + +## What's next? + +With your health entities configured properly, it's time to [enable +notifications](/docs/monitor/enable-notifications.md) to get notified whenever a node reaches a warning or critical +state. + +To build complex, dynamic alarms, read our guide on [dimension templates](/docs/guides/monitor/dimension-templates.md). + +[](<>) diff --git a/docs/monitor/enable-notifications.md b/docs/monitor/enable-notifications.md new file mode 100644 index 000000000..68beba53e --- /dev/null +++ b/docs/monitor/enable-notifications.md @@ -0,0 +1,144 @@ +<!-- +title: "Enable alarm notifications" +description: "Send Netdata alarms from a centralized place with Netdata Cloud, or configure nodes individually, to enable incident response and faster resolution." +custom_edit_url: https://github.com/netdata/netdata/edit/master/docs/monitor/enable-notifications.md +--> + +# Enable alarm notifications + +Netdata offers two ways to receive alarm notifications on external platforms. These methods work independently _or_ in +parallel, which means you can enable both at the same time to send alarm notifications to any number of endpoints. + +Both methods use a node's health alarms to generate the content of alarm notifications. Read the doc on [configuring +alarms](/docs/monitor/configure-alarms.md) to change the preconfigured thresholds or to create tailored alarms for your +infrastructure. + +Netdata Cloud offers [centralized alarm notifications](#netdata-cloud) via email, which leverages the health status +information already streamed to Netdata Cloud from claimed nodes to send notifications to those who have enabled them. + +The Netdata Agent has a [notification system](#netdata-agent) that supports more than a dozen services, such as email, +Slack, PagerDuty, Twilio, Amazon SNS, Discord, and much more. + +For example, use centralized alarm notifications in Netdata Cloud for immediate, zero-configuration alarm notifications +for your team, then configure individual nodes send notifications to a PagerDuty endpoint for an automated incident +response process. + +## Netdata Cloud + +Netdata Cloud's [centralized alarm notifications](https://learn.netdata.cloud/docs/cloud/monitoring/notifications/) is a +zero-configuration way to get notified when an anomaly or incident strikes any node or application in your +infrastructure. The advantage of using centralized alarm notifications from Netdata Cloud is that you don't have to +worry about configuring each node in your infrastructure. + +To enable centralized alarm notifications for a Space, click on **Manage Space** in the left-hand menu, then click on +the **Notifications** tab. Click the toggle switch next to **E-mail** to enable this notification method. + +Next, enable notifications on a user level by clicking on your profile icon, then **Profile** in the dropdown. The +**Notifications** tab reveals rich management settings, including the ability to enable/disable methods entirely or +choose what types of notifications to receive from each War Room. + + + +See the [centralized alarm notifications](https://learn.netdata.cloud/docs/cloud/monitoring/notifications/) reference +doc for further details about what information is conveyed in an email notification, flood protection, and more. + +## Netdata Agent + +The Netdata Agent's [notification system](/health/notifications/README.md) runs on every node and dispatches +notifications based on configured endpoints and roles. You can enable multiple endpoints on any one node _and_ use Agent +notifications in parallel with centralized alarm notifications in Netdata Cloud. + +> ❗ If you want to enable notifications from multiple nodes in your infrastructure, each running the Netdata Agent, you +> must configure each node individually. + +Below, we'll use [Slack notifications](#enable-slack-notifications) as an example of the process of enabling any +notification platform. + +### Supported notification endpoints + +- [**alerta.io**](/health/notifications/alerta/README.md) +- [**Amazon SNS**](/health/notifications/awssns/README.md) +- [**Custom endpoint**](/health/notifications/custom/README.md) +- [**Discord**](/health/notifications/discord/README.md) +- [**Dynatrace**](/health/notifications/dynatrace/README.md) +- [**Email**](/health/notifications/email/README.md) +- [**Flock**](/health/notifications/flock/README.md) +- [**Google Hangouts**](/health/notifications/hangouts/README.md) +- [**IRC**](/health/notifications/irc/README.md) +- [**Kavenegar**](/health/notifications/kavenegar/README.md) +- [**Matrix**](/health/notifications/matrix/README.md) +- [**Messagebird**](/health/notifications/messagebird/README.md) +- [**Netdata Agent dashboard**](/health/notifications/web/README.md) +- [**Opsgenie**](/health/notifications/opsgenie/README.md) +- [**PagerDuty**](/health/notifications/pagerduty/README.md) +- [**Prowl**](/health/notifications/prowl/README.md) +- [**PushBullet**](/health/notifications/pushbullet/README.md) +- [**PushOver**](/health/notifications/pushover/README.md) +- [**Rocket.Chat**](/health/notifications/rocketchat/README.md) +- [**Slack**](/health/notifications/slack/README.md) +- [**SMS Server Tools 3**](/health/notifications/smstools3/README.md) +- [**StackPulse**](/health/notifications/stackpulse/README.md) +- [**Syslog**](/health/notifications/syslog/README.md) +- [**Telegram**](/health/notifications/telegram/README.md) +- [**Twilio**](/health/notifications/twilio/README.md) + +### Enable Slack notifications + +First, [Add an incoming webhook](https://slack.com/apps/A0F7XDUAZ-incoming-webhooks) in Slack for the channel where you +want to see alarm notifications from Netdata. Click the green **Add to Slack** button, choose the channel, and click the +**Add Incoming WebHooks Integration** button. + +On the following page, you'll receive a **Webhook URL**. That's what you'll need to configure Netdata, so keep it handy. + +Navigate to your [Netdata config directory](/docs/configure/nodes.md#netdata-config-directory) and use `edit-config` to +open the `health_alarm_notify.conf` file: + +```bash +sudo ./edit-config health_alarm_notify.conf +``` + +Look for the `SLACK_WEBHOOK_URL=" "` line and add the incoming webhook URL you got from Slack: + +```conf +SLACK_WEBHOOK_URL="https://hooks.slack.com/services/XXXXXXXXX/XXXXXXXXX/XXXXXXXXXXXX" +``` + +A few lines down, edit the `DEFAULT_RECIPIENT_SLACK` line to contain a single hash `#` character. This instructs Netdata +to send a notification to the channel you configured with the incoming webhook. + +```conf +DEFAULT_RECIPIENT_SLACK="#" +``` + +To test Slack notifications, switch to the Netdata user. + +```bash +sudo su -s /bin/bash netdata +``` + +Next, run the `alarm-notify` script using the `test` option. + +```bash +/usr/libexec/netdata/plugins.d/alarm-notify.sh test +``` + +You should receive three notifications in your Slack channel for each health status change: `WARNING`, `CRITICAL`, and +`CLEAR`. + +See the [Agent Slack notifications](/health/notifications/slack/README.md) doc for more options and information. + +## What's next? + +Now that you have health entities configured to your infrastructure's needs and notifications to inform you of anomalies +or incidents, your health monitoring setup is complete. + +To make your dashboards most useful during root cause analysis, use Netdata's [distributed data +architecture](/docs/store/distributed-data-architecture.md) for the best-in-class performance and scalability. + +### Related reference documentation + +- [Netdata Cloud · Alarm notifications](https://learn.netdata.cloud/docs/cloud/monitoring/notifications/) +- [Netdata Agent · Notifications](/health/notifications/README.md) + +[](<>) diff --git a/docs/monitor/view-active-alarms.md b/docs/monitor/view-active-alarms.md new file mode 100644 index 000000000..8837e48ad --- /dev/null +++ b/docs/monitor/view-active-alarms.md @@ -0,0 +1,75 @@ +<!-- +title: "View active health alarms" +description: "View active alarms and their rich data to discover and resolve anomalies and performance issues across your infrastructure." +custom_edit_url: https://github.com/netdata/netdata/edit/master/docs/monitor/view-active-alarms.md +--> + +# View active health alarms + +Every Netdata Agent comes with hundreds of pre-installed health alarms designed to notify you when an anomaly or +performance issue affects your node or the applications it runs. + +As soon as you launch a Netdata Agent and [claim it](/docs/get/README.md#claim-your-node-on-netdata-cloud), you can view +active alarms in both the local dashboard and Netdata Cloud. + +## View active alarms in Netdata Cloud + +You can see active alarms from any node in your infrastructure in two ways: Click on the bell 🔔 icon in the top +navigation, or click on the first column of any node's row in Nodes. This column's color changes based on the node's +[health status](/health/REFERENCE.md#alarm-statuses): gray is `CLEAR`, yellow is `WARNING`, and red is `CRITICAL`. + +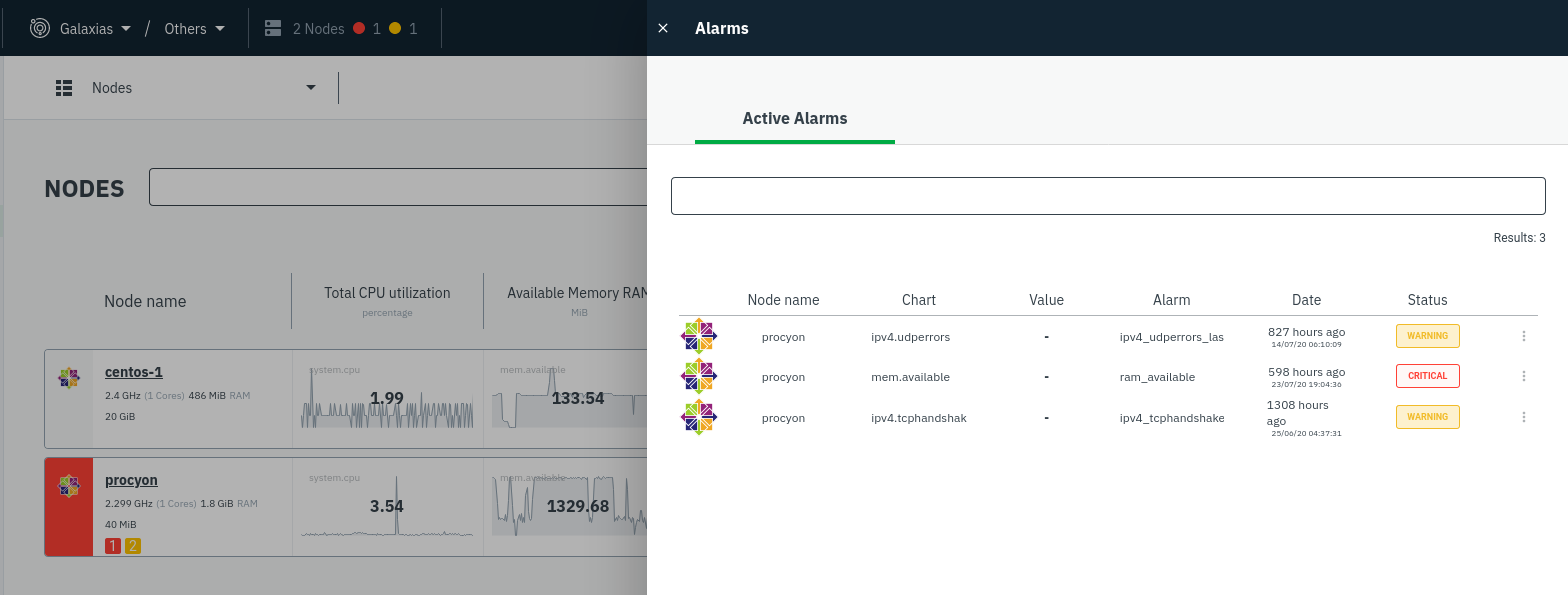 + +The Alarms panel lists all active alarms for nodes within that War Room, and tells you which chart triggered the alarm, +what that chart's current value is, the alarm that triggered it, and when the alarm status first began. + +Use the input field in the Alarms panel to filter active alarms. You can sort by the node's name, alarm, status, chart +that triggered the alarm, or the operating system. Read more about the [filtering +syntax](https://learn.netdata.cloud/docs/cloud/war-rooms#node-filter) to build valuable filters for your infrastructure. + +Click on the 3-dot icon (`⋮`) to view active alarm information or navigate directly to the offending chart in that +node's Cloud dashboard with the **Go to chart** button. + +The active alarm information gives you details about the alarm that's been triggered. You can see the alarm's +configuration, how it calculates warning or critical alarms, and which configuration file you could edit on that node if +you want to tweak or disable the alarm to better suit your needs. + +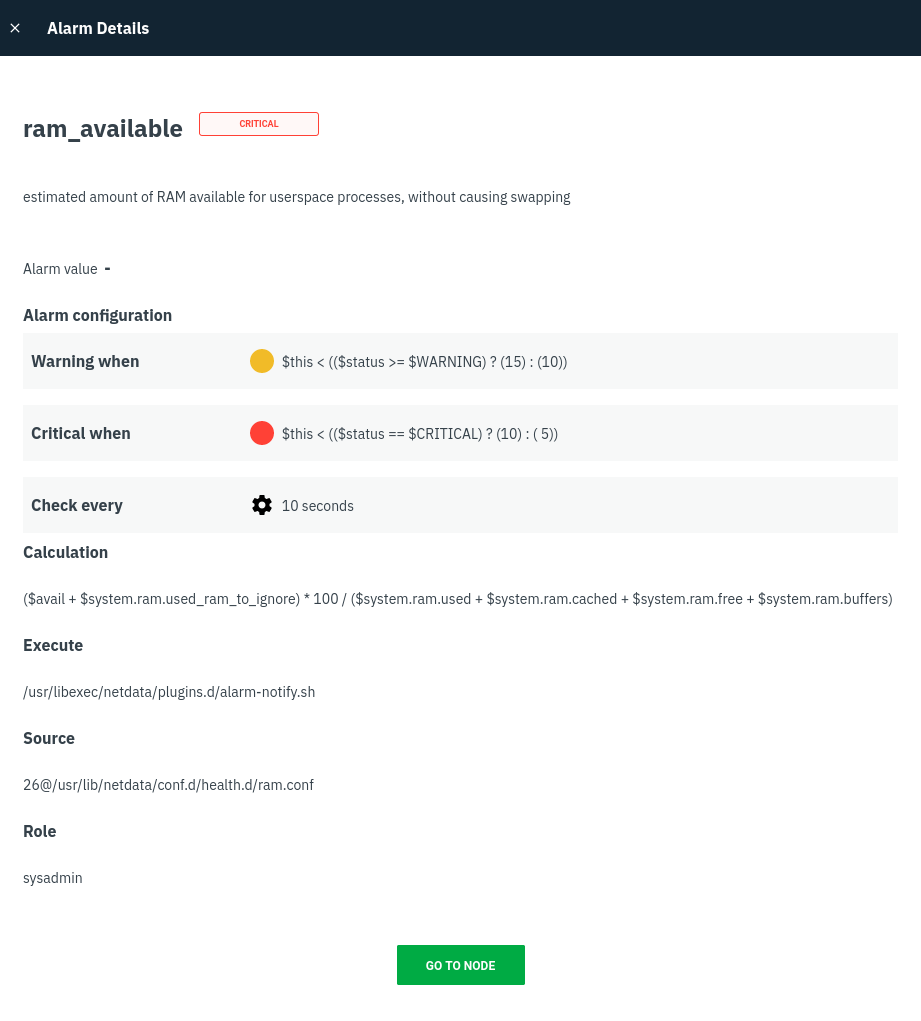 + +## View active alarms in the Netdata Agent + +Find the bell 🔔 icon in the top navigation to bring up a modal that shows currently raised alarms, all running alarms, +and the alarms log. Here is an example of a raised `system.cpu` alarm, followed by the full list and alarm log: + + + +And a static screenshot of the raised CPU alarm: + + + +The alarm itself is named **system - cpu**, and its context is `system.cpu`. Beneath that is an auto-updating badge that +shows the latest value of the chart that triggered the alarm. + +With the three icons beneath that and the **role** designation, you can: + +1. Scroll to the chart associated with this raised alarm. +2. Copy a link to the badge to your clipboard. +3. Copy the code to embed the badge onto another web page using an `<embed>` element. + +The table on the right-hand side displays information about the health entity that triggered the alarm, which you can +use as a reference to [configure alarms](/docs/monitor/configure-alarms.md). + +## What's next? + +With the information that appears on Netdata Cloud and the local dashboard about active alarms, you can [configure +alarms](/docs/monitor/configure-alarms.md) to match your infrastructure's needs or your team's goals. + +If you're happy with the pre-configured alarms, skip ahead to [enable +notifications](/docs/monitor/enable-notifications.md) to use Netdata Cloud's centralized alarm notifications and/or +per-node notifications to endpoints like Slack, PagerDuty, Twilio, and more. + +[](<>) diff --git a/docs/netdata-cloud/README.md b/docs/netdata-cloud/README.md deleted file mode 100644 index 9ed6330b5..000000000 --- a/docs/netdata-cloud/README.md +++ /dev/null @@ -1,46 +0,0 @@ -# Netdata Cloud - -Netdata Cloud is core to our ongoing mission to provide real-time, distributed health monitoring and performance troubleshooting. It's the foundation of an ecosystem of tools that will help you build more extraordinary infrastructures. - -Netdata Cloud is also the next iteration of our global Netdata registry. For technical information about how our registries work, what information they store, and how your web browser "talks" to both, visit our [registry documentation](../../registry). - -Learn more about the future of Netdata Cloud on our [announcement post](https://blog.netdata.cloud/posts/netdata-cloud-announcement/). - -## Registering for or signing in to Netdata Cloud - -**If you're ready to register for a new Netdata Cloud account, or sign in to your existing Netdata Cloud account, visit our [signing in guide](signing-in.md) for details.** - -!!! attention "Private registries and Netdata Cloud" - If you're running a private registry and are interested in trying out Netdata Cloud as a replacement for your private registry, read [our notice](signing-in.md#private-registries-and-netdata-cloud) about transitioning from a private registry to our Netdata Cloud registry. - -## Netdata Cloud features - -Netdata Cloud currently enables two features: the **My nodes** in the top-left corner of the Netdata dashboard, and the [**Nodes View**](nodes-view.md). - -We have an aggressive roadmap of new features, such as Workspaces for different parts of your infrastructure, Rooms to collaborate with colleagues, and the ability to receive alarms from any number of distributed Netdata agents in a single place. Read more about our proposed features [here](https://blog.netdata.cloud/posts/netdata-cloud-announcement/#what-features-will-netdata-cloud-offer). - -### Planned enterprise features (paid) - -Large enterprises have unique real-time monitoring needs. They have thousands of servers and applications running concurrently, and are willing to pay for the complex features that help them make smarter, faster decisions about their infrastructure. We expect to create a paid tier of Netdata Cloud with a recurring, per-user pricing model that will unlock enterprise-focused features. - -A few of these planned features include: - -- Long-term storage of Netdata UI snapshots -- Active Directory integration for single sign-on -- Private service status pages -- Extended retention of alarms timelines -- Incident response toolkits -- Additional enterprise plugins and integrations -- Extended retention of chat messages - -Again, we expect that the vast majority of Netdata's users won't need these features. Creating these two tiers will help us further fund the company's efforts to deploy Netdata's open-source agent on a massive scale and entirely for free. - -## Running Netdata without Netdata Cloud - -Netdata Cloud is entirely optional. The application will never force you to create a Netdata Cloud account or associate nodes with the public registries. But, if you choose not to use Netdata Cloud, you will be missing out on the [Nodes View](nodes-view.md) and other upcoming features. - -## Running Netdata Cloud on-premises or as a hosted instance - -We plan on making both on-premises and hosted instances of Netdata Cloud available to enterprises. Until then, we are creating a list of people and businesses interested in either of these options. To add yourself or your organization to this list, email us at [info@netdata.cloud](mailto:info@netdata.cloud). - -[](<>) diff --git a/docs/netdata-cloud/nodes-view.md b/docs/netdata-cloud/nodes-view.md deleted file mode 100644 index 1e91639d7..000000000 --- a/docs/netdata-cloud/nodes-view.md +++ /dev/null @@ -1,208 +0,0 @@ -# Using the Nodes View - -## Introduction - -As of v1.15.0 of Netdata, and in conjunction with our announcement post about the [future of Netdata](https://blog.netdata.cloud/posts/netdata-cloud-announcement/), we have enabled an entirely new way to view your infrastructure using the open-source Netdata agent in conjunction with Netdata Cloud: the **Nodes View**. - -This view, powered by Netdata Cloud, provides an aggregated view of the Netdata agents that you have associated with your Netdata Cloud account. The main benefit of Nodes View is seeing the health of your infrastructure from a single interface, especially if you have many systems running Netdata. With Nodes View, you can monitor the health status of your nodes via active alarms and view a subset of real-time performance metrics the agent is collecting every second. - -!!! attention "Nodes View is beta software!" - The Nodes View is currently in beta, so all typical warnings about beta software apply. You may come across bugs or inconsistencies. - -``` -The current version of Nodes uses the API available on each Netdata agent to check for new alarms and the machine's overall health/availability. In the future, we will offer both polling via the API and real-time streaming of health status/metrics. -``` - -## The Nodes View - -To access the Nodes View, you must first be signed in to Netdata Cloud. To register for an account, or sign in to an existing account, visit our [signing in guide](signing-in.md) for details. - -Once you're signed in to Netdata Cloud, clicking on any of the **Nodes Beta** buttons in the node's web dashboard will lead you to the Nodes View. Find one (`1`) in the dropdown menu in the upper-right corner, a second (`2`) in the top navigation bar, and a third (`3`) in the dropdown menu in the top-left corner of the Netdata dashboard. - -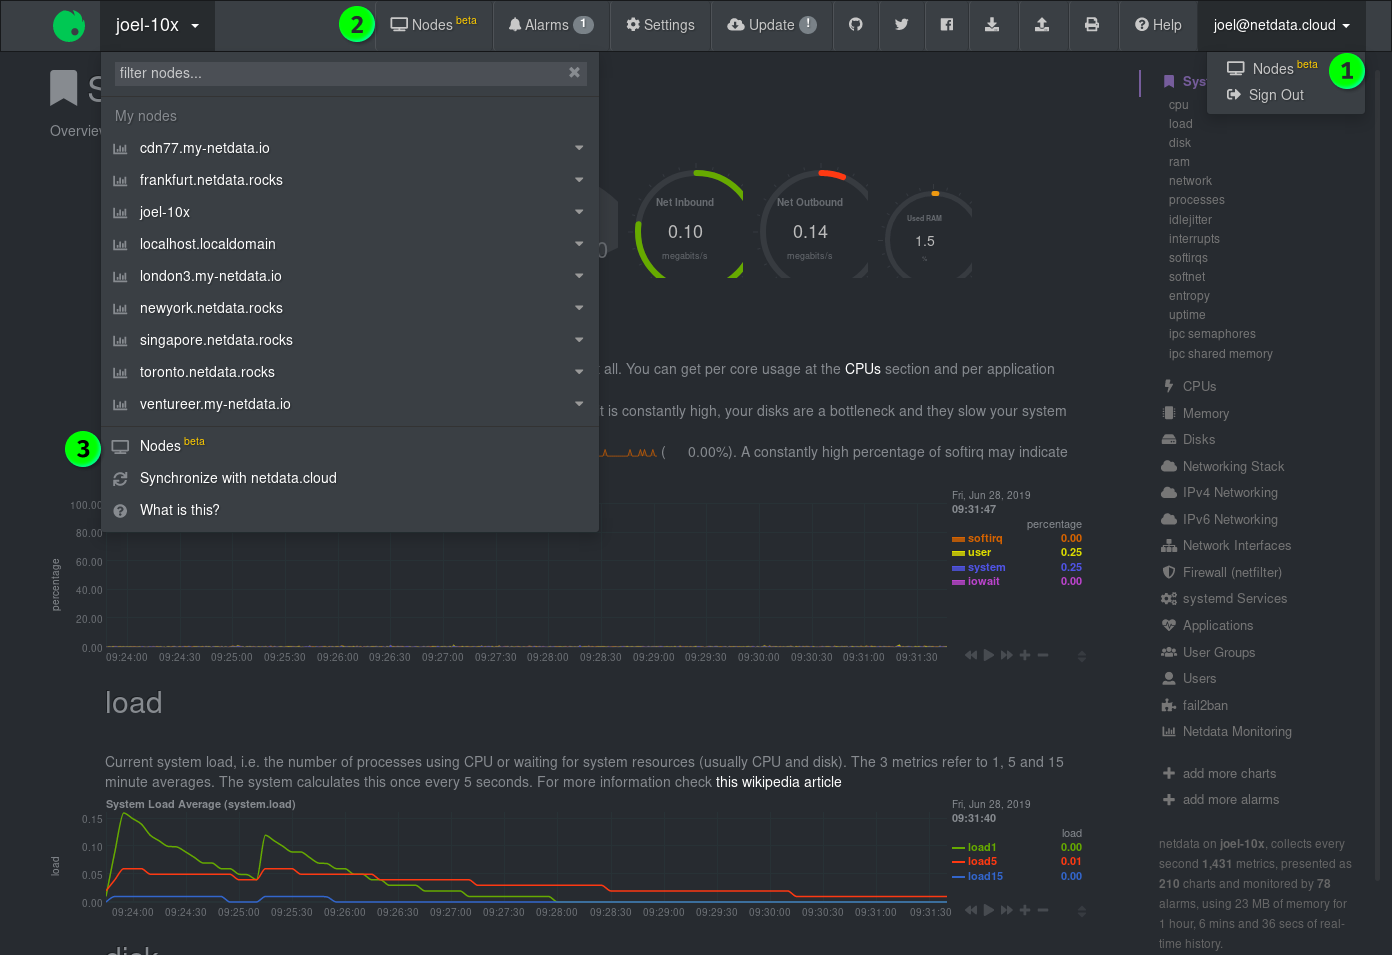 - -### Nodes - -The primary component of the Nodes View is a list of all the nodes with Netdata agents you have associated with your Netdata Cloud account via the Netdata Cloud registry. - -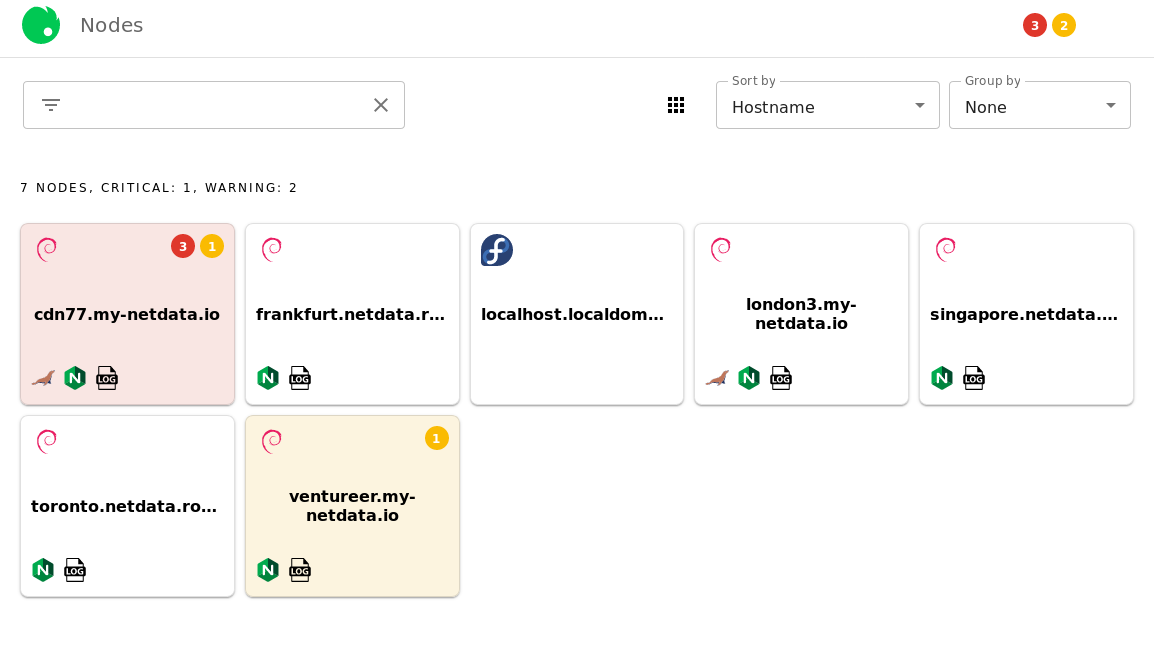 - -Depending on which [view mode](#view-modes) you're using, Nodes View will present you with information about that node, such as its hostname, operating system, warnings/critical alerts, and any [supported services](#Services-available-in-the-Nodes-View) that are running on that node. Here is an example of the **full** view mode: - -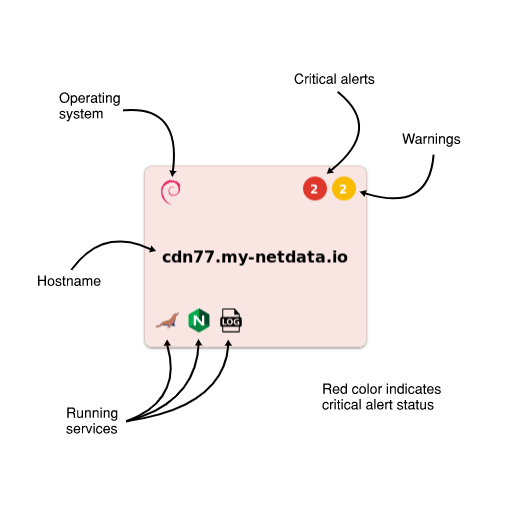 - -The background color of each Node entry is an indication of its health status: - -| Health status | Background color | -| ------------- | ------------------------------------------------------------------------------------------------- | -| **White** | Normal status, no alarms | -| **Yellow** | 1 or more active warnings | -| **Red** | 1 or more active critical alerts | -| **Grey** | Node is unreachable (server unreachable [due to network conditions], server down, or changed URL) | - -### Node overview - -When you click on any of the Nodes, an overview sidebar will appear on the right-hand side of the Nodes View. - -This overview contains the following: - -- An icon (`1`) representing the operating system installed on that machine -- The hostname (`2`) of the machine -- A link (`3`) to the URL at which the web dashboard is available -- Three tabs (`4`) for **System** metrics, **Services** metrics, and **Alarms** -- A number of selectors (`5`) to choose which metrics/alarms are shown in the overview - - **System** tab: _Overview_, _Disks_, and _Network_ selectors - - **Services** tab: _Databases_, _Web_, and _Messaging_ selectors - - **Alarms** tab: _Critical_ and _Warning_ selectors -- The visualizations and/or alarms (`6`) supported under the chosen tab and selector -- Any other available URLS (`7`) associated with that node under the **Node URLs** header. - -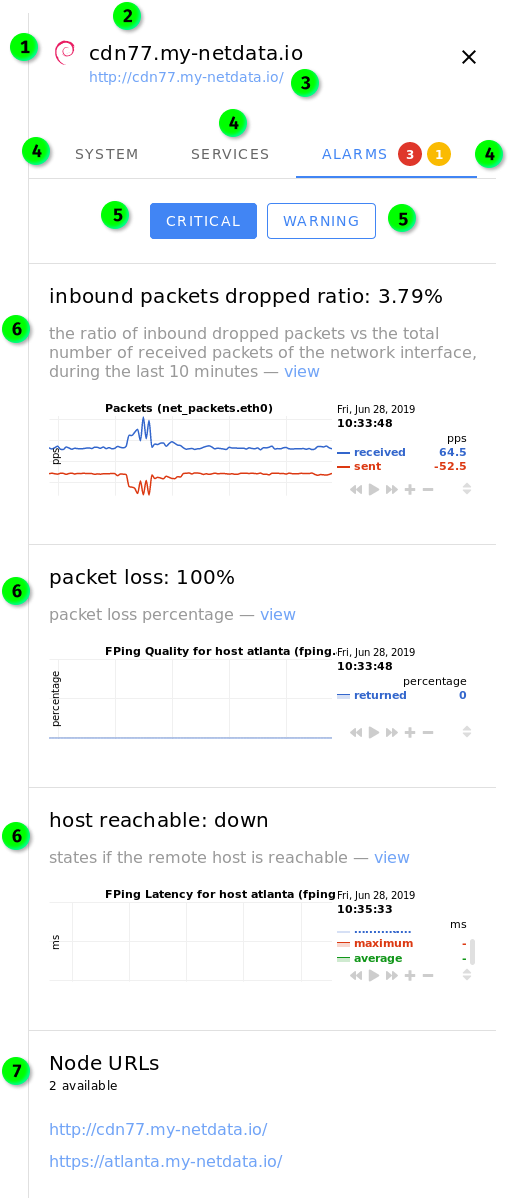 - -By default, clicking on a Node will display the sidebar with the **System** tab enabled. If there are warnings or alarms active for that Node, the **Alarms** tab will be displayed by default. - -**The visualizations in the overview sidebar are live!** As with all of Netdata's visualizations, you can scrub forward and backward in time, zoom, pause, and pinpoint anomalies down to the second. - -#### System tab - -The **System** tab has three sections: *Overview*, *Disks*, and *Network*. - -_Overview_ displays visualizations for `CPU`, `System Load Average` `Disk I/O`, `System RAM`, `System Swap`, `Physical Network Interfaces Aggregated Bandwidth`, and the URL of the node. - -_Disks_ displays visualizations for `Disk Utilization Time`, and `Disk Space Usage` for every available disk. - -_Network_ displays visualizations for `Bandwidth` for every available networking device. - -#### Services tab - -The **Services** tab will show visualizations for any [supported services](#Services-available-in-the-Nodes-View) that are running on that node. Three selectors are available: _Databases_, _Web_, and _Messaging_. If there are no services under any of these categories, the selector will not be clickable. - -#### Alarms tab - -The **Alarms** tab contains two selectors: _Critical_ and _Warning_. If there are no alarms under either of these categories, the selector will not be clickable. - -Both of these tabs will display alarms information when available, along with the relevant visualization with metrics from your Netdata agent. The `view` link redirects you to the web dashboard for the selected node and automatically shows the appropriate visualization and timeframe. - -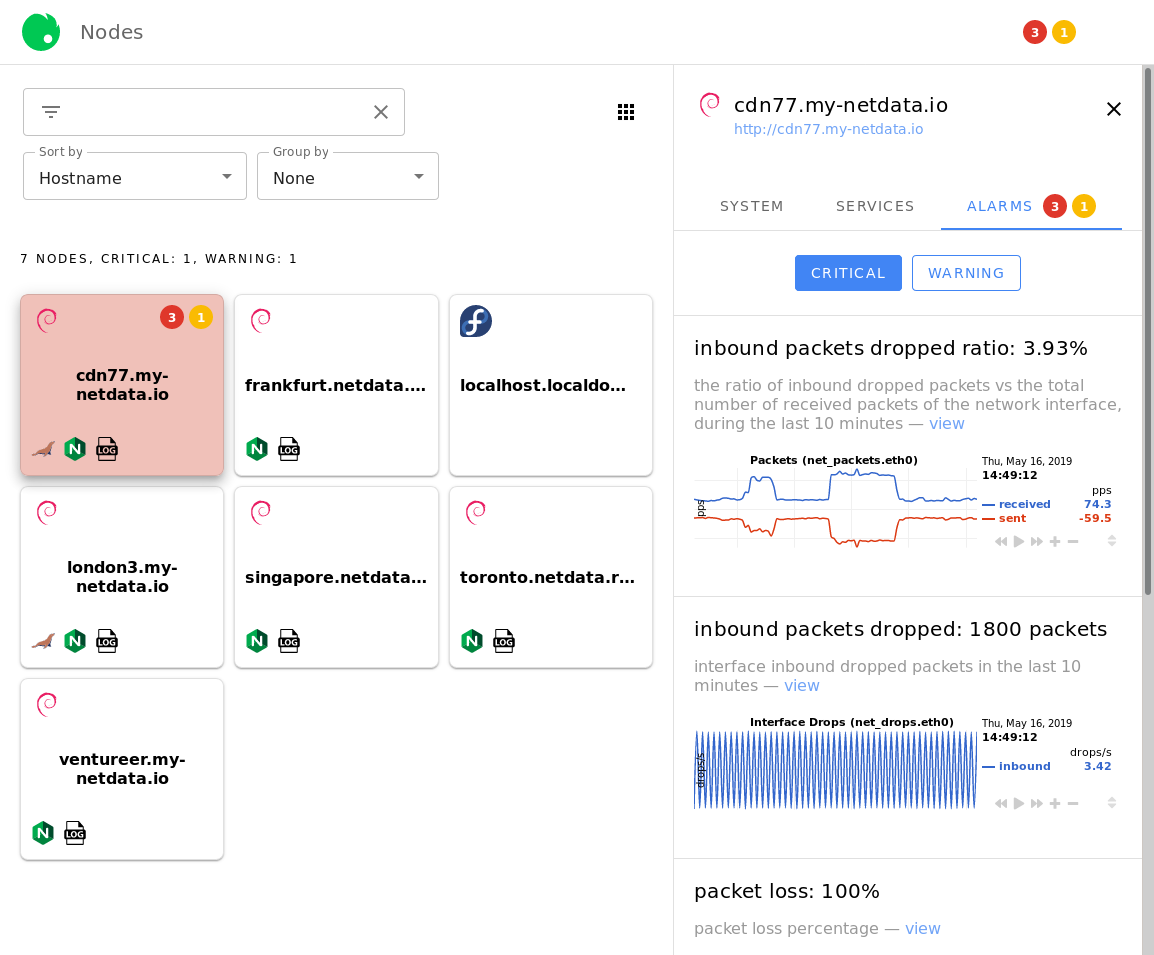 - -### Filtering field - -The search field will be useful for Netdata Cloud users with dozens or hundreds of Nodes. You can filter for the hostname of the Node you're interested in, the operating system it's running, or even for the services installed. - -The filtering field will offer you autocomplete suggestions. For example, the options available after typing `ng` into the filtering field: - -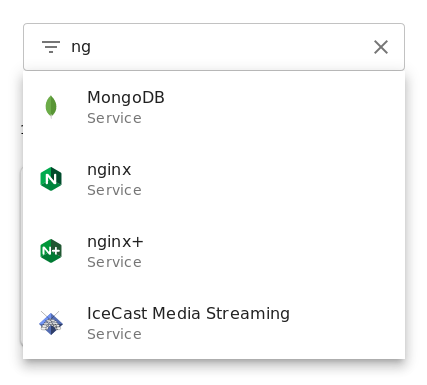 - -If you select multiple filters, results will display according to an `OR` operator. - -### View modes - -To the right of the filtering field is three functions that will help you organize your Visited Nodes according to your preferences. - - - -The view mode button lets you switch between three view modes: - -- **Full** mode, which displays the following information in a large squares for each connected Node: - - Operating system - - Critical/warning alerts in two separate indicators - - Hostname - - Icons for [supported services](#services-available-in-the-nodes-view) - -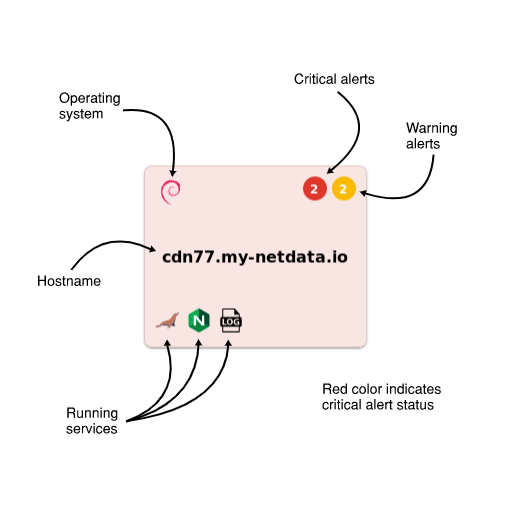 - -- **Compact** mode, which displays the following information in small squares for each connected Node: - - Operating system - - - -- **Detailed** mode, which displays the following information in large horizontal rectangles for each connected Node: - - Operating system - - Critical/warning alerts in two separate indicators - - Hostname - - Icons for [supported services](#services-available-in-the-nodes-view) - -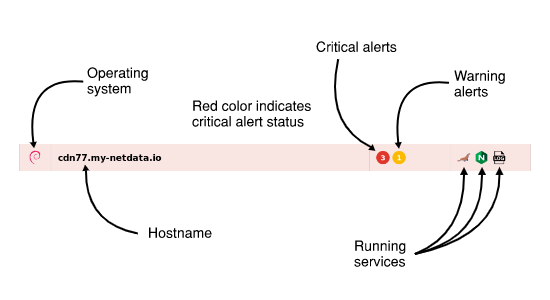 - -## Sorting, and grouping - -The **Sort by** dropdown allows you to choose between sorting _alphabetically by hostname_, most _recently-viewed_ nodes, and most _frequently-view_ nodes. - -The **Group by** dropdown lets you switch between _alarm status_, _running services_, or _online status_. - -For example, the following screenshot represents the Nodes list with the following options: _detailed list_, _frequently visited_, and _alarm status_. - -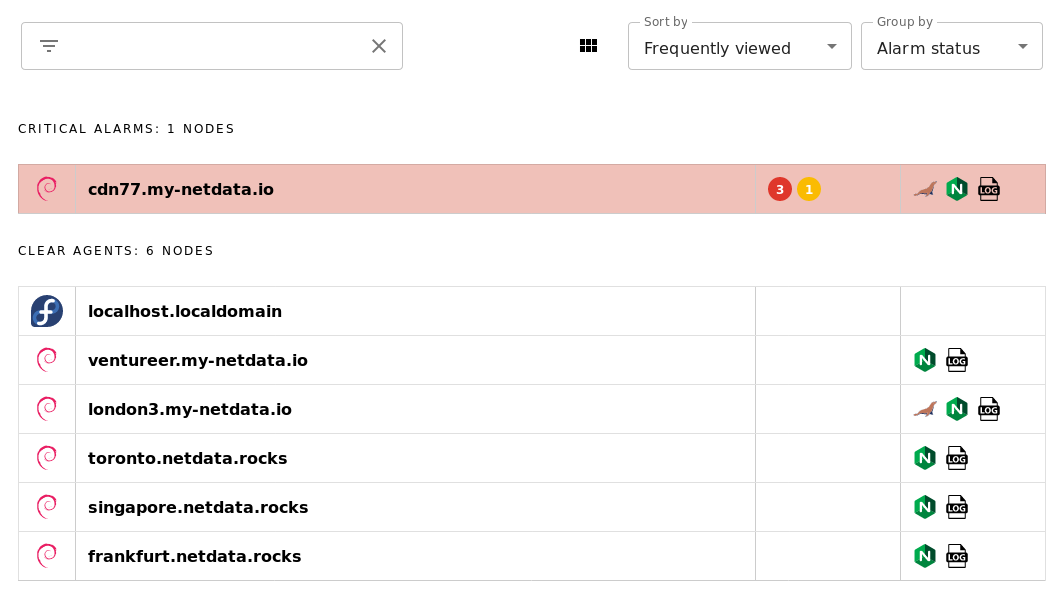 - -Play around with the options until you find a setup that works for you. - -## Adding more agents to the Nodes View - -There is currently only one way to associate additional Netdata nodes with your Netdata Cloud account. You must visit the web dashboard for each node and click the **Sign in** button and complete the [sign in process](signing-in.md#signing-in-to-your-netdata-cloud-account). - -!!! note "" - We are aware that the process of registering each node individually is cumbersome for those who want to implement Netdata Cloud's features across a large infrastructure. - -``` -Please view [this comment on issue #6318](https://github.com/netdata/netdata/issues/6318#issuecomment-504106329) for how we plan on improving the process for adding additional nodes to your Netdata Cloud account. -``` - -## Services available in the Nodes View - -The following tables elaborate on which services will appear in the Nodes View. Alerts from [other collectors](../../collectors/README.md), when entered an alarm status, will show up in the _Alarms_ tab despite not appearing - -### Databases - -These services will appear under the _Databases_ selector beneath the _Services_ tab. - -| Service | Collectors | Context #1 | Context #2 | Context #3 | -|--- |--- |--- |--- |--- | -| MySQL | `python.d.plugin:mysql`, `go.d.plugin:mysql` | `mysql.queries` | `mysql.net` | `mysql.connections` | -| MariaDB | `python.d.plugin:mysql`, `go.d.plugin:mysql` | `mysql.queries` | `mysql.net` | `mysql.connections` | -| Oracle Database | `python.d.plugin:oracledb` | `oracledb.session_count` | `oracledb.physical_disk_read_writes ` | `oracledb.tablespace_usage_in_percent` | -| PostgreSQL | `python.d.plugin:postgres` | `postgres.checkpointer` | `postgres.archive_wal` | `postgres.db_size` | -| MongoDB | `python.d.plugin:mongodb` | `mongodb.active_clients` | `mongodb.read_operations` | `mongodb.write_operations` | -| ElasticSearch | `python.d.plugin:elasticsearch` | `elastic.search_performance_total` | `elastic.index_performance_total` | `elastic.index_segments_memory` | -| CouchDB | `python.d.plugin:couchdb` | `couchdb.activity` | `couchdb.response_codes` | | -| Proxy SQL | `python.d.plugin:proxysql` | `proxysql.questions` | `proxysql.pool_status` | `proxysql.pool_overall_net` | -| Redis | `python.d.plugin:redis` | `redis.operations` | `redis.net` | `redis.connections` | -| MemCached | `python.d.plugin:memcached` | `memcached.cache` | `memcached.net` | `memcached.connections` | -| RethinkDB | `python.d.plugin:rethinkdbs` | `rethinkdb.cluster_queries` | `rethinkdb.cluster_clients_active` | `rethinkdb.cluster_connected_servers` | -| Solr | `go.d.plugin:solr` | `solr.search_requests` | `solr.update_requests` | | - -### Web services - -These services will appear under the _Web_ selector beneath the _Services_ tab. These also include proxies, load balancers (LB), and streaming services. - -| Service | Collectors | Context #1 | Context #2 | Context #3 | -|--- |--- |--- |--- |--- | -| Apache | `python.d.plugin:apache`, `go.d.plugin:apache` | `apache.requests` | `apache.connections` | `apache.net ` | -| nginx | `python.d.plugin:nginx`, `go.d.plugin:nginx` | `nginx.requests` | `nginx.connections` | | -| nginx+ | `python.d.plugin:nginx_plus` | `nginx_plus.requests_total` | `nginx_plus.connections_statistics` | | -| lighthttpd | `python.d.plugin:lighttpd`, `go.d.plugin:lighttpd` | `lighttpd.requests` | `lighttpd.net` | | -| lighthttpd2 | `go.d.plugin:lighttpd2` | `lighttpd2.requests` | `lighttpd2.traffic` | | -| LiteSpeed | `python.d.plugin:litespeed` | `litespeed.requests` | `litespeed.requests_processing` | | -| Tomcat | `python.d.plugin:tomcat` | `tomcat.accesses` | `tomcat.processing_time` | `tomcat.bandwidth` | -| PHP FPM | `python.d.plugin:phpfm` | `phpfpm.performance` | `phpfpm.requests` | `phpfpm.connections` | -| HAproxy | `python.d.plugin:haproxy` | `haproxy_f.scur` | `haproxy_f.bin` | `haproxy_f.bout` | -| Squid | `python.d.plugin:squid` | `squid.clients_requests` | `squid.clients_net` | | -| Traefik | `python.d.plugin:traefik` | `traefik.response_codes` | | | -| Varnish | `python.d.plugin:varnish` | `varnish.session_connection` | `varnish.client_requests` | | -| IPVS | `proc.plugin:/proc/net/ip_vs_stats` | `ipvs.sockets` | `ipvs.packets` | | -| Web Log | `python.d.plugin:web_log`, `go.d.plugin:web_log` | `web_log.response_codes` | `web_log.bandwidth` | | -| IPFS | `python.d.plugin:ipfs` | `ipfs.bandwidth` | `ipfs.peers` | | -| IceCast Media Streaming | `python.d.plugin:icecast` | `icecast.listeners` | | | -| RetroShare | `python.d.plugin:retroshare` | `retroshare.bandwidth` | `retroshare.peers` | | -| HTTP Check | `python.d.plugin:httpcheck`, `go.d.plugin:httpcheck` | `httpcheck.responsetime` | `httpcheck.status` | | -| x509 Check | `go.d.plugin:x509check` | `x509check.time_until_expiration` | | | - -### Messaging - -These services will appear under the _Messaging_ selector beneath the _Services_ tab. - -| Service | Collectors | Context #1 | Context #2 | Context #3 | -| --- | --- | --- | --- | --- | -| RabbitMQ | `python.d.plugin:rabbitmq`, `go.d.plugin:rabbitmq` | `rabbitmq.queued_messages` | `rabbitmq.erlang_run_queue` | -| Beanstalkd | `python.d.plugin:beanstalk` | `beanstalk.total_jobs_rate` | `beanstalk.connections_rate` | `beanstalk.current_tubes` | - -[](<>) diff --git a/docs/netdata-cloud/signing-in.md b/docs/netdata-cloud/signing-in.md deleted file mode 100644 index 03bcd01c8..000000000 --- a/docs/netdata-cloud/signing-in.md +++ /dev/null @@ -1,157 +0,0 @@ -# Registration and signing in - -To use the features of [Netdata Cloud](README.md), you must first register an account with Netdata Cloud and associate your first Netdata node with the Netdata Cloud [registry](../../registry/README.md). **Netdata Cloud is entirely free for all Netdata users**, and does not store any metrics created by your machines. You keep your data—Netdata Cloud just connects it all together. - -!!! attention "Opting-in to Netdata Cloud" - By [signing in](signing-in.md) to Netdata Cloud, you opt-in to let Netdata Cloud receive and store the information described [here](../../registry/README.md#what-data-does-the-registry-store). We never store the metrics collected by Netdata agents, just machine GUIDs, person GUID, URLs, and account information. - -## Registering a Netdata Cloud account - -There is only one prerequisite to using Netdata Cloud: A working Netdata agent. If you don't have a running Netdata agent yet, check out the [installation guides](../../packaging/installer/) for more information. - -To begin, visit the web dashboard of your Netdata agent by navigating your browser of choice to `http://SERVER-IP:19999`. You’ll see a dashboard much like this: - -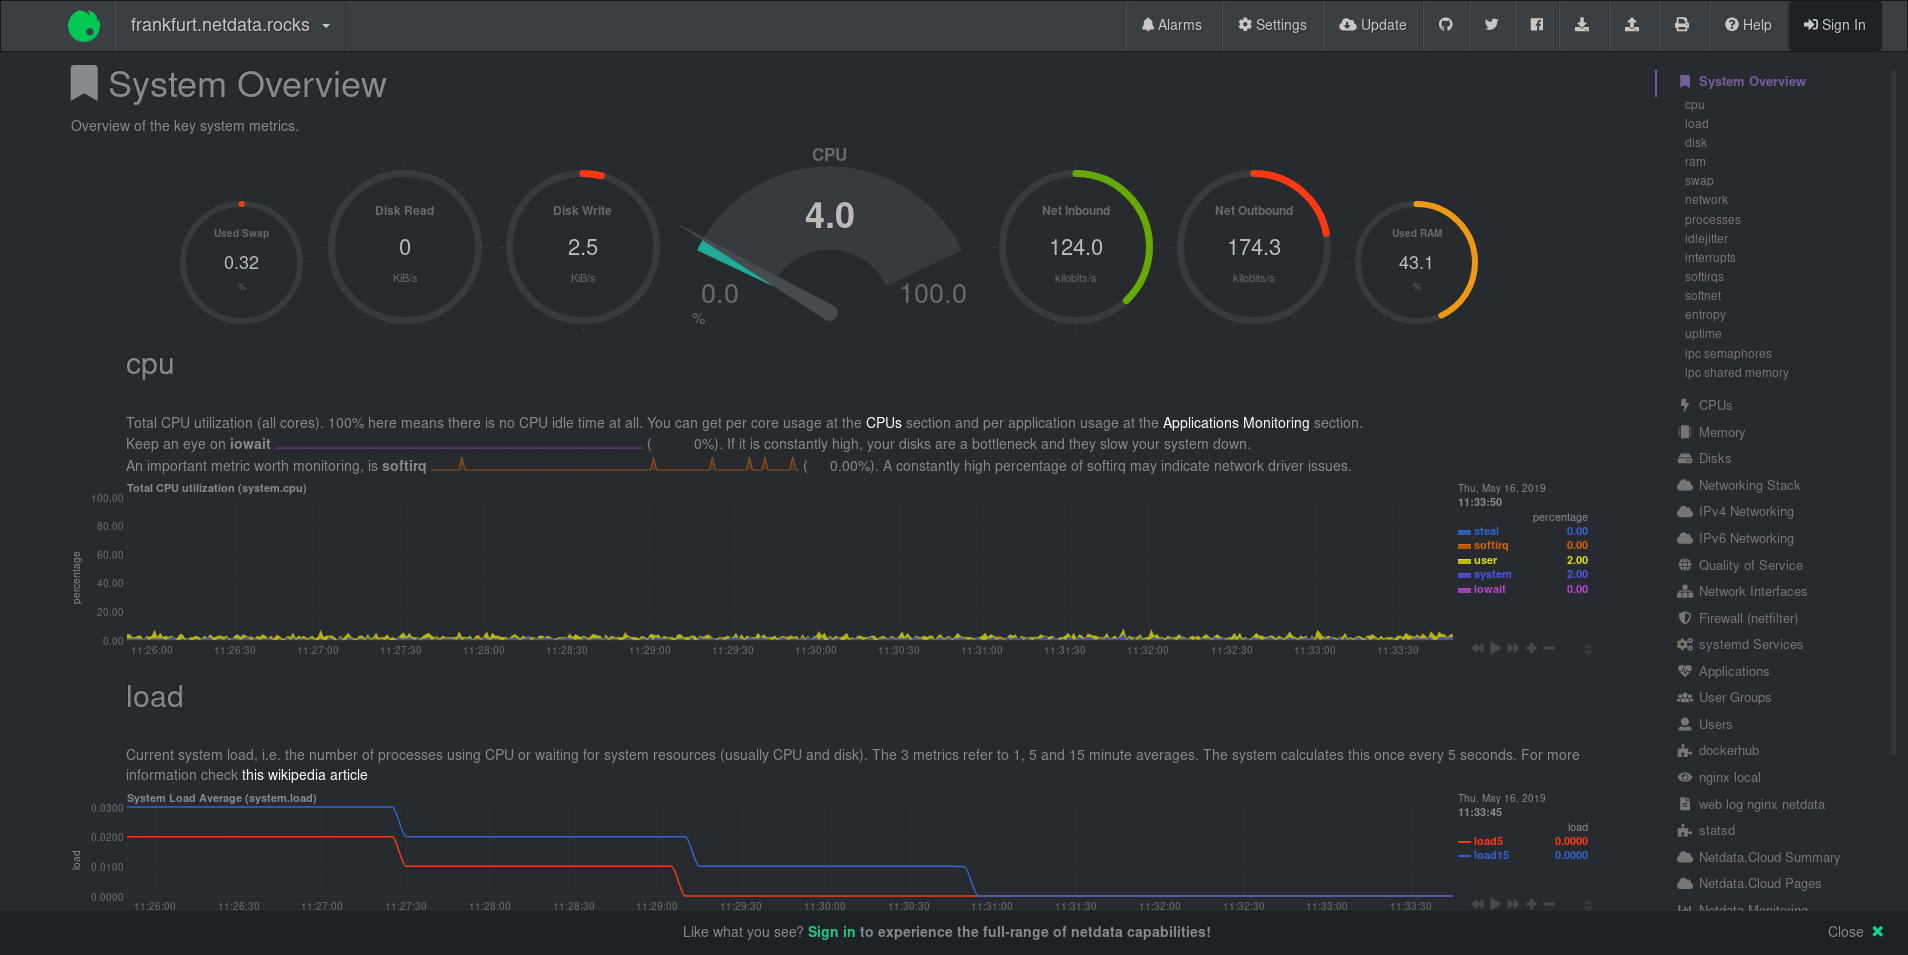 - -From here, you need to register for a Netdata Cloud account. Click on the **Sign in** button on the top-right corner of the dashboard's view. - -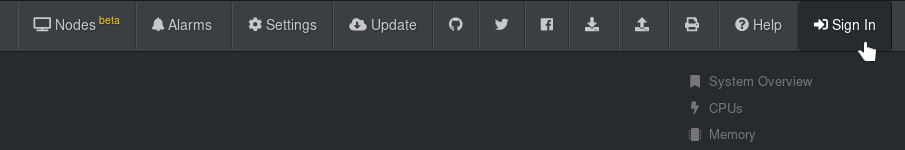 - -??? note "Alternative registration routes" - While we recommend the **Sign in** button, the Netdata dashboard has one other direct route registering for or signing in to a Netdata Cloud account. - -``` -The text **Please sign in to netdata.cloud to view your nodes!** contains a link to access Netdata Cloud. - -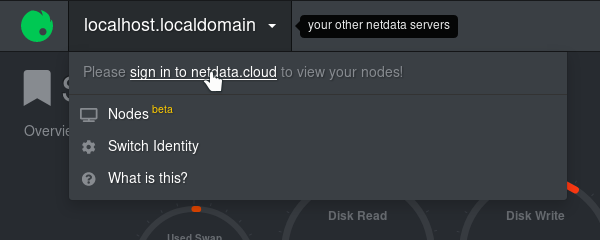 - -Two other routes exist, but they are more directly related to accessing the Nodes View. They will, however, require either registration or sign in and thus are valid routes to access Netdata Cloud. - -One route can be found in the **Nodes Beta** button the left side of the navigation menu: - -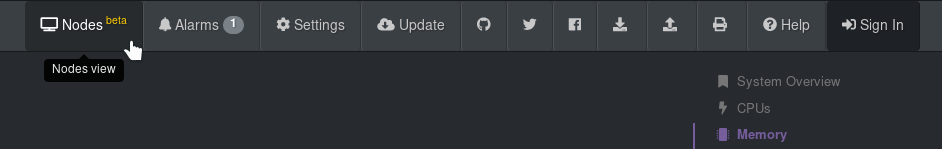 - -A second route can be found in the Nodes List—the drop-down menu in the top-left corner of the Netdata dashboard: - - 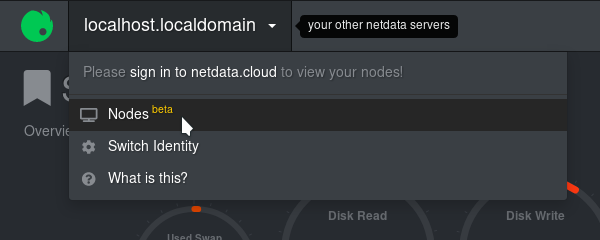 -``` - -??? note "Registration route when using a private registry" - If you're using a private registry, clicking the **Sign in** button will display a modal window warning you about the process of migrating away from your private registry and to Netdata Cloud's registry. - -``` -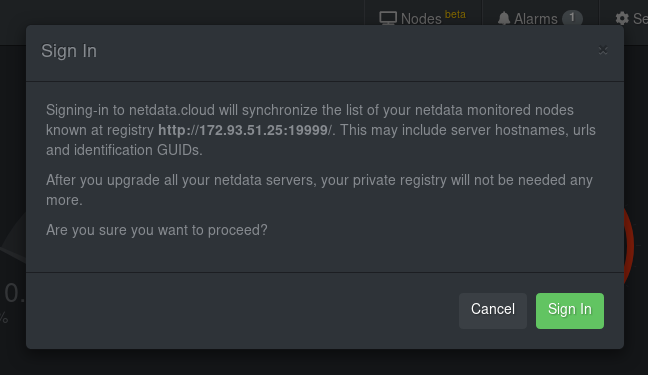 - -If you agree to use Netdata Cloud over your private registry, and opt-in to let Netdata Cloud receive and store the information described [here](../../registry/README.md#what-data-does-the-registry-store), you should click the **Sign in** button again. If not, click the **Cancel** button to continue using your private registry. -``` - -### Choosing your registration or sign in method - -After clicking the **Sign in** button, you'll be directed to the Netdata Cloud registration/sign in page. Choose to authorize with your Google account, GitHub account, or email. - -!!! attention - Be consistent with the sign in method you use, whether GitHub, Google, or email. If you sign in via different methods, the system will create multiple Netdata Cloud accounts, one for each sign-in method used. We plan to offer multiple authentication methods for the same account in the future. - -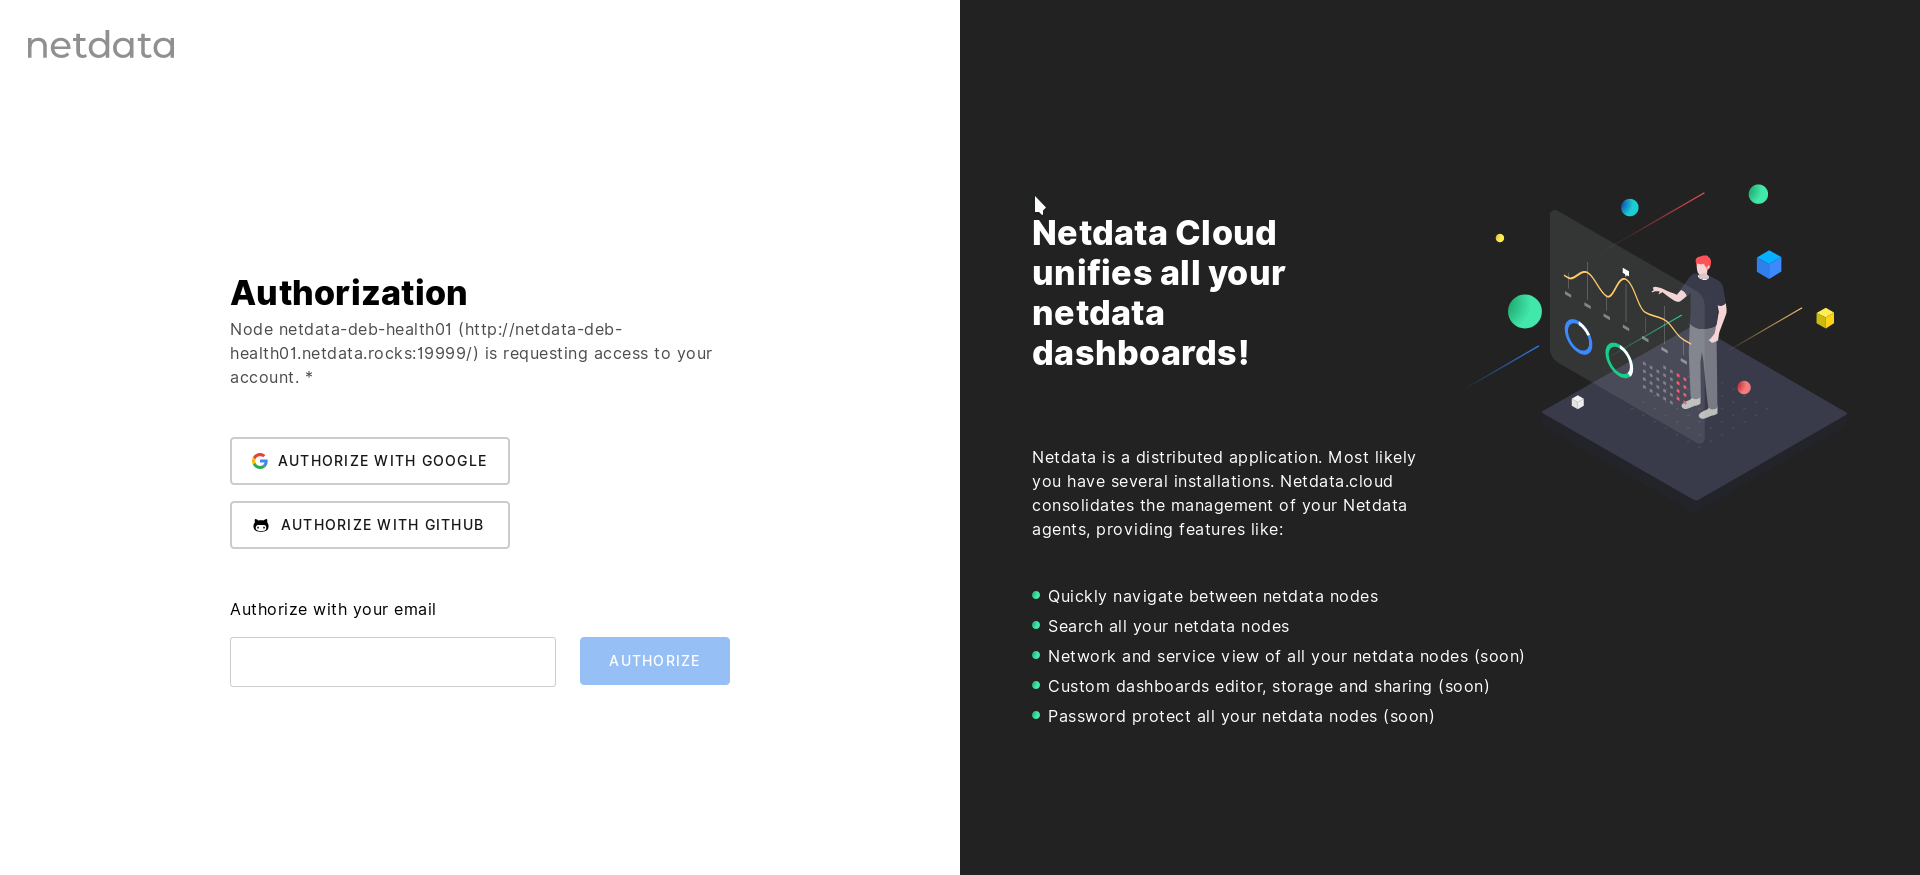 - -### Registration via Google - -Click the **Authorize with Google** button to begin registration. You will be redirected to a Google authentication form where you confirm you will "share your name, email address, language preference, and profile picture with netdata.cloud." - -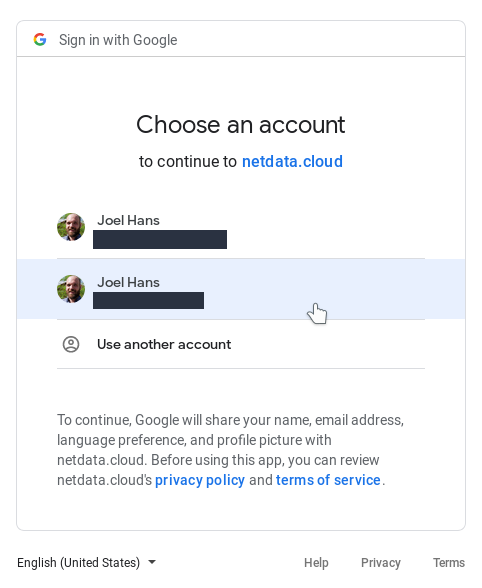 - -Click on the account you would like to connect to Netdata Cloud to continue and then skip down to [Visiting Netdata Cloud for the first time](#visiting-the-nodes-view-for-the-first-time) for further instructions. - -### Registration via GitHub - -Click the **Authorize with GitHub** button to begin registration. You will be redirected to a GitHub authentication form where you confirm to share your email address with Netdata Cloud to create your account. - -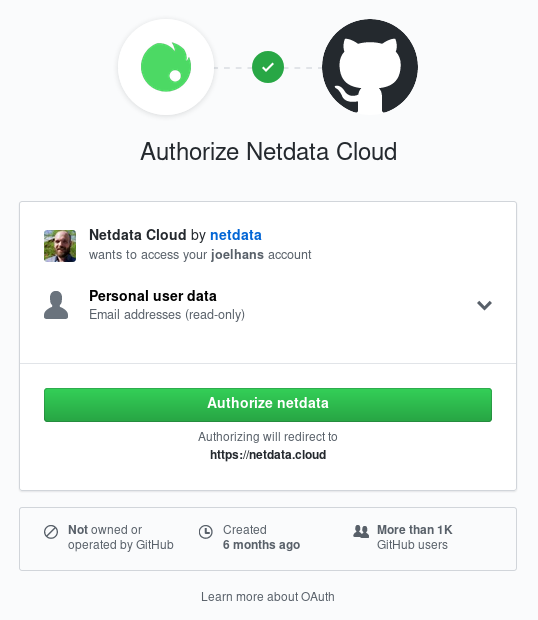 - -Click the **Authorize Netdata** button to continue and then skip down to [Visiting Netdata Cloud for the first time](#visiting-the-nodes-view-for-the-first-time) for further instructions. - -### Registration via email - -Enter your preferred email into the field and click the **Authorize** button. - -Open your email account and check for the verification email—it should arrive in less than a minute. If it doesn't show up, check your spam folder or click the **Resend email** button in the Netdata Cloud interface. - -When the email arrives, open it and click on the green **Sign in** button and then skip down to [Visiting Netdata Cloud for the first time](#visiting-the-nodes-view-for-the-first-time) for further instructions. - -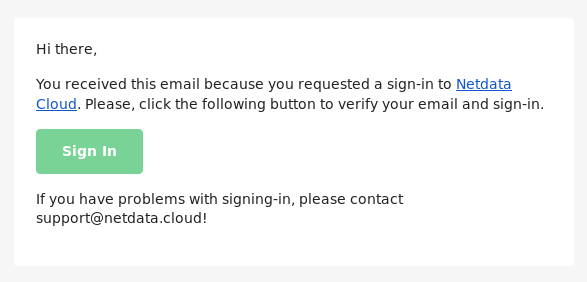 - -## Visiting the Nodes View for the first time - -Regardless of which sign in method you used, you'll now be redirected back to your Netdata agent's dashboard. This node has now been associated with your Netdata Cloud account. Netdata Cloud uses a list of nodes associated with your account to populate the Nodes List dropdown in the dashboard and the Nodes View feature of Netdata Cloud. - -**For more information on how to use the Nodes View, visit the [Nodes View guide](nodes-view.md).** - -## Signing in to your Netdata Cloud account - -The process of signing in to an existing Netdata Cloud account the same as [registering for a new account](#registering-a-netdata-cloud-account). The recommended method is to use the **Sign in** button at the top-right corner of a Netdata nodes's dashboard. Choose the method you used to register for your Netdata Cloud account and complete the process. - - - -## Adding additional nodes to your Netdata Cloud account - -There is currently only one way to associate additional Netdata nodes with your Netdata Cloud account: You must visit the web dashboard for each node and click the **Sign in** button and complete the [sign in process](#signing-in-to-your-netdata-cloud-account). - -!!! note "" - We are aware that the process of registering each node individually is cumbersome for those who want to implement Netdata Cloud's features across a large infrastructure. - -``` -Please view [this comment on issue #6318](https://github.com/netdata/netdata/issues/6318#issuecomment-504106329) for how we plan on improving the process for adding additional nodes to your Netdata Cloud account. -``` - -## Private registries and Netdata Cloud - -If you use a [private registry](../../registry/README.md#run-your-own-registry), and sign in to Netdata Cloud, you'll be using the Netdata Cloud registry in addition to your private registry. - -Clicking the **Sign in** button on the Netdata dashboard will display a modal window warning you about the synchronization of your private registry's entries to the Netdata Cloud's registry. - -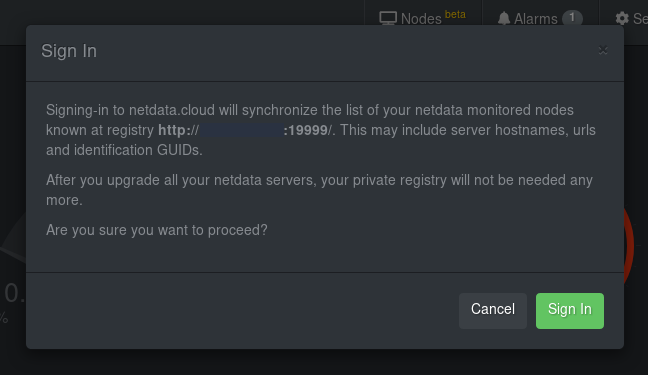 - -If your company's data policies don't allow storing information about your nodes on the Netdata Cloud registry, you should click the **Cancel** button and continue using your private registry. You'll be able to access the Nodes List in the top-left corner of a Netdata dashboard, but you won't be able to use the [Nodes View](nodes-view.md) feature within Netdata Cloud, or any of the [additional features](https://blog.netdata.cloud/posts/netdata-cloud-announcement/#what-features-will-netdata-cloud-offer) on our roadmap. You can also sign up for the waiting list for the [hosted and/or on-premises versions of Netdata Cloud](README.md#running-netdata-cloud-on-premises-or-as-a-hosted-instance) that we're working on. - -If you agree to use Netdata Cloud over your private registry, and opt-in to let Netdata Cloud receive and store the information described [here](../../registry/README.md#what-data-does-the-registry-store), you should click the **Sign in** button again to continue the registration/sign in process. - -### Returning to your private registry - -If you register for or sign in to Netdata Cloud from a node previously associated with a private registry, you can easily return to your private registry by signing out. - -You can sign out in two ways: - -1. **From a node's dashboard**: In the top-right corner you will find a dropdown menu with your email address. Click that and then click the **Sign Out** button. -2. **From Netdata Cloud**: Click on your profile picture in the top-right corner and then click on the **Sign Out** button. - -Signing out from Netdata Cloud and returning to your private registry *does not remove* the [information stored](../../registry/README.md#what-data-does-the-registry-store) about your nodes or account details. - -But, upon signout, your Nodes List on all dashboards will once more be populated by your private registry and not Netdata Cloud. - -<!-- ## The 'Synchronize with Netdata Cloud' button - -Once signed in to Netdata Cloud, the Nodes List dropdown will now show a button labeled `Synchronize with netdata.cloud`. - -The `Synchronize with Netdata Cloud` button is a migration (or import) tool for Netdata Cloud. If either the public or your private registry contains a list of nodes associated with your `person_guid`, it will import them into Netdata Cloud and associate them with the `accounts` information in the Netdata Cloud registry. - -When you click the `Synchronize with netdata.cloud` button, you will receive one of two popup messages based on whether you were using the public registry (at `registry.my-netdata.io`) or a private registry. - -**Public registry**: - -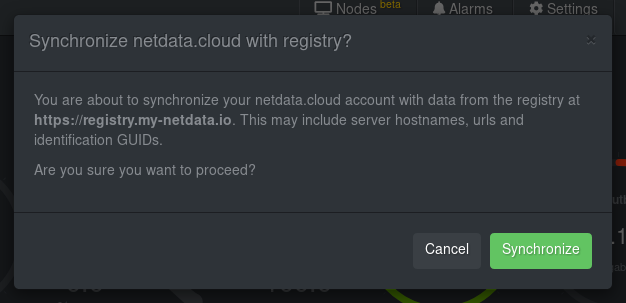 - -**Private registry**: - -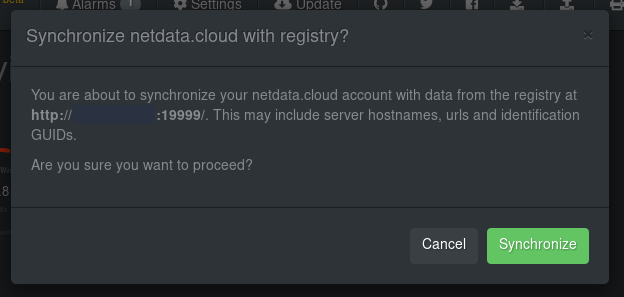 - -If you do not want to synchronize your registry of choice with Netdata Cloud, click `Cancel`. - -If you do, click `Synchronize`. This will push GUIDs, hostnames, and URLs to Netdata Cloud's registry. - -Now, when you visit the Nodes View, you will be able to see all the nodes that were once associated with the public/private registry you were using previously. --> - -## What's next? - -Learn how to use the [Nodes View](nodes-view.md) to monitor many nodes concurrently. - -[](<>) diff --git a/docs/netdata-for-IoT.md b/docs/netdata-for-IoT.md index 7a991c26d..77b95229f 100644 --- a/docs/netdata-for-IoT.md +++ b/docs/netdata-for-IoT.md @@ -1,34 +1,67 @@ +<!-- +title: "Netdata for IoT" +custom_edit_url: https://github.com/netdata/netdata/edit/master/docs/netdata-for-IoT.md +--> + # Netdata for IoT  > New to Netdata? Check its demo: **<https://my-netdata.io/>** > -> [](https://registry.my-netdata.io/#netdata_registry) [](https://registry.my-netdata.io/#netdata_registry) [](https://registry.my-netdata.io/#netdata_registry) +>[](https://registry.my-netdata.io/#netdata_registry) +>[](https://registry.my-netdata.io/#netdata_registry) +>[](https://registry.my-netdata.io/#netdata_registry) > -> [](https://registry.my-netdata.io/#netdata_registry) [](https://registry.my-netdata.io/#netdata_registry) [](https://registry.my-netdata.io/#netdata_registry) +>[](https://registry.my-netdata.io/#netdata_registry) +>[](https://registry.my-netdata.io/#netdata_registry) +>[](https://registry.my-netdata.io/#netdata_registry) --- -Netdata is a **very efficient** server performance monitoring solution. When running in server hardware, it can collect thousands of system and application metrics **per second** with just 1% CPU utilization of a single core. Its web server responds to most data requests in about **half a millisecond** making its web dashboards spontaneous, amazingly fast! +Netdata is a **very efficient** server performance monitoring solution. When running in server hardware, it can collect +thousands of system and application metrics **per second** with just 1% CPU utilization of a single core. Its web server +responds to most data requests in about **half a millisecond** making its web dashboards spontaneous, amazingly fast! -Netdata can also be a very efficient real-time monitoring solution for **IoT devices** (RPIs, routers, media players, wifi access points, industrial controllers and sensors of all kinds). Netdata will generally run everywhere a Linux kernel runs (and it is glibc and [musl-libc](https://www.musl-libc.org/) friendly). +Netdata can also be a very efficient real-time monitoring solution for **IoT devices** (RPIs, routers, media players, +wifi access points, industrial controllers and sensors of all kinds). Netdata will generally run everywhere a Linux +kernel runs (and it is glibc and [musl-libc](https://www.musl-libc.org/) friendly). -You can use it as both a data collection agent (where you pull data using its API), for embedding its charts on other web pages / consoles, but also for accessing it directly with your browser to view its dashboard. +You can use it as both a data collection agent (where you pull data using its API), for embedding its charts on other +web pages / consoles, but also for accessing it directly with your browser to view its dashboard. -The Netdata web API already provides **reduce** functions allowing it to report **average** and **max** for any timeframe. It can also respond in many formats including JSON, JSONP, CSV, HTML. Its API is also a **google charts** provider so it can directly be used by google sheets, google charts, google widgets. +The Netdata web API already provides **reduce** functions allowing it to report **average** and **max** for any +timeframe. It can also respond in many formats including JSON, JSONP, CSV, HTML. Its API is also a **google charts** +provider so it can directly be used by google sheets, google charts, google widgets.  -Although Netdata has been significantly optimized to lower the CPU and RAM resources it consumes, the plethora of data collection plugins may be inappropriate for weak IoT devices. Please follow the guide on [running Netdata in embedded devices](Performance.md) +Although Netdata has been significantly optimized to lower the CPU and RAM resources it consumes, the plethora of data +collection plugins may be inappropriate for weak IoT devices. Please follow the [Netdata Agent performance +guide](/docs/guides/configure/performance.md) ## Monitoring RPi temperature -The python version of the sensors plugin uses `lm-sensors`. Unfortunately the temperature reading of RPi are not supported by `lm-sensors`. +The python version of the sensors plugin uses `lm-sensors`. Unfortunately the temperature reading of RPi are not +supported by `lm-sensors`. + +Netdata also has a bash version of the sensors plugin that can read RPi temperatures. It is disabled by default to avoid +the conflicts with the python version. -Netdata also has a bash version of the sensors plugin that can read RPi temperatures. It is disabled by default to avoid the conflicts with the python version. +To enable it, run: + +```bash +cd /etc/netdata # Replace this path with your Netdata config directory +sudo ./edit-config charts.d.conf +``` -To enable it, run `sudo edit-config charts.d.conf` and uncomment this line: +and uncomment this line: ```sh sensors=force diff --git a/docs/netdata-security.md b/docs/netdata-security.md index 50d91df04..50c6b0548 100644 --- a/docs/netdata-security.md +++ b/docs/netdata-security.md @@ -1,3 +1,8 @@ +<!-- +title: "Security design" +custom_edit_url: https://github.com/netdata/netdata/edit/master/docs/netdata-security.md +--> + # Security design We have given special attention to all aspects of Netdata, ensuring that everything throughout its operation is as secure as possible. Netdata has been designed with security in mind. @@ -19,7 +24,7 @@ We have given special attention to all aspects of Netdata, ensuring that everyth Netdata collects raw data from many sources. For each source, Netdata uses a plugin that connects to the source (or reads the relative files produced by the source), receives raw data and processes them to calculate the metrics shown on Netdata dashboards. -Even if Netdata plugins connect to your database server, or read your application log file to collect raw data, the product of this data collection process is always a number of **chart metadata and metric values** (summarized data for dashboard visualization). All Netdata plugins (internal to the Netdata daemon, and external ones written in any computer language), convert raw data collected into metrics, and only these metrics are stored in Netdata databases, sent to upstream Netdata servers, or archived to backend time-series databases. +Even if Netdata plugins connect to your database server, or read your application log file to collect raw data, the product of this data collection process is always a number of **chart metadata and metric values** (summarized data for dashboard visualization). All Netdata plugins (internal to the Netdata daemon, and external ones written in any computer language), convert raw data collected into metrics, and only these metrics are stored in Netdata databases, sent to upstream Netdata servers, or archived to external time-series databases. > The **raw data** collected by Netdata, do not leave the host they are collected. **The only data Netdata exposes are chart metadata and metric values.** @@ -33,7 +38,10 @@ There are a few cases however that raw source data are only exposed to processes So, Netdata **plugins**, even those running with escalated capabilities or privileges, perform a **hard coded data collection job**. They do not accept commands from Netdata. The communication is strictly **unidirectional**: from the plugin towards the Netdata daemon. The original application data collected by each plugin do not leave the process they are collected, are not saved and are not transferred to the Netdata daemon. The communication from the plugins to the Netdata daemon includes only chart metadata and processed metric values. -Netdata slaves streaming metrics to upstream Netdata servers, use exactly the same protocol local plugins use. The raw data collected by the plugins of slave Netdata servers are **never leaving the host they are collected**. The only data appearing on the wire are chart metadata and metric values. This communication is also **unidirectional**: slave Netdata servers never accept commands from master Netdata servers. +Child nodes use the same protocol when streaming metrics to their parent nodes. The raw data collected by the plugins of +child Netdata servers are **never leaving the host they are collected**. The only data appearing on the wire are chart +metadata and metric values. This communication is also **unidirectional**: child nodes never accept commands from +parent Netdata servers. ## Netdata is read-only @@ -74,7 +82,7 @@ You can bind Netdata to multiple IPs and ports. If you use hostnames, Netdata wi For cloud based installations, if your cloud provider does not provide such a private LAN (or if you use multiple providers), you can create a virtual management and administration LAN with tools like `tincd` or `gvpe`. These tools create a mesh VPN allowing all servers to communicate securely and privately. Your administration stations join this mesh VPN to get access to management and administration tasks on all your cloud servers. -For `gvpe` we have developed a [simple provisioning tool](https://github.com/netdata/netdata-demo-site/tree/master/gvpe) you may find handy (it includes statically compiled `gvpe` binaries for Linux and FreeBSD, and also a script to compile `gvpe` on your Mac). We use this to create a management and administration LAN for all Netdata demo sites (spread all over the internet using multiple hosting providers). +For `gvpe` we have developed a [simple provisioning tool](https://github.com/netdata/netdata-demo-site/tree/master/gvpe) you may find handy (it includes statically compiled `gvpe` binaries for Linux and FreeBSD, and also a script to compile `gvpe` on your macOS system). We use this to create a management and administration LAN for all Netdata demo sites (spread all over the internet using multiple hosting providers). --- @@ -86,7 +94,7 @@ In Netdata v1.9+ there is also access list support, like this: allow connections from = localhost 10.* 192.168.* ``` -#### Fine-grainined access control +#### Fine-grained access control The access list support allows filtering of all incoming connections, by specific IP addresses, ranges or validated DNS lookups. Only connections that match an entry on the list will be allowed: @@ -97,7 +105,7 @@ or validated DNS lookups. Only connections that match an entry on the list will ``` Connections from the IP addresses are allowed if the connection IP matches one of the patterns given. -The alias localhost is alway checked against 127.0.0.1, any other symbolic names need to resolve in +The alias localhost is always checked against 127.0.0.1, any other symbolic names need to resolve in both directions using DNS. In the above example the IP address of `homeip.net` must reverse DNS resolve to the incoming IP address and a DNS lookup on `homeip.net` must return the incoming IP address as one of the resolved addresses. @@ -123,7 +131,7 @@ to IP addresses within the `160.1.x.x` range and that reverse DNS is setup for t #### Use an authenticating web server in proxy mode -Use one web server to provide authentication in front of **all your Netdata servers**. So, you will be accessing all your Netdata with URLs like `http://{HOST}/netdata/{NETDATA_HOSTNAME}/` and authentication will be shared among all of them (you will sign-in once for all your servers). Instructions are provided on how to set the proxy configuration to have Netdata run behind [nginx](Running-behind-nginx.md), [Apache](Running-behind-apache.md), [lighthttpd](Running-behind-lighttpd.md) and [Caddy](Running-behind-caddy.md). +Use one web server to provide authentication in front of **all your Netdata servers**. So, you will be accessing all your Netdata with URLs like `http://{HOST}/netdata/{NETDATA_HOSTNAME}/` and authentication will be shared among all of them (you will sign-in once for all your servers). Instructions are provided on how to set the proxy configuration to have Netdata run behind [nginx](Running-behind-nginx.md), [Apache](Running-behind-apache.md), [lighttpd](Running-behind-lighttpd.md) and [Caddy](Running-behind-caddy.md). To use this method, you should firewall protect all your Netdata servers, so that only the web server IP will allowed to directly access Netdata. To do this, run this on each of your servers (or use your firewall manager): @@ -183,28 +191,29 @@ Of course, there are many more methods you could use to protect Netdata: - If you are always under a static IP, you can use the script given above to allow direct access to your Netdata servers without authentication, from all your static IPs. -- install all your Netdata in **headless data collector** mode, forwarding all metrics in real-time to a master Netdata server, which will be protected with authentication using an nginx server running locally at the master Netdata server. This requires more resources (you will need a bigger master Netdata server), but does not require any firewall changes, since all the slave Netdata servers will not be listening for incoming connections. +- install all your Netdata in **headless data collector** mode, forwarding all metrics in real-time to a parent + Netdata server, which will be protected with authentication using an nginx server running locally at the parent + Netdata server. This requires more resources (you will need a bigger parent Netdata server), but does not require + any firewall changes, since all the child Netdata servers will not be listening for incoming connections. ## Anonymous Statistics ### Registry or how to not send any information to a third party server -The default configuration uses a public registry under registry.my-netdata.io (more information about the registry here: [mynetdata-menu-item](../registry/) ). Please be aware that if you use that public registry, you submit the following information to a third party server: +The default configuration uses a public registry under registry.my-netdata.io (more information about the registry here: [mynetdata-menu-item](/registry/README.md) ). Please be aware that if you use that public registry, you submit the following information to a third party server: -- The url where you open the web-ui in the browser (via http request referer) +- The url where you open the web-ui in the browser (via http request referrer) - The hostnames of the Netdata servers -If sending this information to the central Netdata registry violates your security policies, you can configure Netdat to [run your own registry](../registry/#run-your-own-registry). - -### Opt out of anonymous statistics - -Starting with v1.12 Netdata also collects [anonymous statistics](anonymous-statistics.md) on certain events for: +If sending this information to the central Netdata registry violates your security policies, you can configure Netdat to [run your own registry](/registry/README.md#run-your-own-registry). -1. **Quality assurance**, to help us understand if Netdata behaves as expected and help us identify repeating issues for certain distributions or environments. +### Opt-out of anonymous statistics -2. **Usage statistics**, to help us focus on the parts of Netdata that are used the most, or help us identify the extent our development decisions influence the community. +Starting with v1.12, Netdata collects anonymous usage information by default and sends it to Google Analytics. Read +about the information collected, and learn how to-opt, on our [anonymous statistics](anonymous-statistics.md) page. -To opt-out from sending anonymous statistics, you can create a file called `.opt-out-from-anonymous-statistics` under the user configuration directory (usually `/etc/netdata`). +The usage statistics are _vital_ for us, as we use them to discover bugs and prioritize new features. We thank you for +_actively_ contributing to Netdata's future. ## Netdata directories diff --git a/docs/overview/netdata-monitoring-stack.md b/docs/overview/netdata-monitoring-stack.md new file mode 100644 index 000000000..1504d5f2b --- /dev/null +++ b/docs/overview/netdata-monitoring-stack.md @@ -0,0 +1,62 @@ +<!-- +title: "Use Netdata standalone or as part of your monitoring stack" +description: "Netdata can run independently or as part of a larger monitoring stack thanks to its flexibility, interoperable core, and exporting features." +custom_edit_url: https://github.com/netdata/netdata/edit/master/docs/overview/netdata-monitoring-stack.md +--> + +# Use Netdata standalone or as part of your monitoring stack + +Netdata is an extremely powerful monitoring, visualization, and troubleshooting platform. While you can use it as an +effective standalone tool, we also designed it to be open and interoperable with other tools you might already be using. + +Netdata helps you collect everything and scales to infrastructure of any size, but it doesn't lock-in data or force you +to use specific tools or methodologies. Each feature is extensible and interoperable so they can work in parallel with +other tools. For example, you can use Netdata to collect metrics, visualize metrics with a second open-source program, +and centralize your metrics in a cloud-based time-series database solution for long-term storage or further analysis. + +You can build a new monitoring stack, including Netdata, or integrate Netdata's metrics with your existing monitoring +stack. No matter which route you take, Netdata helps you monitor infrastructure of any size. + +Here are a few ways to enrich your existing monitoring and troubleshooting stack with Netdata: + +## Collect metrics from Prometheus endpoints + +Netdata automatically detects 600 popular endpoints and collects per-second metrics from them via the [generic +Prometheus collector](https://learn.netdata.cloud/docs/agent/collectors/go.d.plugin/modules/prometheus). This even +includes support for Windows 10 via [`windows_exporter`](https://github.com/prometheus-community/windows_exporter). + +This collector is installed and enabled on all Agent installations by default, so you don't need to waste time +configuring Netdata. Netdata will detect these Prometheus metrics endpoints and collect even more granular metrics than +your existing solutions. You can now use all of Netdata's meaningfully-visualized charts to diagnose issues and +troubleshoot anomalies. + +## Export metrics to external time-series databases + +Netdata can send its per-second metrics to external time-series databases, such as InfluxDB, Prometheus, Graphite, +TimescaleDB, ElasticSearch, AWS Kinesis Data Streams, Google Cloud Pub/Sub Service, and many others. + +To [export metrics to external time-series databases](/docs/export/external-databases.md), you configure an [exporting +_connector_](/docs/export/enable-connector.md). These connectors support filtering and resampling for granular control +over which metrics you export, and at what volume. You can export resampled metrics as collected, as averages, or the +sum of interpolated values based on your needs and other monitoring tools. + +Once you have Netdata's metrics in a secondary time-series database, you can use them however you'd like, such as +additional visualization/dashboarding tools or aggregation of data from multiple sources. + +## Visualize metrics with Grafana + +One popular monitoring stack is Netdata, Graphite, and Grafana. Netdata acts as the stack's metrics collection +powerhouse, Graphite the time-series database, and Grafana the visualization platform. With Netdata at the core, you can +be confident that your monitoring stack is powered by all possible metrics, from all possible sources, from every node +in your infrastructure. + +Of course, just because you export or visualize metrics elsewhere, it doesn't mean Netdata's equivalent features +disappear. You can always build new dashboards in Netdata Cloud, drill down into per-second metrics using Netdata's +charts, or use Netdata's health watchdog to send notifications whenever an anomaly strikes. + +## What's next? + +Whether you're using Netdata standalone or as part of a larger monitoring stack, the next step is the same: [**Get +Netdata**](/docs/get/README.md). + +[](<>) diff --git a/docs/overview/what-is-netdata.md b/docs/overview/what-is-netdata.md new file mode 100644 index 000000000..8ee0db410 --- /dev/null +++ b/docs/overview/what-is-netdata.md @@ -0,0 +1,76 @@ +<!-- +title: "What is Netdata?" +description: "Netdata is distributed, real-time performance and health monitoring for systems and applications on a single node or an entire infrastructure." +custom_edit_url: https://github.com/netdata/netdata/edit/master/docs/overview/what-is-netdata.md +--> + +# What is Netdata? + +Netdata helps sysadmins, SREs, DevOps engineers, and IT professionals collect all possible metrics from systems and +applications, visualize these metrics in real-time, and troubleshoot complex performance problems. + +Netdata's solution uses two components, the Netdata Agent and Netdata Cloud, to deliver real-time performance and health +monitoring for both single nodes and entire infrastructure. + +## Netdata Agent + +Netdata's distributed monitoring Agent collects thousands of metrics from systems, hardware, and applications with zero +configuration. It runs permanently on all your physical/virtual servers, containers, cloud deployments, and edge/IoT +devices. + +You can [install](/docs/get/README.md#install-the-netdata-agent) Netdata on most Linux distributions (Ubuntu, Debian, +CentOS, and more), container/microservice platforms (Kubernetes clusters, Docker), and many other operating systems +(FreeBSD, macOS), with no `sudo` required. + +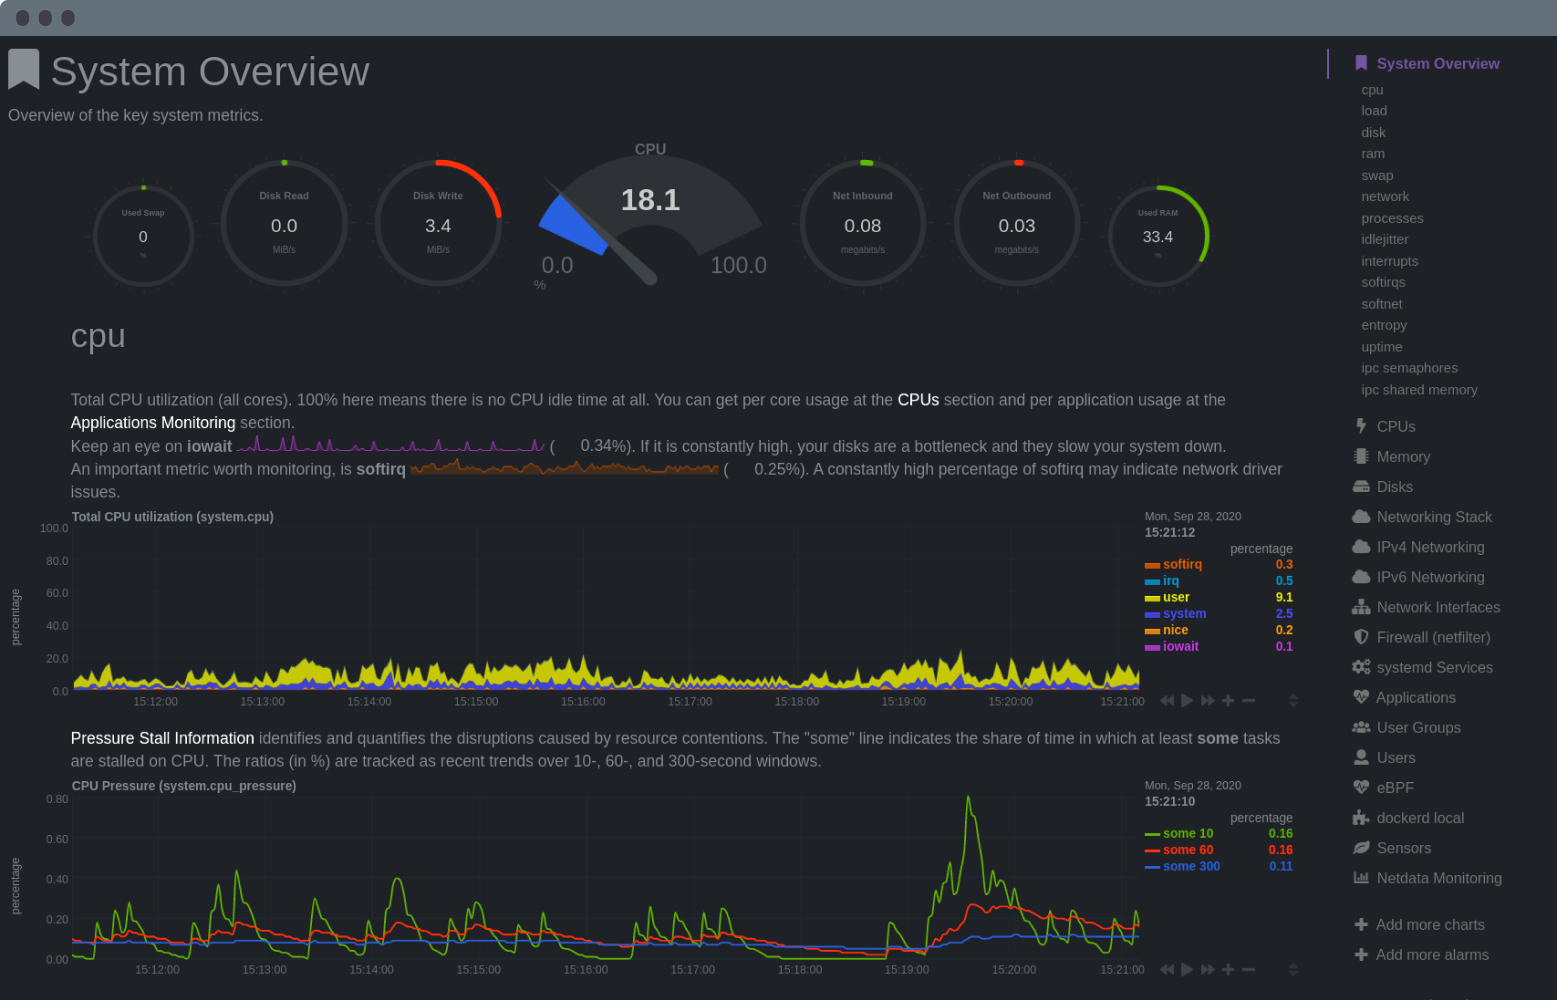 + +## Netdata Cloud + +Netdata Cloud is a web application that gives you real-time visibility for your entire infrastructure. With Netdata +Cloud, you can view key metrics, insightful charts, and active alarms from all your nodes in a single web interface. +When an anomaly strikes, seamlessly navigate to any node to troubleshoot and discover the root cause with the familiar +Netdata dashboard. + +**[Netdata Cloud is +free](https://learn.netdata.cloud/docs/cloud/faq-glossary#how-much-does-netdata-cost-how-and-why-is-it-free)**! You can +add an entire infrastructure of nodes, invite all your colleagues, and visualize any number of metrics, charts, and +alarms entirely for free. + +While Netdata Cloud offers a centralized method of monitoring your Agents, your metrics data is not stored or +centralized in any way. Metrics data remains with your nodes and is only streamed to your browser, through Cloud, when +you're viewing the Netdata Cloud interface. + +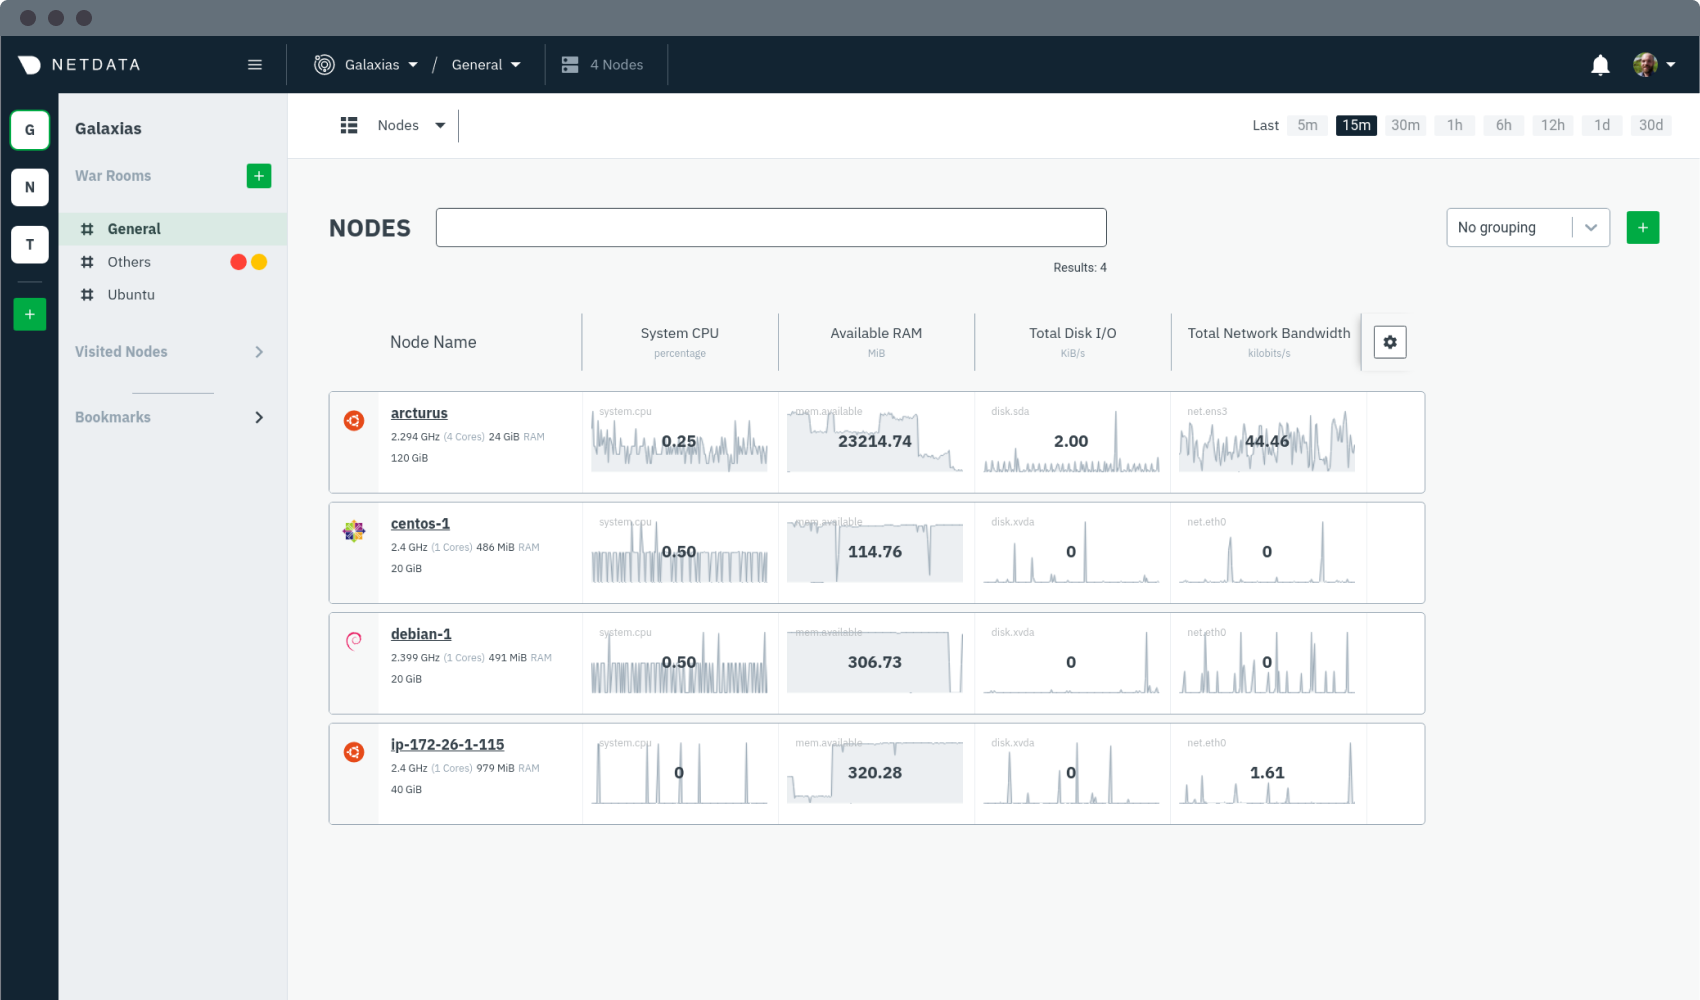 + +## What you can do with Netdata + +Netdata is designed to be both simple to use and flexible for every monitoring, visualization, and troubleshooting use +case: + +- **Collect**: Netdata collects all available metrics from your system and applications with 300+ collectors, + Kubernetes service discovery, and in-depth container monitoring, all while using only 1% CPU and a few MB of RAM. It + even collects metrics from Windows machines. +- **Visualize**: The dashboard meaningfully presents charts to help you understand the relationships between your + hardware, operating system, running apps/services, and the rest of your infrastructure. Add nodes to Netdata Cloud + for a complete view of your infrastructure from a single pane of glass. +- **Monitor**: Netdata's health watchdog uses hundreds of preconfigured alarms to notify you via Slack, email, + PagerDuty and more when an anomaly strikes. Customize with dynamic thresholds, hysteresis, alarm templates, and + role-based notifications. +- **Troubleshoot**: 1s granularity helps you detect analyze anomalies other monitoring platforms might have missed. + Interactive visualizations reduce your reliance on the console, and historical metrics help you trace issues back to + their root cause. +- **Store**: Netdata's efficient database engine efficiently stores per-second metrics for days, weeks, or even + months. Every distributed node stores metrics locally, simplifying deployment, slashing costs, and enriching + Netdata's interactive dashboards. +- **Export**: Integrate per-second metrics with other time-series databases like Graphite, Prometheus, InfluxDB, + TimescaleDB, and more with Netdata's interoperable and extensible core. +- **Stream**: Aggregate metrics from any number of distributed nodes in one place for in-depth analysis, including + ephemeral nodes in a Kubernetes cluster. + +## What's next? + +Learn more about [why you should use Netdata](/docs/overview/why-netdata.md), or [how Netdata works with your existing +monitoring stack](/docs/overview/netdata-monitoring-stack.md). + +[](<>) diff --git a/docs/overview/why-netdata.md b/docs/overview/why-netdata.md new file mode 100644 index 000000000..27a30a4c6 --- /dev/null +++ b/docs/overview/why-netdata.md @@ -0,0 +1,63 @@ +<!-- +title: "Why use Netdata?" +description: "Netdata is simple to deploy, scalable, and optimized for troubleshooting. Cut the complexity and expense out of your monitoring stack." +custom_edit_url: https://github.com/netdata/netdata/edit/master/docs/overview/why-netdata.md +--> + +# Why use Netdata? + +Netdata takes a different approach to helping people build extraordinary infrastructure. It was built out of frustration +with existing monitoring tools that are too complex, too expensive, and don't help their users actually troubleshoot +complex performance and health issues. + +Netdata is: + +## Simple to deploy + +- **One-line deployment** for Linux distributions, plus support for Kubernetes/Docker infrastructures. +- **Zero configuration and maintenance** required to collect thousands of metrics, every second, from the underlying + OS and running applications. +- **Prebuilt charts and alarms** alert you to common anomalies and performance issues without manual configuration. +- **Distributed storage** to simplify the cost and complexity of storing metrics data from any number of nodes. + +## Powerful and scalable + +- **1% CPU utilization, a few MB of RAM, and minimal disk I/O** to run the monitoring Agent on bare metal, virtual + machines, containers, and even IoT devices. +- **Per-second granularity** for an unlimited number of metrics based on the hardware and applications you're running + on your nodes. +- **Interoperable exporters** let you connect Netdata's per-second metrics with an existing monitoring stack and other + time-series databases. + +## Optimized for troubleshooting + +- **Visual anomaly detection** with a UI/UX that emphasizes the relationships between charts. +- **Customizable dashboards** to pinpoint correlated metrics, respond to incidents, and help you streamline your + workflows. +- **Distributed metrics in a centralized interface** to assist users or teams trace complex issues between distributed + nodes. + +## Comparison with other monitoring solutions + +Netdata offers many benefits over the existing monitoring landscape, whether they're expensive SaaS products or other +open-source tools. + +| Netdata | Others (open-source and commercial) | +| :-------------------------------------------------------------- | :--------------------------------------------------------------- | +| **High resolution metrics** (1s granularity) | Low resolution metrics (10s granularity at best) | +| Collects **thousands of metrics per node** | Collects just a few metrics | +| Fast UI optimized for **anomaly detection** | UI is good for just an abstract view | +| **Long-term, autonomous storage** at one-second granularity | Centralized metrics in an expensive data lake at 10s granularity | +| **Meaningful presentation**, to help you understand the metrics | You have to know the metrics before you start | +| Install and get results **immediately** | Long sales process and complex installation process | +| Use it for **troubleshooting** performance problems | Only gathers _statistics of past performance_ | +| **Kills the console** for tracing performance issues | The console is always required for troubleshooting | +| Requires **zero dedicated resources** | Require large dedicated resources | + +## What's next? + +Whether you already have a monitoring stack you want to integrate Netdata into, or are building something from the +ground-up, you should read more on how Netdata can work either [standalone or as an interoperable part of a monitoring +stack](/docs/overview/netdata-monitoring-stack.md). + +[](<>) diff --git a/docs/privacy-policy.md b/docs/privacy-policy.md index 4f1c74598..0152b0e0f 100644 --- a/docs/privacy-policy.md +++ b/docs/privacy-policy.md @@ -1,3 +1,8 @@ +<!-- +title: "Privacy Policy" +custom_edit_url: https://github.com/netdata/netdata/edit/master/docs/privacy-policy.md +--> + # Privacy Policy ## 1. Preamble @@ -54,7 +59,7 @@ same view. The global registry keeps track of 4 entities: For _persons/accounts_ and _machines_, the registry keeps links to _URLs_, each link with 2 timestamps (first time seen, last time seen) and a counter (number of times it has been seen). _machines_, _persons_, and timestamps are stored in the Netdata registry regardless of whether you sign in or not. -If sending this information is against your policies, you can [run your own registry](../registry/#run-your-own-registry). +If sending this information is against your policies, you can [run your own registry](/registry/README.md#run-your-own-registry). Note that ND versions with the 'Sign in' feature of the ND Cloud do not use the global registry. ND Cloud: When you sign up to obtain a user account via the 'Sign in' link on the ND agent user interface, ND is granted access to personal information in the user profile of the authentication provider you choose (e.g. GitHub or Google). ND collects and uses this personal information pursuant to its legitimate interest in establishing and maintaining your account providing you with the features we provide Registered Users. We may use your email address to contact you regarding changes to this policy or other applicable policies. The login name or email address of your profile may be used to attribute you in connection with any content you submit to any Service. @@ -74,7 +79,7 @@ The statistics calculated from this information are used for: 2. **Usage statistics**, to help us focus on the parts of Netdata that are used the most, or help us identify the extend our development decisions influence the community. -To opt-out from sending anonymous statistics, you can create reate a file called `.opt-out-from-anonymous-statistics` under the user configuration directory (usually `/etc/netdata`). +To opt-out from sending anonymous statistics, you can create a file called `.opt-out-from-anonymous-statistics` under the user configuration directory (usually `/etc/netdata`). Emails and Newsletters: When you sign up to receive updates from Netdata or otherwise subscribe to one of our mailing lists, you will be asked to provide some personal information. ND collects and uses this personal information pursuant to its legitimate interest in providing news and updates to, and collaborating with, its supporters and volunteers. diff --git a/docs/quickstart/infrastructure.md b/docs/quickstart/infrastructure.md new file mode 100644 index 000000000..0e355f373 --- /dev/null +++ b/docs/quickstart/infrastructure.md @@ -0,0 +1,184 @@ +<!-- +title: "Infrastructure monitoring with Netdata" +sidebar_label: "Infrastructure monitoring" +description: "Build a robust, infinitely scalable infrastructure monitoring solution with Netdata. Any number of nodes and every available metric." +custom_edit_url: https://github.com/netdata/netdata/edit/master/docs/quickstart/infrastructure.md +--> + +# Infrastructure monitoring with Netdata + +[Netdata Cloud](https://app.netdata.cloud) provides scalable infrastructure monitoring for any number of distributed +nodes running the Netdata Agent. A node is any system in your infrastructure that you want to monitor, whether it's a +physical or virtual machine (VM), container, cloud deployment, or edge/IoT device. + +The Netdata Agent uses zero-configuration collectors to gather metrics from every application and container instantly, +and uses Netdata's [distributed data architecture](/docs/store/distributed-data-architecture.md) to store metrics +locally. Without a slow and troublesome centralized data lake for your infrastructure's metrics, you reduce the +resources you need to invest in, and the complexity of, monitoring your infrastructure. + +Netdata Cloud unifies infrastructure monitoring by _centralizing the interface_ you use to query and visualize your +nodes' metrics, not the data. By streaming metrics values to your browser, with Netdata Cloud acting as the secure proxy +between them, you can monitor your infrastructure using customizable, interactive, and real-time visualizations from any +numbe of distributed nodes. + +In this quickstart guide, you'll learn the basics of using Netdata Cloud to monitor an infrastructure with dashboards, +composite charts, and alarm viewing. You'll then learn about the most critical ways to configure the Agent on each of +your nodes to maximize the value you get from Netdata. + +This quickstart assumes you've installed the Netdata Agent on more than one node in your infrastructure, and claimed +those nodes to your Space in Netdata Cloud. If you haven't yet, see the [_Get Netdata_ doc](/docs/get/README.md) for +details on signing up for Netdata Cloud, installation, and claiming. + +> If you want to monitor a Kubernetes cluster with Netdata, see our [k8s installation +> doc](/packaging/installer/methods/kubernetes.md) for setup details, and then read our guide, [_Monitor a Kubernetes +> cluster with Netdata_](/docs/guides/monitor/kubernetes-k8s-netdata.md). + +## Set up your Netdata Cloud experience + +Start your infrastructure monitoring experience by setting up your Netdata Cloud account. + +### Organize Spaces and War Rooms + +Spaces are high-level containers to help you organize your team members and the nodes they can view in each War Room. +You already have at least one Space in your Netdata Cloud account. + +A single Space puts all your metrics in one easily-accessible place, while multiple Spaces creates logical division +between different users and different pieces of a large infrastructure. For example, a large organization might have one +SRE team for the user-facing SaaS application, and a second IT team for managing employees' hardware. Since these teams +don't monitor the same nodes, they can work in separate Spaces and then further organize their nodes into War Rooms. + +Next, set up War Rooms. Netdata Cloud creates dashboards and visualizations based on the nodes added to a given War +Room. You can [organize War Rooms](https://learn.netdata.cloud/docs/cloud/war-rooms#war-room-organization) in any way +you want, such as by the application type, for end-to-end application monitoring, or as an incident response tool. + +Learn more about [Spaces](https://learn.netdata.cloud/docs/cloud/spaces) and [War +Rooms](https://learn.netdata.cloud/docs/cloud/war-rooms), including how to manage each, in their respective reference +documentation. + +### Invite your team + +Netdata Cloud makes an infrastructure's real-time metrics available and actionable to all organization members. By +inviting others, you can better synchronize with your team or colleagues to understand your infrastructure's heartbeat. +When something goes wrong, you'll be ready to collaboratively troubleshoot complex performance problems from a single +pane of glass. + +To invite new users, click on **Invite Users** in the left-hand navigation panel beneath your Space's name. Choose which +War Rooms to add this user to, then click **Send**. + +If your team members have trouble signing in, direct them to the [Netdata Cloud sign +in](https://learn.netdata.cloud/docs/cloud/manage/sign-in) doc. + +### See an overview of your infrastructure + +The default way to visualize the health and performance of an infrastructure with Netdata Cloud is the +[**Overview**](/docs/visualize/overview-infrastructure.md), which is the default interface of every War Room. The +Overview features composite charts, which display aggregated metrics from every node in a given War Room. These metrics +are streamed on-demand from individual nodes and composited onto a single, familiar dashboard. + + + +Read more about the Overview in the [infrastructure overview](/docs/visualize/overview-infrastructure.md) doc. + +Netdata Cloud also features the [**Nodes view**](https://learn.netdata.cloud/docs/cloud/visualize/nodes), which you can +use to configure and see a few key metrics from every node in the War Room, view health status, and more. + +### Drill down to specific nodes + +Both the Overview and Nodes view offer easy access to **single-node dashboards** for targeted analysis. You can use +single-node dashboards in Netdata Cloud to drill down on specific issues, scrub backward in time to investigate +historical data, and see like metrics presented meaningfully to help you troubleshoot performance problems. + +Read about the process in the [infrastructure +overview](/docs/visualize/overview-infrastructure.md#single-node-dashboards) doc, then learn about [interacting with +dashboards and charts](/docs/visualize/interact-dashboards-charts.md) to get the most from all of Netdata's real-time +metrics. + +### Create new dashboards + +You can use Netdata Cloud to create new dashboards that match your infrastructure's topology or help you diagnose +complex issues by aggregating correlated charts from any number of nodes. For example, you could monitor the system CPU +from every node in your infrastructure on a single dashboard. + +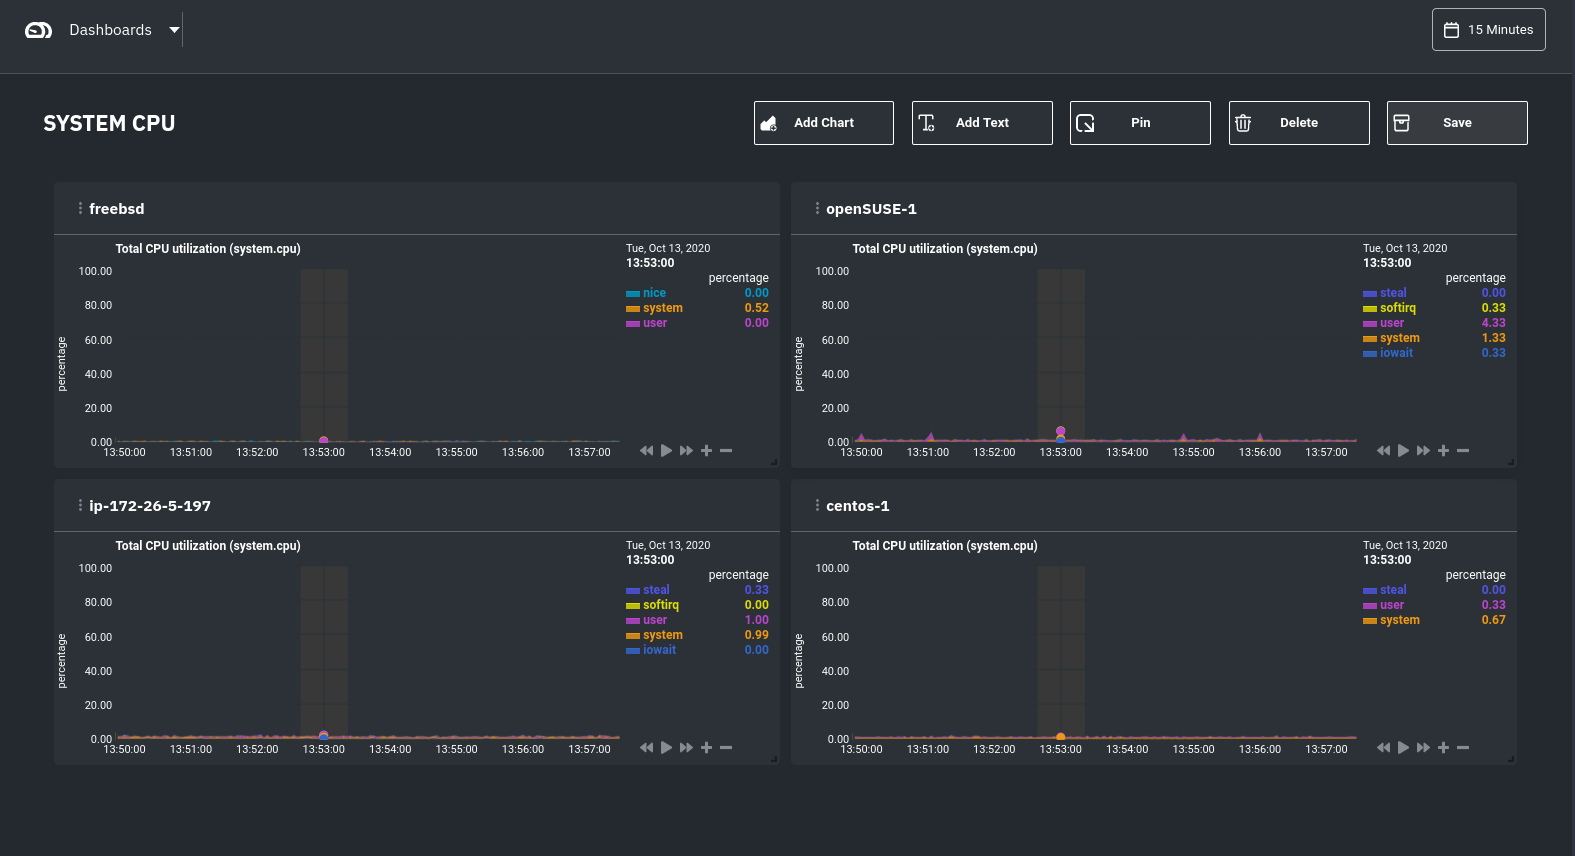 + +Read more about [creating new dashboards](/docs/visualize/create-dashboards.md) for more details about the process and +additional tips on best leveraging the feature to help you troubleshoot complex performance problems. + +## Set up your nodes + +You get the most value out of Netdata Cloud's infrastructure monitoring capabilities if each node collects every +possible metric. For example, if a node in your infrastructure is responsible for serving a MySQL database, you should +ensure that the Netdata Agent on that node is properly collecting and streaming all MySQL-related metrics. + +In most cases, collectors autodetect their data source and require no configuration, but you may need to configure +certain behaviors based on your infrastructure. Or, you may want to enable/configure advanced functionality, such as +longer metrics retention or streaming. + +### Configure the Netdata Agent on your nodes + +You can configure any node in your infrastructure if you need to, although most users will find the default settings +work extremely well for monitoring their infrastructures. + +Each node has a configuration file called `netdata.conf`, which is typically at `/etc/netdata/netdata.conf`. The best +way to edit this file is using the `edit-config` script, which ensures updates to the Netdata Agent do not overwrite +your changes. For example: + +```bash +cd /etc/netdata +sudo ./edit-config netdata.conf +``` + +Our [configuration basics doc](/docs/configure/nodes.md) contains more information about `netdata.conf`, `edit-config`, +along with simple examples to get you familiar with editing your node's configuration. + +After you've learned the basics, you should [secure your infrastructure's nodes](/docs/configure/secure-nodes.md) using +one of our recommended methods. These security best practices ensure no untrusted parties gain access to the metrics +collected on any of your nodes. + +### Collect metrics from systems and applications + +Netdata has [300+ pre-installed collectors](/collectors/COLLECTORS.md) that gather thousands of metrics with zero +configuration. Collectors search each of your nodes in default locations and ports to find running applications and +gather as many metrics as they can without you having to configure them individually. + +Most collectors work without configuration, but you should read up on [how collectors +work](/docs/collect/how-collectors-work.md) and [how to enable/configure](/docs/collect/enable-configure.md) them so +that you can see metrics from those applications in Netdata Cloud. + +In addition, find detailed information about which [system](/docs/collect/system-metrics.md), +[container](/docs/collect/container-metrics.md), and [application](/docs/collect/application-metrics.md) metrics you can +collect from across your infrastructure with Netdata. + +## What's next? + +Netdata has many features that help you monitor the health of your nodes and troubleshoot complex performance problems. +Once you have a handle on configuration and are collecting all the right metrics, try out some of Netdata's other +infrastructure-focused features: + +- [See an overview of your infrastructure](/docs/visualize/overview-infrastructure.md) using Netdata Cloud's composite + charts and real-time visualizations. +- [Create new dashboards](/docs/visualize/create-dashboards.md) from any number of nodes and metrics in Netdata Cloud. + +To change how the Netdata Agent runs on each node, dig in to configuration files: + +- [Change how long nodes in your infrastructure retain metrics](/docs/store/change-metrics-storage.md) based on how + many metrics each node collects, your preferred retention period, and the resources you want to dedicate toward + long-term metrics retention. +- [Create new alarms](/docs/monitor/configure-alarms.md), or tweak some of the pre-configured alarms, to stay on top + of anomalies. +- [Enable notifications](/docs/monitor/enable-notifications.md) to Slack, PagerDuty, email, and 30+ other services. +- [Export metrics](/docs/export/external-databases.md) to an external time-series database to use Netdata alongside + other monitoring and troubleshooting tools. + +### Related reference documentation + +- [Netdata Cloud · Spaces](https://learn.netdata.cloud/docs/cloud/spaces) +- [Netdata Cloud · War Rooms](https://learn.netdata.cloud/docs/cloud/war-rooms) +- [Netdata Cloud · Invite your team](https://learn.netdata.cloud/docs/cloud/manage/invite-your-team) +- [Netdata Cloud · Sign in or sign up with email, Google, or + GitHub](https://learn.netdata.cloud/docs/cloud/manage/sign-in) +- [Netdata Cloud · Nodes view](https://learn.netdata.cloud/docs/cloud/visualize/nodes) + +[](<>) diff --git a/docs/quickstart/single-node.md b/docs/quickstart/single-node.md new file mode 100644 index 000000000..77656af26 --- /dev/null +++ b/docs/quickstart/single-node.md @@ -0,0 +1,96 @@ +<!-- +title: "Single-node monitoring with Netdata" +sidebar_label: "Single-node monitoring" +description: "Learn dashboard basics, configuring your nodes, and collecting metrics from applications to create a powerful single-node monitoring tool." +custom_edit_url: https://github.com/netdata/netdata/edit/master/docs/quickstart/single-node.md +--> + +# Single-node monitoring with Netdata + +Because it's free, open-source, and requires only 1% CPU utilization to collect thousands of metrics every second, +Netdata is a superb single-node monitoring tool. + +In this quickstart guide, you'll learn how to access your single node's metrics through dashboards, configure your node +to your liking, and make sure the Netdata Agent is collecting metrics from the applications or containers you're running +on your node. + +> This quickstart assumes you have installed the Netdata Agent on your node. If you haven't yet, see the [_Get Netdata_ +> doc](/docs/get/README.md) for details on installation. In addition, this quickstart mentions features available only +> through Netdata Cloud, which requires you to [claim your node](/docs/get/README.md#claim-your-node-on-netdata-cloud). + +## See your node's metrics + +To see your node's real-time metrics, you need to access its dashboard. You can either view the local dashboard, which +runs on the node itself, or see the dashboard through Netdata Cloud. Both methods feature real-time, interactive, and +synchronized charts, with the same metrics, and use the same UI. + +The primary difference is that Netdata Cloud also has a few extra features, like creating new dashboards using a +drag-and-drop editor, that enhance your monitoring and troubleshooting experience. + +To see your node's local dashboard, open up your web browser of choice and navigate to `http://NODE:19999`, replacing +`NODE` with the IP address or hostname of your Agent. Hit `Enter`. + + + +To see a node's dashboard in Netdata Cloud, [sign in](https://app.netdata.cloud). From the **Nodes** view in your +**General** War Room, click on the hostname of your node to access its dashboard through Netdata Cloud. + +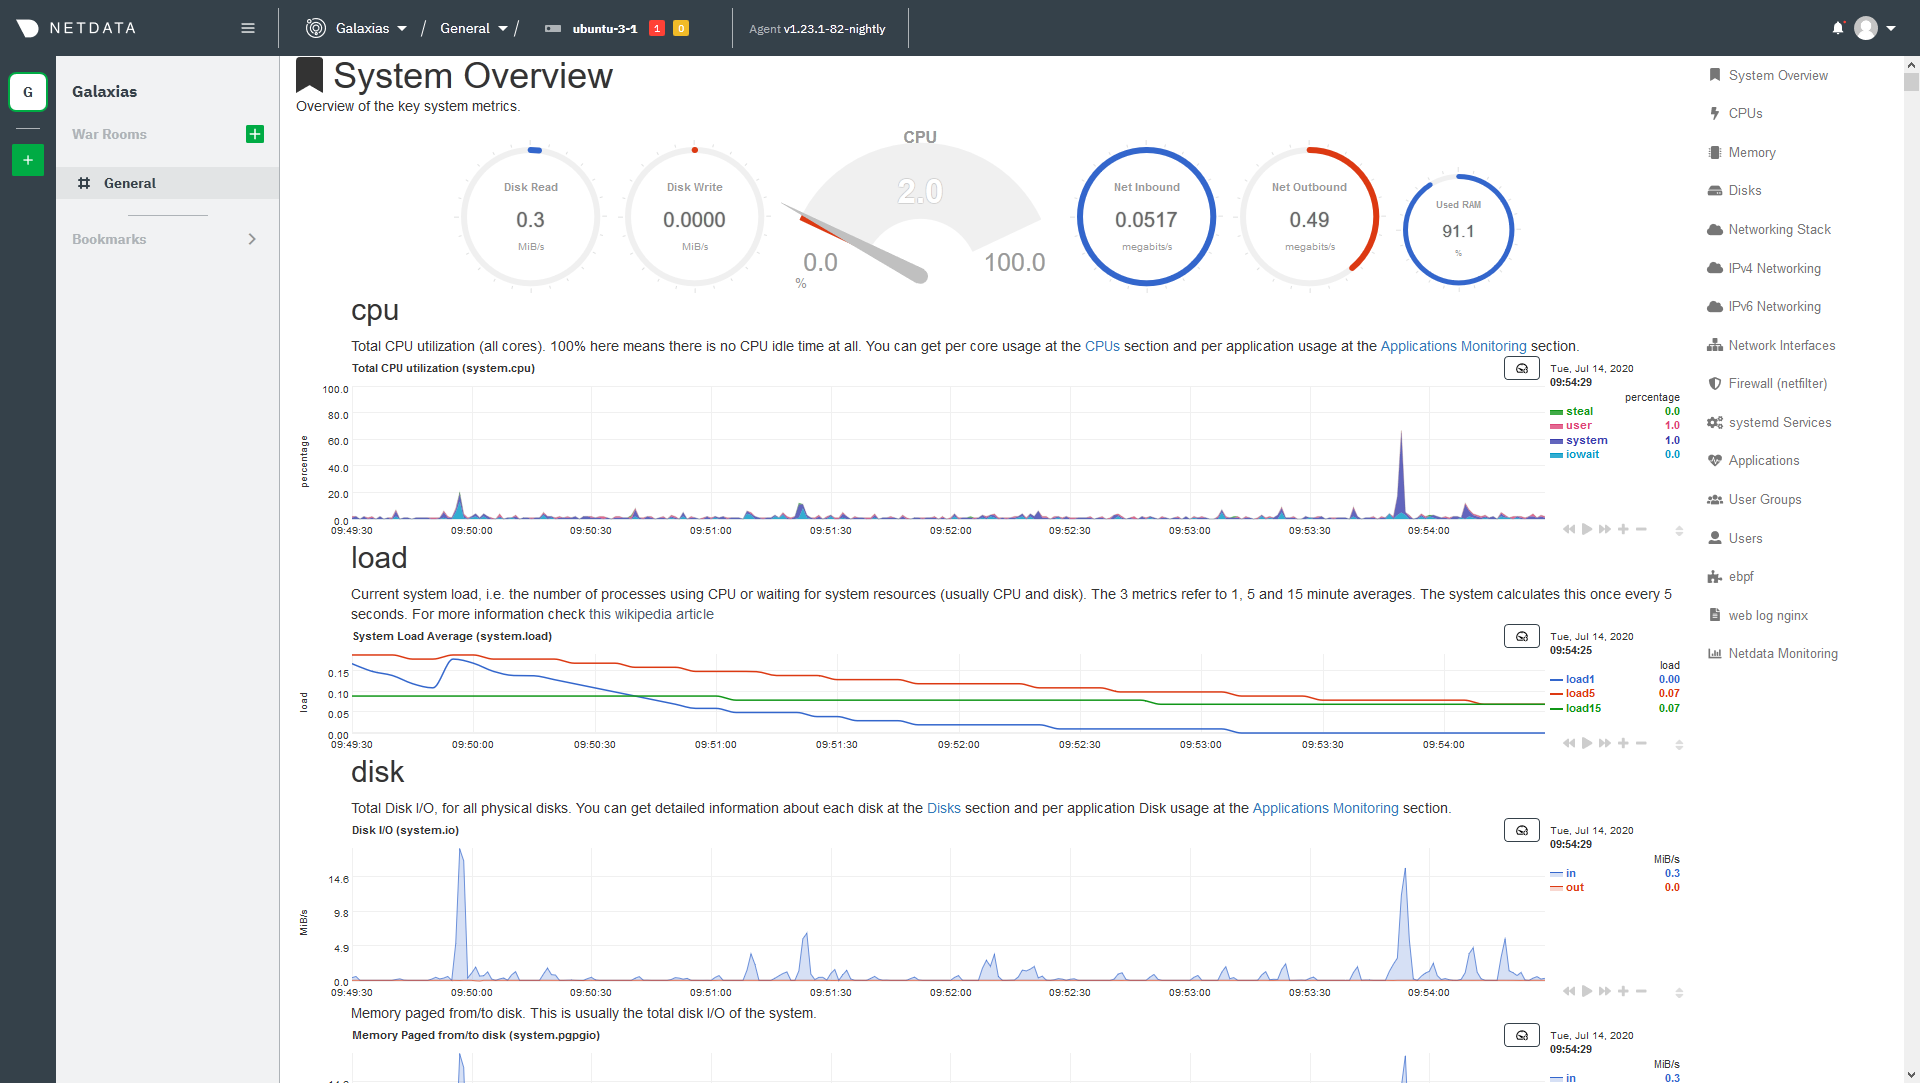 + +Once you've decided which dashboard you prefer, learn about [interacting with dashboards and +charts](/docs/visualize/interact-dashboards-charts.md) to get the most from Netdata's real-time metrics. + +## Configure your node + +The Netdata Agent is highly configurable so that you can match its behavior to your node. You will find most +configuration options in the `netdata.conf` file, which is typically at `/etc/netdata/netdata.conf`. The best way to +edit this file is using the `edit-config` script, which ensures updates to the Netdata Agent do not overwrite your +changes. For example: + +```bash +cd /etc/netdata +sudo ./edit-config netdata.conf +``` + +Our [configuration basics doc](/docs/configure/nodes.md) contains more information about `netdata.conf`, `edit-config`, +along with simple examples to get you familiar with editing your node's configuration. + +After you've learned the basics, you should [secure your node](/docs/configure/secure-nodes.md) using one of our +recommended methods. These security best practices ensure no untrusted parties gain access to your dashboard or its +metrics. + +## Collect metrics from your system and applications + +Netdata has [300+ pre-installed collectors](/collectors/COLLECTORS.md) that gather thousands of metrics with zero +configuration. Collectors search your node in default locations and ports to find running applications and gather as +many metrics as possible without you having to configure them individually. + +These metrics enrich both the local and Netdata Cloud dashboards. + +Most collectors work without configuration, but you should read up on [how collectors +work](/docs/collect/how-collectors-work.md) and [how to enable/configure](/docs/collect/enable-configure.md) them. + +In addition, find detailed information about which [system](/docs/collect/system-metrics.md), +[container](/docs/collect/container-metrics.md), and [application](/docs/collect/application-metrics.md) metrics you can +collect from across your infrastructure with Netdata. + +## What's next? + +Netdata has many features that help you monitor the health of your node and troubleshoot complex performance problems. +Once you understand configuration, and are certain Netdata is collecting all the important metrics from your node, try +out some of Netdata's other visualization and health monitoring features: + +- [Build new dashboards](/docs/visualize/create-dashboards.md) to put disparate but relevant metrics onto a single + interface. +- [Create new alarms](/docs/monitor/configure-alarms.md), or tweak some of the pre-configured alarms, to stay on top + of anomalies. +- [Enable notifications](/docs/monitor/enable-notifications.md) to Slack, PagerDuty, email, and 30+ other services. +- [Change how long your node stores metrics](/docs/store/change-metrics-storage.md) based on how many metrics it + collects, your preferred retention period, and the resources you want to dedicate toward long-term metrics + retention. +- [Export metrics](/docs/export/external-databases.md) to an external time-series database to use Netdata alongside + other monitoring and troubleshooting tools. + +[](<>) diff --git a/docs/store/change-metrics-storage.md b/docs/store/change-metrics-storage.md new file mode 100644 index 000000000..0e2db1369 --- /dev/null +++ b/docs/store/change-metrics-storage.md @@ -0,0 +1,72 @@ +<!-- +title: "Change how long Netdata stores metrics" +description: "With a single configuration change, the Netdata Agent can store days, weeks, or months of metrics at its famous per-second granularity." +custom_edit_url: https://github.com/netdata/netdata/edit/master/docs/store/change-metrics-storage.md +--> + +# Change how long Netdata stores metrics + +import { Calculator } from '../../src/components/agent/dbCalc/' + +The [database engine](/database/engine/README.md) uses RAM to store recent metrics. When metrics reach a certain age, +and based on how much system RAM you allocate toward storing metrics in memory, they are compressed and "spilled" to +disk for long-term storage. + +The default settings retain about two day's worth of metrics on a system collecting 2,000 metrics every second, but the +Netdata Agent is highly configurable if you want your nodes to store days, weeks, or months worth of per-second data. + +The Netdata Agent uses two settings in `netdata.conf` to change the behavior of the database engine: + +```conf +[global] + page cache size = 32 + dbengine multihost disk space = 256 +``` + +`page cache size` sets the maximum amount of RAM (in MiB) the database engine uses to cache and index recent metrics. +`dbengine multihost disk space` sets the maximum disk space (again, in MiB) the database engine uses to store +historical, compressed metrics. When the size of stored metrics exceeds the allocated disk space, the database engine +removes the oldest metrics on a rolling basis. + +## Calculate the system resources (RAM, disk space) needed to store metrics + +You can store more or less metrics using the database engine by changing the allocated disk space. Use the calculator +below to find an appropriate value for `dbengine multihost disk space` based on how many metrics your node(s) collect, +whether you are streaming metrics to a parent node, and more. + +You do not need to edit the `page cache size` setting to store more metrics using the database engine. However, if you +want to store more metrics _specifically in memory_, you can increase the cache size. + +> ⚠️ This calculator provides an estimate of disk and RAM usage for **metrics storage**, along with its best +> recommendation for the `dbengine multihost disk space` setting. Real-life usage may vary based on the accuracy of the +> values you enter below, changes in the compression ratio, and the types of metrics stored. + +<Calculator /> + +## Edit `netdata.conf` with recommended database engine settings + +Now that you have a recommended setting for `dbengine multihost disk space`, open `netdata.conf` with +[`edit-config`](/docs/configure/nodes.md#use-edit-config-to-edit-configuration-files) and look for the `dbengine +multihost disk space` setting. Change it to the value recommended above. For example: + +```conf +[global] + dbengine multihost disk space = 1024 +``` + +Save the file and restart the Agent with `service netdata restart` to change the database engine's size. + +## What's next? + +For more information about the database engine, see our [database reference doc](/database/engine/README.md). + +Storing metrics with the database engine is completely interoperable with [exporting to other time-series +databases](/docs/export/external-databases.md). With exporting, you can use the node's resources to surface metrics +when [viewing dashboards](/docs/visualize/interact-dashboards-charts.md), while also archiving metrics elsewhere for +further analysis, visualization, or correlation with other tools. + +If you don't want to always store metrics on the node that collects them or run ephemeral nodes without dedicated +storage, you can use [streaming](/streaming/README.md). Streaming allows you to centralize your data, run Agents as +headless collectors, replicate data, and more. + +[](<>) diff --git a/docs/store/distributed-data-architecture.md b/docs/store/distributed-data-architecture.md new file mode 100644 index 000000000..dbf73f35b --- /dev/null +++ b/docs/store/distributed-data-architecture.md @@ -0,0 +1,71 @@ +<!-- +title: "Distributed data architecture" +description: "Netdata's distributed data architecture stores metrics on individual nodes for high performance and scalability using all your granular metrics." +custom_edit_url: https://github.com/netdata/netdata/edit/master/docs/store/distributed-data.md +--> + +# Distributed data architecture + +Netdata uses a distributed data architecture to help you collect and store per-second metrics from any number of nodes. +Every node in your infrastructure, whether it's one or a thousand, stores the metrics it collects. + +Netdata Cloud bridges the gap between many distributed databases by _centralizing the interface_ you use to query and +visualize your nodes' metrics. When you [look at charts in Netdata +Cloud](/docs/visualize/interact-dashboards-charts.md), the metrics values are queried directly from that node's database +and securely streamed to Netdata Cloud, which proxies them to your browser. + +Netdata's distributed data architecture has a number of benefits: + +- **Performance**: Every query to a node's database takes only a few milliseconds to complete for responsiveness when + viewing dashboards or using features like [Metric + Correlations](https://learn.netdata.cloud/docs/cloud/insights/metric-correlations). +- **Scalability**: As your infrastructure scales, install the Netdata Agent on every new node to immediately add it to + your monitoring solution without adding cost or complexity. +- **1-second granularity**: Without an expensive centralized data lake, you can store all of your nodes' per-second + metrics, for any period of time, while keeping costs down. +- **No filtering or selecting of metrics**: Because Netdata's distributed data architecture allows you to store all + metrics, you don't have to configure which metrics you retain. Keep everything for full visibility during + troubleshooting and root cause analysis. +- **Easy maintenance**: There is no centralized data lake to purchase, allocate, monitor, and update, removing + complexity from your monitoring infrastructure. + +## Does Netdata Cloud store my metrics? + +Netdata Cloud does not store metric values. + +To enable certain features, such as [viewing active alarms](/docs/monitor/view-active-alarms.md) or [filtering by +hostname/service](https://learn.netdata.cloud/docs/cloud/war-rooms#node-filter), Netdata Cloud does store configured +alarms, their status, and a list of active collectors. + +Netdata does not and never will sell your personal data or data about your deployment. + +## Long-term metrics storage with Netdata + +Any node running the Netdata Agent can store long-term metrics for any retention period, given you allocate the +appropriate amount of RAM and disk space. + +Read our document on changing [how long Netdata stores metrics](/docs/store/change-metrics-storage.md) on your nodes for +details. + +## Other options for your metrics data + +While a distributed data architecture is the default when monitoring infrastructure with Netdata, you can also configure +its behavior based on your needs or the type of infrastructure you manage. + +To archive metrics to an external time-series database, such as InfluxDB, Graphite, OpenTSDB, Elasticsearch, +TimescaleDB, and many others, see details on [integrating Netdata via exporting](/docs/export/external-databases.md). + +You can also stream between nodes using [streaming](/streaming/README.md), allowing to replicate databases and create +your own centralized data lake of metrics, if you choose to do so. + +When you use the database engine to store your metrics, you can always perform a quick backup of a node's +`/var/cache/netdata/dbengine/` folder using the tool of your choice. + +## What's next? + +You can configure the Netdata Agent to store days, weeks, or months worth of distributed, per-second data by +[configuring the database engine](/docs/store/change-metrics-storage.md). Use our calculator to determine the system +resources required to retain your desired amount of metrics, and expand or contract the database by editing a single +setting. + +[](<>) diff --git a/docs/terms-of-use.md b/docs/terms-of-use.md index bf77fabbf..a3cbd0099 100644 --- a/docs/terms-of-use.md +++ b/docs/terms-of-use.md @@ -1,3 +1,8 @@ +<!-- +title: "Terms of Use" +custom_edit_url: https://github.com/netdata/netdata/edit/master/docs/terms-of-use.md +--> + # Terms of Use Netdata Master Terms of Use diff --git a/docs/visualize/create-dashboards.md b/docs/visualize/create-dashboards.md new file mode 100644 index 000000000..91a8dcccc --- /dev/null +++ b/docs/visualize/create-dashboards.md @@ -0,0 +1,64 @@ +<!-- +title: "Create new dashboards" +description: "Create new dashboards in Netdata Cloud, with any number of metrics from any node on your infrastructure, for targeted troubleshooting." +custom_edit_url: https://github.com/netdata/netdata/edit/master/docs/visualize/create-dashboards.md +--> + +# Create new dashboards + +With Netdata Cloud, you can build new dashboards that put key metrics from any number of distributed systems in one +place for a bird's eye view of your infrastructure. You can create more meaningful visualizations for troubleshooting or +keep a watchful eye on your infrastructure's most meaningful metrics without moving from node to node. + +In the War Room you want to monitor with this dashboard, click on your War Room's dropdown, then click on the green **+ +Add** button next to **Dashboards**. In the panel, give your new dashboard a name, and click **+ Add**. + +Click the **Add Chart** button to add your first chart card. From the dropdown, select the node you want to add the +chart from, then the context. Netdata Cloud shows you a preview of the chart before you finish adding it. + +The **Add Text** button creates a new card with user-defined text, which you can use to describe or document a +particular dashboard's meaning and purpose. Enrich the dashboards you create with documentation or procedures on how to +respond + +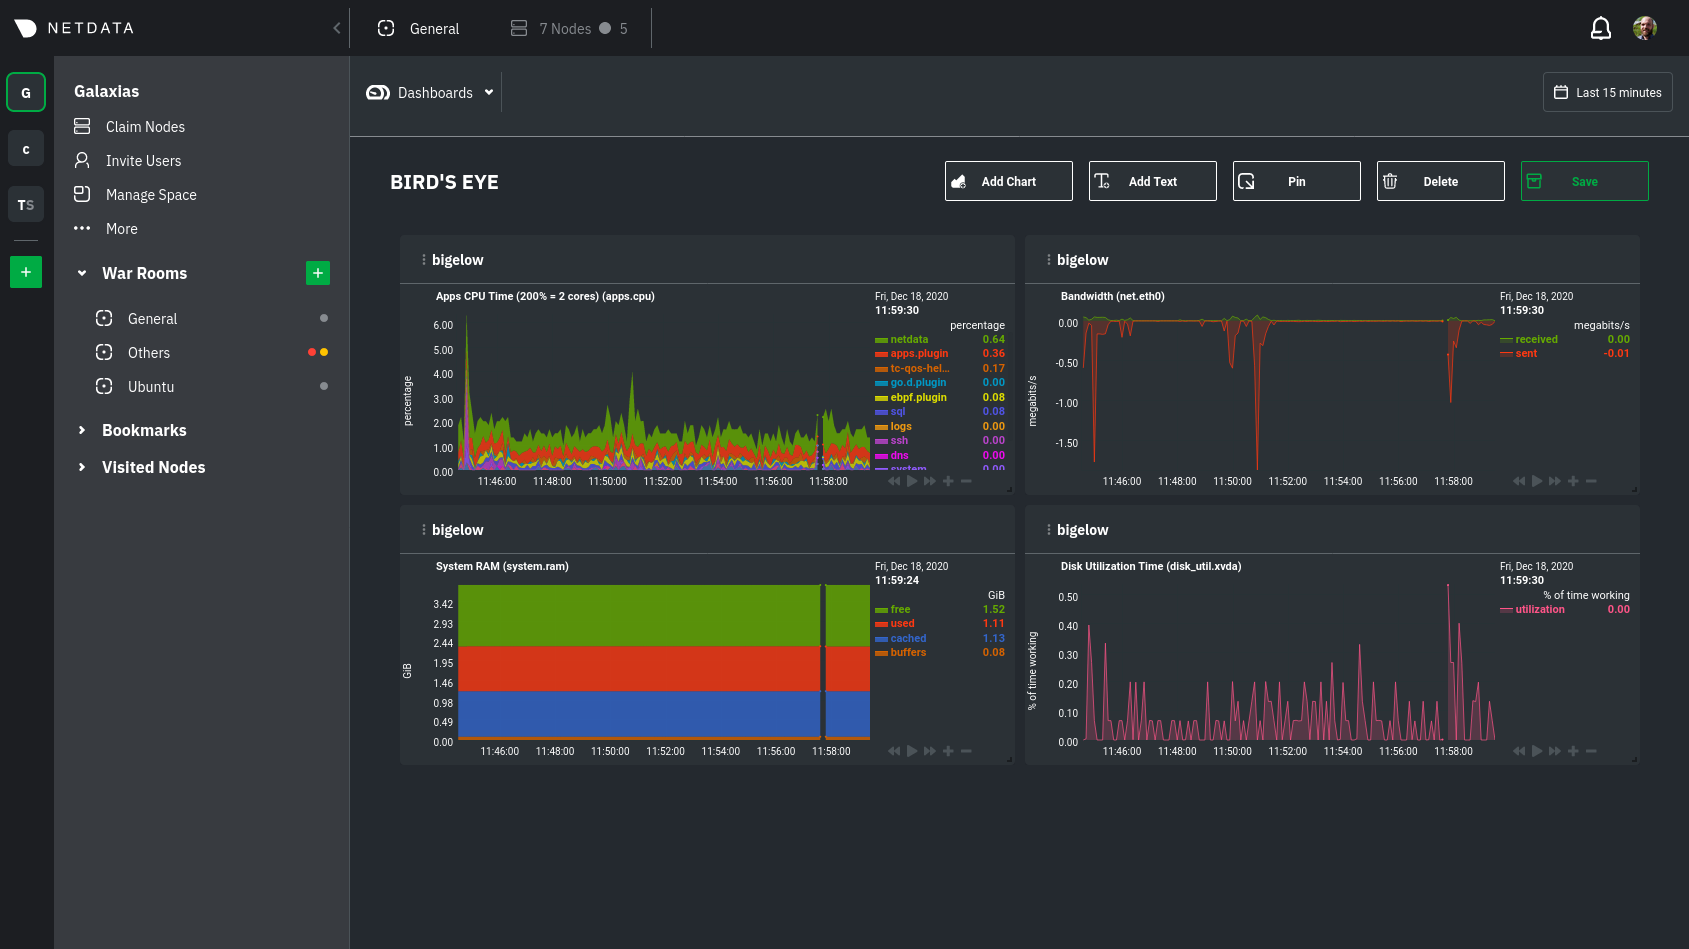 + +Charts in dashboards are [fully interactive](/docs/visualize/interact-dashboards-charts.md) and synchronized. You can +pan through time, zoom, highlight specific timeframes, and more. + +Move any card by clicking on their top panel and dragging them to a new location. Other cards re-sort to the grid system +automatically. You can also resize any card by grabbing the bottom-right corner and dragging it to its new size. + +Hit the **Save** button to finalize your dashboard. Any other member of the War Room can now access it and make changes. + +## Jump to single-node Cloud dashboards + +While dashboards help you associate essential charts from distributed nodes on a single pane of glass, you might need +more detail when troubleshooting an issue. Quickly jump to any node's dashboard by clicking the 3-dot icon in the corner +of any card to open a menu. Hit the **Go to Chart** item. + +Netdata Cloud takes you to the same chart on that node's dashboard. You can now navigate all that node's metrics and +[interact with charts](/docs/visualize/interact-dashboards-charts.md) to further investigate anomalies or troubleshoot +complex performance problems. + +When viewing a single-node Cloud dashboard, you can also click on the add to dashboard icon <img +src="https://user-images.githubusercontent.com/1153921/87587846-827fdb00-c697-11ea-9f31-aed0b8c6afba.png" alt="Dashboard +icon" class="image-inline" /> to quickly add that chart to a new or existing dashboard. You might find this useful when +investigating an anomaly and want to quickly populate a dashboard with potentially correlated metrics. + +## Pin dashboards and navigate through Netdata Cloud + +Click on the **Pin** button in any dashboard to put those charts into a separate panel at the bottom of the screen. You +can now navigate through Netdata Cloud freely, individual Cloud dashboards, the Nodes view, different War Rooms, or even +different Spaces, and have those valuable metrics follow you. + +Pinning dashboards helps you correlate potentially related charts across your infrastructure and discover root causes +faster. + +## What's next? + +While it's useful to see real-time metrics on flexible dashboards, you need ways to know precisely when an anomaly +strikes. Every Netdata Agent comes with a health watchdog that uses [alarms](/docs/monitor/configure-alarms.md) and +[notifications](/docs/monitor/enable-notifications.md) to notify you of issues seconds after they strike. + +[](<>) diff --git a/docs/visualize/interact-dashboards-charts.md b/docs/visualize/interact-dashboards-charts.md new file mode 100644 index 000000000..30503c220 --- /dev/null +++ b/docs/visualize/interact-dashboards-charts.md @@ -0,0 +1,127 @@ +<!-- +title: "Interact with dashboards and charts" +description: "Zoom, highlight, and pan through time on hundreds of real-time, interactive charts to quickly discover the root cause of any anomaly." +custom_edit_url: https://github.com/netdata/netdata/edit/master/docs/visualize/interact-dashboards-charts.md +--> + +# Interact with dashboards and charts + +You can find Netdata's dashboards in two places: locally served at `http://NODE:19999` by the Netdata Agent, and in +Netdata Cloud. While you access these dashboards differently, they have similar interfaces, identical charts and +metrics, and you interact with both of them the same way. + +> If you're not sure which option is best for you, see our [single-node](/docs/quickstart/single-node.md) and +> [infrastructure](/docs/quickstart/infrastructure.md) quickstart guides. + +Netdata dashboards are single, scrollable pages with many charts stacked on top of one another. As you scroll up or +down, charts appearing in your browser's viewport automatically load and update every second. + +The dashboard is broken up into multiple **sections**, such as **System Overview**, **CPU**, **Disk**, which are +automatically generated based on which [collectors](/docs/collect/how-collectors-work.md) begin collecting metrics when +Netdata starts up. Sections also appear in the right-hand **menu**, along with submenus based on the contexts and +families Netdata creates for your node. + +## Choose timeframes to visualize + +Both the local Agent dashboard and Netdata Cloud feature time & date pickers to help you visualize specific points in +time. In Netdata Cloud, the picker appears in the [Overview](/docs/visualize/overview-infrastructure.md), [Nodes +view](https://learn.netdata.cloud/docs/cloud/visualize/nodes), [new +dashboards](https://learn.netdata.cloud/docs/cloud/visualize/dashboards), and any single-node dashboards you visit. + +Local Agent dashboard: + +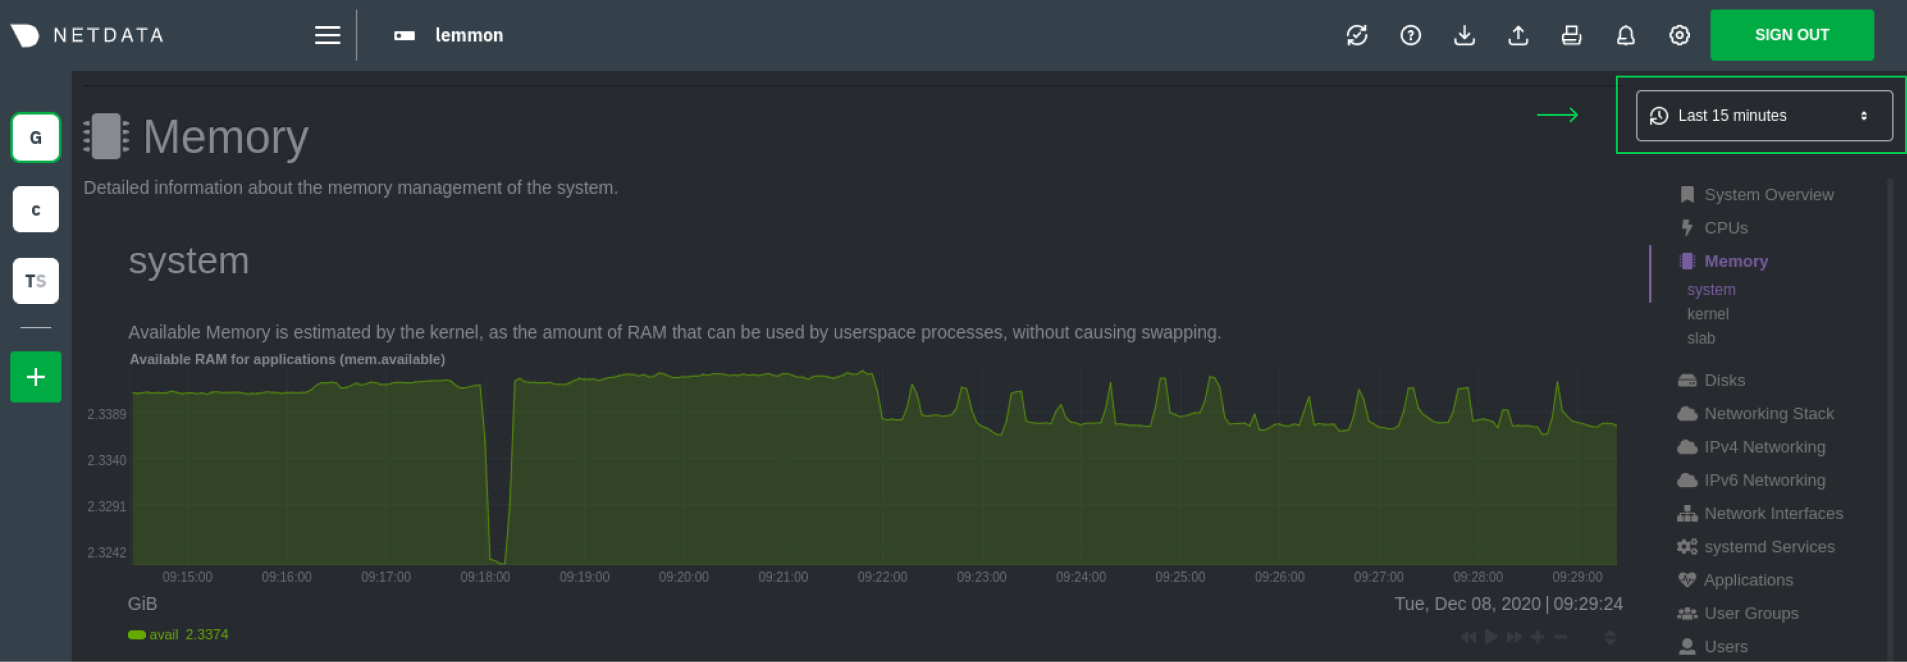 + +Netdata Cloud: + +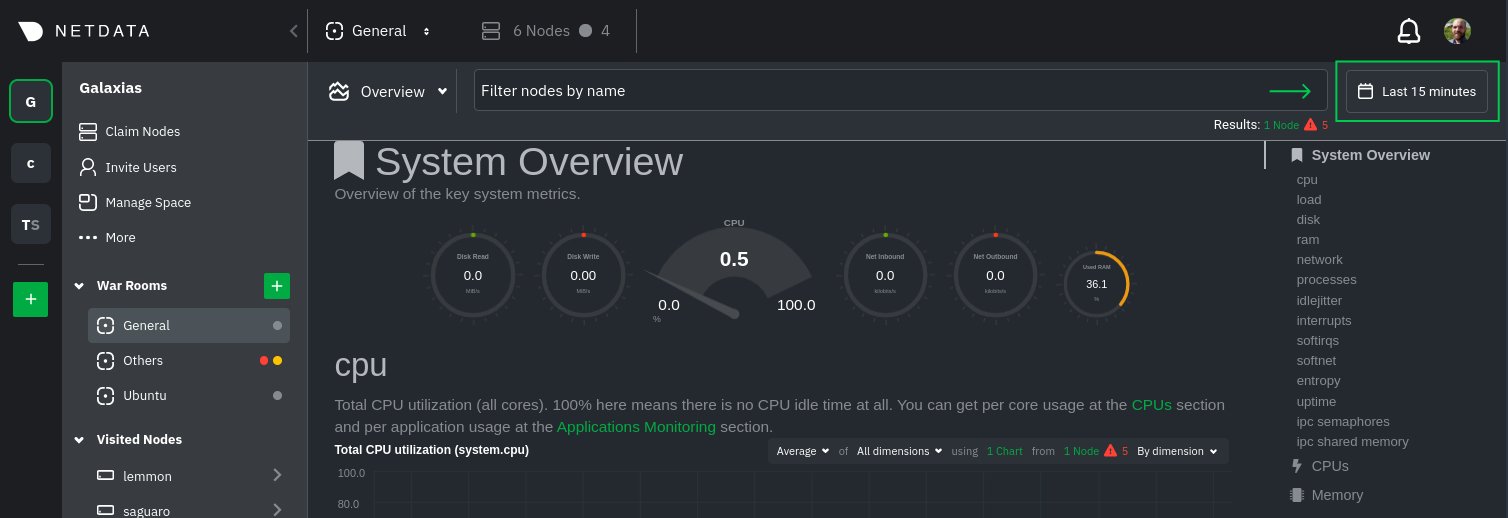 + +Their behavior is identical. Use the Quick Selector to visualize generic timeframes, or use the calendar or inputs to +select days, hours, minutes or seconds. Click **Apply** to re-render all visualizations with new metrics data, or +**Clear** to restore the default timeframe. + +See reference documentation for the [local Agent dashboard](/web/gui/README.md#time--date-picker) and [Netdata +Cloud](https://learn.netdata.cloud/docs/cloud/war-rooms#time--date-picker) for additional context about how the time & +date picker behaves in each environment. + +## Charts, dimensions, families, and contexts + +A **chart** is an interactive visualization of one or more collected/calculated metrics. You can see the name (also +known as its unique ID) of a chart by looking at the top-left corner of a chart and finding the parenthesized text. On a +Linux system, one of the first charts on the dashboard will be the system CPU chart, with the name `system.cpu`. + +A **dimension** is any value that gets shown on a chart. The value can be raw data or calculated values, such as +percentages, aggregates, and more. Most charts will have more than one dimension, in which case it will display each in +a different color. You can disable or enable showing these dimensions by clicking on them. + +A **family** is _one_ instance of a monitored hardware or software resource that needs to be monitored and displayed +separately from similar instances. For example, if your node has multiple partitions, Netdata will create different +families for `/`, `/boot`, `/home`, and so on. Same goes for entire disks, network devices, and more. + +A **context** groups several charts based on the types of metrics being collected and displayed. For example, the +**Disk** section often has many contexts: `disk.io`, `disk.ops`, `disk.backlog`, `disk.util`, and so on. Netdata uses +this context to create individual charts and then groups them by family. You can always see the context of any chart by +looking at its name or hovering over the chart's date. + +See our [dashboard docs](/web/README.md#charts-contexts-families) for more information about the above distinctions +and how they're used across Netdata to meaningfully organize and present metrics. + +## Interact with charts + +Netdata's charts are fully interactive to help you find meaningful information about complex problems. You can pan +through historical metrics, zoom in and out, select specific timeframes for further analysis, resize charts, and more. +Whenever you use a chart in this way, Netdata synchronizes all the other charts to match it. + +| Change | Method #1 | Method #2 | Method #3 | +| ------------------------------------------------- | ----------------------------------- | --------------------------------------------------------- | ---------------------------------------------------------- | +| **Stop** a chart from updating | `click` | | | +| **Reset** charts to default auto-refreshing state | `double click` | `double tap` (touchpad/touchscreen) | | +| **Select** a certain timeframe | `ALT` + `mouse selection` | `⌘` + `mouse selection` (macOS) | | +| **Pan** forward or back in time | `click and drag` | `touch and drag` (touchpad/touchscreen) | | +| **Zoom** to a specific timeframe | `SHIFT` + `mouse selection` | | | +| **Zoom** in/out | `SHIFT`/`ALT` + `mouse scrollwheel` | `SHIFT`/`ALT` + `two-finger pinch` (touchpad/touchscreen) | `SHIFT`/`ALT` + `two-finger scroll` (touchpad/touchscreen) | + + + +These interactions can also be triggered using the icons on the bottom-right corner of every chart. They are, +respectively, `Pan Left`, `Reset`, `Pan Right`, `Zoom In`, and `Zoom Out`. + +You can show and hide individual dimensions by clicking on their names. Use `SHIFT + click` to hide or show dimensions +one at a time. Hiding dimensions simplifies the chart and can help you better discover exactly which aspect of your +system is behaving strangely. + +You can resize any chart by clicking-and-dragging the icon on the bottom-right corner of any chart. To restore the chart +to its original height, double-click the same icon. + + + +### Composite charts in Netdata Cloud + +Netdata Cloud now supports composite charts in the Overview interface. Composite charts come with a few additional UI +elements and varied interactions, such as the location of dimensions and a utility bar for configuring the state of +individual composite charts. All of these details are covered in the [Overview +reference](https://learn.netdata.cloud/docs/cloud/visualize/overview) doc. + +## What's next? + +Netdata Cloud users can [build new dashboards](/docs/visualize/create-dashboards.md) in just a few clicks. By +aggregating relevant metrics from any number of nodes onto a single interface, you can respond faster to anomalies, +perform more targeted troubleshooting, or keep tabs on a bird's eye view of your infrastructure. + +If you're finished with dashboards for now, skip to Netdata's health watchdog for information on [creating or +configuring](/docs/monitor/configure-alarms.md) alarms, and [send notifications](/docs/monitor/enable-notifications.md) +to get informed when something goes wrong in your infrastructure. + +### Related reference documentation + +- [Netdata Agent · Web dashboards overview](/web/README.md) +- [Netdata Cloud · War Rooms](https://learn.netdata.cloud/docs/cloud/war-rooms) +- [Netdata Cloud · Overview](https://learn.netdata.cloud/docs/cloud/visualize/overview) +- [Netdata Cloud · Nodes](https://learn.netdata.cloud/docs/cloud/visualize/nodes) +- [Netdata Cloud · Build new dashboards](https://learn.netdata.cloud/docs/cloud/visualize/dashboards) + +[](<>) diff --git a/docs/visualize/overview-infrastructure.md b/docs/visualize/overview-infrastructure.md new file mode 100644 index 000000000..675abd745 --- /dev/null +++ b/docs/visualize/overview-infrastructure.md @@ -0,0 +1,109 @@ +<!-- +title: "See an overview of your infrastructure" +description: "With Netdata Cloud's War Rooms, you can see real-time metrics, from any number of nodes in your infrastructure, in composite charts." +custom_edit_url: https://github.com/netdata/netdata/edit/master/docs/visualize/overview-infrastructure.md +--> + +# See an overview of your infrastructure + +In Netdata Cloud, your nodes are organized into War Rooms. One of the two available views for a War Room is the +**Overview**, which uses composite charts to display real-time, aggregated metrics from all the nodes (or a filtered +selection) in a given War Room. + +With Overview's composite charts, you can see your infrastructure from a single pane of glass, discover trends or +anomalies, then drill down with filtering or single-node dashboards to see more. In the screenshot below, +each chart visualizes average or sum metrics values from across 5 distributed nodes. + + + +## Using the Overview + +> ⚠️ In order for nodes to contribute to composite charts, and thus the Overview UI, they must run v1.26.0 or later of +> the Netdata Agent. See our [update docs](/packaging/installer/UPDATE.md) for the preferred update method based on how +> you installed the Agent. + +The Overview uses roughly the same interface as local Agent dashboards or single-node dashboards in Netdata Cloud. By +showing all available metrics from all your nodes in a single interface, Netdata Cloud helps you visualize the overall +health of your infrastructure. Best of all, you don't have to worry about creating your own dashboards just to get +started with infrastructure monitoring. + +Let's walk through some examples of using the Overview to monitor and troubleshoot your infrastructure. + +### Filter nodes and pick relevant times + +While not exclusive to Overview, you can use two important features, [node +filtering](https://learn.netdata.cloud/docs/cloud/war-rooms#node-filter) and the [time & date +picker](https://learn.netdata.cloud/docs/cloud/war-rooms#time--date-picker), to widen or narrow your infrastructure +monitoring focus. + +By default, the Overview shows composite charts aggregated from every node in the War Room, but you can change that +behavior on an ad-hoc basis. The node filter allows you to create complex queries against your infrastructure based on +the name, OS, or services running on nodes. For example, use `(name contains aws AND os contains ubuntu) OR services == +apache` to show only nodes that have `aws` in the hostname and are Ubuntu-based, or any nodes that have an Apache +webserver running on them. + +The time & date picker helps you visualize both small and large timeframes depending on your goals, whether that's +establishing a baseline of infrastructure performance or targeted root cause analysis of a specific anomaly. + +For example, use the **Quick Selector** options to pick the 12-hour option first thing in the morning to check your +infrastructure for any odd behavior overnight. Use the 7-day option to observe trends between various days of the week. + +See the [War Rooms](https://learn.netdata.cloud/docs/cloud/war-rooms) docs for more details on both features. + +### Configure composite charts to identify problems + +Let's say you notice a sharp decrease in available RAM for applications, as seen in the example screenshot below. In +this situation, you can see when the anomalous behavior began and that it affects the average available and committed +RAM across your infrastructure. However, when _grouped by dimension_, composite charts cannot show whether an anomaly +affects a single node, a subset of nodes, or an entire infrastructure. + + + +Use [_group by node_](https://learn.netdata.cloud/docs/cloud/visualize/overview#group-by-dimension-or-node) to visualize +a single metric across all contributing nodes. If the composite chart has 5 contributing nodes, there will be 5 +lines/areas, one for the most relevant dimension from each node. + + + +After grouping by node, it's clear that the `Composite-Charts-01` node is experiencing anomalous behavior and should be +investigated further by jumping to its [single-node dashboard](#drill-down-with-single-node-dashboards) in Netdata +Cloud. + +### Drill down with single-node dashboards + +Click on **X Charts** of any composite chart's definition bar to display a dropdown of contributing contexts and nodes +contributing. Click on the link icon <img class="img__inline img__inline--link" +src="https://user-images.githubusercontent.com/1153921/95762109-1d219300-0c62-11eb-8daa-9ba509a8e71c.png" /> next to a +given node to quickly _jump to the same chart in that node's single-node dashboard_ in Netdata Cloud. + + + +You can use single-node dashboards in Netdata Cloud to drill down on specific issues, scrub backward in time to +investigate historical data, and see like metrics presented meaningfully to help you troubleshoot performance problems. +All of the familiar [interactions](/docs/visualize/interact-dashboards-charts.md) are available, as is adding any chart +to a [new dashboard](/docs/visualize/create-dashboards.md). + +## Nodes view + +You can also use the **Nodes view** to monitor the health status and user-configurable key metrics from multiple nodes +in a War Room. Read the [Nodes view doc](https://learn.netdata.cloud/docs/cloud/visualize/nodes) for details. + + + +## What's next? + +To troubleshoot complex performance issues using Netdata, you need to understand how to interact with its meaningful +visualizations. Learn more about [interaction](/docs/visualize/interact-dashboards-charts.md) to see historical metrics, +highlight timeframes for targeted analysis, and more. + +### Related reference documentation + +- [Netdata Cloud · War Rooms](https://learn.netdata.cloud/docs/cloud/war-rooms) +- [Netdata Cloud · Overview](https://learn.netdata.cloud/docs/cloud/visualize/overview) +- [Netdata Cloud · Nodes view](https://learn.netdata.cloud/docs/cloud/visualize/nodes) + +[](<>) diff --git a/docs/what-is-netdata.md b/docs/what-is-netdata.md deleted file mode 100644 index e9b4d1598..000000000 --- a/docs/what-is-netdata.md +++ /dev/null @@ -1,418 +0,0 @@ -# What is Netdata? - -[](https://travis-ci.com/netdata/netdata) [](https://bestpractices.coreinfrastructure.org/projects/2231) [](https://www.gnu.org/licenses/gpl-3.0) [](<>) - -[](https://codeclimate.com/github/netdata/netdata) [](https://www.codacy.com/app/netdata/netdata?utm_source=github.com&utm_medium=referral&utm_content=netdata/netdata&utm_campaign=Badge_Grade) [](https://lgtm.com/projects/g/netdata/netdata/context:cpp) [](https://lgtm.com/projects/g/netdata/netdata/context:javascript) [](https://lgtm.com/projects/g/netdata/netdata/context:python) - ---- - -**Netdata** is **distributed, real-time, performance and health monitoring for systems and applications**. It is a highly optimized monitoring agent you install on all your systems and containers. - -Netdata provides **unparalleled insights**, **in real-time**, of everything happening on the systems it runs (including web servers, databases, applications), using **highly interactive web dashboards**. It can run autonomously, without any third party components, or it can be integrated to existing monitoring tool chains (Prometheus, Graphite, OpenTSDB, Kafka, Grafana, etc). - -_Netdata is **fast** and **efficient**, designed to permanently run on all systems (**physical** & **virtual** servers, **containers**, **IoT** devices), without disrupting their core function._ - -Netdata is **free, open-source software** and it currently runs on **Linux**, **FreeBSD**, and **MacOS**. - ---- - -## How it looks - -The following animated image, shows the top part of a typical Netdata dashboard. - - - -_A typical Netdata dashboard, in 1:1 timing. Charts can be panned by dragging them, zoomed in/out with `SHIFT` + `mouse wheel`, an area can be selected for zoom-in with `SHIFT` + `mouse selection`. Netdata is highly interactive and **real-time**, optimized to get the work done!_ - -> _We have a few online demos to experience it live: [https://www.netdata.cloud](https://www.netdata.cloud/#live-demo)_ - -## User base - -Netdata is used by hundreds of thousands of users all over the world. -Check our [GitHub watchers list](https://github.com/netdata/netdata/watchers). -You will find people working for **Amazon**, **Atos**, **Baidu**, **Cisco Systems**, **Citrix**, **Deutsche Telekom**, **DigitalOcean**, -**Elastic**, **EPAM Systems**, **Ericsson**, **Google**, **Groupon**, **Hortonworks**, **HP**, **Huawei**, -**IBM**, **Microsoft**, **NewRelic**, **Nvidia**, **Red Hat**, **SAP**, **Selectel**, **TicketMaster**, -**Vimeo**, and many more! - -### Docker pulls - -We provide docker images for the most common architectures. These are statistics reported by docker hub: - -[](https://hub.docker.com/r/netdata/netdata/) [](https://hub.docker.com/r/firehol/netdata/) [](https://hub.docker.com/r/titpetric/netdata/) - -### Registry - -When you install multiple Netdata, they are integrated into **one distributed application**, via a [Netdata registry](../registry/). This is a web browser feature and it allows us to count the number of unique users and unique Netdata servers installed. The following information comes from the global public Netdata registry we run: - -[](https://registry.my-netdata.io/#menu_netdata_submenu_registry) [](https://registry.my-netdata.io/#menu_netdata_submenu_registry) [](https://registry.my-netdata.io/#menu_netdata_submenu_registry) - -_in the last 24 hours:_<br/> [](https://registry.my-netdata.io/#menu_netdata_submenu_registry) [](https://registry.my-netdata.io/#menu_netdata_submenu_registry) [](https://registry.my-netdata.io/#menu_netdata_submenu_registry) - -## Why Netdata - -Netdata has a quite different approach to monitoring. - -Netdata is a monitoring agent you install on all your systems. It is: - -- a **metrics collector** - for system and application metrics (including web servers, databases, containers, etc) -- a **time-series database** - all stored in memory (does not touch the disks while it runs) -- a **metrics visualizer** - super fast, interactive, modern, optimized for anomaly detection -- an **alarms notification engine** - an advanced watchdog for detecting performance and availability issues - -All the above, are packaged together in a very flexible, extremely modular, distributed application. - -This is how Netdata compares to other monitoring solutions: - -| Netdata | others (open-source and commercial)| -|:-----:|:---------------------------------:| -| **High resolution metrics** (1s granularity)|Low resolution metrics (10s granularity at best)| -| Monitors everything, **thousands of metrics per node**|Monitor just a few metrics| -| UI is super fast, optimized for **anomaly detection**|UI is good for just an abstract view| -| **Meaningful presentation**, to help you understand the metrics|You have to know the metrics before you start| -| Install and get results **immediately**|Long preparation is required to get any useful results| -| Use it for **troubleshooting** performance problems|Use them to get *statistics of past performance*| -| **Kills the console** for tracing performance issues|The console is always required for troubleshooting| -| Requires **zero dedicated resources**|Require large dedicated resources| - -Netdata is **open-source**, **free**, super **fast**, very **easy**, completely **open**, extremely **efficient**, -**flexible** and integrate-able. - -It has been designed by **SysAdmins**, **DevOps** and **Developers** for troubleshooting performance problems, -not just visualize metrics. - -## How it works - -Netdata is a highly efficient, highly modular, metrics management engine. Its lockless design makes it ideal for concurrent operations on the metrics. - -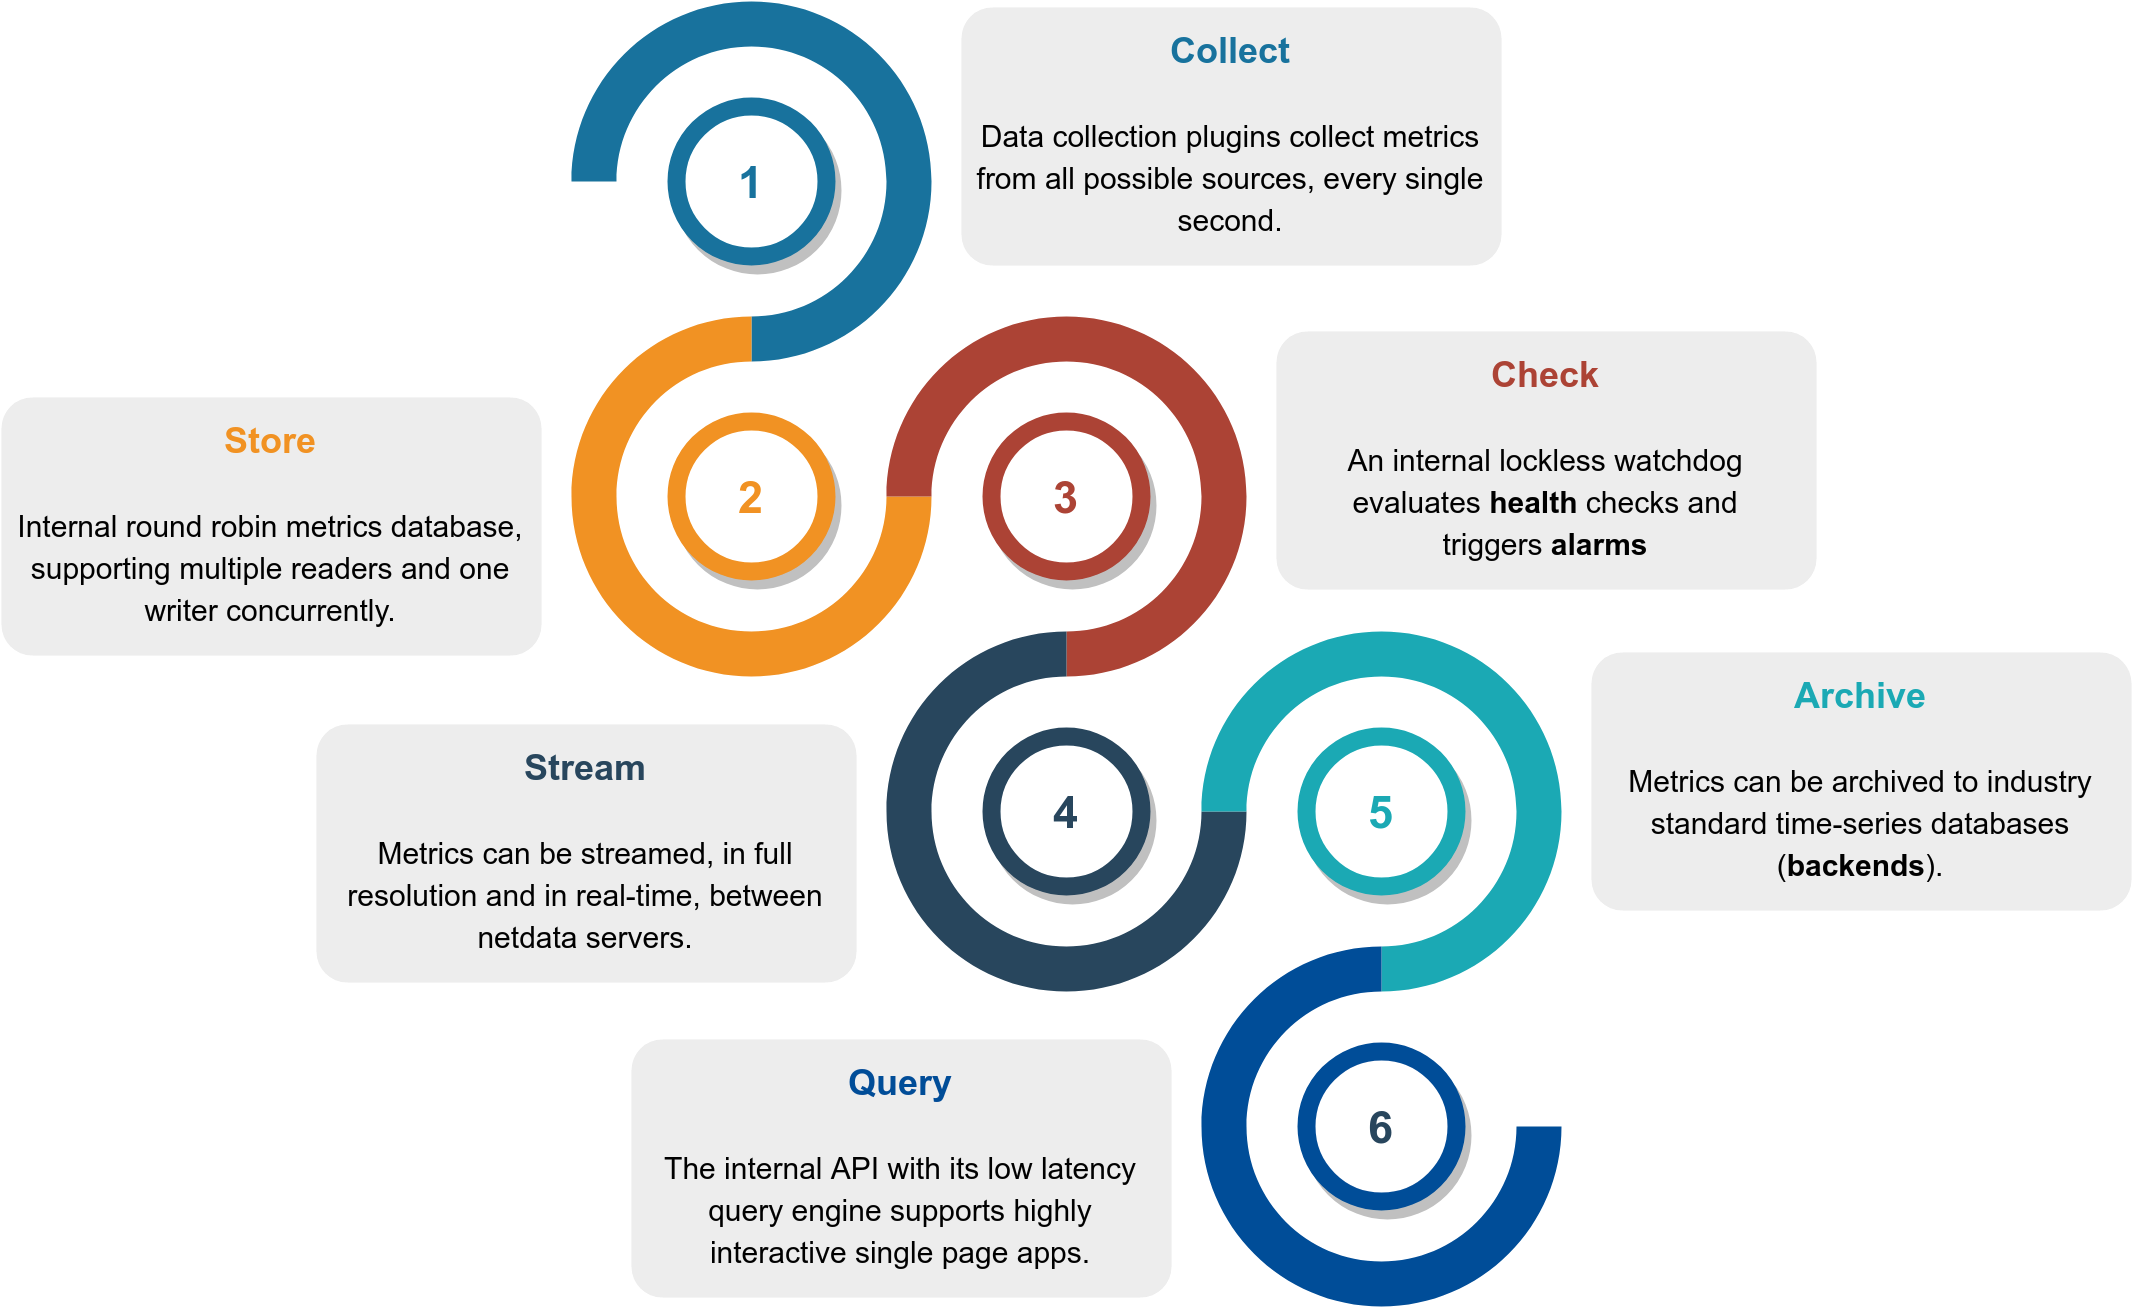 - -This is how it works: - -|Function|Description|Documentation| -|:------:|:----------|:-----------:| -|**Collect**|Multiple independent data collection workers are collecting metrics from their sources using the optimal protocol for each application and push the metrics to the database. Each data collection worker has lockless write access to the metrics it collects.|[`collectors`](../collectors/)| -|**Store**|Metrics are stored in RAM in a round robin database (ring buffer), using a custom made floating point number for minimal footprint.|[`database`](../database/)| -|**Check**|A lockless independent watchdog is evaluating **health checks** on the collected metrics, triggers alarms, maintains a health transaction log and dispatches alarm notifications.|[`health`](../health/)| -|**Stream**|An lockless independent worker is streaming metrics, in full detail and in real-time, to remote Netdata servers, as soon as they are collected.|[`streaming`](../streaming/)| -|**Archive**|A lockless independent worker is down-sampling the metrics and pushes them to **backend** time-series databases.|[`backends`](../backends/)| -|**Query**|Multiple independent workers are attached to the [internal web server](../web/server/), servicing API requests, including [data queries](../web/api/queries/README.md).|[`web/api`](../web/api/)| - -The result is a highly efficient, low latency system, supporting multiple readers and one writer on each metric. - -## Infographic - -This is a high level overview of Netdata feature set and architecture. -Click it to to interact with it (it has direct links to documentation). - -[](https://my-netdata.io/infographic.html) - -## Features - - - -This is what you should expect from Netdata: - -### General - -- **1s granularity** - the highest possible resolution for all metrics. -- **Unlimited metrics** - collects all the available metrics, the more the better. -- **1% CPU utilization of a single core** - it is super fast, unbelievably optimized. -- **A few MB of RAM** - by default it uses 25MB RAM. [You size it](../database). -- **Zero disk I/O** - while it runs, it does not load or save anything (except `error` and `access` logs). -- **Zero configuration** - auto-detects everything, it can collect up to 10000 metrics per server out of the box. -- **Zero maintenance** - You just run it, it does the rest. -- **Zero dependencies** - it is even its own web server, for its static web files and its web API (though its plugins may require additional libraries, depending on the applications monitored). -- **Scales to infinity** - you can install it on all your servers, containers, VMs and IoTs. Metrics are not centralized by default, so there is no limit. -- **Several operating modes** - Autonomous host monitoring (the default), headless data collector, forwarding proxy, store and forward proxy, central multi-host monitoring, in all possible configurations. Each node may have different metrics retention policy and run with or without health monitoring. - -### Health Monitoring & Alarms - -- **Sophisticated alerting** - comes with hundreds of alarms, **out of the box**! Supports dynamic thresholds, hysteresis, alarm templates, multiple role-based notification methods. -- **Notifications**: [alerta.io](../health/notifications/alerta/), [amazon sns](../health/notifications/awssns/), [discordapp.com](../health/notifications/discord/), [email](../health/notifications/email/), [flock.com](../health/notifications/flock/), [irc](../health/notifications/irc/), [kavenegar.com](../health/notifications/kavenegar/), [messagebird.com](../health/notifications/messagebird/), [pagerduty.com](../health/notifications/pagerduty/), [prowl](../health/notifications/prowl/), [pushbullet.com](../health/notifications/pushbullet/), [pushover.net](../health/notifications/pushover/), [rocket.chat](../health/notifications/rocketchat/), [slack.com](../health/notifications/slack/), [smstools3](../health/notifications/smstools3/), [syslog](../health/notifications/syslog/), [telegram.org](../health/notifications/telegram/), [twilio.com](../health/notifications/twilio/), [web](../health/notifications/web/) and [custom notifications](../health/notifications/custom/). - -### Integrations - -- **time-series dbs** - can archive its metrics to **Graphite**, **OpenTSDB**, **Prometheus**, **AWS Kinesis**, **JSON document DBs**, in the same or lower resolution (lower: to prevent it from congesting these servers due to the amount of data collected). Netdata also supports **Prometheus remote write API** which allows storing metrics to **Elasticsearch**, **Gnocchi**, **InfluxDB**, **Kafka**, **PostgreSQL/TimescaleDB**, **Splunk**, **VictoriaMetrics** and a lot of other [storage providers](https://prometheus.io/docs/operating/integrations/#remote-endpoints-and-storage). - -## Visualization - -- **Stunning interactive dashboards** - mouse, touchpad and touch-screen friendly in 2 themes: `slate` (dark) and `white`. -- **Amazingly fast visualization** - responds to all queries in less than 1 ms per metric, even on low-end hardware. -- **Visual anomaly detection** - the dashboards are optimized for detecting anomalies visually. -- **Embeddable** - its charts can be embedded on your web pages, wikis and blogs. You can even use [Atlassian's Confluence as a monitoring dashboard](../web/gui/confluence/). -- **Customizable** - custom dashboards can be built using simple HTML (no javascript necessary). - -### Positive and negative values - -To improve clarity on charts, Netdata dashboards present **positive** values for metrics representing `read`, `input`, `inbound`, `received` and **negative** values for metrics representing `write`, `output`, `outbound`, `sent`. - - - -*Netdata charts showing the bandwidth and packets of a network interface. `received` is positive and `sent` is negative.* - -### Autoscaled y-axis - -Netdata charts automatically zoom vertically, to visualize the variation of each metric within the visible time-frame. - - - -*A zero based `stacked` chart, automatically switches to an auto-scaled `area` chart when a single dimension is selected.* - -### Charts are synchronized - -Charts on Netdata dashboards are synchronized to each other. There is no master chart. Any chart can be panned or zoomed at any time, and all other charts will follow. - - - -_Charts are panned by dragging them with the mouse. Charts can be zoomed in/out with`SHIFT` + `mouse wheel` while the mouse pointer is over a chart._ - -> The visible time-frame (pan and zoom) is propagated from Netdata server to Netdata server, when navigating via the [node menu](../registry#registry). - -### Highlighted time-frame - -To improve visual anomaly detection across charts, the user can highlight a time-frame (by pressing `ALT` + `mouse selection`) on all charts. - - - -_A highlighted time-frame can be given by pressing `ALT` + `mouse selection` on any chart. Netdata will highlight the same range on all charts._ - -> Highlighted ranges are propagated from Netdata server to Netdata server, when navigating via the [node menu](../registry#registry). - -## What does it monitor - -Netdata data collection is **extensible** - you can monitor anything you can get a metric for. -Its [Plugin API](../collectors/plugins.d/) supports all programing languages (anything can be a Netdata plugin, BASH, python, perl, node.js, java, Go, ruby, etc). - -- For better performance, most system related plugins (cpu, memory, disks, filesystems, networking, etc) have been written in `C`. -- For faster development and easier contributions, most application related plugins (databases, web servers, etc) have been written in `python`. - -#### APM (Application Performance Monitoring) - -- **[statsd](../collectors/statsd.plugin/)** - Netdata is a fully featured statsd server. -- **[Go expvar](../collectors/python.d.plugin/go_expvar/)** - collects metrics exposed by applications written in the Go programming language using the expvar package. -- **[Spring Boot](../collectors/python.d.plugin/springboot/)** - monitors running Java Spring Boot applications that expose their metrics with the use of the Spring Boot Actuator included in Spring Boot library. -- **[uWSGI](../collectors/python.d.plugin/uwsgi/)** - collects performance metrics from uWSGI applications. - -#### System Resources - -- **[CPU Utilization](../collectors/proc.plugin/)** - total and per core CPU usage. -- **[Interrupts](../collectors/proc.plugin/)** - total and per core CPU interrupts. -- **[SoftIRQs](../collectors/proc.plugin/)** - total and per core SoftIRQs. -- **[SoftNet](../collectors/proc.plugin/)** - total and per core SoftIRQs related to network activity. -- **[CPU Throttling](../collectors/proc.plugin/)** - collects per core CPU throttling. -- **[CPU Frequency](../collectors/proc.plugin/)** - collects the current CPU frequency. -- **[CPU Idle](../collectors/proc.plugin/)** - collects the time spent per processor state. -- **[IdleJitter](../collectors/idlejitter.plugin/)** - measures CPU latency. -- **[Entropy](../collectors/proc.plugin/)** - random numbers pool, using in cryptography. -- **[Interprocess Communication - IPC](../collectors/proc.plugin/)** - such as semaphores and semaphores arrays. - -#### Memory - -- **[ram](../collectors/proc.plugin/)** - collects info about RAM usage. -- **[swap](../collectors/proc.plugin/)** - collects info about swap memory usage. -- **[available memory](../collectors/proc.plugin/)** - collects the amount of RAM available for userspace processes. -- **[committed memory](../collectors/proc.plugin/)** - collects the amount of RAM committed to userspace processes. -- **[Page Faults](../collectors/proc.plugin/)** - collects the system page faults (major and minor). -- **[writeback memory](../collectors/proc.plugin/)** - collects the system dirty memory and writeback activity. -- **[huge pages](../collectors/proc.plugin/)** - collects the amount of RAM used for huge pages. -- **[KSM](../collectors/proc.plugin/)** - collects info about Kernel Same Merging (memory dedupper). -- **[Numa](../collectors/proc.plugin/)** - collects Numa info on systems that support it. -- **[slab](../collectors/proc.plugin/)** - collects info about the Linux kernel memory usage. - -#### Disks - -- **[block devices](../collectors/proc.plugin/)** - per disk: I/O, operations, backlog, utilization, space, etc. -- **[BCACHE](../collectors/proc.plugin/)** - detailed performance of SSD caching devices. -- **[DiskSpace](../collectors/proc.plugin/)** - monitors disk space usage. -- **[mdstat](../collectors/proc.plugin/)** - software RAID. -- **[hddtemp](../collectors/python.d.plugin/hddtemp/)** - disk temperatures. -- **[smartd](../collectors/python.d.plugin/smartd_log/)** - disk S.M.A.R.T. values. -- **[device mapper](../collectors/proc.plugin/)** - naming disks. -- **[Veritas Volume Manager](../collectors/proc.plugin/)** - naming disks. -- **[megacli](../collectors/python.d.plugin/megacli/)** - adapter, physical drives and battery stats. -- **[adaptec_raid](../collectors/python.d.plugin/adaptec_raid/)** - logical and physical devices health metrics. -- **[ioping](../collectors/ioping.plugin/)** - to measure disk read/write latency. - -#### Filesystems - -- **[BTRFS](../collectors/proc.plugin/)** - detailed disk space allocation and usage. -- **[Ceph](../collectors/python.d.plugin/ceph/)** - OSD usage, Pool usage, number of objects, etc. -- **[NFS file servers and clients](../collectors/proc.plugin/)** - NFS v2, v3, v4: I/O, cache, read ahead, RPC calls -- **[Samba](../collectors/python.d.plugin/samba/)** - performance metrics of Samba SMB2 file sharing. -- **[ZFS](../collectors/proc.plugin/)** - detailed performance and resource usage. - -#### Networking - -- **[Network Stack](../collectors/proc.plugin/)** - everything about the networking stack (both IPv4 and IPv6 for all protocols: TCP, UDP, SCTP, UDPLite, ICMP, Multicast, Broadcast, etc), and all network interfaces (per interface: bandwidth, packets, errors, drops). -- **[Netfilter](../collectors/proc.plugin/)** - everything about the netfilter connection tracker. -- **[SynProxy](../collectors/proc.plugin/)** - collects performance data about the linux SYNPROXY (DDoS). -- **[NFacct](../collectors/nfacct.plugin/)** - collects accounting data from iptables. -- **[Network QoS](../collectors/tc.plugin/)** - the only tool that visualizes network `tc` classes in real-time -- **[FPing](../collectors/fping.plugin/)** - to measure latency and packet loss between any number of hosts. -- **[ISC dhcpd](../collectors/python.d.plugin/isc_dhcpd/)** - pools utilization, leases, etc. -- **[AP](../collectors/charts.d.plugin/ap/)** - collects Linux access point performance data (`hostapd`). -- **[SNMP](../collectors/node.d.plugin/snmp/)** - SNMP devices can be monitored too (although you will need to configure these). -- **[port_check](../collectors/python.d.plugin/portcheck/)** - checks TCP ports for availability and response time. - -#### Virtual Private Networks - -- **[OpenVPN](../collectors/python.d.plugin/ovpn_status_log/)** - collects status per tunnel. -- **[LibreSwan](../collectors/charts.d.plugin/libreswan/)** - collects metrics per IPSEC tunnel. -- **[Tor](../collectors/python.d.plugin/tor/)** - collects Tor traffic statistics. - -#### Processes - -- **[System Processes](../collectors/proc.plugin/)** - running, blocked, forks, active. -- **[Applications](../collectors/apps.plugin/)** - by grouping the process tree and reporting CPU, memory, disk reads, disk writes, swap, threads, pipes, sockets - per process group. -- **[systemd](../collectors/cgroups.plugin/)** - monitors systemd services using CGROUPS. - -#### Users - -- **[Users and User Groups resource usage](../collectors/apps.plugin/)** - by summarizing the process tree per user and group, reporting: CPU, memory, disk reads, disk writes, swap, threads, pipes, sockets -- **[logind](../collectors/python.d.plugin/logind/)** - collects sessions, users and seats connected. - -#### Containers and VMs - -- **[Containers](../collectors/cgroups.plugin/)** - collects resource usage for all kinds of containers, using CGROUPS (systemd-nspawn, lxc, lxd, docker, kubernetes, etc). -- **[libvirt VMs](../collectors/cgroups.plugin/)** - collects resource usage for all kinds of VMs, using CGROUPS. -- **[dockerd](../collectors/python.d.plugin/dockerd/)** - collects docker health metrics. - -#### Web Servers - -- **[Apache and lighttpd](../collectors/python.d.plugin/apache/)** - `mod-status` (v2.2, v2.4) and cache log statistics, for multiple servers. -- **[IPFS](../collectors/python.d.plugin/ipfs/)** - bandwidth, peers. -- **[LiteSpeed](../collectors/python.d.plugin/litespeed/)** - reads the litespeed rtreport files to collect metrics. -- **[Nginx](../collectors/python.d.plugin/nginx/)** - `stub-status`, for multiple servers. -- **[Nginx+](../collectors/python.d.plugin/nginx_plus/)** - connects to multiple nginx_plus servers (local or remote) to collect real-time performance metrics. -- **[PHP-FPM](../collectors/python.d.plugin/phpfpm/)** - multiple instances, each reporting connections, requests, performance, etc. -- **[Tomcat](../collectors/python.d.plugin/tomcat/)** - accesses, threads, free memory, volume, etc. -- **[web server `access.log` files](../collectors/python.d.plugin/web_log/)** - extracting in real-time, web server and proxy performance metrics and applying several health checks, etc. -- **[HTTP check](../collectors/python.d.plugin/httpcheck/)** - checks one or more web servers for HTTP status code and returned content. - -#### Proxies, Balancers, Accelerators - -- **[HAproxy](../collectors/python.d.plugin/haproxy/)** - bandwidth, sessions, backends, etc. -- **[Squid](../collectors/python.d.plugin/squid/)** - multiple servers, each showing: clients bandwidth and requests, servers bandwidth and requests. -- **[Traefik](../collectors/python.d.plugin/traefik/)** - connects to multiple traefik instances (local or remote) to collect API metrics (response status code, response time, average response time and server uptime). -- **[Varnish](../collectors/python.d.plugin/varnish/)** - threads, sessions, hits, objects, backends, etc. -- **[IPVS](../collectors/proc.plugin/)** - collects metrics from the Linux IPVS load balancer. - -#### Database Servers - -- **[CouchDB](../collectors/python.d.plugin/couchdb/)** - reads/writes, request methods, status codes, tasks, replication, per-db, etc. -- **[MemCached](../collectors/python.d.plugin/memcached/)** - multiple servers, each showing: bandwidth, connections, items, etc. -- **[MongoDB](../collectors/python.d.plugin/mongodb/)** - operations, clients, transactions, cursors, connections, asserts, locks, etc. -- **[MySQL and mariadb](../collectors/python.d.plugin/mysql/)** - multiple servers, each showing: bandwidth, queries/s, handlers, locks, issues, tmp operations, connections, binlog metrics, threads, innodb metrics, and more. -- **[PostgreSQL](../collectors/python.d.plugin/postgres/)** - multiple servers, each showing: per database statistics (connections, tuples read - written - returned, transactions, locks), backend processes, indexes, tables, write ahead, background writer and more. -- **[Proxy SQL](../collectors/python.d.plugin/proxysql/)** - collects Proxy SQL backend and frontend performance metrics. -- **[Redis](../collectors/python.d.plugin/redis/)** - multiple servers, each showing: operations, hit rate, memory, keys, clients, slaves. -- **[RethinkDB](../collectors/python.d.plugin/rethinkdbs/)** - connects to multiple rethinkdb servers (local or remote) to collect real-time metrics. - -#### Message Brokers - -- **[beanstalkd](../collectors/python.d.plugin/beanstalk/)** - global and per tube monitoring. -- **[RabbitMQ](../collectors/python.d.plugin/rabbitmq/)** - performance and health metrics. - -#### Search and Indexing - -- **[ElasticSearch](../collectors/python.d.plugin/elasticsearch/)** - search and index performance, latency, timings, cluster statistics, threads statistics, etc. - -#### DNS Servers - -- **[bind_rndc](../collectors/python.d.plugin/bind_rndc/)** - parses `named.stats` dump file to collect real-time performance metrics. All versions of bind after 9.6 are supported. -- **[dnsdist](../collectors/python.d.plugin/dnsdist/)** - performance and health metrics. -- **[ISC Bind (named)](../collectors/node.d.plugin/named/)** - multiple servers, each showing: clients, requests, queries, updates, failures and several per view metrics. All versions of bind after 9.9.10 are supported. -- **[NSD](../collectors/python.d.plugin/nsd/)** - queries, zones, protocols, query types, transfers, etc. -- **[PowerDNS](../collectors/python.d.plugin/powerdns/)** - queries, answers, cache, latency, etc. -- **[unbound](../collectors/python.d.plugin/unbound/)** - performance and resource usage metrics. -- **[dns_query_time](../collectors/python.d.plugin/dns_query_time/)** - DNS query time statistics. - -#### Time Servers - -- **[chrony](../collectors/python.d.plugin/chrony/)** - uses the `chronyc` command to collect chrony statistics (Frequency, Last offset, RMS offset, Residual freq, Root delay, Root dispersion, Skew, System time). -- **[ntpd](../collectors/python.d.plugin/ntpd/)** - connects to multiple ntpd servers (local or remote) to provide statistics of system variables and optional also peer variables. - -#### Mail Servers - -- **[Dovecot](../collectors/python.d.plugin/dovecot/)** - POP3/IMAP servers. -- **[Exim](../collectors/python.d.plugin/exim/)** - message queue (emails queued). -- **[Postfix](../collectors/python.d.plugin/postfix/)** - message queue (entries, size). - -#### Hardware Sensors - -- **[IPMI](../collectors/freeipmi.plugin/)** - enterprise hardware sensors and events. -- **[lm-sensors](../collectors/python.d.plugin/sensors/)** - temperature, voltage, fans, power, humidity, etc. -- **[Nvidia](../collectors/python.d.plugin/nvidia_smi/)** - collects information for Nvidia GPUs. -- **[RPi](../collectors/charts.d.plugin/sensors/)** - Raspberry Pi temperature sensors. -- **[w1sensor](../collectors/python.d.plugin/w1sensor/)** - collects data from connected 1-Wire sensors. - -#### UPSes - -- **[apcupsd](../collectors/charts.d.plugin/apcupsd/)** - load, charge, battery voltage, temperature, utility metrics, output metrics -- **[NUT](../collectors/charts.d.plugin/nut/)** - load, charge, battery voltage, temperature, utility metrics, output metrics -- **[Linux Power Supply](../collectors/proc.plugin/)** - collects metrics reported by power supply drivers on Linux. - -#### Social Sharing Servers - -- **[RetroShare](../collectors/python.d.plugin/retroshare/)** - connects to multiple retroshare servers (local or remote) to collect real-time performance metrics. - -#### Security - -- **[Fail2Ban](../collectors/python.d.plugin/fail2ban/)** - monitors the fail2ban log file to check all bans for all active jails. - -#### Authentication, Authorization, Accounting (AAA, RADIUS, LDAP) Servers - -- **[FreeRadius](../collectors/python.d.plugin/freeradius/)** - uses the `radclient` command to provide freeradius statistics (authentication, accounting, proxy-authentication, proxy-accounting). - -#### Telephony Servers - -- **[opensips](../collectors/charts.d.plugin/opensips/)** - connects to an opensips server (localhost only) to collect real-time performance metrics. - -#### Household Appliances - -- **[SMA webbox](../collectors/node.d.plugin/sma_webbox/)** - connects to multiple remote SMA webboxes to collect real-time performance metrics of the photovoltaic (solar) power generation. -- **[Fronius](../collectors/node.d.plugin/fronius/)** - connects to multiple remote Fronius Symo servers to collect real-time performance metrics of the photovoltaic (solar) power generation. -- **[StiebelEltron](../collectors/node.d.plugin/stiebeleltron/)** - collects the temperatures and other metrics from your Stiebel Eltron heating system using their Internet Service Gateway (ISG web). - -#### Game Servers - -- **[SpigotMC](../collectors/python.d.plugin/spigotmc/)** - monitors Spigot Minecraft server ticks per second and number of online players using the Minecraft remote console. - -#### Distributed Computing - -- **[BOINC](../collectors/python.d.plugin/boinc/)** - monitors task states for local and remote BOINC client software using the remote GUI RPC interface. Also provides alarms for a handful of error conditions. - -#### Media Streaming Servers - -- **[IceCast](../collectors/python.d.plugin/icecast/)** - collects the number of listeners for active sources. - -### Monitoring Systems - -- **[Monit](../collectors/python.d.plugin/monit/)** - collects metrics about monit targets (filesystems, applications, networks). - -#### Provisioning Systems - -- **[Puppet](../collectors/python.d.plugin/puppet/)** - connects to multiple Puppet Server and Puppet DB instances (local or remote) to collect real-time status metrics. - -You can easily extend Netdata, by writing plugins that collect data from any source, using any computer language. - -## Community - -We welcome [contributions](../CONTRIBUTING.md). So, feel free to join the team. - -To report bugs, or get help, use [GitHub Issues](https://github.com/netdata/netdata/issues). - -You can also find Netdata on: - -- [Facebook](https://www.facebook.com/linuxnetdata/) -- [Twitter](https://twitter.com/linuxnetdata) -- [OpenHub](https://www.openhub.net/p/netdata) -- [Repology](https://repology.org/metapackage/netdata/versions) -- [StackShare](https://stackshare.io/netdata) - -## License - -Netdata is [GPLv3+](../LICENSE). - -Netdata re-distributes other open-source tools and libraries. Please check the [third party licenses](../REDISTRIBUTED.md). diff --git a/docs/why-netdata/1s-granularity.md b/docs/why-netdata/1s-granularity.md index 195a0d8f0..a2cc65b8f 100644 --- a/docs/why-netdata/1s-granularity.md +++ b/docs/why-netdata/1s-granularity.md @@ -1,3 +1,8 @@ +<!-- +title: "1s granularity" +custom_edit_url: https://github.com/netdata/netdata/edit/master/docs/why-netdata/1s-granularity.md +--> + # 1s granularity High resolution metrics are required to effectively monitor and troubleshoot systems and applications. diff --git a/docs/why-netdata/README.md b/docs/why-netdata/README.md index 1003b07a4..39cda51e2 100644 --- a/docs/why-netdata/README.md +++ b/docs/why-netdata/README.md @@ -1,3 +1,8 @@ +<!-- +title: "Why Netdata" +custom_edit_url: https://github.com/netdata/netdata/edit/master/docs/why-netdata/README.md +--> + # Why Netdata > Any performance monitoring solution that does not go down to per second @@ -6,19 +11,19 @@ Netdata is built around 4 principles: -1. **[Per second data collection for all metrics.](1s-granularity.md)** +1. **[Per second data collection for all metrics.](/docs/why-netdata/1s-granularity.md)** _It is impossible to monitor a 2 second SLA, with 10 second metrics._ -2. **[Collect and visualize all the metrics from all possible sources.](unlimited-metrics.md)** +2. **[Collect and visualize all the metrics from all possible sources.](/docs/why-netdata/unlimited-metrics.md)** _To troubleshoot slowdowns, we need all the available metrics. The console should not provide more metrics._ -3. **[Meaningful presentation, optimized for visual anomaly detection.](meaningful-presentation.md)** +3. **[Meaningful presentation, optimized for visual anomaly detection.](/docs/why-netdata/meaningful-presentation.md)** _Metrics are a lot more than name-value pairs over time. The monitoring tool should know all the metrics. Users should not!_ -4. **[Immediate results, just install and use.](immediate-results.md)** +4. **[Immediate results, just install and use.](/docs/why-netdata/immediate-results.md)** _Most of our infrastructure is standardized. There is no point to configure everything metric by metric._ diff --git a/docs/why-netdata/immediate-results.md b/docs/why-netdata/immediate-results.md index f1f452ca4..ba7c7d684 100644 --- a/docs/why-netdata/immediate-results.md +++ b/docs/why-netdata/immediate-results.md @@ -1,3 +1,8 @@ +<!-- +title: "Immediate results" +custom_edit_url: https://github.com/netdata/netdata/edit/master/docs/why-netdata/immediate-results.md +--> + # Immediate results Most of our infrastructure is based on standardized systems and applications. diff --git a/docs/why-netdata/meaningful-presentation.md b/docs/why-netdata/meaningful-presentation.md index 2623d152a..64d83b4f6 100644 --- a/docs/why-netdata/meaningful-presentation.md +++ b/docs/why-netdata/meaningful-presentation.md @@ -1,3 +1,8 @@ +<!-- +title: "Meaningful presentation" +custom_edit_url: https://github.com/netdata/netdata/edit/master/docs/why-netdata/meaningful-presentation.md +--> + # Meaningful presentation Metrics are a lot more than name-value pairs over time. It is just not practical to require from all users to have a deep understanding of all metrics for monitoring their systems and applications. @@ -26,7 +31,7 @@ The monitoring industry believes there is this "IT Operations Hero", a person co 1. Has a deep understanding of IT architectures and is a skillful SysAdmin. 2. Is a superb Network Administrator (can even read and understand the Linux kernel networking stack). -3. Is a exceptional database administrator. +3. Is an exceptional database administrator. 4. Is fluent in software engineering, capable of understanding the internal workings of applications. 5. Masters Data Science, statistical algorithms and is fluent in writing advanced mathematical queries to reveal the meaning of metrics. diff --git a/docs/why-netdata/unlimited-metrics.md b/docs/why-netdata/unlimited-metrics.md index 827138ff1..8e50062c7 100644 --- a/docs/why-netdata/unlimited-metrics.md +++ b/docs/why-netdata/unlimited-metrics.md @@ -1,3 +1,8 @@ +<!-- +title: "Unlimited metrics" +custom_edit_url: https://github.com/netdata/netdata/edit/master/docs/why-netdata/unlimited-metrics.md +--> + # Unlimited metrics All metrics are important and all metrics should be available when you need them. |