
diff options
| author | Daniel Baumann <daniel.baumann@progress-linux.org> | 2019-02-08 07:31:03 +0000 |
|---|---|---|
| committer | Daniel Baumann <daniel.baumann@progress-linux.org> | 2019-02-08 07:31:03 +0000 |
| commit | 50485bedfd9818165aa1d039d0abe95a559134b7 (patch) | |
| tree | 79c7b08f67edcfb0c936e7a22931653b91189b9f /docs | |
| parent | Releasing debian version 1.11.1+dfsg-7. (diff) | |
| download | netdata-50485bedfd9818165aa1d039d0abe95a559134b7.tar.xz netdata-50485bedfd9818165aa1d039d0abe95a559134b7.zip | |
Merging upstream version 1.12.0.
Signed-off-by: Daniel Baumann <daniel.baumann@progress-linux.org>
Diffstat (limited to 'docs')
34 files changed, 3400 insertions, 0 deletions
diff --git a/docs/Add-more-charts-to-netdata.md b/docs/Add-more-charts-to-netdata.md new file mode 100644 index 000000000..95efd70bd --- /dev/null +++ b/docs/Add-more-charts-to-netdata.md @@ -0,0 +1,438 @@ +# Add more charts to netdata + +netdata collects system metrics by itself. It has many [internal plugins](../collectors) for collecting most of the metrics presented by default when it starts, collecting data from `/proc`, `/sys` and other Linux kernel sources. + +To collect non-system metrics, netdata supports a plugin architecture. The following are the currently available external plugins: + +- **[Web Servers](#web-servers)**, such as apache, nginx, nginx_plus, tomcat, litespeed +- **[Web Logs](#web-log-parsers)**, such as apache, nginx, lighttpd, gunicorn, squid access logs, apache cache.log +- **[Load Balancers](#load-balancers)**, like haproxy +- **[Message Brokers](#message-brokers)**, like rabbitmq, beanstalkd +- **[Database Servers](#database-servers)**, such as mysql, mariadb, postgres, couchdb, mongodb, rethinkdb +- **[Social Sharing Servers](#social-sharing-servers)**, like retroshare +- **[Proxy Servers](#proxy-servers)**, like squid +- **[HTTP accelerators](#http-accelerators)**, like varnish cache +- **[Search engines](#search-engines)**, like elasticsearch +- **[Name Servers](#name-servers)** (DNS), like bind, nsd, powerdns, dnsdist +- **[DHCP Servers](#dhcp-servers)**, like ISC DHCP +- **[UPS](#ups)**, such as APC UPS, NUT +- **[RAID](#raid)**, such as linux software raid (mdadm), MegaRAID +- **[Mail Servers](#mail-servers)**, like postfix, exim, dovecot +- **[File Servers](#file-servers)**, like samba, NFS, ftp, sftp, WebDAV +- **[Print Servers](#print-servers)**, like CUPS +- **[System](#system)**, for processes and other system metrics +- **[Sensors](#sensors)**, like temperature, fans speed, voltage, humidity, HDD/SSD S.M.A.R.T attributes +- **[Network](#network)**, such as SNMP devices, `fping`, access points, dns_query_time +- **[Time Servers](#time-servers)**, like chrony +- **[Security](#security)**, like FreeRADIUS, OpenVPN, Fail2ban +- **[Telephony Servers](#telephony-servers)**, like openSIPS +- **[Go applications](#go-applications)** +- **[Household appliances](#household-appliances)**, like SMA WebBox (solar power), Fronius Symo solar power, Stiebel Eltron heating +- **[Java Processes](#java-processes)**, via JMX or Spring Boot Actuator +- **[Provisioning Systems](#provisioning-systems)**, like Puppet +- **[Game Servers](#game-servers)**, like SpigotMC +- **[Distributed Computing Clients](#distributed-computing-clients)**, like BOINC +- **[Skeleton Plugins](#skeleton-plugins)**, for writing your own data collectors + +Check also [Third Party Plugins](Third-Party-Plugins.md) for a list of plugins distributed by third parties. + +## configuring plugins + +netdata comes with **internal** and **external** plugins: + +1. The **internal** ones are written in `C` and run as threads within the netdata daemon. +2. The **external** ones can be written in any computer language. The netdata daemon spawns these as processes (shown with `ps fax`) and reads their metrics using pipes (so the `stdout` of external plugins is connected to netdata for metrics collection and the `stderr` of external plugins is connected to `/var/log/netdata/error.log`). + +To make it easier to develop plugins, and minimize the number of threads and processes running, netdata supports **plugin orchestrators**, each of them supporting one or more data collection **modules**. Currently we ship plugin orchestrators for 4 languages: `C`, `python`, `node.js` and `bash` and 2 more are under development (`go` and `java`). + +#### enabling and disabling plugins + +To control which plugins netdata run, edit `netdata.conf` and check the `[plugins]` section. It looks like this: + +``` +[plugins] + # enable running new plugins = yes + # check for new plugins every = 60 + # proc = yes + # diskspace = yes + # cgroups = yes + # cups = yes + # tc = yes + # nfacct = yes + # idlejitter = yes + # freeipmi = yes + # node.d = yes + # python.d = yes + # fping = yes + # charts.d = yes + # apps = yes +``` + +The default for all plugins is the option `enable running new plugins`. So, setting this to `no` will disable all the plugins, except the ones specifically enabled. + +#### enabling and disabling modules + +Each of the **plugins** may support one or more data collection **modules**. To control which of its modules run, you have to consult the configuration of the **plugin** (see table below). + +#### modules configuration + +Most **modules** come with **auto-detection**, configured to work out-of-the-box on popular operating systems with the default settings. + +However, there are cases that auto-detection fails. Usually the reason is that the applications to be monitored do not allow netdata to connect. In most of the cases, allowing the user `netdata` from `localhost` to connect and collect metrics, will automatically enable data collection for the application in question (it will require a netdata restart). + +You can verify netdata **external plugins and their modules** are able to collect metrics, following this procedure: + +```sh +# become user netdata +sudo su -s /bin/bash netdata + +# execute the plugin in debug mode, for a specific module. +# example for the python plugin, mysql module: +/usr/libexec/netdata/plugins.d/python.d.plugin 1 debug trace mysql +``` + +Similarly, you can use `charts.d.plugin` for BASH plugins and `node.d.plugin` for node.js plugins. +Other plugins (like `apps.plugin`, `freeipmi.plugin`, `fping.plugin`) use the native netdata plugin API and can be run directly. + +If you need to configure a netdata plugin or module, all user supplied configuration is kept at `/etc/netdata` while the stock versions of all files is at `/usr/lib/netdata/conf.d`. +To copy a stock file and edit it, run `/etc/netdata/edit-config`. Running this command without an argument, will list the available stock files. + +Each file should provide plenty of examples and documentation about each module and plugin. + +This is a map of the all supported configuration options: + +#### map of configuration files + +plugin | language | plugin<br/>configuration | modules<br/>configuration | +---:|:---:|:---:|:---| +`apps.plugin`<br/>(external plugin for monitoring the process tree on Linux and FreeBSD)|`C`|`netdata.conf` section `[plugin:apps]`|Custom configuration for the processes to be monitored at `apps_groups.conf` +`freebsd.plugin`<br/>(internal plugin for monitoring FreeBSD system resources)|`C`|`netdata.conf` section `[plugin:freebsd]`|one section for each module `[plugin:freebsd:MODULE]`. Each module may provide additional sections in the form of `[plugin:freebsd:MODULE:SUBSECTION]`. +`cgroups.plugin`<br/>(internal plugin for monitoring Linux containers, VMs and systemd services)|`C`|`netdata.conf` section `[plugin:cgroups]`|N/A +`charts.d.plugin`<br/>(external plugin orchestrator for BASH modules)|`BASH`|`charts.d.conf`|a file for each module in `/etc/netdata/charts.d/` +`diskspace.plugin`<br/>(internal plugin for collecting Linux mount points usage)|`C`|`netdata.conf` section `[plugin:diskspace]`|N/A +`fping.plugin`<br/>(external plugin for collecting network latencies)|`C`|`fping.conf`|This plugin is a wrapper for the `fping` command. +`freeipmi.plugin`<br/>(external plugin for collecting IPMI h/w sensors)|`C`|`netdata.conf` section `[plugin:freeipmi]` +`idlejitter.plugin`<br/>(internal plugin for monitoring CPU jitter)|`C`|N/A|N/A +`macos.plugin`<br/>(internal plugin for monitoring MacOS system resources)|`C`|`netdata.conf` section `[plugin:macos]`|one section for each module `[plugin:macos:MODULE]`. Each module may provide additional sections in the form of `[plugin:macos:MODULE:SUBSECTION]`. +`node.d.plugin`<br/>(external plugin orchestrator of node.js modules)|`node.js`|`node.d.conf`|a file for each module in `/etc/netdata/node.d/`. +`proc.plugin`<br/>(internal plugin for monitoring Linux system resources)|`C`|`netdata.conf` section `[plugin:proc]`|one section for each module `[plugin:proc:MODULE]`. Each module may provide additional sections in the form of `[plugin:proc:MODULE:SUBSECTION]`. +`python.d.plugin`<br/>(external plugin orchestrator for running python modules)|`python`<br/>v2 or v3<br/>both are supported|`python.d.conf`|a file for each module in `/etc/netdata/python.d/`. +`statsd.plugin`<br/>(internal plugin for collecting statsd metrics)|`C`|`netdata.conf` section `[statsd]`|Synthetic statsd charts can be configured with files in `/etc/netdata/statsd.d/`. +`tc.plugin`<br/>(internal plugin for collecting Linux traffic QoS)|`C`|`netdata.conf` section `[plugin:tc]`|The plugin runs an external helper called `tc-qos-helper.sh` to interface with the `tc` command. This helper supports a few additional options using `tc-qos-helper.conf`. + + +## writing data collection modules + +You can add custom plugins following the [External Plugins Guide](../collectors/plugins.d/). + +--- + +## available data collection modules + +These are all the data collection plugins currently available. + +### Web Servers + +application|language|notes| +:---------:|:------:|:----| +apache|python<br/>v2 or v3|Connects to multiple apache servers (local or remote) to collect real-time performance metrics.<br/> <br/>netdata plugin: [python.d.plugin](../collectors/python.d.plugin)<br/>plugin module: [apache.chart.py](../collectors/python.d.plugin/apache)<br/>configuration file: [python.d/apache.conf](../collectors/python.d.plugin/apache)| +apache|BASH<br/>Shell Script|Connects to an apache server (local or remote) to collect real-time performance metrics.<br/><br/>DEPRECATED IN FAVOR OF THE PYTHON ONE. It is still supplied only as an example module to shell scripting plugins.<br/> <br/>netdata plugin: [charts.d.plugin](../collectors/charts.d.plugin#chartsdplugin)<br/>plugin module: [apache.chart.sh](../collectors/charts.d.plugin/apache)<br/>configuration file: [charts.d/apache.conf](../collectors/charts.d.plugin/apache)| +ipfs|python<br/>v2 or v3|Connects to multiple ipfs servers (local or remote) to collect real-time performance metrics.<br/> <br/>netdata plugin: [python.d.plugin](../collectors/python.d.plugin)<br/>plugin module: [ipfs.chart.py](../collectors/python.d.plugin/ipfs)<br/>configuration file: [python.d/ipfs.conf](../collectors/python.d.plugin/ipfs)| +litespeed|python<br/>v2 or v3|reads the litespeed `rtreport` files to collect metrics.<br/> <br/>netdata plugin: [python.d.plugin](../collectors/python.d.plugin)<br/>plugin module: [litespeed.chart.py](../collectors/python.d.plugin/litespeed)<br/>configuration file: [python.d/litespeed.conf](../collectors/python.d.plugin/litespeed) +nginx|python<br/>v2 or v3|Connects to multiple nginx servers (local or remote) to collect real-time performance metrics.<br/> <br/>netdata plugin: [python.d.plugin](../collectors/python.d.plugin)<br/>plugin module: [nginx.chart.py](../collectors/python.d.plugin/nginx)<br/>configuration file: [python.d/nginx.conf](../collectors/python.d.plugin/nginx)| +nginx_plus|python<br/>v2 or v3|Connects to multiple nginx_plus servers (local or remote) to collect real-time performance metrics.<br/> <br/>netdata plugin: [python.d.plugin](../collectors/python.d.plugin)<br/>plugin module: [nginx_plus.chart.py](../collectors/python.d.plugin/nginx_plus)<br/>configuration file: [python.d/nginx_plus.conf](../collectors/python.d.plugin/nginx_plus)| +nginx|BASH<br/>Shell Script|Connects to an nginx server (local or remote) to collect real-time performance metrics.<br/><br/>DEPRECATED IN FAVOR OF THE PYTHON ONE. It is still supplied only as an example module to shell scripting plugins.<br/> <br/>netdata plugin: [charts.d.plugin](../collectors/charts.d.plugin#chartsdplugin)<br/>plugin module: [nginx.chart.sh](../collectors/charts.d.plugin/nginx)<br/>configuration file: [charts.d/nginx.conf](../collectors/charts.d.plugin/nginx)| +phpfpm|python<br/>v2 or v3|Connects to multiple phpfpm servers (local or remote) to collect real-time performance metrics.<br/> <br/>netdata plugin: [python.d.plugin](../collectors/python.d.plugin)<br/>plugin module: [phpfpm.chart.py](../collectors/python.d.plugin/phpfpm)<br/>configuration file: [python.d/phpfpm.conf](../collectors/python.d.plugin/phpfpm)| +phpfpm|BASH<br/>Shell Script|Connects to one or more phpfpm servers (local or remote) to collect real-time performance metrics.<br/><br/>DEPRECATED IN FAVOR OF THE PYTHON ONE. It is still supplied only as an example module to shell scripting plugins.<br/> <br/>netdata plugin: [charts.d.plugin](../collectors/charts.d.plugin#chartsdplugin)<br/>plugin module: [phpfpm.chart.sh](../collectors/charts.d.plugin/phpfpm)<br/>configuration file: [charts.d/phpfpm.conf](../collectors/charts.d.plugin/phpfpm)| +tomcat|python<br/>v2 or v3|Connects to multiple tomcat servers (local or remote) to collect real-time performance metrics.<br/> <br/>netdata plugin: [python.d.plugin](../collectors/python.d.plugin)<br/>plugin module: [tomcat.chart.py](../collectors/python.d.plugin/tomcat)<br/>configuration file: [python.d/tomcat.conf](../collectors/python.d.plugin/tomcat)| +tomcat|BASH<br/>Shell Script|Connects to a tomcat server (local or remote) to collect real-time performance metrics.<br/><br/>DEPRECATED IN FAVOR OF THE PYTHON ONE. It is still supplied only as an example module to shell scripting plugins.<br/> <br/>netdata plugin: [charts.d.plugin](../collectors/charts.d.plugin#chartsdplugin)<br/>plugin module: [tomcat.chart.sh](../collectors/charts.d.plugin/tomcat)<br/>configuration file: [charts.d/tomcat.conf](../collectors/charts.d.plugin/tomcat)| + + +--- + +### Web Log Parsers + +application|language|notes| +:---------:|:------:|:----| +web_log|python<br/>v2 or v3|powerful plugin, capable of incrementally parsing any number of web server log files <br/> <br/>netdata plugin: [python.d.plugin](../collectors/python.d.plugin)<br/>plugin module: [web_log.chart.py](../collectors/python.d.plugin/web_log)<br/>configuration file: [python.d/web_log.conf](../collectors/python.d.plugin/web_log)| + + +--- + +### Database Servers + +application|language|notes| +:---------:|:------:|:----| +couchdb|python<br/>v2 or v3|Connects to multiple couchdb servers (local or remote) to collect real-time performance metrics.<br/> <br/>netdata plugin: [python.d.plugin](../collectors/python.d.plugin)<br/>plugin module: [couchdb.chart.py](../collectors/python.d.plugin/couchdb)<br/>configuration file: [python.d/couchdb.conf](../collectors/python.d.plugin/couchdb)| +memcached|python<br/>v2 or v3|Connects to multiple memcached servers (local or remote) to collect real-time performance metrics.<br/> <br/>netdata plugin: [python.d.plugin](../collectors/python.d.plugin)<br/>plugin module: [memcached.chart.py](../collectors/python.d.plugin/memcached)<br/>configuration file: [python.d/memcached.conf](../collectors/python.d.plugin/memcached)| +mongodb|python<br/>v2 or v3|Connects to multiple `mongodb` servers (local or remote) to collect real-time performance metrics.<br/> <br/>Requires package `python-pymongo`.<br/> <br/>netdata plugin: [python.d.plugin](../collectors/python.d.plugin)<br/>plugin module: [mongodb.chart.py](../collectors/python.d.plugin/mongodb)<br/>configuration file: [python.d/mongodb.conf](../collectors/python.d.plugin/mongodb)| +mysql<br/>mariadb|python<br/>v2 or v3|Connects to multiple mysql or mariadb servers (local or remote) to collect real-time performance metrics.<br/> <br/>Requires package `python-mysqldb` (faster and preferred), or `python-pymysql`. <br/> <br/>netdata plugin: [python.d.plugin](../collectors/python.d.plugin)<br/>plugin module: [mysql.chart.py](../collectors/python.d.plugin/mysql)<br/>configuration file: [python.d/mysql.conf](../collectors/python.d.plugin/mysql)| +mysql<br/>mariadb|BASH<br/>Shell Script|Connects to multiple mysql or mariadb servers (local or remote) to collect real-time performance metrics.<br/><br/>DEPRECATED IN FAVOR OF THE PYTHON ONE. It is still supplied only as an example module to shell scripting plugins.<br/> <br/>netdata plugin: [charts.d.plugin](../collectors/charts.d.plugin#chartsdplugin)<br/>plugin module: [mysql.chart.sh](../collectors/charts.d.plugin/mysql)<br/>configuration file: [charts.d/mysql.conf](../collectors/charts.d.plugin/mysql)| +postgres|python<br/>v2 or v3|Connects to multiple postgres servers (local or remote) to collect real-time performance metrics.<br/> <br/>Requires package `python-psycopg2`.<br/> <br/>netdata plugin: [python.d.plugin](../collectors/python.d.plugin)<br/>plugin module: [postgres.chart.py](../collectors/python.d.plugin/postgres)<br/>configuration file: [python.d/postgres.conf](../collectors/python.d.plugin/postgres)| +redis|python<br/>v2 or v3|Connects to multiple redis servers (local or remote) to collect real-time performance metrics.<br/> <br/>netdata plugin: [python.d.plugin](../collectors/python.d.plugin)<br/>plugin module: [redis.chart.py](../collectors/python.d.plugin/redis)<br/>configuration file: [python.d/redis.conf](../collectors/python.d.plugin/redis)| +rethinkdb|python<br/>v2 or v3|Connects to multiple rethinkdb servers (local or remote) to collect real-time metrics.<br/> <br/>netdata plugin: [python.d.plugin](../collectors/python.d.plugin)<br/>plugin module: [rethinkdb.chart.py](../collectors/python.d.plugin/rethinkdbs)<br/>configuration file: [python.d/rethinkdb.conf](../collectors/python.d.plugin/rethinkdbs)| + + +--- + +### Social Sharing Servers + +application|language|notes| +:---------:|:------:|:----| +retroshare|python<br/>v2 or v3|Connects to multiple retroshare servers (local or remote) to collect real-time performance metrics.<br/> <br/>netdata plugin: [python.d.plugin](../collectors/python.d.plugin)<br/>plugin module: [retroshare.chart.py](../collectors/python.d.plugin/retroshare)<br/>configuration file: [python.d/retroshare.conf](../collectors/python.d.plugin/retroshare)| + + +--- + +### Proxy Servers + +application|language|notes| +:---------:|:------:|:----| +squid|python<br/>v2 or v3|Connects to multiple squid servers (local or remote) to collect real-time performance metrics.<br/> <br/>netdata plugin: [python.d.plugin](../collectors/python.d.plugin)<br/>plugin module: [squid.chart.py](../collectors/python.d.plugin/squid)<br/>configuration file: [python.d/squid.conf](../collectors/python.d.plugin/squid)| +squid|BASH<br/>Shell Script|Connects to a squid server (local or remote) to collect real-time performance metrics.<br/><br/>DEPRECATED IN FAVOR OF THE PYTHON ONE. It is still supplied only as an example module to shell scripting plugins.<br/> <br/>netdata plugin: [charts.d.plugin](../collectors/charts.d.plugin#chartsdplugin)<br/>plugin module: [squid.chart.sh](../collectors/charts.d.plugin/squid)<br/>configuration file: [charts.d/squid.conf](../collectors/charts.d.plugin/squid)| + + +--- + +### HTTP Accelerators + +application|language|notes| +:---------:|:------:|:----| +varnish|python<br/>v2 or v3|Uses the varnishstat command to provide varnish cache statistics (client metrics, cache perfomance, thread-related metrics, backend health, memory usage etc.).<br/> <br/>netdata plugin: [python.d.plugin](../collectors/python.d.plugin)<br/>plugin module: [varnish.chart.py](../collectors/python.d.plugin/varnish)<br/>configuration file: [python.d/varnish.conf](../collectors/python.d.plugin/varnish)| + + +--- + +### Search Engines + +application|language|notes| +:---------:|:------:|:----| +elasticsearch|python<br/>v2 or v3|Monitor elasticsearch performance and health metrics.<br/> <br/>netdata plugin: [python.d.plugin](../collectors/python.d.plugin)<br/>plugin module: [elasticsearch.chart.py](../collectors/python.d.plugin/elasticsearch)<br/>configuration file: [python.d/elasticsearch.conf](../collectors/python.d.plugin/elasticsearch)| + + +--- + +### Name Servers + +application|language|notes| +:---------:|:------:|:----| +named|node.js|Connects to multiple named (ISC-Bind) servers (local or remote) to collect real-time performance metrics. All versions of bind after 9.9.10 are supported.<br/> <br/>netdata plugin: [node.d.plugin](../collectors/node.d.plugin#nodedplugin)<br/>plugin module: [named.node.js](../collectors/node.d.plugin/named)<br/>configuration file: [node.d/named.conf](../collectors/node.d.plugin/named)| +bind_rndc|python<br/>v2 or v3|Parses named.stats dump file to collect real-time performance metrics. All versions of bind after 9.6 are supported.<br/> <br/>netdata plugin: [python.d.plugin](../collectors/python.d.plugin)<br/>plugin module: [bind_rndc.chart.py](../collectors/python.d.plugin/bind_rndc)<br/>configuration file: [python.d/bind_rndc.conf](../collectors/python.d.plugin/bind_rndc)| +nsd|python<br/>v2 or v3|Charts the nsd received queries and zones.<br/> <br/>netdata plugin: [python.d.plugin](../collectors/python.d.plugin)<br/>plugin module: [nsd.chart.py](../collectors/python.d.plugin/nsd)<br/>configuration file: [python.d/nsd.conf](../collectors/python.d.plugin/nsd) +powerdns|python<br/>v2 or v3|Monitors powerdns performance and health metrics <br/> <br/>netdata plugin: [python.d.plugin](../collectors/python.d.plugin)<br/>plugin module: [powerdns.chart.py](../collectors/python.d.plugin/powerdns)<br/>configuration file: [python.d/powerdns.conf](../collectors/python.d.plugin/powerdns)| +dnsdist|python<br/>v2 or v3|Monitors dnsdist performance and health metrics <br/> <br/>netdata plugin: [python.d.plugin](../collectors/python.d.plugin)<br/>plugin module: [dnsdist.chart.py](../collectors/python.d.plugin/dnsdist)<br/>configuration file: [python.d/dnsdist.conf](../collectors/python.d.plugin/dnsdist)| +unbound|python<br/>v2 or v3|Monitors Unbound performance and resource usage metrics <br/> <br/>netdata plugin: [python.d.plugin](../collectors/python.d.plugin)<br/>plugin module: [unbound.chart.py](../collectors/python.d.plugin/unbound)<br/>configuration file: [python.d/unbound.conf](../collectors/python.d.plugin/unbound)| + + +--- + +### DHCP Servers + +application|language|notes| +:---------:|:------:|:----| +isc dhcp|python<br/>v2 or v3|Monitor lease database to show all active leases.<br/> <br/>Python v2 requires package `python-ipaddress`.<br/> <br/>netdata plugin: [python.d.plugin](../collectors/python.d.plugin)<br/>plugin module: [isc-dhcpd.chart.py](../collectors/python.d.plugin/isc_dhcpd)<br/>configuration file: [python.d/isc-dhcpd.conf](../collectors/python.d.plugin/isc_dhcpd)| + + +--- + +### Load Balancers + +application|language|notes| +:---------:|:------:|:----| +haproxy|python<br/>v2 or v3|Monitor frontend, backend and health metrics.<br/> <br/>netdata plugin: [python.d.plugin](../collectors/python.d.plugin)<br/>plugin module: [haproxy.chart.py](../collectors/python.d.plugin/haproxy)<br/>configuration file: [python.d/haproxy.conf](../collectors/python.d.plugin/haproxy)| +traefik|python<br/>v2 or v3|Connects to multiple traefik instances (local or remote) to collect API metrics (response status code, response time, average response time and server uptime).<br/> <br/>netdata plugin: [python.d.plugin](../collectors/python.d.plugin)<br/>plugin module: [traefik.chart.py](../collectors/python.d.plugin/traefik)<br/>configuration file: [python.d/traefik.conf](../collectors/python.d.plugin/traefik)| + +--- + +### Message Brokers + +application|language|notes| +:---------:|:------:|:----| +rabbitmq|python<br/>v2 or v3|Monitor rabbitmq performance and health metrics.<br/> <br/>netdata plugin: [python.d.plugin](../collectors/python.d.plugin)<br/>plugin module: [rabbitmq.chart.py](../collectors/python.d.plugin/rabbitmq)<br/>configuration file: [python.d/rabbitmq.conf](../collectors/python.d.plugin/rabbitmq)| +beanstalkd|python<br/>v2 or v3|Provides server and tube level statistics.<br/> <br/>Requires beanstalkc python package (`pip install beanstalkc` or install package `python-beanstalkc`, which also installs `python-yaml`).<br/> <br/>netdata plugin: [python.d.plugin](../collectors/python.d.plugin)<br/>plugin module: [beanstalk.chart.py](../collectors/python.d.plugin/beanstalk)<br/>configuration file: [python.d/beanstalk.conf](../collectors/python.d.plugin/beanstalk)| + + +--- + +### UPS + +application|language|notes| +:---------:|:------:|:----| +apcupsd|BASH<br/>Shell Script|Connects to an apcupsd server to collect real-time statistics of an APC UPS.<br/> <br/>netdata plugin: [charts.d.plugin](../collectors/charts.d.plugin#chartsdplugin)<br/>plugin module: [apcupsd.chart.sh](../collectors/charts.d.plugin/apcupsd)<br/>configuration file: [charts.d/apcupsd.conf](../collectors/charts.d.plugin/apcupsd)| +nut|BASH<br/>Shell Script|Connects to a nut server (upsd) to collect real-time UPS statistics.<br/> <br/>netdata plugin: [charts.d.plugin](../collectors/charts.d.plugin#chartsdplugin)<br/>plugin module: [nut.chart.sh](../collectors/charts.d.plugin/nut)<br/>configuration file: [charts.d/nut.conf](../collectors/charts.d.plugin/nut)| + + +--- + +### RAID + +application|language|notes| +:---------:|:------:|:----| +mdstat|python<br/>v2 or v3|Parses `/proc/mdstat` to get mds health metrics.<br/> <br/>netdata plugin: [python.d.plugin](../collectors/python.d.plugin)<br/>plugin module: [mdstat.chart.py](../collectors/python.d.plugin/mdstat)<br/>configuration file: [python.d/mdstat.conf](../collectors/python.d.plugin/mdstat)| +megacli|python<br/>v2 or v3|Collects adapter, physical drives and battery stats..<br/> <br/>netdata plugin: [python.d.plugin](../collectors/python.d.plugin)<br/>plugin module: [megacli.chart.py](../collectors/python.d.plugin/megacli)<br/>configuration file: [python.d/megacli.conf](../collectors/python.d.plugin/megacli)| + +--- + +### Mail Servers + +application|language|notes| +:---------:|:------:|:----| +dovecot|python<br/>v2 or v3|Connects to multiple dovecot servers (local or remote) to collect real-time performance metrics.<br/> <br/>netdata plugin: [python.d.plugin](../collectors/python.d.plugin)<br/>plugin module: [dovecot.chart.py](../collectors/python.d.plugin/dovecot)<br/>configuration file: [python.d/dovecot.conf](../collectors/python.d.plugin/dovecot)| +exim|python<br/>v2 or v3|Charts the exim queue size.<br/> <br/>netdata plugin: [python.d.plugin](../collectors/python.d.plugin)<br/>plugin module: [exim.chart.py](../collectors/python.d.plugin/exim)<br/>configuration file: [python.d/exim.conf](../collectors/python.d.plugin/exim)| +exim|BASH<br/>Shell Script|Charts the exim queue size.<br/><br/>DEPRECATED IN FAVOR OF THE PYTHON ONE. It is still supplied only as an example module to shell scripting plugins.<br/> <br/>netdata plugin: [charts.d.plugin](../collectors/charts.d.plugin#chartsdplugin)<br/>plugin module: [exim.chart.sh](../collectors/charts.d.plugin/exim)<br/>configuration file: [charts.d/exim.conf](../collectors/charts.d.plugin/exim)| +postfix|python<br/>v2 or v3|Charts the postfix queue size (supports multiple queues).<br/> <br/>netdata plugin: [python.d.plugin](../collectors/python.d.plugin)<br/>plugin module: [postfix.chart.py](../collectors/python.d.plugin/postfix)<br/>configuration file: [python.d/postfix.conf](../collectors/python.d.plugin/postfix)| +postfix|BASH<br/>Shell Script|Charts the postfix queue size.<br/><br/>DEPRECATED IN FAVOR OF THE PYTHON ONE. It is still supplied only as an example module to shell scripting plugins.<br/> <br/>netdata plugin: [charts.d.plugin](../collectors/charts.d.plugin#chartsdplugin)<br/>plugin module: [postfix.chart.sh](../collectors/charts.d.plugin/postfix)<br/>configuration file: [charts.d/postfix.conf](../collectors/charts.d.plugin/postfix)| + + +--- + +### File Servers + +application|language|notes| +:---------:|:------:|:----| +NFS Client|`C`|This is handled entirely by the netdata daemon.<br/> <br/>Configuration: `netdata.conf`, section `[plugin:proc:/proc/net/rpc/nfs]`. +NFS Server|`C`|This is handled entirely by the netdata daemon.<br/> <br/>Configuration: `netdata.conf`, section `[plugin:proc:/proc/net/rpc/nfsd]`. +samba|python<br/>v2 or v3|Performance metrics of Samba SMB2 file sharing.<br/> <br/>documentation page: [python.d.plugin module samba](../collectors/python.d.plugin/samba)<br/>netdata plugin: [python.d.plugin](../collectors/python.d.plugin)<br/>plugin module: [samba.chart.py](../collectors/python.d.plugin/samba)<br/>configuration file: [python.d/samba.conf](../collectors/python.d.plugin/samba)| + +### Print Servers + +application|language|notes| +:---------:|:------:|:----| +CUPS|C|Charts metrics of printers, jobs and other cups destinations.<br/> <br/>netdata plugin: cups.plugin + +--- + +### System + +application|language|notes| +:---------:|:------:|:----| +apps|C|`apps.plugin` collects resource usage statistics for all processes running in the system. It groups the entire process tree and reports dozens of metrics for CPU utilization, memory footprint, disk I/O, swap memory, network connections, open files and sockets, etc. It reports metrics for application groups, users and user groups.<br/> <br/>[Documentation of `apps.plugin`](../collectors/apps.plugin/).<br/> <br/>netdata plugin: [`apps_plugin.c`](../collectors/apps.plugin)<br/>configuration file: [`apps_groups.conf`](../collectors/apps.plugin)| +cpu_apps|BASH<br/>Shell Script|Collects the CPU utilization of select apps.<br/><br/>DEPRECATED IN FAVOR OF `apps.plugin`. It is still supplied only as an example module to shell scripting plugins.<br/> <br/>netdata plugin: [charts.d.plugin](../collectors/charts.d.plugin#chartsdplugin)<br/>plugin module: [cpu_apps.chart.sh](../collectors/charts.d.plugin/cpu_apps)<br/>configuration file: [charts.d/cpu_apps.conf](../collectors/charts.d.plugin/cpu_apps)| +load_average|BASH<br/>Shell Script|Collects the current system load average.<br/><br/>DEPRECATED IN FAVOR OF THE NETDATA INTERNAL ONE. It is still supplied only as an example module to shell scripting plugins.<br/> <br/>netdata plugin: [charts.d.plugin](../collectors/charts.d.plugin#chartsdplugin)<br/>plugin module: [load_average.chart.sh](../collectors/charts.d.plugin/load_average)<br/>configuration file: [charts.d/load_average.conf](../collectors/charts.d.plugin/load_average)| +mem_apps|BASH<br/>Shell Script|Collects the memory footprint of select applications.<br/><br/>DEPRECATED IN FAVOR OF `apps.plugin`. It is still supplied only as an example module to shell scripting plugins.<br/> <br/>netdata plugin: [charts.d.plugin](../collectors/charts.d.plugin#chartsdplugin)<br/>plugin module: [mem_apps.chart.sh](../collectors/charts.d.plugin/mem_apps)<br/>configuration file: [charts.d/mem_apps.conf](../collectors/charts.d.plugin/mem_apps)| + + +--- + +### Sensors + +application|language|notes| +:---------:|:------:|:----| +cpufreq|python<br/>v2 or v3|Collects the current CPU frequency from `/sys/devices`.<br/> <br/>netdata plugin: [python.d.plugin](../collectors/python.d.plugin)<br/>plugin module: [cpufreq.chart.py](../collectors/python.d.plugin/cpufreq)<br/>configuration file: [python.d/cpufreq.conf](../collectors/python.d.plugin/cpufreq)| +cpufreq|BASH<br/>Shell Script|Collects current CPU frequency from `/sys/devices`.<br/><br/>DEPRECATED IN FAVOR OF THE PYTHON ONE. It is still supplied only as an example module to shell scripting plugins.<br/> <br/>netdata plugin: [charts.d.plugin](../collectors/charts.d.plugin#chartsdplugin)<br/>plugin module: [cpufreq.chart.sh](../collectors/charts.d.plugin/cpufreq)<br/>configuration file: [charts.d/cpufreq.conf](../collectors/charts.d.plugin/cpufreq)| +IPMI|C|Collects temperatures, voltages, currents, power, fans and `SEL` events from IPMI using `libipmimonitoring`.<br/>Check [Monitoring IPMI](../collectors/freeipmi.plugin/) for more information<br/> <br/>netdata plugin: [freeipmi.plugin](../collectors/freeipmi.plugin)<br/>configuration file: none required - to enable it, compile/install netdata with `--enable-plugin-freeipmi`| +hddtemp|python<br/>v2 or v3|Connects to multiple hddtemp servers (local or remote) to collect real-time performance metrics.<br/> <br/>netdata plugin: [python.d.plugin](../collectors/python.d.plugin)<br/>plugin module: [hddtemp.chart.py](../collectors/python.d.plugin/hddtemp)<br/>configuration file: [python.d/hddtemp.conf](../collectors/python.d.plugin/hddtemp)| +hddtemp|BASH<br/>Shell Script|Connects to a hddtemp server (local or remote) to collect real-time performance metrics.<br/><br/>DEPRECATED IN FAVOR OF THE PYTHON ONE. It is still supplied only as an example module to shell scripting plugins.<br/> <br/>netdata plugin: [charts.d.plugin](../collectors/charts.d.plugin#chartsdplugin)<br/>plugin module: [hddtemp.chart.sh](../collectors/charts.d.plugin/hddtemp)<br/>configuration file: [charts.d/hddtemp.conf](../collectors/charts.d.plugin/hddtemp)| +sensors|BASH<br/>Shell Script|Collects sensors values from files in `/sys`.<br/><br/>DEPRECATED IN FAVOR OF THE PYTHON ONE. It is still supplied only as an example module to shell scripting plugins.<br/> <br/>netdata plugin: [charts.d.plugin](../collectors/charts.d.plugin#chartsdplugin)<br/>plugin module: [sensors.chart.sh](../collectors/charts.d.plugin/sensors)<br/>configuration file: [charts.d/sensors.conf](../collectors/charts.d.plugin/sensors)| +sensors|python<br/>v2 or v3|Uses `lm-sensors` to collect sensor data.<br/> <br/>netdata plugin: [python.d.plugin](../collectors/python.d.plugin)<br/>plugin module: [sensors.chart.py](../collectors/python.d.plugin/sensors)<br/>configuration file: [python.d/sensors.conf](../collectors/python.d.plugin/sensors)| +smartd_log|python<br/>v2 or v3|Collects the S.M.A.R.T attributes from `smartd` log files.<br/> <br/>netdata plugin: [python.d.plugin](../collectors/python.d.plugin)<br/>plugin module: [smartd_log.chart.py](../collectors/python.d.plugin/smartd_log)<br/>configuration file: [python.d/smartd_log.conf](../collectors/python.d.plugin/smartd_log)| +w1sensor|python<br/>v2 or v3|Collects data from connected 1-Wire sensors.<br/> <br/>netdata plugin: [python.d.plugin](../collectors/python.d.plugin)<br/>plugin module: [w1sensor.chart.py](../collectors/python.d.plugin/w1sensor)<br/>configuration file: [python.d/w1sensor.conf](../collectors/python.d.plugin/w1sensor)| + + +--- + +### Network + +application|language|notes| +:---------:|:------:|:----| +ap|BASH<br/>Shell Script|Uses the `iw` command to provide statistics of wireless clients connected to a wireless access point running on this host (works well with `hostapd`).<br/> <br/>netdata plugin: [charts.d.plugin](../collectors/charts.d.plugin#chartsdplugin)<br/>plugin module: [ap.chart.sh](../collectors/charts.d.plugin/ap)<br/>configuration file: [charts.d/ap.conf](../collectors/charts.d.plugin/ap)| +fping|C|Charts network latency statistics for any number of nodes, using the `fping` command. A recent (probably unreleased) version of fping is required. The plugin supplied can install it in `/usr/local`.<br/> <br/>netdata plugin: [fping.plugin](../collectors/fping.plugin) (this is a shell wrapper to start fping - once fping is started, netdata and fping communicate directly - it can also install the right version of fping)<br/>configuration file: [fping.conf](../collectors/fping.plugin)| +snmp|node.js|Connects to multiple snmp servers to collect real-time performance metrics.<br/> <br/>netdata plugin: [node.d.plugin](../collectors/node.d.plugin#nodedplugin)<br/>plugin module: [snmp.node.js](../collectors/node.d.plugin/snmp)<br/>configuration file: [node.d/snmp.conf](../collectors/node.d.plugin/snmp)| +dns_query_time|python<br/>v2 or v3|Provides DNS query time statistics.<br/> <br/>Requires package `dnspython` (`pip install dnspython` or install package `python-dnspython`).<br/> <br/>netdata plugin: [python.d.plugin](../collectors/python.d.plugin)<br/>plugin module: [dns_query_time.chart.py](../collectors/python.d.plugin/dns_query_time)<br/>configuration file: [python.d/dns_query_time.conf](../collectors/python.d.plugin/dns_query_time)| +http|python<br />v2 or v3|Monitors a generic web page for status code and returned content in HTML +port|ptyhon<br />v2 or v3|Checks if a generic TCP port for its availability and response time + + +--- + +### Time Servers + +application|language|notes| +:---------:|:------:|:----| +chrony|python<br/>v2 or v3|Uses the chronyc command to provide chrony statistics (Frequency, Last offset, RMS offset, Residual freq, Root delay, Root dispersion, Skew, System time).<br/> <br/>netdata plugin: [python.d.plugin](../collectors/python.d.plugin)<br/>plugin module: [chrony.chart.py](../collectors/python.d.plugin/chrony)<br/>configuration file: [python.d/chrony.conf](../collectors/python.d.plugin/chrony)| +ntpd|python<br/>v2 or v3|Connects to multiple ntpd servers (local or remote) to provide statistics of system variables and optional also peer variables (if enabled in the configuration).<br/> <br/>netdata plugin: [python.d.plugin](../collectors/python.d.plugin)<br/>plugin module: [ntpd.chart.py](../collectors/python.d.plugin/ntpd)<br/>configuration file: [python.d/ntpd.conf](../collectors/python.d.plugin/ntpd)| + + +--- + +### Security + +application|language|notes| +:---------:|:------:|:----| +freeradius|python<br/>v2 or v3|Uses the radclient command to provide freeradius statistics (authentication, accounting, proxy-authentication, proxy-accounting).<br/> <br/>netdata plugin: [python.d.plugin](../collectors/python.d.plugin)<br/>plugin module: [freeradius.chart.py](../collectors/python.d.plugin/freeradius)<br/>configuration file: [python.d/freeradius.conf](../collectors/python.d.plugin/freeradius)| +openvpn|python<br/>v2 or v3|All data from openvpn-status.log in your dashboard! <br/> <br/>netdata plugin: [python.d.plugin](../collectors/python.d.plugin)<br/>plugin module: [ovpn_status_log.chart.py](../collectors/python.d.plugin/ovpn_status_log)<br/>configuration file: [python.d/ovpn_status_log.conf](../collectors/python.d.plugin/ovpn_status_log)| +fail2ban|python<br/>v2 or v3|Monitor fail2ban log file to show all bans for all active jails <br/> <br/>netdata plugin: [python.d.plugin](../collectors/python.d.plugin)<br/>plugin module: [fail2ban.chart.py](../collectors/python.d.plugin/fail2ban)<br/>configuration file: [python.d/fail2ban.conf](../collectors/python.d.plugin/fail2ban)| + + +--- + +### Telephony Servers + +application|language|notes| +:---------:|:------:|:----| +opensips|BASH<br/>Shell Script|Connects to an opensips server (local only) to collect real-time performance metrics.<br/> <br/>netdata plugin: [charts.d.plugin](../collectors/charts.d.plugin#chartsdplugin)<br/>plugin module: [opensips.chart.sh](../collectors/charts.d.plugin/opensips)<br/>configuration file: [charts.d/opensips.conf](../collectors/charts.d.plugin/opensips)| + + +--- + +### Go applications + +application|language|notes| +:---------:|:------:|:----| +go_expvar|python<br/>v2 or v3|Parses metrics exposed by applications written in the Go programming language using the [expvar package](https://golang.org/pkg/expvar/).<br/> <br/>netdata plugin: [python.d.plugin](../collectors/python.d.plugin)<br/>plugin module: [go_expvar.chart.py](../collectors/python.d.plugin/go_expvar)<br/>configuration file: [python.d/go_expvar.conf](../collectors/python.d.plugin/go_expvar)<br/>documentation: [Monitoring Go Applications](../collectors/python.d.plugin/go_expvar/)| + + +--- + +### Household Appliances + +application|language|notes| +:---------:|:------:|:----| +sma_webbox|node.js|Connects to multiple remote SMA webboxes to collect real-time performance metrics of the photovoltaic (solar) power generation.<br/> <br/>netdata plugin: [node.d.plugin](../collectors/node.d.plugin#nodedplugin)<br/>plugin module: [sma_webbox.node.js](../collectors/node.d.plugin/sma_webbox)<br/>configuration file: [node.d/sma_webbox.conf](../collectors/node.d.plugin/sma_webbox)| +fronius|node.js|Connects to multiple remote Fronius Symo servers to collect real-time performance metrics of the photovoltaic (solar) power generation.<br/> <br/>netdata plugin: [node.d.plugin](../collectors/node.d.plugin#nodedplugin)<br/>plugin module: [fronius.node.js](../collectors/node.d.plugin/fronius)<br/>configuration file: [node.d/fronius.conf](../collectors/node.d.plugin/fronius)| +stiebeleltron|node.js|Collects the temperatures and other metrics from your Stiebel Eltron heating system using their Internet Service Gateway (ISG web).<br/> <br/>netdata plugin: [node.d.plugin](../collectors/node.d.plugin#nodedplugin)<br/>plugin module: [stiebeleltron.node.js](../collectors/node.d.plugin/stiebeleltron)<br/>configuration file: [node.d/stiebeleltron.conf](../collectors/node.d.plugin/stiebeleltron)| + + +--- + +### Java Processes + +application|language|notes| +:---------:|:------:|:----| +Spring Boot Application|java|Monitors running Java [Spring Boot](https://spring.io/) applications that expose their metrics with the use of the **Spring Boot Actuator** included in Spring Boot library.<br/> <br/>netdata plugin: [python.d.plugin](../collectors/python.d.plugin)<br/>plugin module: [springboot](../collectors/python.d.plugin/springboot)<br/>configuration file: [python.d/springboot.conf](../collectors/python.d.plugin/springboot) + + +--- + +### Provisioning Systems + +application|language|notes| +:---------:|:------:|:----| +puppet|python<br/>v2 or v3|Connects to multiple Puppet Server and Puppet DB instances (local or remote) to collect real-time status metrics.<br/> <br/>netdata plugin: [python.d.plugin](../collectors/python.d.plugin)<br/>plugin module: [puppet.chart.py](../collectors/python.d.plugin/puppet)<br/>configuration file: [python.d/puppet.conf](../collectors/python.d.plugin/puppet)| + +--- + +### Game Servers + +application|language|notes| +:---------:|:------:|:----| +SpigotMC|Python<br/>v2 or v3|Monitors Spigot Minecraft server ticks per second and number of online players using the Minecraft remote console.<br/> <br/>netdata plugin: [python.d.plugin](../collectors/python.d.plugin)<br/>plugin module: [spigotmc.chart.py](../collectors/python.d.plugin/spigotmc)<br/>configuration file: [python.d/spigotmc.conf](../collectors/python.d.plugin/spigotmc)| + +--- + +### Distributed Computing Clients + +application|language|notes| +:---------:|:------:|:----| +BOINC|Python<br/>v2 or v3|Monitors task states for local and remote BOINC client software using the remote GUI RPC interface. Also provides alarms for a handful of error conditions. Requires manual configuration<br/> <br/>netdata plugin: [python.d.plugin](../collectors/python.d.plugin)<br/>plugin module: [boinc.chart.py](../collectors/python.d.plugin/boinc)<br/>configuration file: [python.d/boinc.conf](../collectors/python.d.plugin/boinc)| + +--- + +### Skeleton Plugins + +application|language|notes| +:---------:|:------:|:----| +example|BASH<br/>Shell Script|Skeleton plugin in BASH.<br/><br/>DEPRECATED IN FAVOR OF THE PYTHON ONE. It is still supplied only as an example module to shell scripting plugins.<br/> <br/>netdata plugin: [charts.d.plugin](../collectors/charts.d.plugin#chartsdplugin)<br/>plugin module: [example.chart.sh](../collectors/charts.d.plugin/example)<br/>configuration file: [charts.d/example.conf](../collectors/charts.d.plugin/example)| +example|python<br/>v2 or v3|Skeleton plugin in Python.<br/> <br/>netdata plugin: [python.d.plugin](../collectors/python.d.plugin)<br/>plugin module: [example.chart.py](../collectors/python.d.plugin/example)<br/>configuration file: [python.d/example.conf](../collectors/python.d.plugin/example)| + +[]() diff --git a/docs/Charts.md b/docs/Charts.md new file mode 100644 index 000000000..64c36302f --- /dev/null +++ b/docs/Charts.md @@ -0,0 +1,27 @@ +# Charts, contexts, families + +Before configuring an alarm or writing a collector, it's important to understand how Netdata organizes collected metrics into charts. + +## Charts + +Each chart that you see on the netdata dashboard contains one or more dimensions, one for each collected or calculated metric. + +The chart name or chart id is what you see in parentheses at the top left corner of the chart you are interested in. For example, if you go to the system cpu chart: `http://your.netdata.ip:19999/#menu_system_submenu_cpu`, you will see at the top left of the chart the label "Total CPU utilization (system.cpu)". In this case, the chart name is `system.cpu`. + +## Dimensions + +Most charts depict more than one dimensions. The dimensions of a chart are called "series" in some applications. You can see these dimensions on the right side of a chart, right under the date and time. For the system.cpu example we used, you will see the dimensions softirq, irq, user etc. Note that these are not always simple metrics (raw data). They could be calculated values (percentages, aggregates and more). + +## Families + +When you have several instances of a monitored hardware or software resource (e.g. network interfaces, mysql instances etc.), you need to be able to identify each one separately. Netdata uses "families" to identify such instances. For example, if I have the network interfaces `eth0` and `eth1`, `eth0` will be one family, and `eth1` will be another. + +The reasoning behind calling these instances "families" is that different charts for the same instance can and many times are related (relatives, family, you get it). The family of a chart is usually the name of the netdata dashboard submenu that you see selected on the right navigation pane, when you are looking at a chart. For the example of the two network interfaces, you would see a submenu `eth0` and a submenu `eth1` under the "Network Interfaces" menu on the right navigation pane. + +## Contexts + +A context is a grouping of identical charts, for each instance of the hardware or software monitored. For example, `health/health.d/net.conf` refers to four contexts: `net.drops`, `net.fifo`, `net.net`, `net.packets`. You can see the context of a chart if you hover over the date right above the dimensions of the chart. The line that appears shows you two things: the collector that produces the chart and the chart context. + +For example, let's take the `net.packets` context. You will see on the dashboard as many charts with context net.packets as you have network interfaces (families). These charts will be named `net_packets.[family]`. For the example of the two interfaces `eth0` and `eth1`, you will see charts named `net_packets.eth0` and `net_packets.eth1`. Both of these charts show the exact same dimensions, but for different instances of a network interface. + +[]() diff --git a/docs/Demo-Sites.md b/docs/Demo-Sites.md new file mode 100644 index 000000000..f6aad1398 --- /dev/null +++ b/docs/Demo-Sites.md @@ -0,0 +1,21 @@ +# Demo sites + +Live demo installations of netdata are available at **[https://my-netdata.io](https://my-netdata.io)**: + +Location | netdata demo URL | 60 mins reqs | VM Donated by +:-------:|:-----------------:|:----------:|:------------- +London (UK)|**[london.my-netdata.io](https://london.my-netdata.io)**<br/>(this is the global netdata **registry** and has **named** and **mysql** charts)|[](https://london.my-netdata.io)|[DigitalOcean.com](https://m.do.co/c/83dc9f941745) +Atlanta (USA)|**[cdn77.my-netdata.io](https://cdn77.my-netdata.io)**<br/>(with **named** and **mysql** charts)|[](https://cdn77.my-netdata.io)|[CDN77.com](https://www.cdn77.com/) +Israel|**[octopuscs.my-netdata.io](https://octopuscs.my-netdata.io)**|[](https://octopuscs.my-netdata.io)|[OctopusCS.com](https://www.octopuscs.com) +Roubaix (France)|**[ventureer.my-netdata.io](https://ventureer.my-netdata.io)**|[](https://ventureer.my-netdata.io)|[Ventureer.com](https://ventureer.com/) +Madrid (Spain)|**[stackscale.my-netdata.io](https://stackscale.my-netdata.io)**|[](https://stackscale.my-netdata.io)|[StackScale Spain](https://www.stackscale.es/) +Bangalore (India)|**[bangalore.my-netdata.io](https://bangalore.my-netdata.io)**|[](https://bangalore.my-netdata.io)|[DigitalOcean.com](https://m.do.co/c/83dc9f941745) +Frankfurt (Germany)|**[frankfurt.my-netdata.io](https://frankfurt.my-netdata.io)**|[](https://frankfurt.my-netdata.io)|[DigitalOcean.com](https://m.do.co/c/83dc9f941745) +New York (USA)|**[newyork.my-netdata.io](https://newyork.my-netdata.io)**|[](https://newyork.my-netdata.io)|[DigitalOcean.com](https://m.do.co/c/83dc9f941745) +San Francisco (USA)|**[sanfrancisco.my-netdata.io](https://sanfrancisco.my-netdata.io)**|[](https://sanfrancisco.my-netdata.io)|[DigitalOcean.com](https://m.do.co/c/83dc9f941745) +Singapore|**[singapore.my-netdata.io](https://singapore.my-netdata.io)**|[](https://singapore.my-netdata.io)|[DigitalOcean.com](https://m.do.co/c/83dc9f941745) +Toronto (Canada)|**[toronto.my-netdata.io](https://toronto.my-netdata.io)**|[](https://toronto.my-netdata.io)|[DigitalOcean.com](https://m.do.co/c/83dc9f941745) + +*Netdata dashboards are mobile and touch friendly.* + +[]() diff --git a/docs/Donations-netdata-has-received.md b/docs/Donations-netdata-has-received.md new file mode 100644 index 000000000..3c737be8a --- /dev/null +++ b/docs/Donations-netdata-has-received.md @@ -0,0 +1,25 @@ +# Donations + +This is a list of the donations we have received for netdata (sorted alphabetically on their name): + +what donated|related links|who donated|description of the donation +----:|:-----:|:---:|:----------- +Packages Distribution|-|**[PackageCloud.io](https://packagecloud.io/)**|**PackageCloud.io** donated to a free open-source subscription to their awesome Package Distribution services. +Cross Browser Testing|-|**[BrowserStack.com](https://www.browserstack.com/)**|**BrowserStack.com** donated a free subscription to their awesome Browser Testing services (all three of them: Live, Screenshots, Responsive). +Cloud VM|[cdn77.my-netdata.io](http://cdn77.my-netdata.io)|**[CDN77.com](https://www.cdn77.com/)**|**CDN77.com** donated a VM with 2 CPU cores, 4GB RAM and 20GB HD, on their excellent CDN network. +Localization Management|[netdata localization project](https://crowdin.com/project/netdata) (check issue [#279](https://github.com/netdata/netdata/issues/279))|**[Crowdin.com](https://crowdin.com/)**|**Crowdin.com** donated an open source license to their Localization Management Platform. +Cloud VMs|[london.my-netdata.io](https://london.my-netdata.io) (Several VMs)|**[DigitalOcean.com](https://www.digitalocean.com/)**|**DigitalOcean.com** donated 1000 USD to be used in their excellent Cloud Computing services. Many thanks to [Justin Paine](https://github.com/xxdesmus) for making this happen. +Development IDE|-|**[JetBrains.com](https://www.jetbrains.com/)**|**JetBrains.com** donated an open source license for 4 developers for 1 year, to their excellent IDEs. +Cloud VM|[octopuscs.my-netdata.io](https://octopuscs.my-netdata.io)|**[OctopusCS.com](https://octopuscs.com/)**|**OctopusCS.com** donated a VM with 4 CPU cores, 16GB RAM and 50GB HD in their excellent Cloud Computing services. +Cloud VM|[ventureer.my-netdata.io](https://ventureer.my-netdata.io)|**[Ventureer.com](https://ventureer.com/)**|**Ventureer.com** donated a VM with 4 CPU cores, 8GB RAM and 50GB HD in their excellent Cloud Computing services. +Cloud VM|[stackscale.my-netdata.io](https://stackscale.my-netdata.io)|**[stackscale.com](https://www.stackscale.com/)**|**StackScale.com** donated a VM with 4 CPU cores, 16GB RAM and 100GB HD in their excellent Cloud Computing services. + +Thank you! + +--- + +**Do you want to donate?** We are thirsty for on-line services that can help us make netdata better. We also try to build a network of demo sites (VMs) that can help us show the full potential of netdata. + +Please contact me at costa@tsaousis.gr. + +[]() diff --git a/docs/GettingStarted.md b/docs/GettingStarted.md new file mode 100644 index 000000000..cc58634f1 --- /dev/null +++ b/docs/GettingStarted.md @@ -0,0 +1,182 @@ +# Getting Started + +These are your first steps **after** you have installed netdata. If you haven't installed it already, please check the [installation page](../packaging/installer). + +## Accessing the dashboard + +To access the netdata dashboard, navigate with your browser to: + +``` +http://your.server.ip:19999/ +``` + +<details markdown="1"><summary>Click here, if it does not work.</summary> + +**Verify Netdata is running.** + +Open an ssh session to the server and execute `sudo ps -e | grep netdata`. It should respond with the PID of the netdata daemon. If it prints nothing, Netdata is not running. Check the [installation page](../packaging/installer) to install it. + +**Verify Netdata responds to HTTP requests.** + +Using the same ssh session, execute `curl -Ss http://localhost:19999`. It should dump on your screen the `index.html` page of the dashboard. If it does not, check the [installation page](../packaging/installer) to install it. + +**Verify Netdata receives the HTTP requests.** + +On the same ssh session, execute `tail -f /var/log/netdata/access.log` (if you installed the static 64bit package, use: `tail -f /opt/netdata/var/log/netdata/access.log`). This command will print on your screen all HTTP requests Netdata receives. + +Next, try to access the dashboard using your web browser, using the URL posted above. If nothing is printed on your terminal, the HTTP request is not routed to your Netdata. + +If you are not sure about your server IP, run this for a hint: `ip route get 8.8.8.8 | grep -oP " src [0-9\.]+ "`. It should print the IP of your server. + +If still Netdata does not receive the requests, something is blocking them. A firewall possibly. Please check your network. + +</details> <br/> + +When you install multiple Netdata servers, all your servers will appear at the `my-netdata` menu at the top left of the dashboard. For this to work, you have to manually access just once, the dashboard of each of your netdata servers. + +The `my-netdata` menu is more than just browser bookmarks. When switching Netdata servers from that menu, any settings of the current view are propagated to the other netdata server: + +- the current charts panning (drag the charts left or right), +- the current charts zooming (`SHIFT` + mouse wheel over a chart), +- the highlighted time-frame (`ALT` + select an area on a chart), +- the scrolling position of the dashboard, +- the theme you use, +- etc. + +are all sent over to other netdata server, to allow you troubleshoot cross-server performance issues easily. + +## Starting and stopping Netdata + +Netdata installer integrates Netdata to your init / systemd environment. + +To start/stop Netdata, depending on your environment, you should use: + +- `systemctl start netdata` and `systemctl stop netdata` +- `service netdata start` and `service netdata stop` +- `/etc/init.d/netdata start` and `/etc/init.d/netdata stop` + +Once netdata is installed, the installer configures it to start at boot and stop at shutdown. + +For more information about using these commands, consult your system documentation. + +## Sizing Netdata + +The default installation of netdata is configured for a small round-robin database: just 1 hour of data. Depending on the memory your system has and the amount you can dedicate to Netdata, you should adapt this. On production systems with limited RAM, we suggest to set this to 3-4 hours. For best results you should set this to 24 or 48 hours. + +For every hour of data, Netdata needs about 25MB of RAM. If you can dedicate about 100MB of RAM to netdata, you should set its database size to 4 hours. + +To do this, edit `/etc/netdata/netdata.conf` (or `/opt/netdata/etc/netdata/netdata.conf`) and set: + +``` +[global] + history = SECONDS +``` + +Make sure the `history` line is not commented (comment lines start with `#`). + +1 hour is 3600 seconds, so the number you need to set is the result of `HOURS * 3600`. + +!!! danger + Be careful when you set this on production systems. If you set it too high, your system may run out of memory. By default, netdata is configured to be killed first when the system starves for memory, but better be careful to avoid issues. + +For more information about Netdata memory requirements, [check this page](../database). + +If your kernel supports KSM (most do), you can [enable KSM to half netdata memory requirement](../database#ksm). + +## Service discovery and auto-detection + +Netdata supports auto-detection of data collection sources. It auto-detects almost everything: database servers, web servers, dns server, etc. + +This auto-detection process happens **only once**, when netdata starts. To have Netdata re-discover data sources, you need to restart it. There are a few exceptions to this: + +- containers and VMs are auto-detected forever (when Netdata is running at the host). +- many data sources are collected but are silenced by default, until there is useful information to collect (for example network interface dropped packet, will appear after a packet has been dropped). +- services that are not optimal to collect on all systems, are disabled by default. +- services we received feedback from users that caused issues when monitored, are also disabled by default (for example, `chrony` is disabled by default, because CentOS ships a version of it that uses 100% CPU when queried for statistics). + +Once a data collection source is detected, netdata will never quit trying to collect data from it, until Netdata is restarted. So, if you stop your web server, netdata will pick it up automatically when it is started again. + +Since Netdata is installed on all your systems (even inside containers), auto-detection is limited to `localhost`. This simplifies significantly the security model of a Netdata monitored infrastructure, since most applications allow `localhost` access by default. + +A few well known data collection sources that commonly need to be configured are: + +- [systemd services utilization](../collectors/cgroups.plugin/#monitoring-systemd-services) are not exposed by default on most systems, so `systemd` has to be configured to expose those metrics. + +## Configuration quick start + +In netdata we have: + +- **internal** data collection plugins (running inside the netdata daemon) +- **external** data collection plugins (independent processes, sending data to netdata over pipes) +- modular plugin **orchestrators** (external plugins that have multiple data collection modules) + +You can enable and disable plugins (internal and external) via `netdata.conf` at the section `[plugins]`. + +All plugins have dedicated sections in `netdata.conf`, like `[plugin:XXX]` for overwriting their default data collection frequency and providing additional command line options to them. + +All external plugins have their own `.conf` file. + +All modular plugin orchestrators have a directory in `/etc/netdata` with a `.conf` file for each of their modules. + +It is complex. So, let's see the whole configuration tree for the `nginx` module of `python.d.plugin`: + +In `netdata.conf` at the `[plugins]` section, `python.d.plugin` can be enabled or disabled: + +``` +[plugins] + python.d = yes +``` + +In `netdata.conf` at the `[plugin:python.d]` section, we can provide additional command line options for `python.d.plugin` and overwite its data collection frequency: + +``` +[plugin:python.d] + update every = 1 + command options = +``` + +`python.d.plugin` has its own configuration file for enabling and disabling its modules (here you can disable `nginx` for example): + +```bash +sudo /etc/netdata/edit-config python.d.conf +``` + +Then, `nginx` has its own configuration file for configuring its data collection jobs (most modules can collect data from multiple sources, so the `nginx` module can collect metrics from multiple, local or remote, `nginx` servers): + +```bash +sudo /etc/netdata/edit-config python.d/nginx.conf +``` + +## Health monitoring and alarms + +Netdata ships hundreds of health monitoring alarms for detecting anomalies. These are optimized for production servers. + +Many users install netdata on workstations and are frustrated by the default alarms shipped with netdata. On these cases, we suggest to disable health monitoring. + +To disable it, edit `/etc/netdata/netdata.conf` (or `/opt/netdata/etc/netdata/netdata.conf` if you installed the static 64bit package) and set: + +``` +[health] + enabled = no +``` + +The above will disable health monitoring entirely. + +If you want to keep health monitoring enabled for the dashboard, but you want to disable email notifications, run this: + +```bash +sudo /etc/netdata/edit-config health_alarm_notify.conf +``` + +and set `SEND_EMAIL="NO"`. + +(For static 64bit installations use `sudo /opt/netdata/etc/netdata/edit-config health_alarm_notify.conf`). + +## What is next? + +- Check [Data Collection](../collectors) for configuring data collection plugins. +- Check [Health Monitoring](../health) for configuring your own alarms, or setting up alarm notifications. +- Check [Streaming](../streaming) for centralizing netdata metrics. +- Check [Backends](../backends) for long term archiving of netdata metrics to time-series databases. + +[]() diff --git a/docs/Netdata-Security-and-Disclosure-Information.md b/docs/Netdata-Security-and-Disclosure-Information.md new file mode 100644 index 000000000..8e8a66afc --- /dev/null +++ b/docs/Netdata-Security-and-Disclosure-Information.md @@ -0,0 +1,39 @@ +# Netdata Security and Disclosure Information + +This page describes netdata security and disclosure information. + +## Security Announcements + +Every time a security issue is fixed in netdata, we immediately release a new version of it. So, to get notified of all security incidents, please subscribe to our releases on github. + +## Report a Vulnerability + +We’re extremely grateful for security researchers and users that report vulnerabilities to Netdata Open Source Community. All reports are thoroughly investigated by a set of community volunteers. + +To make a report, please email the private [security@netdata.cloud](mailto:security@netdata.cloud) list with the security details and the details expected for [all netdata bug reports](../.github/ISSUE_TEMPLATE/bug_report.md). + +## When Should I Report a Vulnerability? + +- You think you discovered a potential security vulnerability in Netdata +- You are unsure how a vulnerability affects Netdata +- You think you discovered a vulnerability in another project that Netdata depends on (e.g. python, node, etc) + +### When Should I NOT Report a Vulnerability? + +- You need help tuning Netdata for security +- You need help applying security related updates +- Your issue is not security related + +## Security Vulnerability Response + +Each report is acknowledged and analyzed by Netdata Team members within 3 working days. This will set off a Security Release Process. + +Any vulnerability information shared with Netdata Team stays within Netdata project and will not be disseminated to other projects unless it is necessary to get the issue fixed. + +As the security issue moves from triage, to identified fix, to release planning we will keep the reporter updated. + +## Public Disclosure Timing + +A public disclosure date is negotiated by the Netdata team and the bug submitter. We prefer to fully disclose the bug as soon as possible once a user mitigation is available. It is reasonable to delay disclosure when the bug or the fix is not yet fully understood, the solution is not well-tested, or for vendor coordination. The timeframe for disclosure is from immediate (especially if it's already publicly known) to a few weeks. As a basic default, we expect report date to disclosure date to be on the order of 7 days. The Netdata team holds the final say when setting a disclosure date. + +[]() diff --git a/docs/Performance.md b/docs/Performance.md new file mode 100644 index 000000000..b08549f11 --- /dev/null +++ b/docs/Performance.md @@ -0,0 +1,224 @@ +# Performance + +netdata performance is affected by: + +**Data collection** +- the number of charts for which data are collected +- the number of plugins running +- the technology of the plugins (i.e. BASH plugins are slower than binary plugins) +- the frequency of data collection + +You can control all the above. + +**Web clients accessing the data** +- the duration of the charts in the dashboard +- the number of charts refreshes requested +- the compression level of the web responses + +--- + +## Netdata Daemon + +For most server systems, with a few hundred charts and a few thousand dimensions, the netdata daemon, without any web clients accessing it, should not use more than 1% of a single core. + +To prove netdata scalability, check issue [#1323](https://github.com/netdata/netdata/issues/1323#issuecomment-265501668) where netdata collects 95.000 metrics per second, with 12% CPU utilization of a single core! + +In embedded systems, if the netdata daemon is using a lot of CPU without any web clients accessing it, you should lower the data collection frequency. To set the data collection frequency, edit `/etc/netdata/netdata.conf` and set `update_every` to a higher number (this is the frequency in seconds data are collected for all charts: higher number of seconds = lower frequency, the default is 1 for per second data collection). You can also set this frequency per module or chart. Check the [daemon configuration](../daemon/config) for plugins and charts. For specific modules, the configuration needs to be changed in: +- `python.d.conf` for [python](../collectors/python.d.plugin/#pythondplugin) +- `node.d.conf` for [nodejs](../collectors/node.d.plugin/#nodedplugin) +- `charts.d.conf` for [bash](../collectors/charts.d.plugin/#chartsdplugin) + +## Plugins + +If a plugin is using a lot of CPU, you should lower its update frequency, or if you wrote it, re-factor it to be more CPU efficient. Check [External Plugins](../collectors/plugins.d/) for more details on writing plugins. + +## CPU consumption when web clients are accessing dashboards + +Netdata is very efficient when servicing web clients. On most server platforms, netdata should be able to serve **1800 web client requests per second per core** for auto-refreshing charts. + +Normally, each user connected will request less than 10 chart refreshes per second (the page may have hundreds of charts, but only the visible are refreshed). So you can expect 180 users per CPU core accessing dashboards before having any delays. + +Netdata runs with the lowest possible process priority, so even if 1000 users are accessing dashboards, it should not influence your applications. CPU utilization will reach 100%, but your applications should get all the CPU they need. + +To lower the CPU utilization of netdata when clients are accessing the dashboard, set `web compression level = 1`, or disable web compression completely by setting `enable web responses gzip compression = no`. Both settings are in the `[web]` section. + + +## Monitoring a heavy loaded system + +Netdata, while running, does not depend on disk I/O (apart its log files and `access.log` is written with buffering enabled and can be disabled). Some plugins that need disk may stop and show gaps during heavy system load, but the netdata daemon itself should be able to work and collect values from `/proc` and `/sys` and serve web clients accessing it. + +Keep in mind that netdata saves its database when it exits and loads it back when restarted. While it is running though, its DB is only stored in RAM and no I/O takes place for it. + +## Netdata process priority + +By default, netdata runs with the `idle` process scheduler, which assigns CPU resources to netdata, only when the system has such resources to spare. + +The following `netdata.conf` settings control this: + +``` +[global] + process scheduling policy = idle + process scheduling priority = 0 + process nice level = 19 +``` + +The policies supported by netdata are `idle` (the netdata default), `other` (also as `nice`), `batch`, `rr`, `fifo`. netdata also recognizes `keep` and `none` to keep the current settings without changing them. + +For `other`, `nice` and `batch`, the setting `process nice level = 19` is activated to configure the nice level of netdata. Nice gets values -20 (highest) to 19 (lowest). + +For `rr` and `fifo`, the setting `process scheduling priority = 0` is activated to configure the priority of the relative scheduling policy. Priority gets values 1 (lowest) to 99 (highest). + +For the details of each scheduler, see `man sched_setscheduler` and `man sched`. + +When netdata is running under systemd, it can only lower its priority (the default is `other` with `nice level = 0`). If you want to make netdata to get more CPU than that, you will need to set in `netdata.conf`: + +``` +[global] + process scheduling policy = keep +``` + +and edit `/etc/systemd/system/netdata.service` and add: + +``` +CPUSchedulingPolicy=other | batch | idle | fifo | rr +CPUSchedulingPriority=99 +Nice=-10 +``` + +## Running netdata in embedded devices + +Embedded devices usually have very limited CPU resources available, and in most cases, just a single core. + +> keep in mind that netdata on RPi 2 and 3 does not require any tuning. The default settings will be good. The following tunables apply only when running netdata on RPi 1 or other very weak IoT devices. + +We suggest to do the following: + +### 1. Disable External plugins + +External plugins can consume more system resources than the netdata server. Disable the ones you don't need. If you need them, increase their `update every` value (again in `/etc/netdata/netdata.conf`), so that they do not run that frequently. + +Edit `/etc/netdata/netdata.conf`, find the `[plugins]` section: + +``` +[plugins] + proc = yes + + tc = no + idlejitter = no + cgroups = no + checks = no + apps = no + charts.d = no + node.d = no + python.d = no + + plugins directory = /usr/libexec/netdata/plugins.d + enable running new plugins = no + check for new plugins every = 60 +``` + +In detail: + +plugin|description +:---:|:--------- +`proc`|the internal plugin used to monitor the system. Normally, you don't want to disable this. You can disable individual functions of it at the next section. +`tc`|monitoring network interfaces QoS (tc classes) +`idlejitter`|internal plugin (written in C) that attempts show if the systems starved for CPU. Disabling it will eliminate a thread. +`cgroups`|monitoring linux containers. Most probably you are not going to need it. This will also eliminate another thread. +`checks`|a debugging plugin, which is disabled by default. +`apps`|a plugin that monitors system processes. It is very complex and heavy (consumes twice the CPU resources of the netdata daemon), so if you don't need to monitor the process tree, you can disable it. +`charts.d`|BASH plugins (squid, nginx, mysql, etc). This is a heavy plugin, that consumes twice the CPU resources of the netdata daemon. +`node.d`|node.js plugin, currently used for SNMP data collection and monitoring named (the name server). +`python.d`|has many modules and can use over 20MB of memory. + +For most IoT devices, you can disable all plugins except `proc`. For `proc` there is another section that controls which functions of it you need. Check the next section. + +--- + +### 2. Disable internal plugins + +In this section you can select which modules of the `proc` plugin you need. All these are run in a single thread, one after another. Still, each one needs some RAM and consumes some CPU cycles. With all the modules enabled, the `proc` plugin adds ~9 MiB on top of the 5 MiB required by the netdata daemon. + +``` +[plugin:proc] + # /proc/net/dev = yes # network interfaces + # /proc/diskstats = yes # disks +... +``` + +Refer to the [proc.plugins documentation](../collectors/proc.plugin/) for the list and description of all the proc plugin modules. + +### 3. Lower internal plugin update frequency + +If netdata is still using a lot of CPU, lower its update frequency. Going from per second updates, to once every 2 seconds updates, will cut the CPU resources of all netdata programs **in half**, and you will still have very frequent updates. + +If the CPU of the embedded device is too weak, try setting even lower update frequency. Experiment with `update every = 5` or `update every = 10` (higher number = lower frequency) in `netdata.conf`, until you get acceptable results. + +Keep in mind this will also force dashboard chart refreshes to happen at the same rate. So increasing this number actually lowers data collection frequency but also lowers dashboard chart refreshes frequency. + +This is a dashboard on a device with `[global].update every = 5` (this device is a media player and is now playing a movie): + + + +### 4. Disable logs + +Normally, you will not need them. To disable them, set: + +``` +[global] + debug log = none + error log = none + access log = none +``` +### 5. Set memory mode to RAM + +Setting the memory mode to `ram` will disable loading and saving the round robin database. This will not affect anything while running netdata, but it might be required if you have very limited storage available. + +``` +[global] + memory mode = ram +``` + +### 6. Use the single threaded web server + +Normally, netdata spawns a thread for each web client. This allows netdata to utilize all the available cores for servicing chart refreshes. You can however disable this feature and serve all charts one after another, using a single thread / core. This will might lower the CPU pressure on the embedded device. To enable the single threaded web server, edit `/etc/netdata/netdata.conf` and set `mode = single-threaded` in the `[web]` section. + +### 7. Lower memory requirements + +You can set the default size of the round robin database for all charts, using: + +``` +[global] + history = 600 +``` + +The units for history is `[global].update every` seconds. So if `[global].update every = 6` and `[global].history = 600`, you will have an hour of data ( 6 x 600 = 3.600 ), which will store 600 points per dimension, one every 6 seconds. + +Check also [Database](../database) for directions on calculating the size of the round robin database. + + +### 8. Disable gzip compression of responses + +Gzip compression of the web responses is using more CPU that the rest of netdata. You can lower the compression level or disable gzip compression completely. You can disable it, like this: + +``` +[web] + enable gzip compression = no +``` + +To lower the compression level, do this: + +``` +[web] + enable gzip compression = yes + gzip compression level = 1 +``` + +Finally, if no web server is installed on your device, you can use port tcp/80 for netdata: + +``` +[web] + port = 80 +``` + +[]() diff --git a/docs/Running-behind-apache.md b/docs/Running-behind-apache.md new file mode 100644 index 000000000..7838665cd --- /dev/null +++ b/docs/Running-behind-apache.md @@ -0,0 +1,270 @@ +# Netdata via apache's mod_proxy + +Below you can find instructions for configuring an apache server to: + +1. proxy a single netdata via an HTTP and HTTPS virtual host +2. dynamically proxy any number of netdata +3. add user authentication +4. adjust netdata settings to get optimal results + + +## Requirements + +Make sure your apache has installed `mod_proxy` and `mod_proxy_http`. + +On debian/ubuntu systems, install them with this: + +```sh +sudo apt-get install libapache2-mod-proxy-html +``` + +Also make sure they are enabled: + +``` +sudo a2enmod proxy +sudo a2enmod proxy_http +``` + +Ensure your rewrite module is enabled: + +``` +sudo a2enmod rewrite +``` + +--- + +## netdata on an existing virtual host + +On any **existing** and already **working** apache virtual host, you can redirect requests for URL `/netdata/` to one or more netdata servers. + +### proxy one netdata, running on the same server apache runs + +Add the following on top of any existing virtual host. It will allow you to access netdata as `http://virtual.host/netdata/`. + +``` +<VirtualHost *:80> + + RewriteEngine On + ProxyRequests Off + ProxyPreserveHost On + + <Proxy *> + Require all granted + </Proxy> + + # Local netdata server accessed with '/netdata/', at localhost:19999 + ProxyPass "/netdata/" "http://localhost:19999/" connectiontimeout=5 timeout=30 keepalive=on + ProxyPassReverse "/netdata/" "http://localhost:19999/" + + # if the user did not give the trailing /, add it + # for HTTP (if the virtualhost is HTTP, use this) + RewriteRule ^/netdata$ http://%{HTTP_HOST}/netdata/ [L,R=301] + # for HTTPS (if the virtualhost is HTTPS, use this) + #RewriteRule ^/netdata$ https://%{HTTP_HOST}/netdata/ [L,R=301] + + # rest of virtual host config here + +</VirtualHost> +``` + +### proxy multiple netdata running on multiple servers + +Add the following on top of any existing virtual host. It will allow you to access multiple netdata as `http://virtual.host/netdata/HOSTNAME/`, where `HOSTNAME` is the hostname of any other netdata server you have (to access the `localhost` netdata, use `http://virtual.host/netdata/localhost/`). + +``` +<VirtualHost *:80> + + RewriteEngine On + ProxyRequests Off + ProxyPreserveHost On + + <Proxy *> + Require all granted + </Proxy> + + # proxy any host, on port 19999 + ProxyPassMatch "^/netdata/([A-Za-z0-9\._-]+)/(.*)" "http://$1:19999/$2" connectiontimeout=5 timeout=30 keepalive=on + + # make sure the user did not forget to add a trailing / + # for HTTP (if the virtualhost is HTTP, use this) + RewriteRule "^/netdata/([A-Za-z0-9\._-]+)$" http://%{HTTP_HOST}/netdata/$1/ [L,R=301] + # for HTTPS (if the virtualhost is HTTPS, use this) + RewriteRule "^/netdata/([A-Za-z0-9\._-]+)$" https://%{HTTP_HOST}/netdata/$1/ [L,R=301] + + # rest of virtual host config here + +</VirtualHost> +``` + +> IMPORTANT<br/> +> The above config allows your apache users to connect to port 19999 on any server on your network. + +If you want to control the servers your users can connect to, replace the `ProxyPassMatch` line with the following. This allows only `server1`, `server2`, `server3` and `server4`. + +``` + ProxyPassMatch "^/netdata/(server1|server2|server3|server4)/(.*)" "http://$1:19999/$2" connectiontimeout=5 timeout=30 keepalive=on +``` + +## netdata on a dedicated virtual host + +You can proxy netdata through apache, using a dedicated apache virtual host. + +Create a new apache site: + +```sh +nano /etc/apache2/sites-available/netdata.conf +``` + +with this content: + +``` +<VirtualHost *:80> + RewriteEngine On + ProxyRequests Off + ProxyPreserveHost On + + ServerName netdata.domain.tld + + <Proxy *> + Require all granted + </Proxy> + + ProxyPass "/" "http://localhost:19999/" connectiontimeout=5 timeout=30 keepalive=on + ProxyPassReverse "/" "http://localhost:19999/" + + ErrorLog ${APACHE_LOG_DIR}/netdata-error.log + CustomLog ${APACHE_LOG_DIR}/netdata-access.log combined +</VirtualHost> +``` + +Enable the VirtualHost: + +```sh +sudo a2ensite netdata.conf && service apache2 reload +``` + +## Netdata proxy in Plesk +_Assuming the main goal is to make Netdata running in HTTPS._ +1. Make a subdomain for Netdata on which you enable and force HTTPS - You can use a free Let's Encrypt certificate +2. Go to "Apache & nginx Settings", and in the following section, add: +``` +RewriteEngine on +RewriteRule (.*) http://localhost:19999/$1 [P,L] +``` +3. Optional: If your server is remote, then just replace "localhost" with your actual hostname or IP, it just works. + +Repeat the operation for as many servers as you need. + + +## Enable Basic Auth + +If you wish to add an authentication (user/password) to access your netdata, do these: + +Install the package `apache2-utils`. On debian / ubuntu run `sudo apt-get install apache2-utils`. + +Then, generate password for user `netdata`, using `htpasswd -c /etc/apache2/.htpasswd netdata` + +Modify the virtual host with these: + +``` + # replace the <Proxy *> section + <Proxy *> + Order deny,allow + Allow from all + </Proxy> + + # add a <Location /netdata/> section + <Location /netdata/> + AuthType Basic + AuthName "Protected site" + AuthUserFile /etc/apache2/.htpasswd + Require valid-user + Order deny,allow + Allow from all + </Location> +``` + +Specify `Location /` if netdata is running on dedicated virtual host. + +Note: Changes are applied by reloading or restarting Apache. + +# Netdata configuration + +You might edit `/etc/netdata/netdata.conf` to optimize your setup a bit. For applying these changes you need to restart netdata. + +## Response compression + +If you plan to use netdata exclusively via apache, you can gain some performance by preventing double compression of its output (netdata compresses its response, apache re-compresses it) by editing `/etc/netdata/netdata.conf` and setting: + +``` +[web] + enable gzip compression = no +``` + +Once you disable compression at netdata (and restart it), please verify you receive compressed responses from apache (it is important to receive compressed responses - the charts will be more snappy). + +## Limit direct access to netdata + +You would also need to instruct netdata to listen only on `localhost`, `127.0.0.1` or `::1`. + +``` +[web] + bind to = localhost +``` +or +``` +[web] + bind to = 127.0.0.1 +``` +or +``` +[web] + bind to = ::1 +``` + +--- + +You can also use a unix domain socket. This will also provide a faster route between apache and netdata: + +``` +[web] + bind to = unix:/tmp/netdata.sock +``` +_note: netdata v1.8+ support unix domain sockets_ + +At the apache side, prepend the 2nd argument to `ProxyPass` with `unix:/tmp/netdata.sock|`, like this: + +``` +ProxyPass "/netdata/" "unix:/tmp/netdata.sock|http://localhost:19999/" connectiontimeout=5 timeout=30 keepalive=on +``` + +--- + +If your apache server is not on localhost, you can set: + +``` +[web] + bind to = * + allow connections from = IP_OF_APACHE_SERVER +``` +_note: netdata v1.9+ support `allow connections from`_ + +`allow connections from` accepts [netdata simple patterns](../libnetdata/simple_pattern/) to match against the connection IP address. + +## prevent the double access.log + +apache logs accesses and netdata logs them too. You can prevent netdata from generating its access log, by setting this in `/etc/netdata/netdata.conf`: + +``` +[global] + access log = none +``` + +## Troubleshooting mod_proxy + +Make sure the requests reach netdata, by examing `/var/log/netdata/access.log`. + +1. if the requests do not reach netdata, your apache does not forward them. +2. if the requests reach netdata by the URLs are wrong, you have not re-written them properly. + +[]() diff --git a/docs/Running-behind-caddy.md b/docs/Running-behind-caddy.md new file mode 100644 index 000000000..1b25b0a2e --- /dev/null +++ b/docs/Running-behind-caddy.md @@ -0,0 +1,29 @@ +# Netdata via Caddy + +To run netdata via [Caddy's proxying,](https://caddyserver.com/docs/proxy) set your Caddyfile up like this: + +``` +netdata.domain.tld { + proxy / localhost:19999 +} +``` + +Other directives can be added between the curly brackets as needed. + +To run netdata in a subfolder: + +``` +netdata.domain.tld { + proxy /netdata/ localhost:19999 { + without /netdata + } +} +``` + +## limit direct access to netdata + +You would also need to instruct netdata to listen only to `127.0.0.1` or `::1`. + +To limit access to netdata only from localhost, set `bind socket to IP = 127.0.0.1` or `bind socket to IP = ::1` in `/etc/netdata/netdata.conf`. + +[]() diff --git a/docs/Running-behind-lighttpd.md b/docs/Running-behind-lighttpd.md new file mode 100644 index 000000000..5c74439ad --- /dev/null +++ b/docs/Running-behind-lighttpd.md @@ -0,0 +1,62 @@ +# Netdata via lighttpd v1.4.x + +Here is a config for accessing netdata in a suburl via lighttpd 1.4.46 and newer: + +```txt +$HTTP["url"] =~ "^/netdata/" { + proxy.server = ( "" => ("netdata" => ( "host" => "127.0.0.1", "port" => 19999 ))) + proxy.header = ( "map-urlpath" => ( "/netdata/" => "/") ) +} +``` + +If you have older lighttpd you have to use a chain (such as bellow), as explained [at this stackoverflow answer](http://stackoverflow.com/questions/14536554/lighttpd-configuration-to-proxy-rewrite-from-one-domain-to-another). + +```txt +$HTTP["url"] =~ "^/netdata/" { + proxy.server = ( "" => ("" => ( "host" => "127.0.0.1", "port" => 19998 ))) +} + +$SERVER["socket"] == ":19998" { + url.rewrite-once = ( "^/netdata(.*)$" => "/$1" ) + proxy.server = ( "" => ( "" => ( "host" => "127.0.0.1", "port" => 19999 ))) +} +``` + +--- + +If the only thing the server is exposing via the web is netdata (and thus no suburl rewriting required), +then you can get away with just +``` +proxy.server = ( "" => ( ( "host" => "127.0.0.1", "port" => 19999 ))) +``` +Though if it's public facing you might then want to put some authentication on it. htdigest support +looks like: +``` +auth.backend = "htdigest" +auth.backend.htdigest.userfile = "/etc/lighttpd/lighttpd.htdigest" +auth.require = ( "" => ( "method" => "digest", + "realm" => "netdata", + "require" => "valid-user" + ) + ) +``` +other auth methods, and more info on htdigest, can be found in lighttpd's [mod_auth docs](http://redmine.lighttpd.net/projects/lighttpd/wiki/Docs_ModAuth). + +--- + +It seems that lighttpd (or some versions of it), fail to proxy compressed web responses. +To solve this issue, disable web response compression in netdata. + +Open /etc/netdata/netdata.conf and set in [global]: + +``` +enable web responses gzip compression = no +``` + +## limit direct access to netdata + +You would also need to instruct netdata to listen only to `127.0.0.1` or `::1`. + +To limit access to netdata only from localhost, set `bind socket to IP = 127.0.0.1` or `bind socket to IP = ::1` in `/etc/netdata/netdata.conf`. + +[]() diff --git a/docs/Running-behind-nginx.md b/docs/Running-behind-nginx.md new file mode 100644 index 000000000..3918af243 --- /dev/null +++ b/docs/Running-behind-nginx.md @@ -0,0 +1,204 @@ +# Netdata via nginx + +To pass netdata via a nginx, use this: + +### As a virtual host + +``` +upstream backend { + # the netdata server + server 127.0.0.1:19999; + keepalive 64; +} + +server { + # nginx listens to this + listen 80; + + # the virtual host name of this + server_name netdata.example.com; + + location / { + proxy_set_header X-Forwarded-Host $host; + proxy_set_header X-Forwarded-Server $host; + proxy_set_header X-Forwarded-For $proxy_add_x_forwarded_for; + proxy_pass http://backend; + proxy_http_version 1.1; + proxy_pass_request_headers on; + proxy_set_header Connection "keep-alive"; + proxy_store off; + } +} +``` + +### As a subfolder to an existing virtual host + +``` +upstream netdata { + server 127.0.0.1:19999; + keepalive 64; +} + +server { + listen 80; + + # the virtual host name of this subfolder should be exposed + #server_name netdata.example.com; + + location = /netdata { + return 301 /netdata/; + } + + location ~ /netdata/(?<ndpath>.*) { + proxy_redirect off; + proxy_set_header Host $host; + + proxy_set_header X-Forwarded-Host $host; + proxy_set_header X-Forwarded-Server $host; + proxy_set_header X-Forwarded-For $proxy_add_x_forwarded_for; + proxy_http_version 1.1; + proxy_pass_request_headers on; + proxy_set_header Connection "keep-alive"; + proxy_store off; + proxy_pass http://netdata/$ndpath$is_args$args; + + gzip on; + gzip_proxied any; + gzip_types *; + } +} +``` + +### As a subfolder for multiple netdata servers, via one nginx + +``` +upstream backend-server1 { + server 10.1.1.103:19999; + keepalive 64; +} +upstream backend-server2 { + server 10.1.1.104:19999; + keepalive 64; +} + +server { + listen 80; + + # the virtual host name of this subfolder should be exposed + #server_name netdata.example.com; + + location ~ /netdata/(?<behost>.*)/(?<ndpath>.*) { + proxy_set_header X-Forwarded-Host $host; + proxy_set_header X-Forwarded-Server $host; + proxy_set_header X-Forwarded-For $proxy_add_x_forwarded_for; + proxy_http_version 1.1; + proxy_pass_request_headers on; + proxy_set_header Connection "keep-alive"; + proxy_store off; + proxy_pass http://backend-$behost/$ndpath$is_args$args; + + gzip on; + gzip_proxied any; + gzip_types *; + } + + # make sure there is a trailing slash at the browser + # or the URLs will be wrong + location ~ /netdata/(?<behost>.*) { + return 301 /netdata/$behost/; + } +} +``` + +Of course you can add as many backend servers as you like. + +Using the above, you access netdata on the backend servers, like this: + +- `http://nginx.server/netdata/server1/` to reach `backend-server1` +- `http://nginx.server/netdata/server2/` to reach `backend-server2` + + +### Enable authentication + +Create an authentication file to enable the nginx basic authentication. +Do not use authentication without SSL/TLS! +If you haven't one you can do the following: + +``` +printf "yourusername:$(openssl passwd -apr1)" > /etc/nginx/passwords +``` + +And enable the authentication inside your server directive: + +``` +server { + # ... + auth_basic "Protected"; + auth_basic_user_file passwords; + # ... +} +``` + +## limit direct access to netdata + +If your nginx is on `localhost`, you can use this to protect your netdata: + +``` +[web] + bind to = 127.0.0.1 ::1 +``` + +--- + +You can also use a unix domain socket. This will also provide a faster route between nginx and netdata: + +``` +[web] + bind to = unix:/tmp/netdata.sock +``` +_note: netdata v1.8+ support unix domain sockets_ + +At the nginx side, use something like this to use the same unix domain socket: + +``` +upstream backend { + server unix:/tmp/netdata.sock; + keepalive 64; +} +``` + +--- + +If your nginx server is not on localhost, you can set: + +``` +[web] + bind to = * + allow connections from = IP_OF_NGINX_SERVER +``` + +_note: netdata v1.9+ support `allow connections from`_ + +`allow connections from` accepts [netdata simple patterns](../libnetdata/simple_pattern/) to match against the connection IP address. + +## prevent the double access.log + +nginx logs accesses and netdata logs them too. You can prevent netdata from generating its access log, by setting this in `/etc/netdata/netdata.conf`: + +``` +[global] + access log = none +``` + +## SELinux + +If you get an 502 Bad Gateway error you might check your nginx error log: + +```sh +# cat /var/log/nginx/error.log: +2016/09/09 12:34:05 [crit] 5731#5731: *1 connect() to 127.0.0.1:19999 failed (13: Permission denied) while connecting to upstream, client: 1.2.3.4, server: netdata.example.com, request: "GET / HTTP/2.0", upstream: "http://127.0.0.1:19999/", host: "netdata.example.com" +``` + +If you see something like the above, chances are high that SELinux prevents nginx from connecting to the backend server. To fix that, just use this policy: `setsebool -P httpd_can_network_connect true`. + +[]() diff --git a/docs/Third-Party-Plugins.md b/docs/Third-Party-Plugins.md new file mode 100644 index 000000000..38fa90e4e --- /dev/null +++ b/docs/Third-Party-Plugins.md @@ -0,0 +1,31 @@ +# Third-party plugins + +The following is a list of Netdata plugins distributed by third parties: + +## Nvidia GPUs + +[netdata nv plugin](https://github.com/coraxx/netdata_nv_plugin) monitors nvidia GPUs. + + + +## teamspeak 3 + +[teamspeak 3 plugin](https://github.com/coraxx/netdata_ts3_plugin) polls active users and bandwidth from TeamSpeak 3 servers. + +## SSH + +[SSH module](https://github.com/Yaser-Amiri/netdata-ssh-module) monitors failed authentication requests of SSH server. + +## interactive users count + +Collect [number of currently logged-on users](https://github.com/veksh/netdata-numsessions) + +## CyberPower UPS + +[cyberups plugin](https://github.com/HawtDogFlvrWtr/netdata_cyberpwrups_plugin) polls the USB connected CyberPower UPS for stats. + +## Nim + +There is an unofficial [nim plugin helper](https://github.com/FedericoCeratto/nim-netdata-plugin) + +[]() diff --git a/docs/a-github-star-is-important.md b/docs/a-github-star-is-important.md new file mode 100644 index 000000000..e46d56449 --- /dev/null +++ b/docs/a-github-star-is-important.md @@ -0,0 +1,15 @@ +# A GitHub star is important + +**GitHub stars** allow netdata to expand its reach, its community, especially attract people with skills willing to contribute to it. + +Compared to its first release, netdata is now **twice as fast**, has all its bugs settled and a lot more functionality. This happened because a lot of people find it useful, use it daily at home and work, **rely on it** and **contribute to it**. + +**GitHub stars** also **motivate** us. They state that you find our work **useful**. They give us strength to continue, to work **harder** to make it even **better**. + +So, give netdata a **GitHub star**, at the top right of this page. + +Thank you! + +Costa Tsaousis + +[]() diff --git a/docs/anonymous-statistics.md b/docs/anonymous-statistics.md new file mode 100644 index 000000000..1e426e2c5 --- /dev/null +++ b/docs/anonymous-statistics.md @@ -0,0 +1,62 @@ +# Anonymous Statistics + +From Netdata v1.12 and above, anonymous usage information is collected by default and send to Google Analytics. +The statistics calculated from this information will be used for: + +1. **Quality assurance**, to help us understand if netdata behaves as expected and help us identify repeating issues for certain distributions or environment. + +2. **Usage statistics**, to help us focus on the parts of netdata that are used the most, or help us identify the extend our development decisions influence the community. + +Information is sent to Netdata via two different channels: +- Google Tag Manager is used when an agent's dashboard is accessed. +- The script `anonymous-statistics.sh` is executed by the Netdata daemon, when Netdata starts, stops cleanly, or fails. + +Both methods are controlled via the same [opt-out mechanism](#opt-out) + +## Google tag manager + +Google tag manager (GTM) is the recommended way of collecting statistics for new implementations using GA. Unlike the older API, the logic of when to send information to GA and what information to send is controlled centrally. + +We have configured GTM to trigger the tag only when the variable `anonymous_statistics` is true. The value of this variable is controlled via the [opt-out mechanism](#opt-out). + +To ensure anonymity of the stored information, we have configured GTM's GA variable "Fields to set" as follows: + +|Field Name|Value +|---|--- +|page|netdata-dashboard +|hostname|dashboard.my-netdata.io +|anonymizeIp|true +|title|netdata dashboard +|campaignSource|{{machine_guid}} +|campaignMedium|web +|referrer|http://dashboard.my-netdata.io +|Page URL|http://dashboard.my-netdata.io/netdata-dashboard +|Page Hostname|http://dashboard.my-netdata.io +|Page Path|/netdata-dashboard +|location|http://dashboard.my-netdata.io + +In addition, the netdata-generated unique machine guid is sent to GA via a custom dimension. +You can verify the effect of these settings by examining the GA `collect` request parameters. + +The only thing that's impossible for us to prevent from being **sent** is the URL in the "Referrer" Header of the browser request to GA. However, the settings above ensure that all **stored** URLs and host names are anonymized. + +## Anonymous Statistics Script + +Every time the daemon is started or stopped and every time a fatal condition is encountered, netdata uses the anonymous statistics script to collect system information and send it to GA via an http call. The information collected for all events is: + - Netdata version + - OS name, version, id, id_like + - Kernel name, version, architecture + - Virtualization technology + - Containerization technology + +Furthermore, the FATAL event sends the Netdata process & thread name, along with the source code function, source code filename and source code line number of the fatal error. + +To see exactly what and how is collected, you can review the script template `daemon/anonymous-statistics.sh.in`. The template is converted to a bash script called `anonymous-statistics.sh`, installed under the Netdata `plugins directory`, which is usually `/usr/libexec/netdata/plugins.d`. + +## Opt-Out + +To opt-out from sending anonymous statistics, you can create a file called `.opt-out-from-anonymous-statistics` under the user configuration directory (usually `/etc/netdata`). The effect of creating the file is the following: +- The daemon will never execute the anonymous statistics script +- The anonymous statistics script will exit immediately if called via any other way (e.g. shell) +- The Google Tag Manager Javascript snippet will remain in the page, but the linked tag will not be fired. The effect is that no data will ever be sent to GA. + diff --git a/docs/configuration-guide.md b/docs/configuration-guide.md new file mode 100644 index 000000000..4c82c0583 --- /dev/null +++ b/docs/configuration-guide.md @@ -0,0 +1,122 @@ +# Configuration guide + +No configuration is required to run netdata, but you will find plenty of options to tweak, so that you can adapt it to your particular needs. + +<details markdown="1"><summary>Configuration files are placed in `/etc/netdata`.</summary> +Depending on your installation method, Netdata will have been installed either directly under `/`, or under `/opt/netdata`. The paths mentioned here and in the documentation in general assume that your installation is under `/`. If it is not, you will find the exact same paths under `/opt/netdata` as well. (i.e. `/etc/netdata` will be `/opt/netdata/etc/netdata`).</details> + +Under that directory you will see the following: + +- `netdata.conf` is [the main configuration file](../daemon/config/#daemon-configuration) +- `edit-config` is an sh script that you can use to easily and safely edit the configuration. Just run it to see its usage. +- Other directories, initially empty, where your custom configurations for alarms and collector plugins/modules will be copied from the stock configuration, if and when you customize them using `edit-config`. +- `orig` is a symbolic link to the directory `/usr/lib/netdata/conf.d`, which contains the stock configurations for everything not included in `netdata.conf`: + - `health_alarm_notify.conf` is where you configure how and to who Netdata will send [alarm notifications](../health/notifications/#netdata-alarm-notifications). + - `health.d` is the directory that contains the alarm triggers for [health monitoring](../health/#health-monitoring). It contains one .conf file per collector. + - The [modular plugin orchestrators](../collectors/plugins.d/#external-plugins-overview) have: + - One config file each, mainly to turn their modules on and off: `python.d.conf` for [python](../collectors/python.d.plugin/#pythondplugin), `node.d.conf` for [nodejs](../collectors/node.d.plugin/#nodedplugin) and `charts.d.conf` for [bash](../collectors/charts.d.plugin/#chartsdplugin) modules. + - One directory each, where the module-specific configuration files can be found. + - `stream.conf` is where you configure [streaming and replication](../streaming/#streaming-and-replication) + - `stats.d` is a directory under which you can add .conf files to add [synthetic charts](../collectors/statsd.plugin/#synthetic-statsd-charts). + - Individual collector plugin config files, such as `fping.conf` for the [fping plugin](../collectors/fping.plugin/) and `apps_groups.conf` for the [apps plugin](../collectors/apps.plugin/) + +So there are many configuration files to control every aspect of Netdata's behavior. It can be overwhelming at first, but you won't have to deal with any of them, unless you have specific things you need to change. The following HOWTO will guide you on how to customize your netdata, based on what you want to do. + +## How to + +### Change what I see + +##### Increase the metrics retention period + +Increase `history` in [netdata.conf [global]](../daemon/config/#global-section-options). Just ensure you understand [how much memory will be required](../database/) + +##### Reduce the data collection frequency + +Increase `update every` in [netdata.conf [global]](../daemon/config/#global-section-options). This is another way to increase your metrics retention period, but at a lower resolution than the default 1s. + +##### Modify how a chart is displayed + +In `netdata.conf` under `# Per chart configuration` you will find several [[CHART_NAME] sections](../daemon/config/#per-chart-configuration), where you can control all aspects of a specific chart. + +##### Disable a collector + +Entire plugins can be turned off from the [netdata.conf [plugins]](../daemon/config/#plugins-section-options) section. To disable specific modules of a plugin orchestrator, you need to edit one of the following: +- `python.d.conf` for [python](../collectors/python.d.plugin/#pythondplugin) +- `node.d.conf` for [nodejs](../collectors/node.d.plugin/#nodedplugin) +- `charts.d.conf` for [bash](../collectors/charts.d.plugin/#chartsdplugin) + +### Modify alarms and notifications + +##### Add a new alarm + +You can add a new alarm definition either by editing an existing stock alarm config file under `health.d` (e.g. `/etc/netdata/edit-config health.d/load.conf`), or by adding a new `.conf` file under `/etc/netdata/health.d`. The documentation on how to define an alarm is in [health monitoring](../health/#health-monitoring). It is suggested to look at some of the stock alarm definitions, so you can ensure you understand how the various options work. + +##### Turn off all alarms and notifications + +Just set `enabled = no` in the [netdata.conf [health]](../daemon/config/#health-section-options) section + +##### Modify or disable a specific alarm + +The `health.d` directory that contains the alarm triggers for [health monitoring](../health/#health-monitoring). It has one .conf file per collector. You can easily find the .conf file you will need to modify, by looking for the "source" line on the table that appears on the right side of an alarm on the netdata gui. + +For example, if you click on Alarms and go to the tab 'All', the default netdata installation will show you at the top the configured alarm for `10 min cpu usage` (it's the name of the badge). Looking at the table on the right side, you will see a row that says: `source 4@/usr/lib/netdata/conf.d/health.d/cpu.conf`. This way, you know that you will need to run `/etc/netdata/edit-config health.d/cpu.conf` and look for alarm at line 4 of the conf file. + +As stated at the top of the .conf file, **you can disable an alarm notification by setting the 'to' line to: silent**. +To modify how the alarm gets triggered, we suggest that you go through the guide on [health monitoring](../health/#health-monitoring). + +##### Receive notifications using my preferred method + +You only need to configure `health_alarm_notify.conf`. To learn how to do it, read first [alarm notifications](../health/notifications/#netdata-alarm-notifications) and then open the submenu `Supported Notifications` under `Alarm notifications` in the documentation to find the specific page on your prefered notification method. + +### Make security-related customizations + +##### Change the netdata web server access lists + +You have several options under the [netdata.conf [web]](../web/server/#access-lists) section. + +##### Stop sending info to registry.my-netdata.io + +You will need to configure the [registry] section in netdata.conf. First read the [registry documentation](../registry/). In it, are instructions on how to [run your own registry](../registry/#run-your-own-registry). + +##### Change the IP address/port netdata listens to + +The settings are under netdata.conf [web]. Look at the [web server documentation](../web/server/#binding-netdata-to-multiple-ports) for more info. + +### System resource usage + +##### Reduce the resources netdata uses + +The page on [netdata performance](Performance.md) has an excellent guide on how to reduce the netdata cpu/disk/RAM utilization to levels suitable even for the weakest [IoT devices](netdata-for-IoT.md). + +##### Change when netdata saves metrics to disk + +[netdata.conf [global]](../daemon/config/#global-section-options) : `memory mode`</details> + +##### Prevent netdata from getting immediately killed when my server runs out of memory + +You can change the netdata [OOM score](../daemon/#oom-score) in netdata.conf [global]. + +### Other + +##### Move netdata directories + +The various directory paths are in [netdata.conf [global]](../daemon/config/#global-section-options). + + +## How netdata configuration works + +The configuration files are `name = value` dictionaries with `[sections]`. Write whatever you like there as long as it follows this simple format. + +Netdata loads this dictionary and then when the code needs a value from it, it just looks up the `name` in the dictionary at the proper `section`. In all places, in the code, there are both the `names` and their `default values`, so if something is not found in the configuration file, the default is used. The lookup is made using B-Trees and hashes (no string comparisons), so they are super fast. Also the `names` of the settings can be `my super duper setting that once set to yes, will turn the world upside down = no` - so goodbye to most of the documentation involved. + +Next, netdata can generate a valid configuration for the user to edit. No need to remember anything. Just get the configuration from the server (`/netdata.conf` on your netdata server), edit it and save it. + +Last, what about options you believe you have set, but you misspelled?When you get the configuration file from the server, there will be a comment above all `name = value` pairs the server does not use. So you know that whatever you wrote there, is not used. + +## Netdata simple patterns + +Unix prefers regular expressions. But they are just too hard, too cryptic to use, write and understand. + +So, netdata supports [simple patterns](../libnetdata/simple_pattern/). + +[]() diff --git a/docs/generator/buildhtml.sh b/docs/generator/buildhtml.sh new file mode 100755 index 000000000..3cc87d29f --- /dev/null +++ b/docs/generator/buildhtml.sh @@ -0,0 +1,60 @@ +#!/bin/bash + +# buildhtml.sh + +# Builds the html static site, using mkdocs + +set -e + +# Assumes that the script is executed either from the htmldoc folder (by netlify), or from the root repo dir (as originally intended) +currentdir=$(pwd | awk -F '/' '{print $NF}') +echo "$currentdir" +if [ "$currentdir" = "generator" ]; then + cd ../.. +fi +GENERATOR_DIR="docs/generator" + +# Copy all netdata .md files to docs/generator/src. Exclude htmldoc itself and also the directory node_modules generatord by Netlify +echo "Copying files" +rm -rf ${GENERATOR_DIR}/src +find . -type d \( -path ./${GENERATOR_DIR} -o -path ./node_modules \) -prune -o -name "*.md" -print | cpio -pd ${GENERATOR_DIR}/src + +# Copy netdata html resources +cp -a ./${GENERATOR_DIR}/custom ./${GENERATOR_DIR}/src/ + +# Modify the first line of the main README.md, to enable proper static html generation +echo "Modifying README header" +sed -i -e '0,/# netdata /s//# Introduction\n\n/' ${GENERATOR_DIR}/src/README.md + +# Remove all GA tracking code +find ${GENERATOR_DIR}/src -name "*.md" -print0 | xargs -0 sed -i -e 's/\[!\[analytics.*UA-64295674-3)\]()//g' + +# Remove specific files that don't belong in the documentation +declare -a EXCLUDE_LIST=( + "HISTORICAL_CHANGELOG.md" + "contrib/sles11/README.md" + "packaging/maintainers/README.md" +) + +for f in "${EXCLUDE_LIST[@]}"; do + rm "${GENERATOR_DIR}/src/$f" +done + +echo "Creating mkdocs.yaml" + +# Generate mkdocs.yaml +${GENERATOR_DIR}/buildyaml.sh >${GENERATOR_DIR}/mkdocs.yml + +echo "Fixing links" + +# Fix links (recursively, all types, executing replacements) +${GENERATOR_DIR}/checklinks.sh -rax + +if [ "${1}" != "nomkdocs" ] ; then + echo "Calling mkdocs" + + # Build html docs + mkdocs build --config-file=${GENERATOR_DIR}/mkdocs.yml +fi + +echo "Finished" diff --git a/docs/generator/buildyaml.sh b/docs/generator/buildyaml.sh new file mode 100755 index 000000000..a86b1392e --- /dev/null +++ b/docs/generator/buildyaml.sh @@ -0,0 +1,238 @@ +#!/bin/bash + +GENERATOR_DIR="docs/generator" +cd ${GENERATOR_DIR}/src + +# create yaml nav subtree with all the files directly under a specific directory +# arguments: +# tabs - how deep do we show it in the hierarchy. Level 1 is the top level, max should probably be 3 +# directory - to get mds from to add them to the yaml +# file - can be left empty to include all files +# name - what do we call the relevant section on the navbar. Empty if no new section is required +# maxdepth - how many levels of subdirectories do I include in the yaml in this section. 1 means just the top level and is the default if left empty +# excludefirstlevel - Optional param. If passed, mindepth is set to 2, to exclude the READMEs in the first directory level + +navpart() { + tabs=$1 + dir=$2 + file=$3 + section=$4 + maxdepth=$5 + excludefirstlevel=$6 + spc="" + + i=1 + while [ ${i} -lt ${tabs} ]; do + spc=" $spc" + i=$((i + 1)) + done + + if [ -z "$file" ]; then file='*'; fi + if [[ -n $section ]]; then echo "$spc- ${section}:"; fi + if [ -z "$maxdepth" ]; then maxdepth=1; fi + if [[ -n $excludefirstlevel ]]; then mindepth=2; else mindepth=1; fi + + for f in $(find $dir -mindepth $mindepth -maxdepth $maxdepth -name "${file}.md" -printf '%h\0%d\0%p\n' | sort -t '\0' -n | awk -F '\0' '{print $3}'); do + # If I'm adding a section, I need the child links to be one level deeper than the requested level in "tabs" + if [ -z "$section" ]; then + echo "$spc- '$f'" + else + echo "$spc - '$f'" + fi + done +} + +echo -e 'site_name: Netdata Documentation +repo_url: https://github.com/netdata/netdata +repo_name: GitHub +edit_uri: blob/master +site_description: Netdata Documentation +copyright: Netdata, 2018 +docs_dir: src +site_dir: build +#use_directory_urls: false +strict: true +extra: + social: + - type: "github" + link: "https://github.com/netdata/netdata" + - type: "twitter" + link: "https://twitter.com/linuxnetdata" + - type: "facebook" + link: "https://www.facebook.com/linuxnetdata/" +theme: + name: "material" + custom_dir: custom/themes/material + favicon: custom/img/favicon.ico +extra_css: + - "https://cdnjs.cloudflare.com/ajax/libs/cookieconsent2/3.1.0/cookieconsent.min.css" + - "custom/css/netdata.css" +extra_javascript: + - "custom/javascripts/cookie-consent.js" + - "https://cdnjs.cloudflare.com/ajax/libs/cookieconsent2/3.1.0/cookieconsent.min.js" +markdown_extensions: + - extra + - abbr + - attr_list + - def_list + - fenced_code + - footnotes + - tables + - admonition + - codehilite + - meta + - nl2br + - sane_lists + - smarty + - toc: + permalink: True + separator: "-" + - wikilinks + - pymdownx.arithmatex + - pymdownx.betterem: + smart_enable: all + - pymdownx.caret + - pymdownx.critic + - pymdownx.details + - pymdownx.inlinehilite + - pymdownx.magiclink + - pymdownx.mark + - pymdownx.smartsymbols + - pymdownx.superfences + - pymdownx.tasklist: + custom_checkbox: true + - pymdownx.tilde + - pymdownx.betterem + - pymdownx.superfences + - markdown.extensions.footnotes + - markdown.extensions.attr_list + - markdown.extensions.def_list + - markdown.extensions.tables + - markdown.extensions.abbr + - pymdownx.extrarawhtml +nav:' + +navpart 1 . README "About" + +echo -ne " - 'docs/Demo-Sites.md' + - 'docs/netdata-security.md' + - 'docs/anonymous-statistics.md' + - 'docs/Donations-netdata-has-received.md' + - 'docs/a-github-star-is-important.md' + - REDISTRIBUTED.md + - CHANGELOG.md + - CONTRIBUTING.md +- Why Netdata: + - 'docs/why-netdata/README.md' + - 'docs/why-netdata/1s-granularity.md' + - 'docs/why-netdata/unlimited-metrics.md' + - 'docs/why-netdata/meaningful-presentation.md' + - 'docs/why-netdata/immediate-results.md' +- Installation: + - 'packaging/installer/README.md' + - 'packaging/docker/README.md' + - 'packaging/installer/UPDATE.md' + - 'packaging/installer/UNINSTALL.md' +- 'docs/GettingStarted.md' +- Running netdata: + - 'daemon/README.md' + - 'docs/configuration-guide.md' + - 'daemon/config/README.md' + - 'docs/Charts.md' +" +navpart 2 web/server "" "Web server" +navpart 3 web/server "" "" 2 excludefirstlevel +echo -ne " - Running behind another web server: + - 'docs/Running-behind-nginx.md' + - 'docs/Running-behind-apache.md' + - 'docs/Running-behind-lighttpd.md' + - 'docs/Running-behind-caddy.md' +" +#navpart 2 system +navpart 2 database +navpart 2 registry + +echo -ne " - 'docs/Performance.md' + - 'docs/netdata-for-IoT.md' + - 'docs/high-performance-netdata.md' +" + +navpart 1 collectors "" "Data collection" 1 +echo -ne " - 'docs/Add-more-charts-to-netdata.md' + - Internal plugins: +" +navpart 3 collectors/apps.plugin +navpart 3 collectors/proc.plugin +navpart 3 collectors/statsd.plugin +navpart 3 collectors/cgroups.plugin +navpart 3 collectors/idlejitter.plugin +navpart 3 collectors/tc.plugin +navpart 3 collectors/nfacct.plugin +navpart 3 collectors/checks.plugin +navpart 3 collectors/diskspace.plugin +navpart 3 collectors/freebsd.plugin +navpart 3 collectors/macos.plugin + +navpart 2 collectors/plugins.d "" "External plugins" +navpart 3 collectors/python.d.plugin "" "Python modules" 3 +navpart 3 collectors/node.d.plugin "" "Node.js modules" 3 +echo -ne " - BASH modules: + - 'collectors/charts.d.plugin/README.md' + - 'collectors/charts.d.plugin/ap/README.md' + - 'collectors/charts.d.plugin/apcupsd/README.md' + - 'collectors/charts.d.plugin/example/README.md' + - 'collectors/charts.d.plugin/libreswan/README.md' + - 'collectors/charts.d.plugin/nut/README.md' + - 'collectors/charts.d.plugin/opensips/README.md' + - Obsolete BASH modules: + - 'collectors/charts.d.plugin/mem_apps/README.md' + - 'collectors/charts.d.plugin/postfix/README.md' + - 'collectors/charts.d.plugin/tomcat/README.md' + - 'collectors/charts.d.plugin/sensors/README.md' + - 'collectors/charts.d.plugin/cpu_apps/README.md' + - 'collectors/charts.d.plugin/squid/README.md' + - 'collectors/charts.d.plugin/nginx/README.md' + - 'collectors/charts.d.plugin/hddtemp/README.md' + - 'collectors/charts.d.plugin/cpufreq/README.md' + - 'collectors/charts.d.plugin/mysql/README.md' + - 'collectors/charts.d.plugin/exim/README.md' + - 'collectors/charts.d.plugin/apache/README.md' + - 'collectors/charts.d.plugin/load_average/README.md' + - 'collectors/charts.d.plugin/phpfpm/README.md' +" + +navpart 3 collectors/fping.plugin +navpart 3 collectors/freeipmi.plugin +navpart 3 collectors/cups.plugin + +echo -ne " - 'docs/Third-Party-Plugins.md' +" + +navpart 1 health README "Alarms and notifications" +navpart 2 health/notifications "" "" 1 +navpart 2 health/notifications "" "Supported notifications" 2 excludefirstlevel + +navpart 1 streaming "" "" 4 + +navpart 1 backends "" "Archiving to backends" 3 + +navpart 1 web "README" "Dashboards" +navpart 2 web/gui "" "" 3 + +navpart 1 web/api "" "HTTP API" +navpart 2 web/api/exporters "" "Exporters" 2 +navpart 2 web/api/formatters "" "Formatters" 2 +navpart 2 web/api/badges "" "" 2 +navpart 2 web/api/health "" "" 2 +navpart 2 web/api/queries "" "Queries" 2 + +echo -ne "- Hacking netdata: + - CODE_OF_CONDUCT.md + - 'docs/Netdata-Security-and-Disclosure-Information.md' + - CONTRIBUTORS.md +" +navpart 2 packaging/makeself "" "" 4 +navpart 2 libnetdata "" "libnetdata" 4 +navpart 2 contrib +navpart 2 tests "" "" 2 +navpart 2 diagrams/data_structures diff --git a/docs/generator/checklinks.sh b/docs/generator/checklinks.sh new file mode 100755 index 000000000..d0c3b165c --- /dev/null +++ b/docs/generator/checklinks.sh @@ -0,0 +1,394 @@ +#!/bin/bash +# shellcheck disable=SC2181 + +# Doc link checker +# Validates and tries to fix all links that will cause issues either in the repo, or in the html site + +GENERATOR_DIR="docs/generator" + +dbg () { + if [ "$VERBOSE" -eq 1 ] ; then printf "%s\\n" "${1}" ; fi +} + +printhelp () { + echo "Usage: docs/generator/checklinks.sh [-r OR -f <fname>] [OPTIONS] + -r Recursively check all mds in all child directories, except docs/generator and node_modules (which is generatord by netlify) + -f Just check the passed md file + General Options: + -x Execute commands. By default the script runs in test mode with no files changed by the script (results and fixes are just shown). Use -x to have it apply the changes. + -u trys to follow URLs using curl + -v Outputs debugging messages + By default, nothing is actually checked. The following options tell it what to check: + -a Check all link types + -w Check wiki links (and just warn if you see one) + -b Check absolute links to the netdata repo (and change them to relative). Only checks links to https://github.com/netdata/netdata/????/master* + -l Check relative links to the netdata repo (and replace them with links that the html static site can live with, under docs/generator/src only) + -e Check external links, outside the wiki or the repo (useless without adding the -u option, to verify that they're not broken) + " +} + +fix () { + if [ "$EXECUTE" -eq 0 ] ; then + echo "-- SHOULD EXECUTE: $1" + else + dbg "-- EXECUTING: $1" + eval "$1" + fi +} + +ck_netdata_absolute () { + f=$1 + alnk=$2 + lnkinfile=$3 + testURL "$alnk" + + if [[ $f =~ ^(.*)/([^/]*)$ ]] ; then + fpath="${BASH_REMATCH[1]}" + dbg "-- Current file is at $fpath" + fi + + if [ $? -eq 0 ] ; then + rlnk=$(echo "$alnk" | sed 's/https:\/\/github.com\/netdata\/netdata\/....\/master\///g') + case $rlnk in + \#* ) dbg "-- (#somelink)" ;; + */ ) dbg "-- # (path/)" ;; + */#* ) dbg "-- # (path/#somelink)" ;; + */*.md ) dbg "-- # (path/filename.md)" ;; + */*.md#* ) dbg "-- # (path/filename.md#somelink)" ;; + *#* ) + dbg "-- # (path#somelink) -> (path/#somelink)" + if [[ $rlnk =~ ^(.*)#(.*)$ ]] ; then + dbg "-- $rlnk -> ${BASH_REMATCH[1]}/#${BASH_REMATCH[2]}" + rlnk="${BASH_REMATCH[1]}/#${BASH_REMATCH[2]}" + fi + ;; + * ) + if [ -f "$rlnk" ] ; then + dbg "-- # (path/someotherfile) $rlnk" + else + if [ -d "$rlnk" ] ; then + dbg "-- # (path) -> (path/)" + rlnk="$rlnk/" + else + echo "-- ERROR: $f - $alnk is neither a file nor a directory. Giving up!" + EXITCODE=1 + return + fi + fi + ;; + esac + + if [[ $rlnk =~ ^(.*)/([^/]*)$ ]] ; then + abspath="${BASH_REMATCH[1]}" + rest="${BASH_REMATCH[2]}" + dbg "-- Target file is at $abspath" + fi + relativelink=$(realpath --relative-to="$fpath" "$abspath") + if [ $? -eq 0 ] ; then + srch=$(echo "$lnkinfile" | sed 's/\//\\\//g') + if [ "$relativelink" = "." ] ; then + rplc=$(echo "$rest" | sed 's/\//\\\//g') + else + rplc=$(echo "$relativelink/$rest" | sed 's/\//\\\//g') + fi + fix "sed -i 's/($srch)/($rplc)/g' $f" + else + echo "-- ERROR: $f - Can't determine relative path of $alnk" + fi + else + echo "-- ERROR: $f - $alnk is a broken link" + EXITCODE=1 + return + fi +} + +testURL () { + if [ "$TESTURLS" -eq 0 ] ; then return 0 ; fi + dbg "-- Testing URL $1" + curl -sS "$1" > /dev/null + if [ $? -gt 0 ] ; then + return 1 + fi + return 0 +} + +testinternal () { + # Check if the header referred to by the internal link exists in the same file + ff=${1} + ifile=${2} + ilnk=${3} + header=${ilnk//-/} + dbg "-- Searching for \"$header\" in $ifile" + tr -d '[],_.:? `'< "$ifile" | sed 's/-//g' | grep -i "^\\#*$header\$" >/dev/null + if [ $? -eq 0 ] ; then + dbg "-- $ilnk found in $ifile" + return 0 + else + echo "-- ERROR: $ff - $ilnk header not found in file $ifile" + EXITCODE=1 + return 1 + fi +} + +testf () { + sf=$1 + tf=$2 + + if [ -f "$tf" ] ; then + dbg "-- $tf exists" + return 0 + else + echo "-- ERROR: $sf - $tf does not exist" + EXITCODE=1 + return 1 + fi +} + +ck_netdata_relative () { + f=${1} + rlnk=${2} + dbg "-- Checking relative link $rlnk" + fpath="." + fname="$f" + # First ensure that the link works in the repo, then try to fix it in htmldocs + if [[ $f =~ ^(.*)/([^/]*)$ ]] ; then + fpath="${BASH_REMATCH[1]}" + fname="${BASH_REMATCH[2]}" + dbg "-- Current file is at $fpath" + else + dbg "-- Current file is at root directory" + fi + # Cases to handle: + # (#somelink) + # (path/) + # (path/#somelink) + # (path/filename.md) -> htmldoc (path/filename/) + # (path/filename.md#somelink) -> htmldoc (path/filename/#somelink) + # (path#somelink) -> htmldoc (path/#somelink) + # (path/someotherfile) -> htmldoc (absolutelink) + # (path) -> htmldoc (path/) + + TRGT="" + s="" + + case "$rlnk" in + \#* ) + dbg "-- # (#somelink)" + testinternal "$f" "$f" "$rlnk" + ;; + */ ) + dbg "-- # (path/)" + TRGT="$fpath/${rlnk}README.md" + testf "$f" "$TRGT" + if [ $? -eq 0 ] ; then + if [ "$fname" != "README.md" ] ; then s="../$rlnk"; fi + fi + ;; + */\#* ) + dbg "-- # (path/#somelink)" + if [[ $rlnk =~ ^(.*)/#(.*)$ ]] ; then + TRGT="$fpath/${BASH_REMATCH[1]}/README.md" + LNK="#${BASH_REMATCH[2]}" + dbg "-- Look for $LNK in $TRGT" + testf "$f" "$TRGT" + if [ $? -eq 0 ] ; then + testinternal "$f" "$TRGT" "$LNK" + if [ $? -eq 0 ] ; then + if [ "$fname" != "README.md" ] ; then s="../$rlnk"; fi + fi + fi + fi + ;; + *.md ) + dbg "-- # (path/filename.md) -> htmldoc (path/filename/)" + testf "$f" "$fpath/$rlnk" + if [ $? -eq 0 ] ; then + if [[ $rlnk =~ ^(.*)/(.*).md$ ]] ; then + if [ "${BASH_REMATCH[2]}" = "README" ] ; then + s="../${BASH_REMATCH[1]}/" + else + s="../${BASH_REMATCH[1]}/${BASH_REMATCH[2]}/" + fi + if [ "$fname" != "README.md" ] ; then s="../$s"; fi + fi + fi + ;; + *.md\#* ) + dbg "-- # (path/filename.md#somelink) -> htmldoc (path/filename/#somelink)" + if [[ $rlnk =~ ^(.*)#(.*)$ ]] ; then + TRGT="$fpath/${BASH_REMATCH[1]}" + LNK="#${BASH_REMATCH[2]}" + testf "$f" "$TRGT" + if [ $? -eq 0 ] ; then + testinternal "$f" "$TRGT" "$LNK" + if [ $? -eq 0 ] ; then + if [[ $lnk =~ ^(.*)/(.*).md#(.*)$ ]] ; then + if [ "${BASH_REMATCH[2]}" = "README" ] ; then + s="../${BASH_REMATCH[1]}/#${BASH_REMATCH[3]}" + else + s="../${BASH_REMATCH[1]}/${BASH_REMATCH[2]}/#${BASH_REMATCH[3]}" + fi + if [ "$fname" != "README.md" ] ; then s="../$s"; fi + fi + fi + fi + fi + ;; + *\#* ) + dbg "-- # (path#somelink) -> (path/#somelink)" + if [[ $rlnk =~ ^(.*)#(.*)$ ]] ; then + TRGT="$fpath/${BASH_REMATCH[1]}/README.md" + LNK="#${BASH_REMATCH[2]}" + testf "$f" "$TRGT" + if [ $? -eq 0 ] ; then + testinternal "$f" "$TRGT" "$LNK" + if [ $? -eq 0 ] ; then + if [[ $rlnk =~ ^(.*)#(.*)$ ]] ; then + s="${BASH_REMATCH[1]}/#${BASH_REMATCH[2]}" + if [ "$fname" != "README.md" ] ; then s="../$s"; fi + fi + fi + fi + fi + ;; + * ) + if [ -f "$fpath/$rlnk" ] ; then + dbg "-- # (path/someotherfile) $rlnk" + if [ "$fpath" = "." ] ; then + s="https://github.com/netdata/netdata/tree/master/$rlnk" + else + s="https://github.com/netdata/netdata/tree/master/$fpath/$rlnk" + fi + else + if [ -d "$fpath/$rlnk" ] ; then + dbg "-- # (path) -> htmldoc (path/)" + testf "$f" "$fpath/$rlnk/README.md" + if [ $? -eq 0 ] ; then + s="$rlnk/" + if [ "$fname" != "README.md" ] ; then s="../$s"; fi + fi + else + echo "-- ERROR: $f - $rlnk is neither a file or a directory. Giving up!" + EXITCODE=1 + fi + fi + ;; + esac + + if [[ ! -z $s ]] ; then + srch=$(echo "$rlnk" | sed 's/\//\\\//g') + rplc=$(echo "$s" | sed 's/\//\\\//g') + fix "sed -i 's/($srch)/($rplc)/g' $GENERATOR_DIR/src/$f" + fi +} + + +checklinks () { + f=$1 + dbg "Checking $f" + while read -r l ; do + for word in $l ; do + if [[ $word =~ .*\]\(([^\(\) ]*)\).* ]] ; then + lnk="${BASH_REMATCH[1]}" + if [ -z "$lnk" ] ; then continue ; fi + dbg "-$lnk" + case "$lnk" in + mailto:* ) dbg "-- Mailto link, ignoring" ;; + https://github.com/netdata/netdata/wiki* ) + dbg "-- Wiki Link $lnk" + if [ "$CHKWIKI" -eq 1 ] ; then echo "-- WARNING: $f - $lnk points to the wiki. Please replace it manually" ; fi + ;; + https://github.com/netdata/netdata/????/master* ) + dbg "-- Absolute link $lnk" + if [ "$CHKABSOLUTE" -eq 1 ] ; then ck_netdata_absolute "$f" "$lnk" "$lnk" ; fi + ;; + http* ) + dbg "-- External link $lnk" + if [ "$CHKEXTERNAL" -eq 1 ] ; then + testURL "$lnk" + if [ $? -eq 1 ] ; then + echo "-- ERROR: $f - $lnk is a broken link" + EXITCODE=1 + fi + fi + ;; + * ) + dbg "-- Relative link $lnk" + if [ "$CHKRELATIVE" -eq 1 ] ; then ck_netdata_relative "$f" "$lnk" ; fi + ;; + esac + fi + done + done < "$f" +} + +TESTURLS=0 +VERBOSE=0 +RECURSIVE=0 +EXECUTE=0 +CHKWIKI=0 +CHKABSOLUTE=0 +CHKEXTERNAL=0 +CHKRELATIVE=0 +while getopts :f:rxuvwbela option +do + case "$option" in + f) + file=$OPTARG + ;; + r) + RECURSIVE=1 + ;; + x) + EXECUTE=1 + ;; + u) + TESTURLS=1 + ;; + v) + VERBOSE=1 + ;; + w) + CHKWIKI=1 + ;; + b) + CHKABSOLUTE=1 + ;; + e) + CHKEXTERNAL=1 + ;; + l) + CHKRELATIVE=1 + ;; + a) + CHKWIKI=1 + CHKABSOLUTE=1 + CHKEXTERNAL=1 + CHKRELATIVE=1 + ;; + *) + printhelp + exit 1 + ;; + esac +done + +EXITCODE=0 + +if [ -z "${file}" ] ; then + if [ $RECURSIVE -eq 0 ] ; then + printhelp + exit 1 + fi + for f in $(find . -type d \( -path ./${GENERATOR_DIR} -o -path ./node_modules \) -prune -o -name "*.md" -print); do + checklinks "$f" + done +else + if [ $RECURSIVE -eq 1 ] ; then + printhelp + exit 1 + fi + checklinks "$file" +fi + +exit $EXITCODE diff --git a/docs/generator/custom/css/netdata.css b/docs/generator/custom/css/netdata.css new file mode 100644 index 000000000..b3db10883 --- /dev/null +++ b/docs/generator/custom/css/netdata.css @@ -0,0 +1,3 @@ +.md-nav__link { + white-space: nowrap; +} diff --git a/docs/generator/custom/img/favicon.ico b/docs/generator/custom/img/favicon.ico Binary files differnew file mode 100644 index 000000000..7ed957252 --- /dev/null +++ b/docs/generator/custom/img/favicon.ico diff --git a/docs/generator/custom/javascripts/cookie-consent.js b/docs/generator/custom/javascripts/cookie-consent.js new file mode 100644 index 000000000..a5c65da49 --- /dev/null +++ b/docs/generator/custom/javascripts/cookie-consent.js @@ -0,0 +1,15 @@ +window.addEventListener("load", function(){ +window.cookieconsent.initialise({ + "palette": { + "popup": { + "background": "#000" + }, + "button": { + "background": "#f1d600" + } + }, + "content": { + "href": "https://docs.netdata.cloud/docs/privacy-policy/" + } +})}); + diff --git a/docs/generator/custom/themes/material/partials/footer.html b/docs/generator/custom/themes/material/partials/footer.html new file mode 100644 index 000000000..fe232b6d5 --- /dev/null +++ b/docs/generator/custom/themes/material/partials/footer.html @@ -0,0 +1,54 @@ +{% import "partials/language.html" as lang with context %} +<footer class="md-footer"> + {% if page.previous_page or page.next_page %} + <div class="md-footer-nav"> + <nav class="md-footer-nav__inner md-grid"> + {% if page.previous_page %} + <a href="{{ page.previous_page.url | url }}" title="{{ page.previous_page.title }}" class="md-flex md-footer-nav__link md-footer-nav__link--prev" rel="prev"> + <div class="md-flex__cell md-flex__cell--shrink"> + <i class="md-icon md-icon--arrow-back md-footer-nav__button"></i> + </div> + <div class="md-flex__cell md-flex__cell--stretch md-footer-nav__title"> + <span class="md-flex__ellipsis"> + <span class="md-footer-nav__direction"> + {{ lang.t("footer.previous") }} + </span> + {{ page.previous_page.title }} + </span> + </div> + </a> + {% endif %} + {% if page.next_page %} + <a href="{{ page.next_page.url | url }}" title="{{ page.next_page.title }}" class="md-flex md-footer-nav__link md-footer-nav__link--next" rel="next"> + <div class="md-flex__cell md-flex__cell--stretch md-footer-nav__title"> + <span class="md-flex__ellipsis"> + <span class="md-footer-nav__direction"> + {{ lang.t("footer.next") }} + </span> + {{ page.next_page.title }} + </span> + </div> + <div class="md-flex__cell md-flex__cell--shrink"> + <i class="md-icon md-icon--arrow-forward md-footer-nav__button"></i> + </div> + </a> + {% endif %} + </nav> + </div> + {% endif %} + <div class="md-footer-meta md-typeset"> + <div class="md-footer-meta__inner md-grid"> + <div class="md-footer-copyright"> + {% if config.copyright %} + <div class="md-footer-copyright__highlight"> + {{ config.copyright }} | <a href="/docs/privacy-policy/">Privacy Policy</a> | <a href="/docs/terms-of-use/">Terms of Use</a> + </div> + {% endif %} + </div> + {% block social %} + {% include "partials/social.html" %} + {% endblock %} + </div> + </div> +</footer> +<script>!function(e,a,t,n,o,c,i){e.GoogleAnalyticsObject=o,e.ga=e.ga||function(){(e.ga.q=e.ga.q||[]).push(arguments)},e.ga.l=1*new Date,c=a.createElement(t),i=a.getElementsByTagName(t)[0],c.async=1,c.src="https://www.google-analytics.com/analytics.js",i.parentNode.insertBefore(c,i)}(window,document,"script",0,"ga"),ga("create","UA-64295674-3",""),ga("set","anonymizeIp",!0),ga("send","pageview","/doc"+window.location.pathname);var links=document.getElementsByTagName("a");if(Array.prototype.map.call(links,function(a){a.host!=document.location.host&&a.addEventListener("click",function(){var e=a.getAttribute("data-md-action")||"follow";ga("send","event","outbound",e,a.href)})}),document.forms.search){var query=document.forms.search.query;query.addEventListener("blur",function(){if(this.value){var e=document.location.pathname;ga("send","pageview",e+"?q="+this.value)}})}</script> diff --git a/docs/generator/requirements.txt b/docs/generator/requirements.txt new file mode 100644 index 000000000..ac01be7ae --- /dev/null +++ b/docs/generator/requirements.txt @@ -0,0 +1,2 @@ +mkdocs>=1.0.1 +mkdocs-material diff --git a/docs/generator/runtime.txt b/docs/generator/runtime.txt new file mode 100644 index 000000000..d70c8f8d8 --- /dev/null +++ b/docs/generator/runtime.txt @@ -0,0 +1 @@ +3.6 diff --git a/docs/high-performance-netdata.md b/docs/high-performance-netdata.md new file mode 100644 index 000000000..a9947d9bc --- /dev/null +++ b/docs/high-performance-netdata.md @@ -0,0 +1,151 @@ +# High performance netdata + +If you plan to run a netdata public on the internet, you will get the most performance out of it by following these rules: + +## 1. run behind nginx + +The internal web server is optimized to provide the best experience with few clients connected to it. Normally a web browser will make 4-6 concurrent connections to a web server, so that it can send requests in parallel. To best serve a single client, netdata spawns a thread for each connection it receives (so 4-6 threads per connected web browser). + +If you plan to have your netdata public on the internet, this strategy wastes resources. It provides a lock-free environment so each thread is autonomous to serve the browser, but it does not scale well. Running netdata behind nginx, idle connections to netdata can be reused, thus improving significantly the performance of netdata. + +In the following nginx configuration we do the following: + +- allow nginx to maintain up to 1024 idle connections to netdata (so netdata will have up to 1024 threads waiting for requests) + +- allow nginx to compress the responses of netdata (later we will disable gzip compression at netdata) + +- we disable wordpress pingback attacks and allow only GET, HEAD and OPTIONS requests. + +``` +upstream backend { + server 127.0.0.1:19999; + keepalive 1024; +} + +server { + listen *:80; + server_name my.web.server.name; + + location / { + proxy_set_header X-Forwarded-Host $host; + proxy_set_header X-Forwarded-Server $host; + proxy_set_header X-Forwarded-For $proxy_add_x_forwarded_for; + proxy_pass http://backend; + proxy_http_version 1.1; + proxy_pass_request_headers on; + proxy_set_header Connection "keep-alive"; + proxy_store off; + gzip on; + gzip_proxied any; + gzip_types *; + + # Block any HTTP requests other than GET, HEAD, and OPTIONS + limit_except GET HEAD OPTIONS { + deny all; + } + } + + # WordPress Pingback Request Denial + if ($http_user_agent ~* "WordPress") { + return 403; + } + +} +``` + +Then edit `/etc/netdata/netdata.conf` and set these config options: + +``` +[global] + bind socket to IP = 127.0.0.1 + access log = none + disconnect idle web clients after seconds = 3600 + enable web responses gzip compression = no +``` + +These options: + +- `[global].bind socket to IP = 127.0.0.1` makes netdata listen only for requests from localhost (nginx). +- `[global].access log = none` disables the access.log of netdata. It is not needed since netdata only listens for requests on 127.0.0.1 and thus only nginx can access it. nginx has its own access.log for your record. +- `[global].disconnect idle web clients after seconds = 3600` will kill inactive web threads after an hour of inactivity. +- `[global].enable web responses gzip compression = no` disables gzip compression at netdata (nginx will compress the responses). + +## 2. increase open files limit (non-systemd) + +By default Linux limits open file descriptors per process to 1024. This means that less than half of this number of client connections can be accepted by both nginx and netdata. To increase them, create 2 new files: + +1. `/etc/security/limits.d/nginx.conf`, with these contents: + + ``` +nginx soft nofile 10000 +nginx hard nofile 30000 +``` + +2. `/etc/security/limits.d/netdata.conf`, with these contents: + + ``` +netdata soft nofile 10000 +netdata hard nofile 30000 +``` + +and to activate them, run: + +```sh +sysctl -p +``` + +## 2b. increase open files limit (systemd) + +Thanks to [@leleobhz](https://github.com/netdata/netdata/issues/655#issue-163932584), this is what you need to raise the limits using systemd: + +This is based on https://ma.ttias.be/increase-open-files-limit-in-mariadb-on-centos-7-with-systemd/ and here worked as following: + +1. Create the folders in /etc: + + ``` +mkdir -p /etc/systemd/system/netdata.service.d +mkdir -p /etc/systemd/system/nginx.service.d +``` + +2. Create limits.conf in each folder as following: + + ``` +[Service] +LimitNOFILE=30000 +``` + +3. Reload systemd daemon list and restart services: + + ```sh +systemctl daemon-reload +systemctl restart netdata.service +systemctl restart nginx.service +``` + +You can check limits with following commands: + +```sh +cat /proc/$(ps aux | grep "nginx: master process" | grep -v grep | awk '{print $2}')/limits | grep "Max open files" +cat /proc/$(ps aux | grep "netdata" | head -n1 | grep -v grep | awk '{print $2}')/limits | grep "Max open files" +``` + +View of the files: + +```sh +# tree /etc/systemd/system/*service.d/etc/systemd/system/netdata.service.d +/etc/systemd/system/netdata.service.d +└── limits.conf +/etc/systemd/system/nginx.service.d +└── limits.conf + +0 directories, 2 files + +# cat /proc/$(ps aux | grep "nginx: master process" | grep -v grep | awk '{print $2}')/limits | grep "Max open files" +Max open files 30000 30000 files + +# cat /proc/$(ps aux | grep "netdata" | head -n1 | grep -v grep | awk '{print $2}')/limits | grep "Max open files" +Max open files 30000 30000 files + +``` + +[]() diff --git a/docs/netdata-for-IoT.md b/docs/netdata-for-IoT.md new file mode 100644 index 000000000..97fba07e6 --- /dev/null +++ b/docs/netdata-for-IoT.md @@ -0,0 +1,41 @@ +# Netdata for IoT + + + +> New to netdata? Check its demo: **[https://my-netdata.io/](https://my-netdata.io/)** +> +> [](https://registry.my-netdata.io/#netdata_registry) [](https://registry.my-netdata.io/#netdata_registry) [](https://registry.my-netdata.io/#netdata_registry) +> +> [](https://registry.my-netdata.io/#netdata_registry) [](https://registry.my-netdata.io/#netdata_registry) [](https://registry.my-netdata.io/#netdata_registry) + +--- + +netdata is a **very efficient** server performance monitoring solution. When running in server hardware, it can collect thousands of system and application metrics **per second** with just 1% CPU utilization of a single core. Its web server responds to most data requests in about **half a millisecond** making its web dashboards spontaneous, amazingly fast! + +netdata can also be a very efficient real-time monitoring solution for **IoT devices** (RPIs, routers, media players, wifi access points, industrial controllers and sensors of all kinds). Netdata will generally run everywhere a Linux kernel runs (and it is glibc and [musl-libc](https://www.musl-libc.org/) friendly). + +You can use it as both a data collection agent (where you pull data using its API), for embedding its charts on other web pages / consoles, but also for accessing it directly with your browser to view its dashboard. + +The netdata web API already provides **reduce** functions allowing it to report **average** and **max** for any timeframe. It can also respond in many formats including JSON, JSONP, CSV, HTML. Its API is also a **google charts** provider so it can directly be used by google sheets, google charts, google widgets. + + + +Although netdata has been significantly optimized to lower the CPU and RAM resources it consumes, the plethora of data collection plugins may be inappropriate for weak IoT devices. Please follow the guide on [running netdata in embedded devices](Performance.md) + +## Monitoring RPi temperature + +The python version of the sensors plugin uses `lm-sensors`. Unfortunately the temperature reading of RPi are not supported by `lm-sensors`. + +netdata also has a bash version of the sensors plugin that can read RPi temperatures. It is disabled by default to avoid the conflicts with the python version. + +To enable it, run `sudo edit-config charts.d.conf` and uncomment this line: + +```sh +sensors=force +``` + +Then restart netdata. You will get this: + +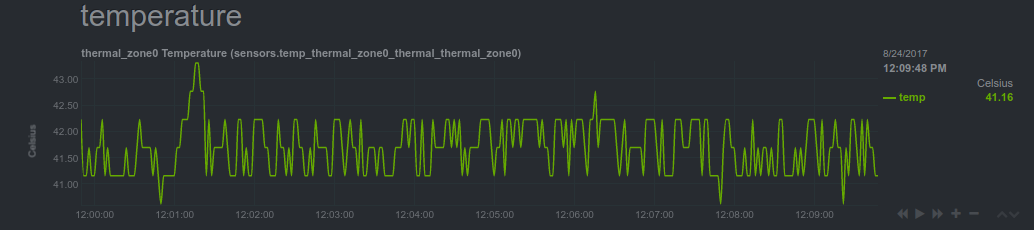 + +[]() diff --git a/docs/netdata-security.md b/docs/netdata-security.md new file mode 100644 index 000000000..642881067 --- /dev/null +++ b/docs/netdata-security.md @@ -0,0 +1,183 @@ +# Security design + +We have given special attention to all aspects of Netdata, ensuring that everything throughout its operation is as secure as possible. Netdata has been designed with security in mind. + +**Table of Contents** + +1. [Your data are safe with Netdata](#your-data-are-safe-with-netdata) +2. [Your systems are safe with Netdata](#your-systems-are-safe-with-netdata) +3. [Netdata is read-only](#netdata-is-read-only) +4. [Netdata viewers authentication](#netdata-viewers-authentication) + - [Why Netdata should be protected](#why-netdata-should-be-protected) + - [Protect Netdata from the internet](#protect-netdata-from-the-internet) + - [Expose Netdata only in a private LAN](#expose-netdata-only-in-a-private-lan) + - [Use an authenticating web server in proxy mode](#use-an-authenticating-web-server-in-proxy-mode) + - [Other methods](#other-methods) +5. [Registry or how to not send any information to a third party server](#registry-or-how-to-not-send-any-information-to-a-third-party-server) + +## Your data are safe with Netdata + +Netdata collects raw data from many sources. For each source, Netdata uses a plugin that connects to the source (or reads the relative files produced by the source), receives raw data and processes them to calculate the metrics shown on Netdata dashboards. + +Even if Netdata plugins connect to your database server, or read your application log file to collect raw data, the product of this data collection process is always a number of **chart metadata and metric values** (summarized data for dashboard visualization). All Netdata plugins (internal to the Netdata daemon, and external ones written in any computer language), convert raw data collected into metrics, and only these metrics are stored in Netdata databases, sent to upstream Netdata servers, or archived to backend time-series databases. + +> The **raw data** collected by Netdata, do not leave the host they are collected. **The only data Netdata exposes are chart metadata and metric values.** + +This means that Netdata can safely be used in environments that require the highest level of data isolation (like PCI Level 1). + +## Your systems are safe with Netdata + +We are very proud that **the Netdata daemon runs as a normal system user, without any special privileges**. This is quite an achievement for a monitoring system that collects all kinds of system and application metrics. + +There are a few cases however that raw source data are only exposed to processes with escalated privileges. To support these cases, Netdata attempts to minimize and completely isolate the code that runs with escalated privileges. + +So, Netdata **plugins**, even those running with escalated capabilities or privileges, perform a **hard coded data collection job**. They do not accept commands from Netdata. The communication is strictly **unidirectional**: from the plugin towards the Netdata daemon. The original application data collected by each plugin do not leave the process they are collected, are not saved and are not transferred to the Netdata daemon. The communication from the plugins to the Netdata daemon includes only chart metadata and processed metric values. + +Netdata slaves streaming metrics to upstream Netdata servers, use exactly the same protocol local plugins use. The raw data collected by the plugins of slave Netdata servers are **never leaving the host they are collected**. The only data appearing on the wire are chart metadata and metric values. This communication is also **unidirectional**: slave Netdata servers never accept commands from master Netdata servers. + +## Netdata is read-only + +Netdata **dashboards are read-only**. Dashboard users can view and examine metrics collected by Netdata, but cannot instruct Netdata to do something other than present the already collected metrics. + +Netdata dashboards do not expose sensitive information. Business data of any kind, the kernel version, O/S version, application versions, host IPs, etc are not stored and are not exposed by Netdata on its dashboards. + +## Netdata viewers authentication + +Netdata is a monitoring system. It should be protected, the same way you protect all your admin apps. We assume Netdata will be installed privately, for your eyes only. + +### Why Netdata should be protected + +Viewers will be able to get some information about the system Netdata is running. This information is everything the dashboard provides. The dashboard includes a list of the services each system runs (the legends of the charts under the `Systemd Services` section), the applications running (the legends of the charts under the `Applications` section), the disks of the system and their names, the user accounts of the system that are running processes (the `Users` and `User Groups` section of the dashboard), the network interfaces and their names (not the IPs) and detailed information about the performance of the system and its applications. + +This information is not sensitive (meaning that it is not your business data), but **it is important for possible attackers**. It will give them clues on what to check, what to try and in the case of DDoS against your applications, they will know if they are doing it right or not. + +Also, viewers could use Netdata itself to stress your servers. Although the Netdata daemon runs unprivileged, with the minimum process priority (scheduling priority `idle` - lower than nice 19) and adjusts its OutOfMemory (OOM) score to 1000 (so that it will be first to be killed by the kernel if the system starves for memory), some pressure can be applied on your systems if someone attempts a DDoS against Netdata. + +### Protect Netdata from the internet + +Netdata is a distributed application. Most likely you will have many installations of it. Since it is distributed and you are expected to jump from server to server, there is very little usability to add authentication local on each Netdata. + +Until we add a distributed authentication method to Netdata, you have the following options: + +#### Expose Netdata only in a private LAN + +If your organisation has a private administration and management LAN, you can bind Netdata on this network interface on all your servers. This is done in `Netdata.conf` with these settings: + +``` +[web] + bind to = 10.1.1.1:19999 localhost:19999 +``` + +You can bind Netdata to multiple IPs and ports. If you use hostnames, Netdata will resolve them and use all the IPs (in the above example `localhost` usually resolves to both `127.0.0.1` and `::1`). + +**This is the best and the suggested way to protect Netdata**. Your systems **should** have a private administration and management LAN, so that all management tasks are performed without any possibility of them being exposed on the internet. + +For cloud based installations, if your cloud provider does not provide such a private LAN (or if you use multiple providers), you can create a virtual management and administration LAN with tools like `tincd` or `gvpe`. These tools create a mesh VPN allowing all servers to communicate securely and privately. Your administration stations join this mesh VPN to get access to management and administration tasks on all your cloud servers. + +For `gvpe` we have developed a [simple provisioning tool](https://github.com/netdata/netdata-demo-site/tree/master/gvpe) you may find handy (it includes statically compiled `gvpe` binaries for Linux and FreeBSD, and also a script to compile `gvpe` on your Mac). We use this to create a management and administration LAN for all Netdata demo sites (spread all over the internet using multiple hosting providers). + +--- + +In Netdata v1.9+ there is also access list support, like this: + +``` +[web] + bind to = * + allow connections from = localhost 10.* 192.168.* +``` + + +#### Use an authenticating web server in proxy mode + +Use one web server to provide authentication in front of **all your Netdata servers**. So, you will be accessing all your Netdata with URLs like `http://{HOST}/netdata/{NETDATA_HOSTNAME}/` and authentication will be shared among all of them (you will sign-in once for all your servers). Instructions are provided on how to set the proxy configuration to have Netdata run behind [nginx](Running-behind-nginx.md#netdata-via-nginx), [Apache](Running-behind-apache.md), [lighthttpd](Running-behind-lighttpd.md#netdata-via-lighttpd-v14x) and [Caddy](Running-behind-caddy.md#netdata-via-caddy). + +To use this method, you should firewall protect all your Netdata servers, so that only the web server IP will allowed to directly access Netdata. To do this, run this on each of your servers (or use your firewall manager): + +```sh +PROXY_IP="1.2.3.4" +iptables -t filter -I INPUT -p tcp --dport 19999 \! -s ${PROXY_IP} -m conntrack --ctstate NEW -j DROP +``` +_commands to allow direct access to Netdata from a web server proxy_ + +The above will prevent anyone except your web server to access a Netdata dashboard running on the host. + +For Netdata v1.9+ you can also use `netdata.conf`: + +``` +[web] + allow connections from = localhost 1.2.3.4 +``` + +Of course you can add more IPs. + +For Netdata prior to v1.9, if you want to allow multiple IPs, use this: + +```sh +# space separated list of IPs to allow access Netdata +NETDATA_ALLOWED="1.2.3.4 5.6.7.8 9.10.11.12" +NETDATA_PORT=19999 + +# create a new filtering chain || or empty an existing one named netdata +iptables -t filter -N netdata 2>/dev/null || iptables -t filter -F netdata +for x in ${NETDATA_ALLOWED} +do + # allow this IP + iptables -t filter -A netdata -s ${x} -j ACCEPT +done + +# drop all other IPs +iptables -t filter -A netdata -j DROP + +# delete the input chain hook (if it exists) +iptables -t filter -D INPUT -p tcp --dport ${NETDATA_PORT} -m conntrack --ctstate NEW -j netdata 2>/dev/null + +# add the input chain hook (again) +# to send all new netdata connections to our filtering chain +iptables -t filter -I INPUT -p tcp --dport ${NETDATA_PORT} -m conntrack --ctstate NEW -j netdata +``` +_script to allow access to Netdata only from a number of hosts_ + +You can run the above any number of times. Each time it runs it refreshes the list of allowed hosts. + +#### Other methods + +Of course, there are many more methods you could use to protect Netdata: + +- bind Netdata to localhost and use `ssh -L 19998:127.0.0.1:19999 remote.netdata.ip` to forward connections of local port 19998 to remote port 19999. This way you can ssh to a Netdata server and then use `http://127.0.0.1:19998/` on your computer to access the remote Netdata dashboard. + +- If you are always under a static IP, you can use the script given above to allow direct access to your Netdata servers without authentication, from all your static IPs. + +- install all your Netdata in **headless data collector** mode, forwarding all metrics in real-time to a master Netdata server, which will be protected with authentication using an nginx server running locally at the master Netdata server. This requires more resources (you will need a bigger master Netdata server), but does not require any firewall changes, since all the slave Netdata servers will not be listening for incoming connections. + +## Anonymous Statistics + +### Registry or how to not send any information to a third party server + +The default configuration uses a public registry under registry.my-netdata.io (more information about the registry here: [mynetdata-menu-item](../registry/) ). Please be aware that if you use that public registry, you submit the following information to a third party server: +- The url where you open the web-ui in the browser (via http request referer) +- The hostnames of the Netdata servers + +If sending this information to the central Netdata registry violates your security policies, you can configure Netdat to [run your own registry](../registry/#run-your-own-registry). + +### Opt out of anonymous statistics + +Starting with v1.12 Netdata also collects [anonymous statistics](anonymous-statistics.md) on certain events for: + +1. **Quality assurance**, to help us understand if netdata behaves as expected and help us identify repeating issues for certain distributions or environments. + +2. **Usage statistics**, to help us focus on the parts of Netdata that are used the most, or help us identify the extent our development decisions influence the community. + +To opt-out from sending anonymous statistics, you can create a file called `.opt-out-from-anonymous-statistics` under the user configuration directory (usually `/etc/netdata`). + +## Netdata directories + +path|owner|permissions| netdata |comments| +:---|:----|:----------|:--------|:-------| +`/etc/netdata`|user `root`<br/>group `netdata`|dirs `0755`<br/>files `0640`|reads|**netdata config files**<br/>may contain sensitive information, so group `netdata` is allowed to read them. +`/usr/libexec/netdata`|user `root`<br/>group `root`|executable by anyone<br/>dirs `0755`<br/>files `0644` or `0755`|executes|**netdata plugins**<br/>permissions depend on the file - not all of them should have the executable flag.<br/>there are a few plugins that run with escalated privileges (Linux capabilities or `setuid`) - these plugins should be executable only by group `netdata`. +`/usr/share/netdata`|user `root`<br/>group `netdata`|readable by anyone<br/>dirs `0755`<br/>files `0644`|reads and sends over the network|**Netdata web static files**<br/>these files are sent over the network to anyone that has access to the netdata web server. Netdata checks the ownership of these files (using settings at the `[web]` section of `netdata.conf`) and refuses to serve them if they are not properly owned. Symbolic links are not supported. Netdata also refuses to serve URLs with `..` in their name. +`/var/cache/netdata`|user `netdata`<br/>group `netdata`|dirs `0750`<br/>files `0660`|reads, writes, creates, deletes|**Netdata ephemeral database files**<br/>Netdata stores its ephemeral real-time database here. +`/var/lib/netdata`|user `netdata`<br/>group `netdata`|dirs `0750`<br/>files `0660`|reads, writes, creates, deletes|**Netdata permanent database files**<br/>Netdata stores here the registry data, health alarm log db, etc. +`/var/log/netdata`|user `netdata`<br/>group `root`|dirs `0755`<br/>files `0644`|writes, creates|**Netdata log files**<br/>all the Netdata applications, logs their errors or other informational messages to files in this directory. These files should be log rotated. + +[]() diff --git a/docs/privacy-policy.md b/docs/privacy-policy.md new file mode 100644 index 000000000..af50b8851 --- /dev/null +++ b/docs/privacy-policy.md @@ -0,0 +1,115 @@ +# Privacy Policy + +## 1. Preamble + +This Privacy Policy explains the collection, use, processing, transferring and disclosure of personal information by Netdata, Inc (“ND” or “Netdata”), a Delaware Corporation. + +This Privacy Policy is incorporated into and made part of the Netdata Master Terms of Use (“Master Terms”) located [here](terms-of-use.md). + +Unless otherwise noted on a particular website or service hosted by Netdata, this Privacy Policy applies to your use of all websites that Netdata operates. These include https://my-netdata.io and https://netdata.cloud, together with all other subdomains thereof, (collectively, the “Websites”). This Privacy Policy also applies to all products, information, and services provided through the Websites, including without limitation the ND agent, the ND registry, the ND hub and the ND cloud website (together with the Websites, the “Services”). + +In addition, supplemental Privacy Policy terms (“Supplemental Privacy Policy Terms”) may apply to a particular Service. All such Supplemental Privacy Policy Terms will be accessible for you to read either within, or through your use of, that particular Service. + +By accessing or using any of the Services, you are accepting and agreeing to the practices described in this Privacy Policy. + +## 2. Our Principles + +Netdata has designed this policy to be consistent with the following principles: + +Privacy policies should be human readable and easy to find. +Data collection, storage, and processing should be simplified as much as possible to enhance security, ensure consistency, and make the practices easy for users to understand. +Data practices should always meet the reasonable expectations of users. + +## 3. Personal Information ND Collects and How it is Used + +As used in this policy, “personal information” means information that would allow someone to identify you, including your name, email address, IP address, or other information from which someone could deduce your identity. + +ND collects and uses personal information in the following ways: + +Website and Analytics: When you visit our Websites and use our Services, ND collects some information about your activities through tools such as Google Analytics. The type of information that we collect focuses on general information such as country or city where you are located, pages visited, time spent on pages, heat-map of visitors’ activity on the site, information about the browser you are using, etc. ND collects and uses this information pursuant to our legitimate interest in enhancing the security and utility of our Services. The information we gather and process is used in the aggregate to spot trends without deliberately identifying individuals. + +Note that you can learn about Google’s practices in connection with its analytics services and how to opt out of it by downloading the Google Analytics opt-out browser add-on, available at https://tools.google.com/dlpage/gaoptout. + +Information from Cookies: We and our service providers (for example, Google Analytics as described above) may collect information using cookies or similar technologies for the purposes described above and below. Cookies are pieces of information that are stored by your browser on the hard drive or memory of your computer or other Internet access device. Cookies may enable us to personalize your experience on the Services, maintain a persistent session, passively collect demographic information about your computer, and monitor advertisements and other activities. The Websites may use different kinds of cookies and other types of local storage (such as browser-based or plugin-based local storage). + + +ND Registry: The global registry, together with certain browser features, allow netdata to provide unified cross-server dashboards, via the `my-netdata` menu. The menu lists the netdata servers you have visited. For example, when you jump from server to server using the `my-netdata` menu, several session settings (like the currently viewed charts, the current zoom and pan operations on the charts, etc.) are propagated to the new server, so that the new dashboard will come with exactly the same view. The global registry keeps track of 3 entities: + +1. **machines**: i.e. the netdata installations (a random GUID generated by each netdata the first time it starts; we call this **machine_guid**). For each netdata installation (each `machine_guid`) the registry keeps track of the different URLs it is accessed. + +2. **persons**: i.e. the web browsers accessing the netdata installations (a random GUID generated by the registry the first time it sees a new web browser; we call this **person_guid**). For each person, the registry keeps track of the netdata installations it has accessed and their URLs. + +3. **URLs** of netdata installations (as seen by the web browsers). For each URL, the registry keeps the URL and nothing more. Each URL is linked to *persons* and *machines*. The only way to find a URL is to know its **machine_guid** or have a **person_guid** it is linked to it. + +If sending this information is against your policies, you can [run your own registry](../registry/#run-your-own-registry). +Note that ND versions with the 'Sign in' feature of the ND Cloud do not use the global registry. + +ND Cloud: When you sign up to obtain a user account via the 'Sign in' link on the ND agent user interface, ND is granted access to personal information in the user profile of the authentication provider you choose (e.g. GitHub or Google). ND collects and uses this personal information pursuant to its legitimate interest in establishing and maintaining your account providing you with the features we provide Registered Users. We may use your email address to contact you regarding changes to this policy or other applicable policies. The login name or email address of your profile may be used to attribute you in connection with any content you submit to any Service. + +Anonymous Usage Statistics: From Netdata v1.12 and above, anonymous usage information is collected by default on certain events of the ND daemon and send to Google Analytics. Every time the daemon is started or stopped and every time a fatal condition is encountered, netdata collects system information and sends it to GA via an http call. The information collected for all events is: + - Netdata version + - OS name, version, id, id_like + - Kernel name, version, architecture + - Virtualization technology + - Containerization technology +Furthermore, the FATAL event sends the Netdata process & thread info, along with the file, function and line of the fatal error. + +The statistics calculated from this information are used for: + +1. **Quality assurance**, to help us understand if netdata behaves as expected and help us identify repeating issues for certain distributions or environment. + +2. **Usage statistics**, to help us focus on the parts of netdata that are used the most, or help us identify the extend our development decisions influence the community. + +To opt-out from sending anonymous statistics, you can create reate a file called `.opt-out-from-anonymous-statistics` under the user configuration directory (usually `/etc/netdata`). + +Emails and Newsletters: When you sign up to receive updates from Netdata or otherwise subscribe to one of our mailing lists, you will be asked to provide some personal information. ND collects and uses this personal information pursuant to its legitimate interest in providing news and updates to, and collaborating with, its supporters and volunteers. + +Email Analytics: When you receive communications from ND after signing up for the ND newsletter, campaign updates, or other ongoing email communications from ND, we may use analytics to track whether you open the mail, click on the links, and otherwise interact with what we send. You may opt out of this tracking by choosing to get plain-text emails from ND. ND collects and uses this personal information pursuant to its legitimate interest in understanding the interests of its community of supporters and volunteers in order to provide more relevant news and updates. + +Other Voluntarily Provided Information: When you provide feedback to Netdata, sign a petition distributed by ND, or otherwise submit personal information to Netdata, ND collects and uses this personal information pursuant to its legitimate interest in better understanding our community of supporters and volunteers and in furtherance of the particular program or activity to which you provided feedback or other input. + +## 4. Retention of Personal Information + +The majority of the personal information collected and used as explained in Section 3 above is aggregated and stored in a central database provided by a third party service provider. ND aggregates this data pursuant to its legitimate interest in having information stored in a single location to minimize complexity, increase consistency in internal practices, better understand its community of supporters and volunteers, and enhance the security of the data. + +## 5. Access to Your Personal Information + +You are generally entitled to access personal information that Netdata holds and to have inaccurate data corrected or removed to the extent ND still maintains it. In certain circumstances, you also may have the right to object for legitimate reasons to the processing or transfer of personal information. If you wish to exercise any of these rights, please write to legal@netdata.cloud explaining your request. + +## 6. Disclosure of Your Personal Information + +ND does not disclose personal information to third parties except as specified elsewhere in this policy and in the following instances: + +We may disclose your personal information to third parties in a good faith belief that such disclosure is reasonably necessary to (a) take action regarding suspected illegal activities; (b) enforce or apply our Master Terms and this Privacy Policy; (c) enforce our Charter, including the Code of Conduct and policies contained and incorporated therein, or (d) comply with legal process, such as a search warrant, subpoena, statute, or court order. + +## 7. Security of Your Personal Information + +Netdata has implemented reasonable physical, technical, and organizational security measures for personal information that Netdata processes against accidental or unlawful destruction, or accidental loss, alteration, unauthorized disclosure or access, in compliance with applicable law. However, no website can fully eliminate security risks. If any data breach occurs, we will post a reasonably prominent notice to the Websites and comply with all other applicable data privacy requirements including, when required, personal notice to you if you have provided and we have maintained an email address for you. + +The ND Cloud Services have security risks in addition to those described above. Among other things, they are vulnerable to DNS attacks, and using any ND Cloud Service may increase the risk of phishing. + +## 8. Children + +The Services are not directed at children under the age of 13. Consistent with the U.S. federal Children’s Online Privacy Protection Act of 1998 (COPPA), we will never knowingly request personal information from anyone under the age of 13 without requiring parental consent. Our Master Terms specifically prohibit anyone using our Services from submitting any personally identifiable information about persons under 13 years of age. Any person who provides their personal information to ND through the Services represents that they are 13 years of age or older. + +## 9. Third Party Service Providers + +Netdata uses many third party service providers in connection with the Services, including website hosting services, database management, credit card processing, and many more. Some of these service providers may place session cookies on your computer, and they may collect and store your personal information on our behalf in accordance with the data practices and purposes explained above in Section 3. + +## 10. Third Party Sites + +The Services may provide links to a wide variety of third party websites. You should consult the respective privacy policies of these third-party websites. This Privacy Policy does not apply to, and we cannot control the activities of, such other websites. + +## 11. Transferring Data to Other Countries + +If you are accessing or using the Services in regions with laws governing data collection, processing, transfer and use, please note that when we use and share your data as specified in this policy, we may transfer your information to recipients in countries other than the country in which the information was originally collected. Those countries may not have the same data protection laws as the country in which you initially provided the information. + +Data transferred from the European Union to the United States or outside the European Union will be made on the grounds of a certification to the E.U./U.S. Privacy Shield regime and/or a data transfer agreement based on the Standard Contractual Clauses approved of by the European Commission respectively, consistent with applicable data privacy requirements. + +## 12. Changes to this Privacy Policy + +We may occasionally update this Privacy Policy. When we do, we will provide you with notice of such update through (at a minimum) a reasonably prominent notice on the Websites and Services, and will revise the Effective Date below. We encourage you to periodically review this Privacy Policy to stay informed about how we are protecting, using, processing and transferring the personal information we collect. + +Effective Date: 8 January 2019. + +[]() diff --git a/docs/terms-of-use.md b/docs/terms-of-use.md new file mode 100644 index 000000000..5565f6056 --- /dev/null +++ b/docs/terms-of-use.md @@ -0,0 +1,161 @@ +# Terms of Use + +Netdata Master Terms of Use +Effective as of 25 May 2018 + +## 1. General Information Regarding These Terms of Use + +Master terms: Welcome, and thank you for your interest in Netdata (“Netdata, Inc.” “ND,” “we,” “our,” or “us”). Unless otherwise noted on a particular site or service, these master terms of use (“Master Terms”) apply to your use of all of the websites that Netdata Corporation operates. These include https://my-netdata.io and https://netdata.cloud, together with all other subdomains thereof, (collectively, the “Websites”). The Master Terms also apply to all products, information, and services provided through the Websites, such as the NDID Login Service. + +Additional terms: In addition to the Master Terms, your use of any Services may also be subject to specific terms applicable to a particular Service (“Additional Terms”). If there is any conflict between the Additional Terms and the Master Terms, then the Additional Terms apply in relation to the relevant Service. + +Collectively, the Terms: The Master Terms, together with any Additional Terms, form a binding legal agreement between you and Netdata in relation to your use of the Services. Collectively, this legal agreement is referred to below as the “Terms.” + +Human-readable summary of Sec 1: These terms, together with any special terms for particular websites, create a contract between you and Netdata. The contract governs your use of all websites operated by Netdata, unless a particular website indicates otherwise. These human-readable summaries of each section are not part of the contract, but are intended to help you understand its terms. + +## 2. Your Agreement to the Terms + +BY ACCESSING OR USING ANY OF THE SERVICES, YOU ACKNOWLEDGE THAT YOU HAVE READ, UNDERSTOOD, AND AGREED TO BE BOUND BY THE TERMS. By accessing or using any Services you also represent that you have the legal authority to accept the Terms on behalf of yourself and any party you represent in connection with your use of any Services. If you do not agree to the Terms, you are not authorized to use any Services. If you are an individual who is entering into these Terms on behalf of an entity, you represent and warrant that you have the power to bind that entity, and you hereby agree on that entity’s behalf to be bound by these Terms, with the terms “you,” and “your” applying to you, that entity, and other users accessing the Services on behalf of that entity. + +Human-readable summary of Sec 2: Please read these terms and only use our sites and services if you agree to them. + +## 3. Changes to the Terms + +From time to time, Netdata may change, remove, or add to the Terms, and reserves the right to do so in its discretion. In that case, we will post updated Terms and indicate the date of revision. If we feel the modifications are material, we will make reasonable efforts to post a prominent notice on the relevant Website(s) and notify those of you with a current NDID Login Service account via email. All new and/or revised Terms take effect immediately and apply to your use of the Services from that date on, except that material changes will take effect 30 days after the change is made and identified as material. Your continued use of any Services after new and/or revised Terms are effective indicates that you have read, understood, and agreed to those Terms. + +Human-readable summary of Sec 3: These terms may change. When the changes are important, we will put a notice on the website. If you continue to use the sites after the changes are made, you agree to the changes. + +## 4. No Legal Advice + +Netdata is not a law firm, does not provide legal advice, and is not a substitute for a law firm. Sending us an email or using any of the Services, including the licenses, public domain tools, and choosers, does not constitute legal advice or create an attorney-client relationship. + +Human-readable summary of Sec 4: Some of us are lawyers, but we aren’t your lawyer. Please consult your own attorney if you need legal advice. + +## 5. Content Available through the Services + +Provided as-is: You acknowledge that Netdata does not make any representations or warranties about the material, data, and information, such as data files, text, computer software, code, music, audio files or other sounds, photographs, videos, or other images (collectively, the “Content”) which you may have access to as part of, or through your use of, the Services. Under no circumstances is Netdata liable in any way for any Content, including, but not limited to: any infringing Content, any errors or omissions in Content, or for any loss or damage of any kind incurred as a result of the use of any Content posted, transmitted, linked from, or otherwise accessible through or made available via the Services. You understand that by using the Services, you may be exposed to Content that is offensive, indecent, or objectionable. + +You agree that you are solely responsible for your reuse of Content made available through the Services, including providing proper attribution. You should review the terms of the applicable license before you use the Content so that you know what you can and cannot do. + +Licensing: ND-Owned Content: Other than the text of Netdata licenses, ND licenses, and other legal tools and the text of the deeds for all legal tools, Netdata trademarks (subject to the Trademark Policy), and the software code, all Content on the Websites is licensed under the Creative Commons Attribution 4.0 license, unless otherwise marked. See the ND Policies page for more information. + +ND-Owned Code: All of CC’s software code is free software; please check our code repository for the specific license on software you want to reuse. + +Search Tools: On some of its Websites, Netdata provides website search tools, including ND Search, which return Content based on any information our search tools are able to locate and interpret. Those search tools may return Content that is not ND licensed, and you should independently verify the terms of the license attached to any Content you intend to use. + +Human-readable summary of Sec 5: We try our best to have useful information on our sites, but we cannot promise that everything is accurate or appropriate for your situation. Content on the site is licensed under CC BY 4.0 unless it says it is available under different terms. If you find content through a link on our websites, be sure to check the license terms before using it. + +## 6. Content Supplied by You + +Your responsibility: You represent, warrant, and agree that no Content posted or otherwise shared by you on or through any of the Services (“Your Content”), violates or infringes upon the rights of any third party, including copyright, trademark, privacy, publicity, or other personal or proprietary rights, breaches or conflicts with any obligation, such as a confidentiality obligation, or contains libelous, defamatory, or otherwise unlawful material. + +Licensing Your Content: You retain any copyright that you may have in Your Content. You hereby agree that Your Content: (a) is hereby licensed under the CC Attribution 4.0 License and may be used under the terms of that license or any later version of a CC Attribution License, or (b) is in the public domain (such as Content that is not copyrightable or Content you make available under CC0), or (c) if not owned by you, (i) is available under a CC Attribution 4.0 License or (ii) is a media file that is available under any CC license or that you are authorized by law to post or share through any of the Services, such as under the fair use doctrine, and that is prominently marked as being subject to third party copyright. All of Your Content must be appropriately marked with licensing (or other permission status such as fair use) and attribution information. + +Removal: Netdata may, but is not obligated to, review Your Content and may delete or remove Your Content (without notice) from any of the Services in its sole discretion. Removal of any of Your Content from the Services (by you or Netdata) does not impact any rights you granted in Your Content under the terms of a Netdata license. + +Human-readable summary of Sec 6: We do not take any ownership of your content when you post it on our sites. If you post content you own, you agree it can be used under the terms of CC BY 4.0 or any future version of that license. If you do not own the content, then you should not post it unless it is in the public domain or licensed CC BY 4.0, except that you may also post pictures and videos if you are authorized to use them under law (e.g. fair use) or if they are available under any CC license. You must note that information on the file when you upload it. You are responsible for any content you upload to our sites. + +## 7. Prohibited Conduct + +You agree not to engage in any of the following activities: + +### 1. Violating laws and rights: + +You may not (a) use any Service for any illegal purpose or in violation of any local, state, national, or international laws, (b) violate or encourage others to violate any right of or obligation to a third party, including by infringing, misappropriating, or violating intellectual property, confidentiality, or privacy rights. + +### 2. Solicitation: + +You may not use the Services or any information provided through the Services for the transmission of advertising or promotional materials, including junk mail, spam, chain letters, pyramid schemes, or any other form of unsolicited or unwelcome solicitation. + +### 3. Disruption: + +You may not use the Services in any manner that could disable, overburden, damage, or impair the Services, or interfere with any other party’s use and enjoyment of the Services; including by (a) uploading or otherwise disseminating any virus, adware, spyware, worm or other malicious code, or (b) interfering with or disrupting any network, equipment, or server connected to or used to provide any of the Services, or violating any regulation, policy, or procedure of any network, equipment, or server. + +### 4. Harming others: + +You may not post or transmit Content on or through the Services that is harmful, offensive, obscene, abusive, invasive of privacy, defamatory, hateful or otherwise discriminatory, false or misleading, or incites an illegal act; +You may not intimidate or harass another through the Services; and, you may not post or transmit any personally identifiable information about persons under 13 years of age on or through the Services. + +### 5. Impersonation or unauthorized access: + +You may not impersonate another person or entity, or misrepresent your affiliation with a person or entity when using the Services; +You may not use or attempt to use another’s account or personal information without authorization; and +You may not attempt to gain unauthorized access to the Services, or the computer systems or networks connected to the Services, through hacking password mining or any other means. + +Human-readable summary of Sec 7: Play nice. Be yourself. Don’t break the law or be disruptive. + +## 8. DISCLAIMER OF WARRANTIES + +TO THE FULLEST EXTENT PERMITTED BY APPLICABLE LAW, NETDATA OFFERS THE SERVICES (INCLUDING ALL CONTENT AVAILABLE ON OR THROUGH THE SERVICES) AS-IS AND MAKES NO REPRESENTATIONS OR WARRANTIES OF ANY KIND CONCERNING THE SERVICES, EXPRESS, IMPLIED, STATUTORY, OR OTHERWISE, INCLUDING WITHOUT LIMITATION, WARRANTIES OF TITLE, MERCHANTABILITY, FITNESS FOR A PARTICULAR PURPOSE, OR NON-INFRINGEMENT. NETDATA DOES NOT WARRANT THAT THE FUNCTIONS OF THE SERVICES WILL BE UNINTERRUPTED OR ERROR-FREE, THAT CONTENT MADE AVAILABLE ON OR THROUGH THE SERVICES WILL BE ERROR-FREE, THAT DEFECTS WILL BE CORRECTED, OR THAT ANY SERVERS USED BY ND ARE FREE OF VIRUSES OR OTHER HARMFUL COMPONENTS. NETDATA DOES NOT WARRANT OR MAKE ANY REPRESENTATION REGARDING USE OF THE CONTENT AVAILABLE THROUGH THE SERVICES IN TERMS OF ACCURACY, RELIABILITY, OR OTHERWISE. + +Human-readable summary of Sec 8: ND does not make any guarantees about the sites, services, or content available on the sites. + +## 9. LIMITATION OF LIABILITY + +TO THE FULLEST EXTENT PERMITTED BY APPLICABLE LAW, IN NO EVENT WILL NETDATA BE LIABLE TO YOU ON ANY LEGAL THEORY FOR ANY INCIDENTAL, DIRECT, INDIRECT, PUNITIVE, ACTUAL, CONSEQUENTIAL, SPECIAL, EXEMPLARY, OR OTHER DAMAGES, INCLUDING WITHOUT LIMITATION, LOSS OF REVENUE OR INCOME, LOST PROFITS, PAIN AND SUFFERING, EMOTIONAL DISTRESS, COST OF SUBSTITUTE GOODS OR SERVICES, OR SIMILAR DAMAGES SUFFERED OR INCURRED BY YOU OR ANY THIRD PARTY THAT ARISE IN CONNECTION WITH THE SERVICES (OR THE TERMINATION THEREOF FOR ANY REASON), EVEN IF NETDATA HAS BEEN ADVISED OF THE POSSIBILITY OF SUCH DAMAGES. + +TO THE FULLEST EXTENT PERMITTED BY APPLICABLE LAW, NETDATA IS NOT RESPONSIBLE OR LIABLE WHATSOEVER IN ANY MANNER FOR ANY CONTENT POSTED ON OR AVAILABLE THROUGH THE SERVICES (INCLUDING CLAIMS OF INFRINGEMENT RELATING TO THAT CONTENT), FOR YOUR USE OF THE SERVICES, OR FOR THE CONDUCT OF THIRD PARTIES ON OR THROUGH THE SERVICES. + +Certain jurisdictions do not permit the exclusion of certain warranties or limitation of liability for incidental or consequential damages, which means that some of the above limitations may not apply to you. IN THESE JURISDICTIONS, THE FOREGOING EXCLUSIONS AND LIMITATIONS WILL BE ENFORCED TO THE GREATEST EXTENT PERMITTED BY APPLICABLE LAW. + +Human-readable summary of Sec 9: ND is not responsible for the content on the sites, your use of our services, or for the conduct of others on our sites. + +## 10. Indemnification + +To the extent authorized by law, you agree to indemnify and hold harmless Netdata, its employees, officers, directors, affiliates, and agents from and against any and all claims, losses, expenses, damages, and costs, including reasonable attorneys’ fees, resulting directly or indirectly from or arising out of (a) your violation of the Terms, (b) your use of any of the Services, and/or (c) the Content you make available on any of the Services. + +Human-readable summary of Sec 10: If something happens because you violate these terms, because of your use of the services, or because of the content you post on the sites, you agree to repay ND for the damage it causes. + +## 11. Privacy Policy + +Netdata is committed to responsibly handling the information and data we collect through our Services in compliance with our Privacy Policy, which is incorporated by reference into these Master Terms. Please review the Privacy Policy so you are aware of how we collect and use your personal information. + +Human-readable summary of Sec 11: Please read our Privacy Policy. It is part of these terms, too. + +## 12. Trademark Policy + +ND’s name, logos, icons, and other trademarks may only be used in accordance with our Trademark Policy, which is incorporated by reference into these Master Terms. Please review the Trademark Policy so you understand how ND’s trademarks may be used. + +Human-readable summary of Sec 12: Please read our Trademark Policy. It is part of these terms, too. + +## 13. Copyright Complaints + +Netdata respects copyright, and we prohibit users of the Services from submitting, uploading, posting, or otherwise transmitting any Content on the Services that violates another person’s proprietary rights. + +To report allegedly infringing Content hosted on a website owned or controlled by ND, send a Notice of Infringing Materials to info@netdata.cloud. + +Please note that Netdata does not host the Content made available through ND Search. You should contact the web site or service hosting the Content to have it removed. + +Human-readable summary of Sec 13: Please let us know if you find infringing content on our websites. + +## 14. Termination + +By Netdata: Netdata may modify, suspend, or terminate the operation of, or access to, all or any portion of the Services at any time for any reason. Additionally, your individual access to, and use of, the Services may be terminated by Netdata at any time and for any reason. + +By you: If you wish to terminate this agreement, you may immediately stop accessing or using the Services at any time. + +Automatic upon breach: Your right to access and use the Services (including use of your ND Login Service account) automatically upon your breach of any of the Terms. For the avoidance of doubt, termination of the Terms does not require you to remove or delete any reference to previously-applied ND legal tools from your own Content. + +Survival: The disclaimer of warranties, the limitation of liability, and the jurisdiction and applicable law provisions will survive any termination. The license grants applicable to Your Content are not impacted by the termination of the Terms and shall continue in effect subject to the terms of the applicable license. Your warranties and indemnification obligations will survive for one year after termination. + +Human-readable summary of Sec 14: If you violate these terms, you may no longer use our sites. + +## 15. Miscellaneous Terms + +Choice of law: The Terms are governed by and construed by the laws of the State of Delaware in the United States, not including its choice of law rules. + +Dispute resolution: The parties agree that any disputes between Netdata and you concerning these Terms, and/or any of the Services may only brought in a federal or state court of competent jurisdiction sitting in the State of Delaware, and you hereby consent to the personal jurisdiction and venue of such court. + +If you are an authorized agent of a government or intergovernmental entity using the Services in your official capacity, including an authorized agent of the federal, state, or local government in the United States, and you are legally restricted from accepting the controlling law, jurisdiction, or venue clauses above, then those clauses do not apply to you. For any such U.S. federal government entities, these Terms and any action related thereto will be governed by the laws of the United States of America (without reference to conflict of laws) and, in the absence of federal law and to the extent permitted under federal law, the laws of the State of Delaware (excluding its choice of law rules). + +No waiver: Either party’s failure to insist on or enforce strict performance of any of the Terms will not be construed as a waiver of any provision or right. + +Severability: If any part of the Terms is held to be invalid or unenforceable by any law or regulation or final determination of a competent court or tribunal, that provision will be deemed severable and will not affect the validity and enforceability of the remaining provisions. + +No agency relationship: The parties agree that no joint venture, partnership, employment, or agency relationship exists between you and Netdata as a result of the Terms or from your use of any of the Services. + +Integration: These Master Terms and any applicable Additional Terms constitute the entire agreement between you and Netdata relating to this subject matter and supersede any and all prior communications and/or agreements between you and Netdata relating to access and use of the Services. + +Human-readable summary of Sec 15: If there is a lawsuit arising from these terms, it should be in Delaware and governed by Delaware law. We are glad you use our sites, but this agreement does not mean we are partners. + +[]() diff --git a/docs/why-netdata/1s-granularity.md b/docs/why-netdata/1s-granularity.md new file mode 100644 index 000000000..089854543 --- /dev/null +++ b/docs/why-netdata/1s-granularity.md @@ -0,0 +1,53 @@ +# 1s granularity + +High resolution metrics are required to effectively monitor and troubleshoot systems and applications. + +## Why? + +- The world is going real-time. Today, customer experience is significantly affected by response time, so SLAs are tighter than ever before. It is just not practical to monitor a 2-second SLA with 10-second metrics. + +- IT goes virtual. Unlike real hardware, virtual environments are not linear, nor predictable. You cannot expect resources to be available when your applications need them. They will eventually be, but not exactly at the time they are needed. The latency of virtual environments is affected by many factors, most of which are outside our control, like: the maintenance policy of the hosting provider, the work load of third party virtual machines running on the same physical servers combined with the resource allocation and throttling policy among virtual machines, the provisioning system of the hosting provider, etc. + +## What do others do? + +So, why don't most monitoring platforms and monitoring SaaS providers offer high resolution metrics? + +They want to, but they can't, at least not massively. + +The reasons lie in their design decisions: + +1. Time-series databases (prometheus, graphite, opentsdb, influxdb, etc) centralize all the metrics. At scale, these databases can easily become the bottleneck of the whole infrastructure. + +2. SaaS providers base their business models on centralizing all the metrics. On top of the time-series database bottleneck they also have increased bandwidth costs. So, massively supporting high resolution metrics, destroys their business model. + +Of course, since a couple of decades the world has fixed this kind of scaling problems: instead of scaling up, scale out, horizontally. That is, instead of investing on bigger and bigger central components, decentralize the application so that it can scale by adding more smaller nodes to it. + +There have been many attempts to fix this problem for monitoring. But so far, all solutions required centralization of metrics, which can only scale up. So, although the problem is somehow managed, it is still the key problem of all monitoring platforms and one of the key reasons for increased monitoring costs. + +Another important factor is how resource efficient data collection can be when running per second. Most solutions fail to do it properly. The data collection agent is consuming significant system resources when running "per second", influencing the monitored systems and applications to a great degree. + +Finally, per second data collection is a lot harder. Busy virtual environments have [a constant latency of about 100ms, spread randomly to all data sources](https://docs.google.com/presentation/d/18C8bCTbtgKDWqPa57GXIjB2PbjjpjsUNkLtZEz6YK8s/edit#slide=id.g422e696d87_0_57). If data collection is not implemented properly, this latency introduces a random error of +/- 10%, which is quite significant for a monitoring system. + +So, the monitoring industry fails to massively provide high resolution metrics, mainly for 3 reasons: + +1. Centralization of metrics makes monitoring cost inefficient at that rate. +2. Data collection needs optimization, otherwise it will significantly affect the monitored systems. +3. Data collection is a lot harder, especially on busy virtual environments. + +## What does netdata do differently? + +Netdata decentralizes monitoring completely. Each Netdata node is autonomous. It collects metrics locally, it stores them locally, it runs checks against them to trigger alarms locally, and provides an API for the dashboards to visualize them. This allows Netdata to scale to infinity. + +Of course, Netdata can centralize metrics when needed. For example, it is not practical to keep metrics locally on ephemeral nodes. For these cases, Netdata streams the metrics in real-time, from the ephemeral nodes to one or more non-ephemeral nodes nearby. This centralization is again distributed. On a large infrastructure, there may be many centralization points. + +To eliminate the error introduced by data collection latencies on busy virtual environments, Netdata interpolates collected metrics. It does this using microsecond timings, per data source, offering measurements with an error rate of 0.0001%. When running [in debug mode, netdata calculates this error rate](https://github.com/netdata/netdata/blob/36199f449852f8077ea915a3a14a33fa2aff6d85/database/rrdset.c#L1070-L1099) for every point collected, ensuring that the database works with acceptable accuracy. + +Finally, Netdata is really fast. Optimization is a core product feature. On modern hardware, Netdata can collect metrics with a rate of above 1M metrics per second per core (this includes everything, parsing data sources, interpolating data, storing data in the time series database, etc). So, for a few thousands metrics per second per node, Netdata needs negligible CPU resources (just 1-2% of a single core). + +Netdata has been designed to: +- Solve the centralization problem of monitoring +- Replace the console for performance troubleshooting. + +So, for Netdata 1s granularity is easy, the natural outcome... + +[]() diff --git a/docs/why-netdata/README.md b/docs/why-netdata/README.md new file mode 100644 index 000000000..df8c0d02b --- /dev/null +++ b/docs/why-netdata/README.md @@ -0,0 +1,30 @@ +# Why Netdata + +> Any performance monitoring solution that does not go down to per second +> collection and visualization of the data, is useless. +> It will make you happy to have it, but it will not help you more than that. + +Netdata is built around 4 principles: + +1. **[Per second data collection for all metrics.](1s-granularity.md)** + + *It is impossible to monitor a 2 second SLA, with 10 second metrics.* + +2. **[Collect and visualize all the metrics from all possible sources.](unlimited-metrics.md)** + + *To troubleshoot slowdowns, we need all the available metrics. The console should not provide more metrics.* + +3. **[Meaningful presentation, optimized for visual anomaly detection.](meaningful-presentation.md)** + + *Metrics are a lot more than name-value pairs over time. The monitoring tool should know all the metrics. Users should not!* + +4. **[Immediate results, just install and use.](immediate-results.md)** + + *Most of our infrastructure is standardized. There is no point to configure everything metric by metric.* + +Unlike other monitoring solutions that focus on metrics visualization, +Netdata's helps us troubleshoot slowdowns without touching the console. + +So, everything is a bit different. + +[]() diff --git a/docs/why-netdata/immediate-results.md b/docs/why-netdata/immediate-results.md new file mode 100644 index 000000000..9afe4afdc --- /dev/null +++ b/docs/why-netdata/immediate-results.md @@ -0,0 +1,41 @@ +# Immediate results + +Most of our infrastructure is based on standardized systems and applications. + +It is a tremendous waste of time and effort, in a global scale, to require from all users to configure their infrastructure dashboards and alarms metric by metric. + +## Why? + +Most of the existing monitoring solutions, focus on providing a platform "for building your monitoring". So, they provide the tools to collect metrics, store them, visualize them, check them and query them. And we are all expected to go through this process. + +However, most of our infrastructure is standardized. We run well known Linux distributions, the same kernel, the same database, the same web server, etc. + +So, why can't we have a monitoring system that can be installed and instantly provide feature rich dashboards and alarms about everything we use? Is there any reason you would like to monitor your web server differently than me? + +What a waste of time and money! Hundreds of thousands of people doing the same thing over and over again, trying to understand what the metrics are, how to visualize them, how to configure alarms for them and how to query them when issues arise. + +## What do others do? + +Open-source solutions rely almost entirely on configuration. So, you have to go through endless metric-by-metric configuration yourself. The result will reflect your skills, your experience, your understanding. + +Monitoring SaaS providers offer a very basic set of pre-configured metrics, dashboards and alarms. They assume that you will configure the rest you may need. So, once more, the result will reflect your skills, your experience, your understanding. + +## What does netdata do? + +1. Metrics are auto-detected, so for 99% of the cases data collection works out of the box. +2. Metrics are converted to human readable units, right after data collection, before storing them into the database. +3. Metrics are structured, organized in charts, families and applications, so that they can be browsed. +4. Dashboards are automatically generated, so all metrics are available for exploration immediately after installation. +5. Dashboards are not just visualizing metrics; they are a tool, optimized for visual anomaly detection. +6. Hundreds of pre-configured alarm templates are automatically attached to collected metrics. + +The result is that Netdata can be used immediately after installation! + +Netdata: + +- Helps engineers understand and learn what the metrics are. +- Does not require any configuration. Of course there are thousands of options to tweak, but the defaults are pretty good for most systems. +- Does not introduce any query languages or any other technology to be learned. Of course some familiarity with the tool is required, but nothing too complicated. +- Includes all the community expertise and experience for monitoring systems and applications. + +[]() diff --git a/docs/why-netdata/meaningful-presentation.md b/docs/why-netdata/meaningful-presentation.md new file mode 100644 index 000000000..6414d023f --- /dev/null +++ b/docs/why-netdata/meaningful-presentation.md @@ -0,0 +1,63 @@ +# Meaningful presentation + +Metrics are a lot more than name-value pairs over time. It is just not practical to require from all users to have a deep understanding of all metrics for monitoring their systems and applications. + +## Why? + +There is a plethora of metrics. And each of them has a context, a meaning, a way to be interpreted. + +Traditionally, monitoring solutions instruct engineers to collect only the metrics they understand. This is a good strategy as long as you have a clear understanding of what you need and you have the skills, the expertise and the experience to select them. + +For most people, this is an impossible task. It is just not practical to assume that any engineer will have a deep understanding of how the kernel works, how the networking stack works, how the system manages its memory, how it schedules processes, how web servers work, how databases work, etc. + +The result is that for most of the world, monitoring sucks. It is incomplete, inefficient, and in most of the cases only useful for providing an illusion that the infrastructure is being monitored. It is not! According to the [State of Monitoring 2017](http://start.bigpanda.io/state-of-monitoring-report-2017), only 11% of the companies are satisfied with their existing monitoring infrastructure, and on the average they use 6-7 monitoring tools. + +But even if all the metrics are collected, an even bigger challenge is revealed: What to do with them? How to use them? + +The existing monitoring solutions, assume the engineers will: + +- Design dashboards +- Configure alarms +- Use a query language to investigate issues + +However, all these have to be configured metric by metric. + +The monitoring industry believes there is this "IT Operations Hero", a person combining these abilities: + +1. Has a deep understanding of IT architectures and is a skillful SysAdmin. +2. Is a superb Network Administrator (can even read and understand the Linux kernel networking stack). +3. Is a exceptional database administrator. +4. Is fluent in software engineering, capable of understanding the internal workings of applications. +5. Masters Data Science, statistical algorithms and is fluent in writing advanced mathematical queries to reveal the meaning of metrics. + +Of course this person does not exist! + +## What do others do? + +Most solutions are based on a time-series database. A database that tracks name-value pairs, over time. + +Data collection blindly collects metrics and stores them into the database, dashboard editors query the database to visualize the metrics. They may also provide a query editor, that users can use to query the database by hand. + +Of course, it is just not practical to work that way when the database has 10,000 unique metrics. Most of them will be just noise, not because they are not useful, but because no one understands them! + +So, they collect very limited metrics. Basic dashboards can be created with these metrics, but for any issue that needs to be troubleshooted, the monitoring system is just not adequate. It cannot help. So, engineers are using the console to access the rest of the metrics and find the root cause. + +## What does netdata do? + +In netdata, the meaning of metrics is incorporated into the database: + +1. all metrics are converted and stored to human-friendly units. This is a data-collection process, not a visualization process. For example, cpu utilization in Netdata is stored as percentage, not as kernel ticks. + +2. all metrics are organized into human-friendly charts, sharing the same context and units (similar to what other monitoring solutions call `cardinality`). So, when Netdata developer collect metrics, they configure the correlation of the metrics right in data collection, which is stored in the database too. + +3. all charts are then organized in families, and chart families are organized in applications. These structures are responsible for providing the menu at the right side of Netdata dashboards for exploring the whole database. + +The result is a system that can be browsed by humans, even if the database has 100,000 unique metrics. It is pretty natural for everyone to browse them, understand their meaning and their scope. + +Of course, this process makes data collection significantly more time consuming. Netdata developers need to normalize and correlate and categorize every single metric Netdata collects. + +But it simplifies everything else. Data collection, metrics database and visualization are de-coupled, thus the query engine is simpler, and the visualization is straight forward. + +Netdata goes a step further, by enriching the dashboard with information that is useful for most people. So, to improve clarity and help users be more effective, Netdata includes right in the dashboard the community knowledge and expertise about the metrics. So, that Netdata users can focus on solving their infrastructure problem, not on the technicalities of data collection and visualization. + +[]() diff --git a/docs/why-netdata/unlimited-metrics.md b/docs/why-netdata/unlimited-metrics.md new file mode 100644 index 000000000..e35034a2b --- /dev/null +++ b/docs/why-netdata/unlimited-metrics.md @@ -0,0 +1,44 @@ +# Unlimited metrics + +All metrics are important and all metrics should be available when you need them. + +## Why? + +Collecting all the metrics breaks the first rule of every monitoring text book: "collect only the metrics you need", "collect only the metrics you understand". + +Unfortunately, this does not work! Filtering out most metrics is like reading a book by skipping most of its pages... + +For many people, monitoring is about: + +- Detecting outages +- Capacity planning + +However, **slowdowns are 10 times more common** compared to outages (check slide 14 of [Online Performance is Business Performance ](https://www.slideshare.net/KenGodskind/alertsitetrac) reported by Trac Research/AlertSite). Designing a monitoring system targeting only outages and capacity planning solves just a tiny part of the operational problems we face. Check also [Downtime vs. Slowtime: Which Hurts More?](https://dzone.com/articles/downtime-vs-slowtime-which-hurts-more). + +To troubleshoot a slowdown, a lot more metrics are needed. Actually all the metrics are needed, since the real cause of a slowdown is most probably quite complex. If we knew the possible reasons, chances are we would have fixed them before they become a problem. + +## What do others do? + +Most monitoring solutions, when they are able to detect something, provide just a hint (e.g. "hey, there is a 20% drop in requests per second over the last minute") and they expect us to use the console for determining the root cause. + +Of course this introduces a lot more problems: how to troubleshoot a slowdown using the console, if the slowdown lifetime is just a few seconds, randomly spread throughout the day? + +You can't! You will spend your entire day on the console, waiting for the problem to happen again while you are logged in. A blame war starts: developers blame the systems, sysadmins blame the hosting provider, someone says it is a DNS problem, another one believes it is network related, etc. We have all experienced this, multiple times... + +So, why do monitoring solutions and SaaS providers filter out metrics? + +They can't do otherwise! + +1. Centralization of metrics depends on metrics filtering, to control monitoring costs. Time-series databases limit the number of metrics collected, because the number of metrics influences their performance significantly. They get congested at scale. +2. It is a lot easier to provide an illusion of monitoring by using a few basic metrics. +3. Troubleshooting slowdowns is the hardest IT problem to solve, so most solutions just avoid it. + +## What does netdata do? + +Netdata collects, stores and visualizes everything, every single metric exposed by systems and applications. + +Due to Netdata's distributed nature, the number of metrics collected does not have any noticeable effect on the performance or the cost of the monitoring infrastructure. + +Of course, since netdata is also about [meaningful presentation](meaningful-presentation.md), the number of metrics makes Netdata development slower. We, the Netdata developers, need to have a good understanding of the metrics before adding them into Netdata. We need to organize the metrics, add information related to them, configure alarms for them, so that you, the Netdata users, will have the best out-of-the-box experience and all the information required to kill the console for troubleshooting slowdowns. + +[]() |