
diff options
| author | Daniel Baumann <daniel.baumann@progress-linux.org> | 2023-10-17 09:30:23 +0000 |
|---|---|---|
| committer | Daniel Baumann <daniel.baumann@progress-linux.org> | 2023-10-17 09:30:23 +0000 |
| commit | 517a443636daa1e8085cb4e5325524a54e8a8fd7 (patch) | |
| tree | 5352109cc7cd5122274ab0cfc1f887b685f04edf /docs | |
| parent | Releasing debian version 1.42.4-1. (diff) | |
| download | netdata-517a443636daa1e8085cb4e5325524a54e8a8fd7.tar.xz netdata-517a443636daa1e8085cb4e5325524a54e8a8fd7.zip | |
Merging upstream version 1.43.0.
Signed-off-by: Daniel Baumann <daniel.baumann@progress-linux.org>
Diffstat (limited to 'docs')
33 files changed, 369 insertions, 262 deletions
diff --git a/docs/category-overview-pages/accessing-netdata-dashboards.md b/docs/category-overview-pages/accessing-netdata-dashboards.md index 024d0bd7..97df8b83 100644 --- a/docs/category-overview-pages/accessing-netdata-dashboards.md +++ b/docs/category-overview-pages/accessing-netdata-dashboards.md @@ -7,7 +7,7 @@ A user accessing the Netdata dashboard **from the Cloud** will always be present A user accessing the Netdata dashboard **from the Agent** will, by default, be presented with the latest Netdata dashboard version (the same as Netdata Cloud) except in the following scenarios: * Agent doesn't have Internet access, and is unable to get the latest Netdata dashboards, as a result it falls back to the Netdata dashboard version that was shipped with the agent. -* Users have defined, e.g. through URL bookmark, that they wants to see the previous version of the dashboard (accessible `http://NODE:19999/v1`, replacing `NODE` with the IP address or hostname of your Agent). +* Users have defined, e.g. through URL bookmark, that they want to see the previous version of the dashboard (accessible `http://NODE:19999/v1`, replacing `NODE` with the IP address or hostname of your Agent). ## Main sections @@ -16,12 +16,23 @@ The Netdata dashboard consists of the following main sections: * [Infrastructure Overview](https://github.com/netdata/netdata/blob/master/docs/visualize/overview-infrastructure.md) * [Nodes view](https://github.com/netdata/netdata/blob/master/docs/cloud/visualize/nodes.md) * [Custom dashboards](https://learn.netdata.cloud/docs/visualizations/custom-dashboards) -* [Alerts](https://github.com/netdata/netdata/blob/master/docs/monitor/view-active-alarms.md) +* [Alerts](https://github.com/netdata/netdata/blob/master/docs/monitor/view-active-alerts.md) * [Anomaly Advisor](https://github.com/netdata/netdata/blob/master/docs/cloud/insights/anomaly-advisor.md) * [Functions](https://github.com/netdata/netdata/blob/master/docs/cloud/netdata-functions.md) * [Events feed](https://github.com/netdata/netdata/blob/master/docs/cloud/insights/events-feed.md) -> ⚠️ Some sections of the dashboard, when accessed through the agent, may require the user to be signed-in to Netdata Cloud or having the Agent claimed to Netdata Cloud for their full functionality. Examples include saving visualization settings on charts or custom dashboards, claiming the node to Netdata Cloud, or executing functions on an Agent. +> ⚠️ Some sections of the dashboard, when accessed through the agent, may require the user to be signed in to Netdata Cloud or having the Agent claimed to Netdata Cloud for their full functionality. Examples include saving visualization settings on charts or custom dashboards, claiming the node to Netdata Cloud, or executing functions on an Agent. + +## How to access the dashboards? + +### Netdata Cloud + +You can access the dashboard at https://app.netdata.cloud/ and [sign-in](https://github.com/netdata/netdata/blob/master/docs/cloud/manage/sign-in.md) with an account or [sign-up](https://github.com/netdata/netdata/blob/master/docs/cloud/manage/sign-in.md#dont-have-a-netdata-cloud-account-yet) if you don't have an account yet. + +### Netdata Agent + +Netdata starts a web server for its dashboard at port `19999`. Open up your web browser of choice and +navigate to `http://NODE:19999`, replacing `NODE` with the IP address or hostname of your Agent. If installed on localhost, you can access it through `http://localhost:19999`. Documentation for previous Agent dashboard can still be found [here](https://github.com/netdata/netdata/blob/master/web/gui/README.md).
\ No newline at end of file diff --git a/docs/category-overview-pages/deployment-strategies.md b/docs/category-overview-pages/deployment-strategies.md index f8a68b46..69daaf9f 100644 --- a/docs/category-overview-pages/deployment-strategies.md +++ b/docs/category-overview-pages/deployment-strategies.md @@ -265,4 +265,4 @@ We also suggest that you: 3. [Use host labels](https://github.com/netdata/netdata/blob/master/docs/guides/using-host-labels.md) - To organize systems, metrics, and alarms. + To organize systems, metrics, and alerts. diff --git a/docs/cloud/alerts-notifications/add-webhook-notification-configuration.md b/docs/cloud/alerts-notifications/add-webhook-notification-configuration.md index 012b0478..4fb518f6 100644 --- a/docs/cloud/alerts-notifications/add-webhook-notification-configuration.md +++ b/docs/cloud/alerts-notifications/add-webhook-notification-configuration.md @@ -42,23 +42,23 @@ Netdata webhook integration service will send alert notifications to the destina The notification content sent to the destination service will be a JSON object having these properties: -| field | type | description | -| :-- | :-- | :-- | -| message | string | A summary message of the alert. | -| alarm | string | The alarm the notification is about. | -| info | string | Additional info related with the alert. | -| chart | string | The chart associated with the alert. | -| context | string | The chart context. | -| space | string | The space where the node that raised the alert is assigned. | -| rooms | object[object(string,string)] | Object with list of rooms names and urls where the node belongs to. | -| family | string | Context family. | -| class | string | Classification of the alert, e.g. "Error". | -| severity | string | Alert severity, can be one of "warning", "critical" or "clear". | -| date | string | Date of the alert in ISO8601 format. | -| duration | string | Duration the alert has been raised. | -| additional_active_critical_alerts | integer | Number of additional critical alerts currently existing on the same node. | -| additional_active_warning_alerts | integer | Number of additional warning alerts currently existing on the same node. | -| alarm_url | string | Netdata Cloud URL for this alarm. | +| field | type | description | +|:----------------------------------|:------------------------------|:--------------------------------------------------------------------------| +| message | string | A summary message of the alert. | +| alarm | string | The alert the notification is about. | +| info | string | Additional info related with the alert. | +| chart | string | The chart associated with the alert. | +| context | string | The chart context. | +| space | string | The space where the node that raised the alert is assigned. | +| rooms | object[object(string,string)] | Object with list of rooms names and urls where the node belongs to. | +| family | string | Context family. | +| class | string | Classification of the alert, e.g. "Error". | +| severity | string | Alert severity, can be one of "warning", "critical" or "clear". | +| date | string | Date of the alert in ISO8601 format. | +| duration | string | Duration the alert has been raised. | +| additional_active_critical_alerts | integer | Number of additional critical alerts currently existing on the same node. | +| additional_active_warning_alerts | integer | Number of additional warning alerts currently existing on the same node. | +| alarm_url | string | Netdata Cloud URL for this alert. | ### Extra headers @@ -66,9 +66,9 @@ When setting up a webhook integration, the user can specify a set of headers to By default, the following headers will be sent in the HTTP request -| **Header** | **Value** | -|:-------------------------------:|-----------------------------| -| Content-Type | application/json | +| **Header** | **Value** | +|:------------:|------------------| +| Content-Type | application/json | ### Authentication mechanisms diff --git a/docs/cloud/alerts-notifications/notifications.md b/docs/cloud/alerts-notifications/notifications.md index ad115d43..cde30a2b 100644 --- a/docs/cloud/alerts-notifications/notifications.md +++ b/docs/cloud/alerts-notifications/notifications.md @@ -8,7 +8,7 @@ you or your team. Having this information centralized helps you: * Have a clear view of the health across your infrastructure, seeing all alerts in one place. -* Easily [setup your alert notification process](https://github.com/netdata/netdata/blob/master/docs/cloud/alerts-notifications/manage-notification-methods.md): +* Easily [set up your alert notification process](https://github.com/netdata/netdata/blob/master/docs/cloud/alerts-notifications/manage-notification-methods.md): methods to use and where to use them, filtering rules, etc. * Quickly troubleshoot using [Metric Correlations](https://github.com/netdata/netdata/blob/master/docs/cloud/insights/metric-correlations.md) or [Anomaly Advisor](https://github.com/netdata/netdata/blob/master/docs/cloud/insights/anomaly-advisor.md) @@ -104,8 +104,8 @@ if the node should be silenced for the entire space or just for specific rooms ( ### Scope definition for Alerts * **Alert name:** silencing a specific alert name silences all alert state transitions for that specific alert. -* **Alert context:** silencing a specific alert context will silence all alert state transitions for alerts targeting that chart context, for more details check [alert configuration docs](https://github.com/netdata/netdata/blob/master/health/REFERENCE.md#alarm-line-on). -* **Alert role:** silencing a specific alert role will silence all the alert state transitions for alerts that are configured to be specific role recipients, for more details check [alert configuration docs](https://github.com/netdata/netdata/blob/master/health/REFERENCE.md#alarm-line-to). +* **Alert context:** silencing a specific alert context will silence all alert state transitions for alerts targeting that chart context, for more details check [alert configuration docs](https://github.com/netdata/netdata/blob/master/health/REFERENCE.md#alert-line-on). +* **Alert role:** silencing a specific alert role will silence all the alert state transitions for alerts that are configured to be specific role recipients, for more details check [alert configuration docs](https://github.com/netdata/netdata/blob/master/health/REFERENCE.md#alert-line-to). Beside the above two main entities there are another two important settings that you can define on a silencing rule: * Who does the rule affect? **All user** in the space or **Myself** @@ -124,24 +124,24 @@ the local Agent dashboard at `http://NODE:19999`. ## Anatomy of an alert notification -Email alarm notifications show the following information: +Email alert notifications show the following information: - The Space's name - The node's name -- Alarm status: critical, warning, cleared -- Previous alarm status -- Time at which the alarm triggered -- Chart context that triggered the alarm -- Name and information about the triggered alarm -- Alarm value +- Alert status: critical, warning, cleared +- Previous alert status +- Time at which the alert triggered +- Chart context that triggered the alert +- Name and information about the triggered alert +- Alert value - Total number of warning and critical alerts on that node -- Threshold for triggering the given alarm state +- Threshold for triggering the given alert state - Calculation or database lookups that Netdata uses to compute the value -- Source of the alarm, including which file you can edit to configure this alarm on an individual node +- Source of the alert, including which file you can edit to configure this alert on an individual node Email notifications also feature a **Go to Node** button, which takes you directly to the offending chart for that node within Cloud's embedded dashboards. Here's an example email notification for the `ram_available` chart, which is in a critical state: -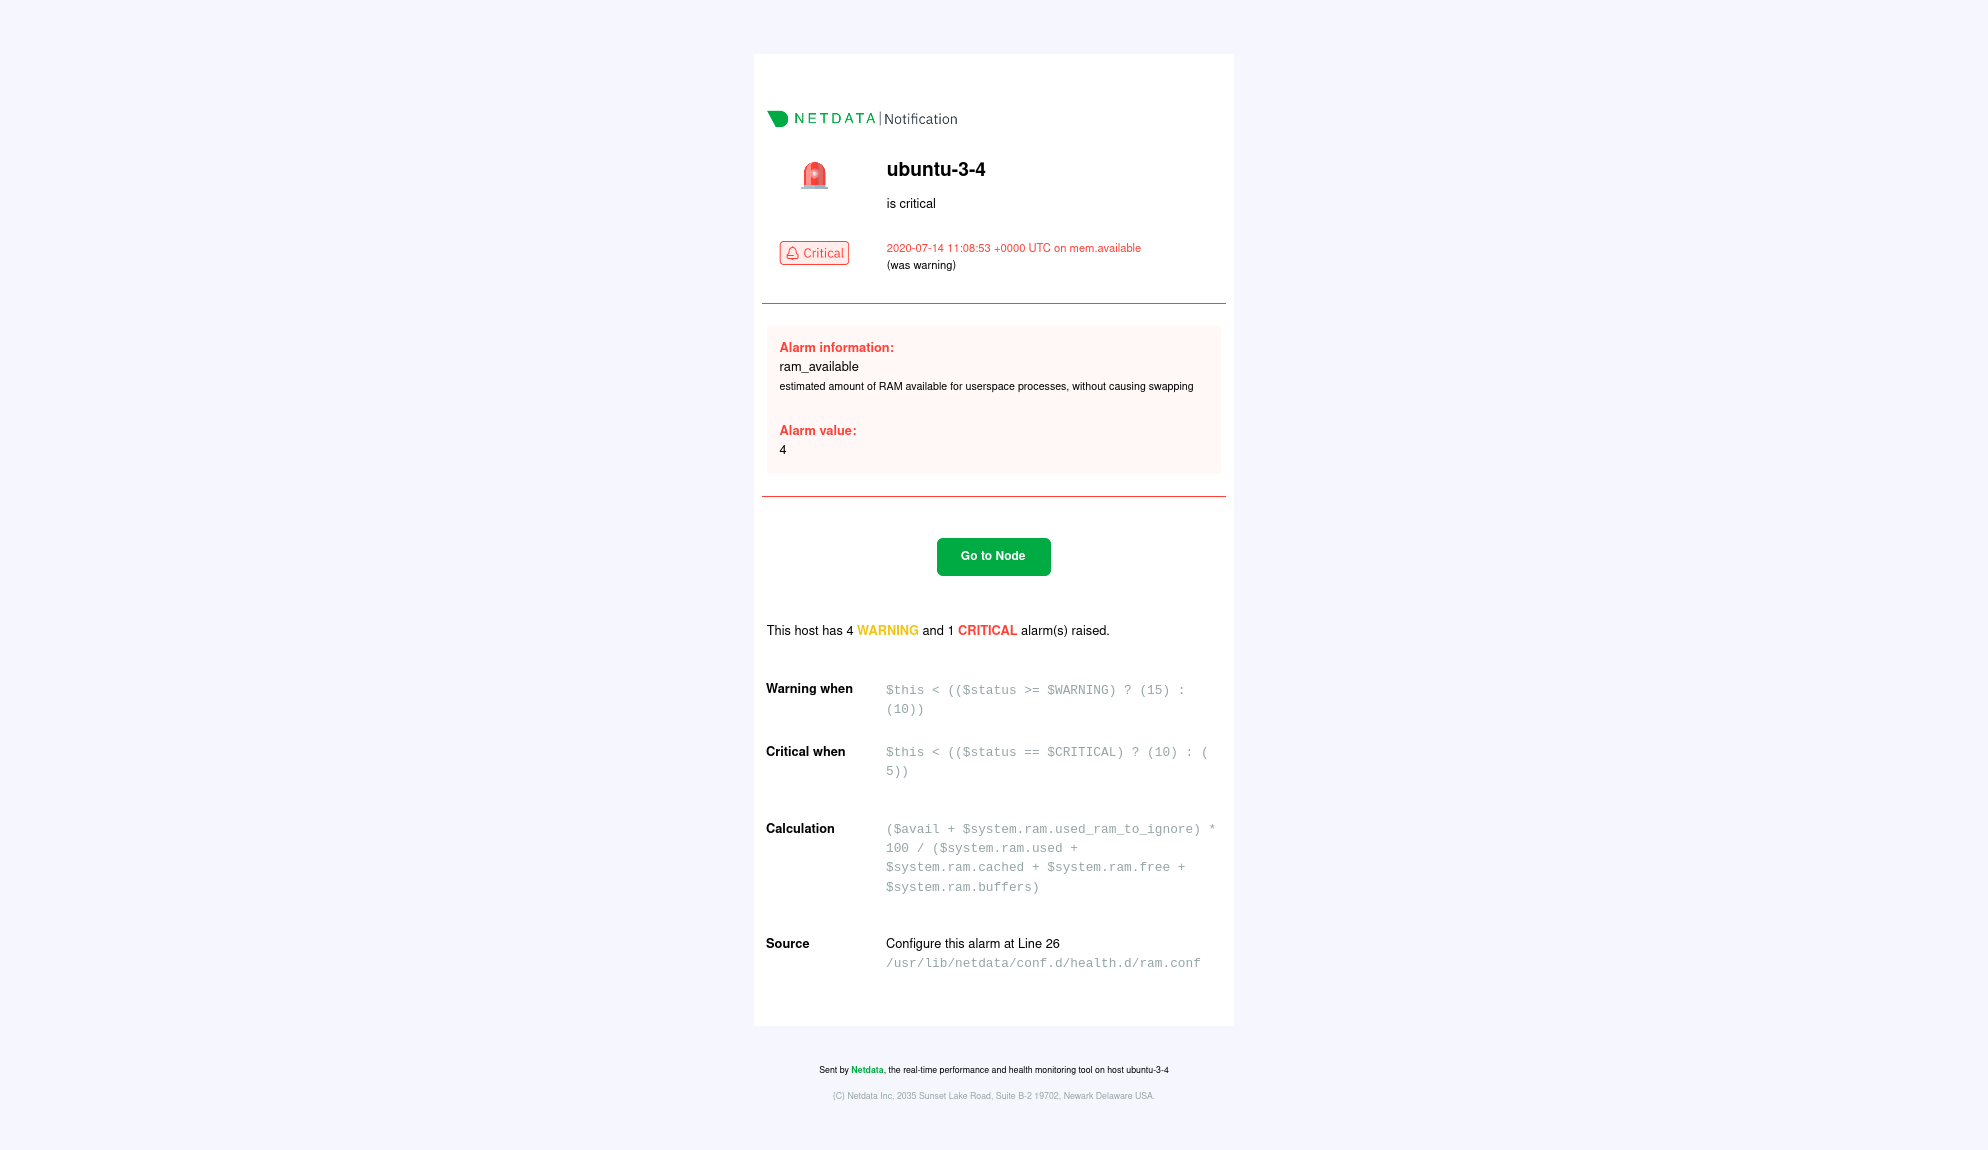 + diff --git a/docs/cloud/cheatsheet.md b/docs/cloud/cheatsheet.md index 35a6a2c9..a3d2f028 100644 --- a/docs/cloud/cheatsheet.md +++ b/docs/cloud/cheatsheet.md @@ -99,13 +99,13 @@ modules: sudo ./edit-config go.d/mysql.conf ``` -### Alarms & notifications +### Alerts & notifications -<!-- #### Add a new alarm +<!-- #### Add a new alert ``` -sudo touch health.d/example-alarm.conf -sudo ./edit-config health.d/example-alarm.conf +sudo touch health.d/example-alert.conf +sudo ./edit-config health.d/example-alert.conf ``` --> After any change, reload the Netdata health configuration: @@ -115,23 +115,23 @@ netdatacli reload-health killall -USR2 netdata ``` -#### Configure a specific alarm +#### Configure a specific alert ```bash -sudo ./edit-config health.d/example-alarm.conf +sudo ./edit-config health.d/example-alert.conf ``` -#### Silence a specific alarm +#### Silence a specific alert ```bash -sudo ./edit-config health.d/example-alarm.conf +sudo ./edit-config health.d/example-alert.conf ``` ``` to: silent ``` -<!-- #### Disable alarms and notifications +<!-- #### Disable alerts and notifications ```conf [health] @@ -142,14 +142,14 @@ sudo ./edit-config health.d/example-alarm.conf ### Manage the daemon -| Intent | Action | -| :-------------------------- | --------------------------------------------------------------------: | -| Start Netdata | `$ sudo service netdata start` | -| Stop Netdata | `$ sudo service netdata stop` | -| Restart Netdata | `$ sudo service netdata restart` | -| Reload health configuration | `$ sudo netdatacli reload-health` `$ killall -USR2 netdata` | -| View error logs | `less /var/log/netdata/error.log` | -| View collectors logs | `less /var/log/netdata/collector.log` | +| Intent | Action | +|:----------------------------|------------------------------------------------------------:| +| Start Netdata | `$ sudo service netdata start` | +| Stop Netdata | `$ sudo service netdata stop` | +| Restart Netdata | `$ sudo service netdata restart` | +| Reload health configuration | `$ sudo netdatacli reload-health` `$ killall -USR2 netdata` | +| View error logs | `less /var/log/netdata/error.log` | +| View collectors logs | `less /var/log/netdata/collector.log` | #### Change the port Netdata listens to (example, set it to port 39999) diff --git a/docs/cloud/manage/sign-in.md b/docs/cloud/manage/sign-in.md index 96275f57..53ea3a22 100644 --- a/docs/cloud/manage/sign-in.md +++ b/docs/cloud/manage/sign-in.md @@ -23,7 +23,7 @@ device, and sign in. ### Don't have a Netdata Cloud account yet? -If you don't have a Netdata Cloud account yet you won't need to worry about it. During the sign in process we will create one for you and make the process seamless to you. +If you don't already have a Netdata Cloud account, you don't need to worry about this. During the sign-in process we will create one for you and make the process seamless to you. After your account is created and you sign in to Netdata, you first are asked to agree to Netdata Cloud's [Privacy Policy](https://www.netdata.cloud/privacy/) and [Terms of Use](https://www.netdata.cloud/terms/). Once you agree with these you are directed @@ -40,14 +40,14 @@ If you don't see the email, try the following: - Check your spam folder. - In Gmail, check the **Updates** category. - Check [Netdata Cloud status](https://status.netdata.cloud) for ongoing issues with our infrastructure. -- Request another sign in email via the [sign in page](https://app.netdata.cloud/sign-in?cloudRoute=spaces?utm_source=docs&utm_content=sign_in_button_troubleshooting_section). +- Request another sign in email via the [sign-in page](https://app.netdata.cloud/sign-in?cloudRoute=spaces?utm_source=docs&utm_content=sign_in_button_troubleshooting_section). You may also want to add `no-reply@netdata.cloud` to your address book or contacts list, especially if you're using a public email service, such as Gmail. You may also want to whitelist/allowlist either the specific email or the entire `netdata.cloud` domain. In some cases, temporary issues with your mail server or email account may result in your email address being added to a Bounce list by Sendgrid. -If you are added to that list, no Netdata cloud email can reach you, including alarm notifications. Let us know in Discord that you have trouble receiving +If you are added to that list, no Netdata cloud email can reach you, including alert notifications. Let us know in Discord that you have trouble receiving any email from us and someone will ask you to provide your email address privately, so we can check if you are on the Bounce list. ## Google and GitHub OAuth diff --git a/docs/cloud/netdata-functions.md b/docs/cloud/netdata-functions.md index 949c8b4c..80616ca4 100644 --- a/docs/cloud/netdata-functions.md +++ b/docs/cloud/netdata-functions.md @@ -33,7 +33,8 @@ functions - [plugins.d](https://github.com/netdata/netdata/blob/master/collector | Function | Description | plugin - module | | :-- | :-- | :-- | | processes | Detailed information on the currently running processes on the node. | [apps.plugin](https://github.com/netdata/netdata/blob/master/collectors/apps.plugin/README.md) | -| ebpf_thread | Controller for eBPF threads. | [ebpf.plugin](https://github.com/netdata/netdata/blob/master/collectors/ebpf.plugin/README.md) | +| ebpf_socket | Detailed socket information. | [ebpf.plugin](https://github.com/netdata/netdata/blob/master/collectors/ebpf.plugin/README.md#ebpf_thread) | +| ebpf_thread | Controller for eBPF threads. | [ebpf.plugin](https://github.com/netdata/netdata/blob/master/collectors/ebpf.plugin/README.md#ebpf_socket) | If you have ideas or requests for other functions: * Participate in the relevant [GitHub discussion](https://github.com/netdata/netdata/discussions/14412) diff --git a/docs/cloud/visualize/interact-new-charts.md b/docs/cloud/visualize/interact-new-charts.md index 3707e945..16db927a 100644 --- a/docs/cloud/visualize/interact-new-charts.md +++ b/docs/cloud/visualize/interact-new-charts.md @@ -1,4 +1,4 @@ -# Interact with charts +# Netdata Charts Learn how to use Netdata's powerful charts to troubleshoot with real-time, per-second metric data. @@ -37,6 +37,65 @@ With a quick glance you have immediate information available at your disposal: - [Chart area](#hover-over-the-chart) - [Legend with dimensions](#dimensions-bar) +## Fundemental elements + +While Netdata's charts require no configuration and are easy to interact with, they have a lot of underlying complexity. To meaningfully organize charts out of the box based on what's happening in your nodes, Netdata uses the concepts of [dimensions](#dimensions), [contexts](#contexts), and [families](#families). + +Understanding how these work will help you more easily navigate the dashboard, +[write new alerts](https://github.com/netdata/netdata/blob/master/health/REFERENCE.md), or play around +with the [API](https://github.com/netdata/netdata/blob/master/web/api/README.md). + +### Dimensions + +A **dimension** is a value that gets shown on a chart. The value can be raw data or calculated values, such as the +average (the default), minimum, or maximum. These values can then be given any type of unit. For example, CPU +utilization is represented as a percentage, disk I/O as `MiB/s`, and available RAM as an absolute value in `MiB` or +`GiB`. + +Beneath every chart (or on the right-side if you configure the dashboard) is a legend of dimensions. When there are +multiple dimensions, you'll see a different entry in the legend for each dimension. + +The **Apps CPU Time** chart (with the [context](#contexts) `apps.cpu`), which visualizes CPU utilization of +different types of processes/services/applications on your node, always provides a vibrant example of a chart with +multiple dimensions. + +Dimensions can be [hidden](#show-and-hide-dimensions) to help you focus your attention. + +### Contexts + +A **context** is a way of grouping charts by the types of metrics collected and dimensions displayed. It's like a machine-readable naming and organization scheme. + +For example, the **Apps CPU Time** has the context `apps.cpu`. A little further down on the dashboard is a similar +chart, **Apps Real Memory (w/o shared)** with the context `apps.mem`. The `apps` portion of the context is the **type**, +whereas anything after the `.` is specified either by the chart's developer or by the [family](#families). + +By default, a chart's type affects where it fits in the menu, while its family creates submenus. + +Netdata also relies on contexts for [alert configuration](https://github.com/netdata/netdata/blob/master/health/REFERENCE.md) (the [`on` line](https://github.com/netdata/netdata/blob/master/health/REFERENCE.md#alert-line-on)). + +### Families + +**Families** are a _single instance_ of a hardware or software resource that needs to be displayed separately from +similar instances. + +For example, let's look at the **Disks** section, which contains a number of charts with contexts like `disk.io`, +`disk.ops`, `disk.backlog`, and `disk.util`. If your node has multiple disk drives at `sda` and `sdb`, Netdata creates +a separate family for each. + +Netdata now merges the contexts and families to create charts that are grouped by family, following a +`[context].[family]` naming scheme, so that you can see the `disk.io` and `disk.ops` charts for `sda` right next to each +other. + +Given the four example contexts, and two families of `sda` and `sdb`, Netdata will create the following charts and their +names: + +| Context | `sda` family | `sdb` family | +|:---------------|--------------------|--------------------| +| `disk.io` | `disk_io.sda` | `disk_io.sdb` | +| `disk.ops` | `disk_ops.sda` | `disk_ops.sdb` | +| `disk.backlog` | `disk_backlog.sda` | `disk_backlog.sdb` | +| `disk.util` | `disk_util.sda` | `disk_util.sdb` | + ## Title bar When you start interacting with a chart, you'll notice valuable information on the top bar: @@ -77,7 +136,6 @@ Each composite chart has a definition bar to provide information and options abo To help users instantly understand and validate the data they see on charts, we developed the NIDL (Nodes, Instances, Dimensions, Labels) framework. This information is visualized on all charts. - > You can explore the in-depth infographic, by clicking on this image and opening it in a new tab, > allowing you to zoom in to the different parts of it. > @@ -85,7 +143,6 @@ To help users instantly understand and validate the data they see on charts, we > <img src="https://user-images.githubusercontent.com/2662304/235475061-44628011-3b1f-4c44-9528-34452018eb89.png" width="400" border="0" align="center"/> > </a> - You can rapidly access condensed information for collected metrics, grouped by node, monitored instances, dimension, or any key/value label pair. At the Definition bar of each chart, there are a few dropdown menus: @@ -176,7 +233,6 @@ This menu also presents the contribution of each original dimensions on the char <img src="https://user-images.githubusercontent.com/70198089/236138796-08dc6ac6-9a50-4913-a46d-d9bbcedd48f6.png" width="900"/> - ### Labels dropdown In this dropdown, you can view or filter the contributing time-series labels of the chart. @@ -293,7 +349,6 @@ The available manipulation tools you can select are: - Chart zoom - Reset zoom - ### Pan Drag your mouse/finger to the right to pan backward through time, or drag to the left to pan forward in time. Think of @@ -340,10 +395,8 @@ Zooming out lets you see metrics within the larger context, such as the last hou The bottom legend where you can see the dimensions of the chart can be ordered by: - <img src="https://user-images.githubusercontent.com/70198089/236144658-6c3d0e31-9bcb-45f3-bb95-4eafdcbb0a58.png" width="300" /> - - Dimension name (Ascending or Descending) - Dimension value (Ascending or Descending) - Dimension Anomaly Rate (Ascending or Descending) diff --git a/docs/cloud/visualize/node-filter.md b/docs/cloud/visualize/node-filter.md index 889caaf8..0dd0ef5a 100644 --- a/docs/cloud/visualize/node-filter.md +++ b/docs/cloud/visualize/node-filter.md @@ -4,15 +4,11 @@ The node filter allows you to quickly filter the nodes visualized in a War Room' Inside the filter, the nodes get categorized into three groups: -- Live nodes - Nodes that are currently online, collecting and streaming metrics to Cloud. - - Live nodes display raised [Alert](https://github.com/netdata/netdata/blob/master/docs/monitor/view-active-alarms.md) counters, [Machine Learning](https://github.com/netdata/netdata/blob/master/ml/README.md) availability, and [Functions](https://github.com/netdata/netdata/blob/master/docs/cloud/netdata-functions.md) availability -- Stale nodes - Nodes that are offline and not streaming metrics to Cloud. Only historical data can be presented from a parent node. - - For these nodes you can only see their ML status, as they are not online to provide more information -- Offline nodes - Nodes that are offline, not streaming metrics to Cloud and not available in any parent node. - Offline nodes are automatically deleted after 30 days and can also be deleted manually. +| Group | Description | +|---------|-----------------------------------------------------------------------------------------------------------------------------------------------------------------------------------------------------------------------------------------------------------------------------------------------------------------------------------------------------------------------------------------------------------------------| +| Live | Nodes that are currently online, collecting and streaming metrics to Cloud. Live nodes display raised [Alert](https://github.com/netdata/netdata/blob/master/docs/monitor/view-active-alerts.md) counters, [Machine Learning](https://github.com/netdata/netdata/blob/master/ml/README.md) availability, and [Functions](https://github.com/netdata/netdata/blob/master/docs/cloud/netdata-functions.md) availability | +| Stale | Nodes that are offline and not streaming metrics to Cloud. Only historical data can be presented from a parent node. For these nodes you can only see their ML status, as they are not online to provide more information | +| Offline | Nodes that are offline, not streaming metrics to Cloud and not available in any parent node. Offline nodes are automatically deleted after 30 days and can also be deleted manually. | By using the search bar, you can narrow down to specific nodes based on their name. diff --git a/docs/cloud/visualize/nodes.md b/docs/cloud/visualize/nodes.md index b770c1b8..3ecf76ca 100644 --- a/docs/cloud/visualize/nodes.md +++ b/docs/cloud/visualize/nodes.md @@ -7,7 +7,7 @@ to any node's dashboard for troubleshooting performance issues or anomalies usin Cloud](https://user-images.githubusercontent.com/1153921/119035218-2eebb700-b964-11eb-8b74-4ec2df0e457c.png) Each War Room's Nodes tab is populated based on the nodes you added to that specific War Room. Each node occupies a -single row, first featuring that node's alarm status (yellow for warnings, red for critical alarms) and operating +single row, first featuring that node's alert status (yellow for warnings, red for critical alerts) and operating system, some essential information about the node, followed by columns of user-defined key metrics represented in real-time charts. diff --git a/docs/collect/container-metrics.md b/docs/collect/container-metrics.md index cde54183..b5ccca5a 100644 --- a/docs/collect/container-metrics.md +++ b/docs/collect/container-metrics.md @@ -71,13 +71,13 @@ _entirely for free_. These methods work together to help you troubleshoot perfor your k8s infrastructure. - A [Helm chart](https://github.com/netdata/helmchart), which bootstraps a Netdata Agent pod on every node in your - cluster, plus an additional parent pod for storing metrics and managing alarm notifications. + cluster, plus an additional parent pod for storing metrics and managing alert notifications. - A [service discovery plugin](https://github.com/netdata/agent-service-discovery), which discovers and creates configuration files for [compatible applications](https://github.com/netdata/helmchart#service-discovery-and-supported-services) and any endpoints covered by our [generic Prometheus collector](https://github.com/netdata/go.d.plugin/blob/master/modules/prometheus/README.md). With these - configuration files, Netdata collects metrics from any compatible applications as they run _inside_ of a pod. + configuration files, Netdata collects metrics from any compatible applications as they run _inside_ a pod. Service discovery happens without manual intervention as pods are created, destroyed, or moved between nodes. - A [Kubelet collector](https://github.com/netdata/go.d.plugin/blob/master/modules/k8s_kubelet/README.md), which runs on each node in a k8s cluster to monitor the number of pods/containers, the volume of operations on each container, diff --git a/docs/configure/common-changes.md b/docs/configure/common-changes.md index 61e5d4c8..1c6f6f5a 100644 --- a/docs/configure/common-changes.md +++ b/docs/configure/common-changes.md @@ -64,45 +64,45 @@ of To disable specific collectors, open `go.d.conf`, `python.d.conf` or `charts.d.conf` and find the line for that specific module. Uncomment the line and change its value to `no`. -## Modify alarms and notifications +## Modify alerts and notifications Netdata's health monitoring watchdog uses hundreds of preconfigured health entities, with intelligent thresholds, to -generate warning and critical alarms for most production systems and their applications without configuration. However, -each alarm and notification method is completely customizable. +generate warning and critical alerts for most production systems and their applications without configuration. However, +each alert and notification method is completely customizable. -### Add a new alarm +### Add a new alert -To create a new alarm configuration file, initiate an empty file, with a filename that ends in `.conf`, in the -`health.d/` directory. The Netdata Agent loads any valid alarm configuration file ending in `.conf` in that directory. -Next, edit the new file with `edit-config`. For example, with a file called `example-alarm.conf`. +To create a new alert configuration file, initiate an empty file, with a filename that ends in `.conf`, in the +`health.d/` directory. The Netdata Agent loads any valid alert configuration file ending in `.conf` in that directory. +Next, edit the new file with `edit-config`. For example, with a file called `example-alert.conf`. ```bash -sudo touch health.d/example-alarm.conf -sudo ./edit-config health.d/example-alarm.conf +sudo touch health.d/example-alert.conf +sudo ./edit-config health.d/example-alert.conf ``` -Or, append your new alarm to an existing file by editing a relevant existing file in the `health.d/` directory. +Or, append your new alert to an existing file by editing a relevant existing file in the `health.d/` directory. -Read more about [configuring alarms](https://github.com/netdata/netdata/blob/master/health/REFERENCE.md) to +Read more about [configuring alerts](https://github.com/netdata/netdata/blob/master/health/REFERENCE.md) to get started, and see the [health monitoring reference](https://github.com/netdata/netdata/blob/master/health/REFERENCE.md) for a full listing of options available in health entities. -### Configure a specific alarm +### Configure a specific alert -Tweak existing alarms by editing files in the `health.d/` directory. For example, edit `health.d/cpu.conf` to change how +Tweak existing alerts by editing files in the `health.d/` directory. For example, edit `health.d/cpu.conf` to change how the Agent responds to anomalies related to CPU utilization. To see which configuration file you need to edit to configure a specific -alarm, [view your active alarms](https://github.com/netdata/netdata/blob/master/docs/monitor/view-active-alarms.md) in +alert, [view your active alerts](https://github.com/netdata/netdata/blob/master/docs/monitor/view-active-alerts.md) in Netdata Cloud or the local Agent dashboard and look for the **source** line. For example, it might read `source 4@/usr/lib/netdata/conf.d/health.d/cpu.conf`. -Because the source path contains `health.d/cpu.conf`, run `sudo edit-config health.d/cpu.conf` to configure that alarm. +Because the source path contains `health.d/cpu.conf`, run `sudo edit-config health.d/cpu.conf` to configure that alert. -### Disable a specific alarm +### Disable a specific alert -Open the configuration file for that alarm and set the `to` line to `silent`. +Open the configuration file for that alert and set the `to` line to `silent`. ```conf template: disk_fill_rate @@ -113,14 +113,13 @@ template: disk_fill_rate to: silent ``` -### Turn of all alarms and notifications +### Turn of all alerts and notifications Set `enabled` to `no` in -the [`[health]` section](https://github.com/netdata/netdata/blob/master/daemon/config/README.md#health-section-options) -section of -`netdata.conf`. +the [`[health]`](https://github.com/netdata/netdata/blob/master/daemon/config/README.md#health-section-options) +section of `netdata.conf`. -### Enable alarm notifications +### Enable alert notifications Open `health_alarm_notify.conf` for editing. First, read the [enabling notifications](https://github.com/netdata/netdata/blob/master/docs/monitor/enable-notifications.md#netdata-agent) doc @@ -156,5 +155,5 @@ The following restrictions apply to host label names: - Names only accept alphabet letters, numbers, dots, and dashes. The policy for values is more flexible, but you can not use exclamation marks (`!`), whitespaces (` `), single quotes -(`'`), double quotes (`"`), or asterisks (`*`), because they are used to compare label values in health alarms and +(`'`), double quotes (`"`), or asterisks (`*`), because they are used to compare label values in health alerts and templates. diff --git a/docs/configure/nodes.md b/docs/configure/nodes.md index 0f31715a..8fdd1070 100644 --- a/docs/configure/nodes.md +++ b/docs/configure/nodes.md @@ -42,7 +42,7 @@ exist. **Application** charts from [`apps.plugin`](https://github.com/netdata/netdata/blob/master/collectors/apps.plugin/README.md) or [`ebpf.plugin`](https://github.com/netdata/netdata/blob/master/collectors/ebpf.plugin/README.md). - `health.d/` is a directory that contains [health configuration files](https://github.com/netdata/netdata/blob/master/health/REFERENCE.md). -- `health_alarm_notify.conf` enables and configures [alarm notifications](https://github.com/netdata/netdata/blob/master/docs/monitor/enable-notifications.md). +- `health_alarm_notify.conf` enables and configures [alert notifications](https://github.com/netdata/netdata/blob/master/docs/monitor/enable-notifications.md). - `statsd.d/` is a directory for configuring Netdata's [statsd collector](https://github.com/netdata/netdata/blob/master/collectors/statsd.plugin/README.md). - `stream.conf` configures [parent-child streaming](https://github.com/netdata/netdata/blob/master/streaming/README.md) between separate nodes running the Agent. - `.environment` is a hidden file that describes the environment in which the Netdata Agent is installed, including the diff --git a/docs/contributing/style-guide.md b/docs/contributing/style-guide.md index 997bc61a..359befeb 100644 --- a/docs/contributing/style-guide.md +++ b/docs/contributing/style-guide.md @@ -103,8 +103,8 @@ the sentence is action. In passive voice, the subject is acted upon. A famous ex | | | |-----------------|-------------------------------------------------------------------------------------------| -| Not recommended | When an alarm is triggered by a metric, a notification is sent by Netdata. | -| **Recommended** | When a metric triggers an alarm, Netdata sends a notification to your preferred endpoint. | +| Not recommended | When an alert is triggered by a metric, a notification is sent by Netdata. | +| **Recommended** | When a metric triggers an alert, Netdata sends a notification to your preferred endpoint. | ### Second person @@ -470,7 +470,7 @@ The following tables describe the standard spelling, capitalization, and usage o | Term | Definition | |-----------------------------|-----------------------------------------------------------------------------------------------------------------------------------------------------------------------------------------------------------------------------------------------------------------------------------------------------------------------------------------------------------------------------------------------------------------------| | **claimed node** | A node that you've proved ownership of by completing the [connecting to Cloud process](https://github.com/netdata/netdata/blob/master/claim/README.md). The claimed node will then appear in your Space and any War Rooms you added it to. | -| **Netdata** | The company behind the open-source Netdata Agent and the Netdata Cloud web application. Never use _netdata_ or _NetData_. <br /><br />In general, focus on the user's goals, actions, and solutions rather than what the company provides. For example, write _Learn more about enabling alarm notifications on your preferred platforms_ instead of _Netdata sends alarm notifications to your preferred platforms_. | +| **Netdata** | The company behind the open-source Netdata Agent and the Netdata Cloud web application. Never use _netdata_ or _NetData_. <br /><br />In general, focus on the user's goals, actions, and solutions rather than what the company provides. For example, write _Learn more about enabling alert notifications on your preferred platforms_ instead of _Netdata sends alert notifications to your preferred platforms_. | | **Netdata Agent** | The free and open source [monitoring agent](https://github.com/netdata/netdata) that you can install on all of your distributed systems, whether they're physical, virtual, containerized, ephemeral, and more. The Agent monitors systems running Linux, Docker, Kubernetes, macOS, FreeBSD, and more, and collects metrics from hundreds of popular services and applications. | | **Netdata Cloud** | The web application hosted at [https://app.netdata.cloud](https://app.netdata.cloud) that helps you monitor an entire infrastructure of distributed systems in real time. <br /><br />Never use _Cloud_ without the preceding _Netdata_ to avoid ambiguity. | | **Netdata community forum** | The Discourse-powered forum for feature requests, Netdata Cloud technical support, and conversations about Netdata's monitoring and troubleshooting products. | @@ -478,12 +478,12 @@ The following tables describe the standard spelling, capitalization, and usage o | **Space** | The highest level container within Netdata Cloud for a user to organize their team members and nodes within their infrastructure. A Space likely represents an entire organization or a large team. <br /><br />_Space_ is always capitalized. | | **unreachable node** | A connected node with a disrupted [Agent-Cloud link](https://github.com/netdata/netdata/blob/master/aclk/README.md). Unreachable could mean the node no longer exists or is experiencing network connectivity issues with Cloud. | | **visited node** | A node which has had its Agent dashboard directly visited by a user. A list of these is maintained on a per-user basis. | -| **War Room** | A smaller grouping of nodes where users can view key metrics in real-time and monitor the health of many nodes with their alarm status. War Rooms can be used to organize nodes in any way that makes sense for your infrastructure, such as by a service, purpose, physical location, and more. <br /><br />_War Room_ is always capitalized. | +| **War Room** | A smaller grouping of nodes where users can view key metrics in real-time and monitor the health of many nodes with their alert status. War Rooms can be used to organize nodes in any way that makes sense for your infrastructure, such as by a service, purpose, physical location, and more. <br /><br />_War Room_ is always capitalized. | ### Other technical terms -| Term | Definition | -|-----------------------------|---------------------------------------------------------------------------------------------------------------------------------------------------------------------------------------------------------------------------------| -| **filesystem** | Use instead of _file system_. | -| **preconfigured** | The concept that many of Netdata's features come with sane defaults that users don't need to configure to find immediate value. | -| **real time**/**real-time** | Use _real time_ as a noun phrase, most often with _in_: _Netdata collects metrics in real time_. Use _real-time_ as an adjective: _Netdata collects real-time metrics from hundreds of supported applications and services. | +| Term | Definition | +|-----------------------------|-----------------------------------------------------------------------------------------------------------------------------------------------------------------------------------------------------------------------------| +| **filesystem** | Use instead of _file system_. | +| **preconfigured** | The concept that many of Netdata's features come with sane defaults that users don't need to configure to find immediate value. | +| **real time**/**real-time** | Use _real time_ as a noun phrase, most often with _in_: _Netdata collects metrics in real time_. Use _real-time_ as an adjective: _Netdata collects real-time metrics from hundreds of supported applications and services. | diff --git a/docs/dashboard/customize.md b/docs/dashboard/customize.md index d9538e62..301f0bd6 100644 --- a/docs/dashboard/customize.md +++ b/docs/dashboard/customize.md @@ -1,5 +1,9 @@ # Customize the standard dashboard +> ### Disclaimer +> +> This document is only applicable to the v1 version of the dashboard and doesn't affect the [Netdata Dashboard](https://github.com/netdata/netdata/blob/master/docs/category-overview-pages/accessing-netdata-dashboards.md). + While the [Netdata dashboard](https://github.com/netdata/netdata/blob/master/web/gui/README.md) comes preconfigured with hundreds of charts and thousands of metrics, you may want to alter your experience based on a particular use case or preferences. @@ -69,4 +73,4 @@ the following line to the `[web]` section to tell Netdata where to find your cus custom dashboard_info.js = your_dashboard_info_file.js ``` -Reload your browser tab to see your custom configuration. +Reload your browser tab to see your custom configuration.
\ No newline at end of file diff --git a/docs/dashboard/dimensions-contexts-families.md b/docs/dashboard/dimensions-contexts-families.md deleted file mode 100644 index 41e839c8..00000000 --- a/docs/dashboard/dimensions-contexts-families.md +++ /dev/null @@ -1,69 +0,0 @@ -# Chart dimensions, contexts, and families - -While Netdata's charts require no configuration and are [easy to interact with](https://github.com/netdata/netdata/blob/master/docs/cloud/visualize/interact-new-charts.md), -they have a lot of underlying complexity. To meaningfully organize charts out of the box based on what's happening in -your nodes, Netdata uses the concepts of **dimensions**, **contexts**, and **families**. - -Understanding how these work will help you more easily navigate the dashboard, -[write new alarms](https://github.com/netdata/netdata/blob/master/health/REFERENCE.md), or play around -with the [API](https://github.com/netdata/netdata/blob/master/web/api/README.md). - -## Dimension - -A **dimension** is a value that gets shown on a chart. The value can be raw data or calculated values, such as the -average (the default), minimum, or maximum. These values can then be given any type of unit. For example, CPU -utilization is represented as a percentage, disk I/O as `MiB/s`, and available RAM as an absolute value in `MiB` or -`GiB`. - -Beneath every chart (or on the right-side if you configure the dashboard) is a legend of dimensions. When there are -multiple dimensions, you'll see a different entry in the legend for each dimension. - -The **Apps CPU Time** chart (with the [context](#context) `apps.cpu`), which visualizes CPU utilization of -different types of processes/services/applications on your node, always provides a vibrant example of a chart with -multiple dimensions. - -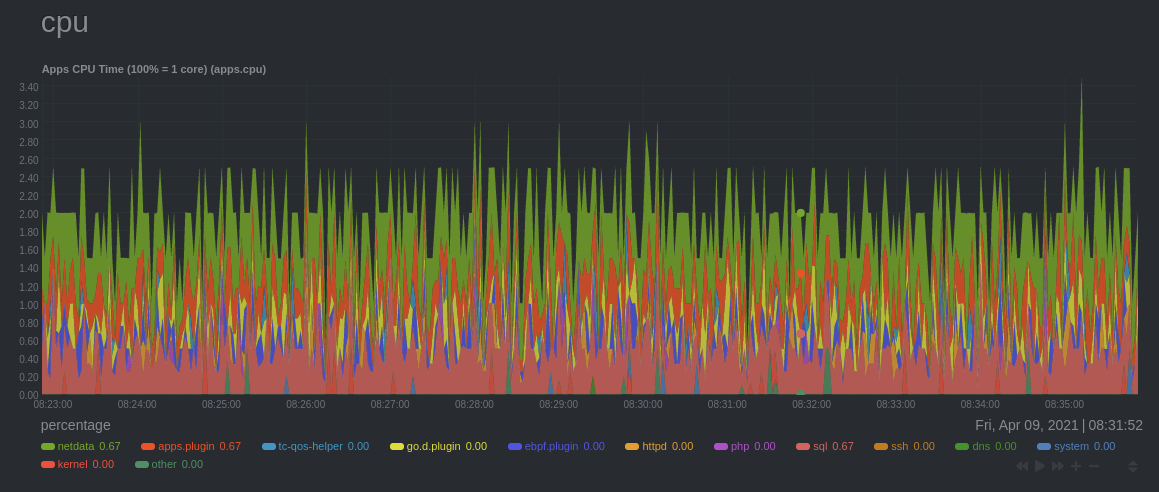 - -The chart shows 13 unique dimensions, such as `httpd` for the CPU utilization for web servers, `kernel` for anything -related to the Linux kernel, and so on. In your dashboard, these specific dimensions will almost certainly be different. - -Dimensions can be [hidden](https://github.com/netdata/netdata/blob/master/docs/cloud/visualize/interact-new-charts.md#show-and-hide-dimensions) to help you focus your -attention. - -## Context - -A **context** is a way of grouping charts by the types of metrics collected and dimensions displayed. It's kind of like -a machine-readable naming and organization scheme. - -For example, the **Apps CPU Time** has the context `apps.cpu`. A little further down on the dashboard is a similar -chart, **Apps Real Memory (w/o shared)** with the context `apps.mem`. The `apps` portion of the context is the **type**, -whereas anything after the `.` is specified either by the chart's developer or by the [**family**](#family). - -By default, a chart's type affects where it fits in the menu, while its family creates submenus. - -Netdata also relies on contexts for [alarm configuration](https://github.com/netdata/netdata/blob/master/health/REFERENCE.md) (the [`on` -line](https://github.com/netdata/netdata/blob/master/health/REFERENCE.md#alarm-line-on)). - -## Family - -**Families** are a _single instance_ of a hardware or software resource that needs to be displayed separately from -similar instances. - -For example, let's look at the **Disks** section, which contains a number of charts with contexts like `disk.io`, -`disk.ops`, `disk.backlog`, and `disk.util`. If your node has multiple disk drives at `sda` and `sdb`, Netdata creates -a separate family for each. - -Netdata now merges the contexts and families to create charts that are grouped by family, following a -`[context].[family]` naming scheme, so that you can see the `disk.io` and `disk.ops` charts for `sda` right next to each -other. - -Given the four example contexts, and two families of `sda` and `sdb`, Netdata will create the following charts and their -names: - -| Context | `sda` family | `sdb` family | -| :------------- | ------------------ | ------------------ | -| `disk.io` | `disk_io.sda` | `disk_io.sdb` | -| `disk.ops` | `disk_ops.sda` | `disk_ops.sdb` | -| `disk.backlog` | `disk_backlog.sda` | `disk_backlog.sdb` | -| `disk.util` | `disk_util.sda` | `disk_util.sdb` | diff --git a/docs/dashboard/import-export-print-snapshot.md b/docs/dashboard/import-export-print-snapshot.md index 35c3b9db..5a05f51e 100644 --- a/docs/dashboard/import-export-print-snapshot.md +++ b/docs/dashboard/import-export-print-snapshot.md @@ -18,8 +18,8 @@ Netdata can export snapshots of the contents of your dashboard at a given time, node running Netdata. Or, you can create a print-ready version of your dashboard to save to PDF or actually print to paper. -Snapshots can be incredibly useful for diagnosing anomalies after they've already happened. Let's say Netdata triggered a warning alarm while you were asleep. In the morning, you can [select the -timeframe](https://github.com/netdata/netdata/blob/master/docs/dashboard/visualization-date-and-time-controls.md) when the alarm triggered, export a snapshot, and send it to a +Snapshots can be incredibly useful for diagnosing anomalies after they've already happened. Let's say Netdata triggered a warning alert while you were asleep. In the morning, you can [select the +timeframe](https://github.com/netdata/netdata/blob/master/docs/dashboard/visualization-date-and-time-controls.md) when the alert triggered, export a snapshot, and send it to a colleague for further analysis. diff --git a/docs/getting-started/introduction.md b/docs/getting-started/introduction.md index b164074b..43626bce 100644 --- a/docs/getting-started/introduction.md +++ b/docs/getting-started/introduction.md @@ -17,7 +17,7 @@ Netdata is: - **One-line deployment** for Linux distributions, plus support for Kubernetes/Docker infrastructures. - **Zero configuration and maintenance** required to collect thousands of metrics, every second, from the underlying OS and running applications. -- **Prebuilt charts and alarms** alert you to common anomalies and performance issues without manual configuration. +- **Prebuilt charts and alerts** alert you to common anomalies and performance issues without manual configuration. - **Distributed storage** to simplify the cost and complexity of storing metrics data from any number of nodes. ### Powerful and scalable @@ -48,7 +48,7 @@ Netdata offers many benefits over the existing monitoring landscape, whether the open-source tools. | Netdata | Others (open-source and commercial) | -| :-------------------------------------------------------------- | :--------------------------------------------------------------- | +|:----------------------------------------------------------------|:-----------------------------------------------------------------| | **High resolution metrics** (1s granularity) | Low resolution metrics (10s granularity at best) | | Collects **thousands of metrics per node** | Collects just a few metrics | | Fast UI optimized for **anomaly detection** | UI is good for just an abstract view | @@ -64,7 +64,7 @@ Netdata works with tons of applications, notifications platforms, and other time - **300+ system, container, and application endpoints**: Collectors autodetect metrics from default endpoints and immediately visualize them into meaningful charts designed for troubleshooting. See [everything we support](https://github.com/netdata/netdata/blob/master/collectors/COLLECTORS.md). -- **20+ notification platforms**: Netdata's health watchdog sends warning and critical alarms to your [favorite +- **20+ notification platforms**: Netdata's health watchdog sends warning and critical alerts to your [favorite platform](https://github.com/netdata/netdata/blob/master/docs/monitor/enable-notifications.md) to inform you of anomalies just seconds after they affect your node. - **30+ external time-series databases**: Export resampled metrics as they're collected to other [local- and @@ -96,9 +96,9 @@ You can install Netdata on most Linux distributions (Ubuntu, Debian, CentOS, and ### Netdata Cloud -Netdata Cloud is a web application that gives you real-time visibility for your entire infrastructure. With Netdata Cloud, you can view key metrics, insightful charts, and active alarms from all your nodes in a single web interface. When an anomaly strikes, seamlessly navigate to any node to troubleshoot and discover the root cause with the familiar Netdata dashboard. +Netdata Cloud is a web application that gives you real-time visibility for your entire infrastructure. With Netdata Cloud, you can view key metrics, insightful charts, and active alerts from all your nodes in a single web interface. When an anomaly strikes, seamlessly navigate to any node to troubleshoot and discover the root cause with the familiar Netdata dashboard. -Netdata Cloud is free! You can add an entire infrastructure of nodes, invite all your colleagues, and visualize any number of metrics, charts, and alarms entirely for free. +Netdata Cloud is free! You can add an entire infrastructure of nodes, invite all your colleagues, and visualize any number of metrics, charts, and alerts entirely for free. While Netdata Cloud offers a centralized method of monitoring your Agents, your metrics data is not stored or centralized in any way. Metrics data remains with your nodes and is only streamed to your browser, through Cloud, when you're viewing the Netdata Cloud interface. @@ -155,7 +155,7 @@ ask questions, find resources, and engage with passionate professionals. The tea You can also find Netdata on: -- [Twitter](https://twitter.com/linuxnetdata) +- [Twitter](https://twitter.com/netdatahq) - [YouTube](https://www.youtube.com/c/Netdata) - [Reddit](https://www.reddit.com/r/netdata/) - [LinkedIn](https://www.linkedin.com/company/netdata-cloud/) @@ -189,5 +189,5 @@ _When people first hear about a new product, they frequently ask if it is any go [remarked](https://news.ycombinator.com/item?id=3067434):_ > Note to self: Starting immediately, all raganwald projects will have a “Is it any good?” section in the readme, and -> the answer shall be “yes.". +> the answer shall be "yes.". ******************************************************************************* diff --git a/docs/glossary.md b/docs/glossary.md index c0b9db69..26817d42 100644 --- a/docs/glossary.md +++ b/docs/glossary.md @@ -33,7 +33,7 @@ Use the alphabatized list below to find the answer to your single-term questions - [**Child**](https://github.com/netdata/netdata/blob/master/docs/metrics-storage-management/enable-streaming.md#streaming-basics): A node, running Netdata, that streams metric data to one or more parent. -- [**Cloud** or **Netdata Cloud**](https://github.com/netdata/netdata/blob/master/docs/quickstart/infrastructure.md): Netdata Cloud is a web application that gives you real-time visibility for your entire infrastructure. With Netdata Cloud, you can view key metrics, insightful charts, and active alarms from all your nodes in a single web interface. +- [**Cloud** or **Netdata Cloud**](https://github.com/netdata/netdata/blob/master/docs/quickstart/infrastructure.md): Netdata Cloud is a web application that gives you real-time visibility for your entire infrastructure. With Netdata Cloud, you can view key metrics, insightful charts, and active alerts from all your nodes in a single web interface. - [**Collector**](https://github.com/netdata/netdata/blob/master/collectors/README.md#collector-architecture-and-terminology): A catch-all term for any Netdata process that gathers metrics from an endpoint. @@ -41,7 +41,7 @@ Use the alphabatized list below to find the answer to your single-term questions - [**Composite Charts**](https://github.com/netdata/netdata/blob/master/docs/cloud/visualize/overview.md#overview-and-single-node-view): Charts used by the **Overview** tab which aggregate metrics from all the nodes (or a filtered selection) in a given War Room. -- [**Context**](https://github.com/netdata/netdata/blob/master/docs/dashboard/dimensions-contexts-families.md#context): A way of grouping charts by the types of metrics collected and dimensions displayed. It's kind of like a machine-readable naming and organization scheme. +- [**Context**](https://github.com/netdata/netdata/blob/master/docs/cloud/visualize/interact-new-charts.md#contexts): A way of grouping charts by the types of metrics collected and dimensions displayed. It's kind of like a machine-readable naming and organization scheme. - [**Custom dashboards**](https://github.com/netdata/netdata/blob/master/web/gui/custom/README.md) A dashboard that you can create using simple HTML (no javascript is required for basic dashboards). @@ -51,7 +51,7 @@ Use the alphabatized list below to find the answer to your single-term questions - [**Definition Bar**](https://github.com/netdata/netdata/blob/master/docs/cloud/visualize/interact-new-charts.md): Bar within a composite chart that provides important information and options about the metrics within the chart. -- [**Dimension**](https://github.com/netdata/netdata/blob/master/docs/dashboard/dimensions-contexts-families.md#dimension): A dimension is a value that gets shown on a chart. +- [**Dimension**](https://github.com/netdata/netdata/blob/master/docs/cloud/visualize/interact-new-charts.md#dimensions): A dimension is a value that gets shown on a chart. - [**Distributed Architecture**](https://github.com/netdata/netdata/blob/master/docs/store/distributed-data-architecture.md): The data architecture mindset with which Netdata was built, where all data are collected and stored on the edge, whenever it's possible, creating countless benefits. @@ -61,7 +61,7 @@ Use the alphabatized list below to find the answer to your single-term questions ## F -- [**Family**](https://github.com/netdata/netdata/blob/master/docs/dashboard/dimensions-contexts-families.md#family): 1. What we consider our Netdata community of users and engineers. 2. A single instance of a hardware or software resource that needs to be displayed separately from similar instances. +- [**Family**](https://github.com/netdata/netdata/blob/master/docs/cloud/visualize/interact-new-charts.md#families): 1. What we consider our Netdata community of users and engineers. 2. A single instance of a hardware or software resource that needs to be displayed separately from similar instances. - [**Flood Protection**](https://github.com/netdata/netdata/blob/master/docs/cloud/alerts-notifications/notifications.md#flood-protection): If a node has too many state changes like firing too many alerts or going from reachable to unreachable, Netdata Cloud enables flood protection. As long as a node is in flood protection mode, Netdata Cloud does not send notifications about this node @@ -114,7 +114,7 @@ metrics, troubleshoot complex performance problems, and make data interoperable - [**Netdata Agent** or **Agent**](https://github.com/netdata/netdata/blob/master/packaging/installer/README.md): Netdata's distributed monitoring Agent collects thousands of metrics from systems, hardware, and applications with zero configuration. It runs permanently on all your physical/virtual servers, containers, cloud deployments, and edge/IoT devices. -- [**Netdata Cloud** or **Cloud**](https://github.com/netdata/netdata/blob/master/docs/quickstart/infrastructure.md): Netdata Cloud is a web application that gives you real-time visibility for your entire infrastructure. With Netdata Cloud, you can view key metrics, insightful charts, and active alarms from all your nodes in a single web interface. +- [**Netdata Cloud** or **Cloud**](https://github.com/netdata/netdata/blob/master/docs/quickstart/infrastructure.md): Netdata Cloud is a web application that gives you real-time visibility for your entire infrastructure. With Netdata Cloud, you can view key metrics, insightful charts, and active alerts from all your nodes in a single web interface. - [**Netdata Functions** or **Functions**](https://github.com/netdata/netdata/blob/master/docs/cloud/netdata-functions.md): Routines exposed by a collector on the Netdata Agent that can bring additional information to support troubleshooting or trigger some action to happen on the node itself. diff --git a/docs/guides/collect-apache-nginx-web-logs.md b/docs/guides/collect-apache-nginx-web-logs.md index e9b38c27..f5e37442 100644 --- a/docs/guides/collect-apache-nginx-web-logs.md +++ b/docs/guides/collect-apache-nginx-web-logs.md @@ -94,13 +94,13 @@ We do have [extensive documentation](https://github.com/netdata/go.d.plugin/blob/master/modules/weblog/README.md#custom-log-format) on how to build custom parsing for Nginx and Apache logs. -## Tweak web log collector alarms +## Tweak web log collector alerts -Over time, we've created some default alarms for web log monitoring. These alarms are designed to work only when your +Over time, we've created some default alerts for web log monitoring. These alerts are designed to work only when your web server is receiving more than 120 requests per minute. Otherwise, there's simply not enough data to make conclusions about what is "too few" or "too many." -- [web log alarms](https://raw.githubusercontent.com/netdata/netdata/master/health/health.d/web_log.conf). +- [web log alerts](https://raw.githubusercontent.com/netdata/netdata/master/health/health.d/web_log.conf). You can also edit this file directly with `edit-config`: @@ -108,5 +108,5 @@ You can also edit this file directly with `edit-config`: ./edit-config health.d/weblog.conf ``` -For more information about editing the defaults or writing new alarm entities, see our +For more information about editing the defaults or writing new alert entities, see our [health monitoring documentation](https://github.com/netdata/netdata/blob/master/health/README.md). diff --git a/docs/guides/monitor-cockroachdb.md b/docs/guides/monitor-cockroachdb.md index ea94d7a0..d0db69ab 100644 --- a/docs/guides/monitor-cockroachdb.md +++ b/docs/guides/monitor-cockroachdb.md @@ -28,7 +28,7 @@ Let's dive in and walk through the process of monitoring CockroachDB metrics wit - [What's in this guide](#whats-in-this-guide) - [Configure the CockroachDB collector](#configure-the-cockroachdb-collector) - [Manual setup for a local CockroachDB database](#manual-setup-for-a-local-cockroachdb-database) - - [Tweak CockroachDB alarms](#tweak-cockroachdb-alarms) + - [Tweak CockroachDB alerts](#tweak-cockroachdb-alerts) ## Configure the CockroachDB collector @@ -102,9 +102,9 @@ Netdata to see your new charts. <figcaption>Charts showing a node failure during a simulated test</figcaption> </figure> -## Tweak CockroachDB alarms +## Tweak CockroachDB alerts -This release also includes eight pre-configured alarms for live nodes, such as whether the node is live, storage +This release also includes eight pre-configured alerts for live nodes, such as whether the node is live, storage capacity, issues with replication, and the number of SQL connections/statements. See [health.d/cockroachdb.conf on GitHub](https://raw.githubusercontent.com/netdata/netdata/master/health/health.d/cockroachdb.conf) for details. @@ -115,4 +115,4 @@ cd /etc/netdata/ # Replace with your Netdata configuration directory, if not /et ./edit-config health.d/cockroachdb.conf # You may need to use `sudo` for write privileges ``` -For more information about editing the defaults or writing new alarm entities, see our documentation on [configuring health alarms](https://github.com/netdata/netdata/blob/master/health/REFERENCE.md). +For more information about editing the defaults or writing new alert entities, see our documentation on [configuring health alerts](https://github.com/netdata/netdata/blob/master/health/REFERENCE.md). diff --git a/docs/guides/monitor-hadoop-cluster.md b/docs/guides/monitor-hadoop-cluster.md index 91282b95..41bf891f 100644 --- a/docs/guides/monitor-hadoop-cluster.md +++ b/docs/guides/monitor-hadoop-cluster.md @@ -173,13 +173,13 @@ sudo systemctl restart netdata Upon restart, Netdata should recognize your HDFS/Zookeeper servers, enable the HDFS and Zookeeper modules, and begin showing real-time metrics for both in your Netdata dashboard. 🎉 -## Configuring HDFS and Zookeeper alarms +## Configuring HDFS and Zookeeper alerts -The Netdata community helped us create sane defaults for alarms related to both HDFS and Zookeeper. You may want to +The Netdata community helped us create sane defaults for alerts related to both HDFS and Zookeeper. You may want to investigate these to ensure they work well with your Hadoop implementation. -- [HDFS alarms](https://raw.githubusercontent.com/netdata/netdata/master/health/health.d/hdfs.conf) -- [Zookeeper alarms](https://raw.githubusercontent.com/netdata/netdata/master/health/health.d/zookeeper.conf) +- [HDFS alerts](https://raw.githubusercontent.com/netdata/netdata/master/health/health.d/hdfs.conf) +- [Zookeeper alerts](https://raw.githubusercontent.com/netdata/netdata/master/health/health.d/zookeeper.conf) You can also access/edit these files directly with `edit-config`: @@ -188,5 +188,5 @@ sudo /etc/netdata/edit-config health.d/hdfs.conf sudo /etc/netdata/edit-config health.d/zookeeper.conf ``` -For more information about editing the defaults or writing new alarm entities, see our +For more information about editing the defaults or writing new alert entities, see our [health monitoring documentation](https://github.com/netdata/netdata/blob/master/health/README.md). diff --git a/docs/guides/monitor/anomaly-detection.md b/docs/guides/monitor/anomaly-detection.md index 4552e7a7..c0a00ef3 100644 --- a/docs/guides/monitor/anomaly-detection.md +++ b/docs/guides/monitor/anomaly-detection.md @@ -53,13 +53,13 @@ Pressing the anomalies icon (next to the information icon in the chart header) w ## Anomaly Rate Based Alerts -It is possible to use the `anomaly-bit` when defining traditional Alerts within netdata. The `anomaly-bit` is just another `options` parameter that can be passed as part of an [alarm line lookup](https://github.com/netdata/netdata/blob/master/docs/configure/start-stop-restart.md#alarm-line-lookup). +It is possible to use the `anomaly-bit` when defining traditional Alerts within netdata. The `anomaly-bit` is just another `options` parameter that can be passed as part of an [alert line lookup](https://github.com/netdata/netdata/blob/master/docs/configure/start-stop-restart.md#alert-line-lookup). You can see some example ML based alert configurations below: -- [Anomaly rate based CPU dimensions alarm](https://github.com/netdata/netdata/blob/master/docs/configure/start-stop-restart.md#example-8---anomaly-rate-based-cpu-dimensions-alarm) -- [Anomaly rate based CPU chart alarm](https://github.com/netdata/netdata/blob/master/docs/configure/start-stop-restart.md#example-9---anomaly-rate-based-cpu-chart-alarm) -- [Anomaly rate based node level alarm](https://github.com/netdata/netdata/blob/master/docs/configure/start-stop-restart.md#example-10---anomaly-rate-based-node-level-alarm) +- [Anomaly rate based CPU dimensions alert](https://github.com/netdata/netdata/blob/master/health/REFERENCE.md#example-8---anomaly-rate-based-cpu-dimensions-alert) +- [Anomaly rate based CPU chart alert](https://github.com/netdata/netdata/blob/master/health/REFERENCE.md#example-9---anomaly-rate-based-cpu-chart-alert) +- [Anomaly rate based node level alert](https://github.com/netdata/netdata/blob/master/health/REFERENCE.md#example-10---anomaly-rate-based-node-level-alert) - More examples in the [`/health/health.d/ml.conf`](https://github.com/netdata/netdata/blob/master/health/health.d/ml.conf) file that ships with the agent. ## Learn More diff --git a/docs/guides/monitor/lamp-stack.md b/docs/guides/monitor/lamp-stack.md index 190ea87e..2289c71c 100644 --- a/docs/guides/monitor/lamp-stack.md +++ b/docs/guides/monitor/lamp-stack.md @@ -34,7 +34,7 @@ of required setup. In this tutorial, you'll set up robust LAMP stack monitoring with Netdata in just a few minutes. When you're done, you'll have one dashboard to monitor every part of your web application, including each essential LAMP stack service. -This dashboard updates every second with new metrics, and pairs those metrics up with preconfigured alarms to keep you +This dashboard updates every second with new metrics, and pairs those metrics up with preconfigured alerts to keep you informed of any errors or odd behavior. ## What you need to get started @@ -192,18 +192,18 @@ Here's a quick reference for what charts you might want to focus on after settin | Active Connections (`mysql_local.connections_active`) | MySQL monitoring | If the `active` dimension nears the `limit`, your MySQL database will bottleneck responses. | | Performance (phpfpm_local.performance) | PHP monitoring | The `slow requests` dimension lets you know if any requests exceed the configured `request_slowlog_timeout`. If so, users might be having a less-than-ideal experience. | -## Get alarms for LAMP stack errors +## Get alerts for LAMP stack errors -The Netdata Agent comes with hundreds of pre-configured alarms to help you keep tabs on your system, including 19 alarms +The Netdata Agent comes with hundreds of pre-configured alerts to help you keep tabs on your system, including 19 alerts designed for smarter LAMP stack monitoring. -Click the 🔔 icon in the top navigation to [see active alarms](https://github.com/netdata/netdata/blob/master/docs/monitor/view-active-alarms.md). The **Active** tabs -shows any alarms currently triggered, while the **All** tab displays a list of _every_ pre-configured alarm. The +Click the 🔔 icon in the top navigation to [see active alerts](https://github.com/netdata/netdata/blob/master/docs/monitor/view-active-alerts.md). The **Active** tabs +shows any alerts currently triggered, while the **All** tab displays a list of _every_ pre-configured alert. The  +alerts](https://user-images.githubusercontent.com/1153921/109524120-5883f900-7a6d-11eb-830e-0e7baaa28163.png) -[Tweak alarms](https://github.com/netdata/netdata/blob/master/health/REFERENCE.md) based on your infrastructure monitoring needs, and to see these alarms +[Tweak alerts](https://github.com/netdata/netdata/blob/master/health/REFERENCE.md) based on your infrastructure monitoring needs, and to see these alerts in other places, like your inbox or a Slack channel, [enable a notification method](https://github.com/netdata/netdata/blob/master/docs/monitor/enable-notifications.md). diff --git a/docs/guides/python-collector.md b/docs/guides/python-collector.md index f7769949..d89eb25e 100644 --- a/docs/guides/python-collector.md +++ b/docs/guides/python-collector.md @@ -16,7 +16,7 @@ Golang is more performant, easier to maintain, and simpler for users since it do execute. Python plugins require Python on the machine to be executed. Netdata uses Go as the platform of choice for production-grade collectors. -We generally do not accept contributions of Python modules to the Github project netdata/netdata. If you write a Python collector and +We generally do not accept contributions of Python modules to the GitHub project netdata/netdata. If you write a Python collector and want to make it available for other users, you should create the pull request in https://github.com/netdata/community. ## What you need to get started @@ -540,7 +540,7 @@ At minimum, to be buildable and testable, the PR needs to include: - A makefile for the plugin at `collectors/python.d.plugin/<module_dir>/Makefile.inc`. Check an existing plugin for what this should look like. - A line in `collectors/python.d.plugin/Makefile.am` including the above-mentioned makefile. Place it with the other plugin includes (please keep the includes sorted alphabetically). - Optionally, chart information in `web/gui/dashboard_info.js`. This generally involves specifying a name and icon for the section, and may include descriptions for the section or individual charts. -- Optionally, some default alarm configurations for your collector in `health/health.d/<module_name>.conf` and a line adding `<module_name>.conf` in `health/Makefile.am`. +- Optionally, some default alert configurations for your collector in `health/health.d/<module_name>.conf` and a line adding `<module_name>.conf` in `health/Makefile.am`. ## Framework class reference diff --git a/docs/guides/using-host-labels.md b/docs/guides/using-host-labels.md index 5b9ab2e8..5f3a467f 100644 --- a/docs/guides/using-host-labels.md +++ b/docs/guides/using-host-labels.md @@ -41,7 +41,7 @@ To define your windows server as a virtual node you need to: Host labels can be extremely useful when: -- You need alarms that adapt to the system's purpose +- You need alerts that adapt to the system's purpose - You need properly-labeled metrics archiving so you can sort, correlate, and mash-up your data to your heart's content. - You need to keep tabs on ephemeral Docker containers in a Kubernetes cluster. @@ -149,7 +149,7 @@ exporting. Speaking of which... ### Host labels in alerts You can use host labels to logically organize your systems by their type, purpose, or location, and then apply specific -alarms to them. +alerts to them. For example, let's use configuration example from earlier: @@ -178,7 +178,7 @@ Or, by using one of the automatic labels, for only webserver systems running a s host labels: _os_name = Debian* ``` -In a streaming configuration where a parent node is triggering alarms for its child nodes, you could create health +In a streaming configuration where a parent node is triggering alerts for its child nodes, you could create health entities that apply only to child nodes: ```yaml @@ -192,7 +192,7 @@ Or when ephemeral Docker nodes are involved: ``` Of course, there are many more possibilities for intuitively organizing your systems with host labels. See the [health -documentation](https://github.com/netdata/netdata/blob/master/health/REFERENCE.md#alarm-line-host-labels) for more details, and then get creative! +documentation](https://github.com/netdata/netdata/blob/master/health/REFERENCE.md#alert-line-host-labels) for more details, and then get creative! ### Host labels in metrics exporting diff --git a/docs/metrics-storage-management/enable-streaming.md b/docs/metrics-storage-management/enable-streaming.md index f54ffaeb..fcbb16c8 100644 --- a/docs/metrics-storage-management/enable-streaming.md +++ b/docs/metrics-storage-management/enable-streaming.md @@ -5,7 +5,7 @@ replicate metrics data across multiple nodes, or centralize all your metrics dat (TSDB). When one node streams metrics to another, the node receiving metrics can visualize them on the dashboard, run health checks to -[trigger alarms](https://github.com/netdata/netdata/blob/master/docs/monitor/view-active-alarms.md) and +[trigger alerts](https://github.com/netdata/netdata/blob/master/docs/monitor/view-active-alerts.md) and [send notifications](https://github.com/netdata/netdata/blob/master/docs/monitor/enable-notifications.md), and [export](https://github.com/netdata/netdata/blob/master/docs/export/external-databases.md) all metrics to an external TSDB. When Netdata streams metrics to another Netdata, the receiving one is able to perform everything a Netdata instance is capable of. @@ -48,16 +48,16 @@ Here are a few example streaming configurations: - **Headless collector**: - Child `A`, _without_ a database or web dashboard, streams metrics to parent `B`. - `A` metrics are only available via the local Agent dashboard for `B`. - - `B` generates alarms for `A`. + - `B` generates alerts for `A`. - **Replication**: - Child `A`, _with_ a database and web dashboard, streams metrics to parent `B`. - `A` metrics are available on both local Agent dashboards, and can be stored with the same or different metrics retention policies. - - Both `A` and `B` generate alarms. + - Both `A` and `B` generate alerts. - **Proxy**: - Child `A`, _with or without_ a database, sends metrics to proxy `C`, also _with or without_ a database. `C` sends metrics to parent `B`. - - Any node with a database can generate alarms. + - Any node with a database can generate alerts. @@ -102,7 +102,7 @@ parent node, and both nodes retain metrics in their own databases. To configure replication, you need two nodes, each running Netdata. First you'll first enable streaming on your parent node, then enable streaming on your child node. When you're finished, you'll be able to see the child node's metrics in the parent node's dashboard, quickly switch between the two dashboards, and be able to serve -[alarm notifications](https://github.com/netdata/netdata/blob/master/docs/monitor/enable-notifications.md) from either or both nodes. +[alert notifications](https://github.com/netdata/netdata/blob/master/docs/monitor/enable-notifications.md) from either or both nodes. ### Enable streaming on the parent node diff --git a/docs/monitor/enable-notifications.md b/docs/monitor/enable-notifications.md index 1174561c..4bfebb4d 100644 --- a/docs/monitor/enable-notifications.md +++ b/docs/monitor/enable-notifications.md @@ -1,6 +1,6 @@ <!-- title: "Alert notifications" -description: "Send Netdata alarms from a centralized place with Netdata Cloud, or configure nodes individually, to enable incident response and faster resolution." +description: "Send Netdata alerts from a centralized place with Netdata Cloud, or configure nodes individually, to enable incident response and faster resolution." custom_edit_url: "https://github.com/netdata/netdata/edit/master/docs/monitor/enable-notifications.md" sidebar_label: "Notify" learn_status: "Published" @@ -83,7 +83,6 @@ notification platform. - [**Rocket.Chat**](https://github.com/netdata/netdata/blob/master/health/notifications/rocketchat/README.md) - [**Slack**](https://github.com/netdata/netdata/blob/master/health/notifications/slack/README.md) - [**SMS Server Tools 3**](https://github.com/netdata/netdata/blob/master/health/notifications/smstools3/README.md) -- [**StackPulse**](https://github.com/netdata/netdata/blob/master/health/notifications/stackpulse/README.md) - [**Syslog**](https://github.com/netdata/netdata/blob/master/health/notifications/syslog/README.md) - [**Telegram**](https://github.com/netdata/netdata/blob/master/health/notifications/telegram/README.md) - [**Twilio**](https://github.com/netdata/netdata/blob/master/health/notifications/twilio/README.md) diff --git a/docs/monitor/view-active-alarms.md b/docs/monitor/view-active-alerts.md index cc6a2d3a..14b1663d 100644 --- a/docs/monitor/view-active-alarms.md +++ b/docs/monitor/view-active-alerts.md @@ -43,28 +43,28 @@ At the bottom of the panel you can click the green button "View dedicated alert <!-- ## Local Netdata Agent dashboard -Find the alarms icon  -in the top navigation to bring up a modal that shows currently raised alarms, all running alarms, and the alarms log. -Here is an example of a raised `system.cpu` alarm, followed by the full list and alarm log: +in the top navigation to bring up a modal that shows currently raised alerts, all running alerts, and the alerts log. +Here is an example of a raised `system.cpu` alert, followed by the full list and alert log: - -And a static screenshot of the raised CPU alarm: +And a static screenshot of the raised CPU alert:  +alert](https://user-images.githubusercontent.com/1153921/80842330-2dfbb200-8bb6-11ea-8147-3cd366eb0f37.png) -The alarm itself is named **system - cpu**, and its context is `system.cpu`. Beneath that is an auto-updating badge that -shows the latest value of the chart that triggered the alarm. +The alert itself is named **system - cpu**, and its context is `system.cpu`. Beneath that is an auto-updating badge that +shows the latest value of the chart that triggered the alert. With the three icons beneath that and the **role** designation, you can: -1. Scroll to the chart associated with this raised alarm. +1. Scroll to the chart associated with this raised alert. 2. Copy a link to the badge to your clipboard. 3. Copy the code to embed the badge onto another web page using an `<embed>` element. -The table on the right-hand side displays information about the health entity that triggered the alarm, which you can -use as a reference to [configure alarms](https://github.com/netdata/netdata/blob/master/health/REFERENCE.md). +The table on the right-hand side displays information about the health entity that triggered the alert, which you can +use as a reference to [configure alerts](https://github.com/netdata/netdata/blob/master/health/REFERENCE.md). --> diff --git a/docs/quickstart/infrastructure.md b/docs/quickstart/infrastructure.md index 647b2b9c..3e24d7ac 100644 --- a/docs/quickstart/infrastructure.md +++ b/docs/quickstart/infrastructure.md @@ -3,7 +3,7 @@ import { RiExternalLinkLine } from 'react-icons/ri' # Monitor your infrastructure -Learn how to view key metrics, insightful charts, and active alarms from all your nodes, with Netdata Cloud's real-time infrastructure monitoring. +Learn how to view key metrics, insightful charts, and active alerts from all your nodes, with Netdata Cloud's real-time infrastructure monitoring. [Netdata Cloud](https://app.netdata.cloud) provides scalable infrastructure monitoring for any number of distributed nodes running the Netdata Agent. A node is any system in your infrastructure that you want to monitor, whether it's a @@ -20,7 +20,7 @@ between them, you can monitor your infrastructure using customizable, interactiv number of distributed nodes. In this quickstart guide, you'll learn the basics of using Netdata Cloud to monitor an infrastructure with dashboards, -composite charts, and alarm viewing. You'll then learn about the most critical ways to configure the Agent on each of +composite charts, and alert viewing. You'll then learn about the most critical ways to configure the Agent on each of your nodes to maximize the value you get from Netdata. This quickstart assumes you've [installed Netdata](https://github.com/netdata/netdata/edit/master/packaging/installer/README.md) @@ -73,13 +73,13 @@ These tabs can be separated into "static", meaning they are by default presented - The second and most important tab is the [Overview tab](https://github.com/netdata/netdata/blob/master/docs/cloud/visualize/overview.md#overview-and-single-node-view) which uses composite charts to display real-time metrics from every available node in a given War Room. -- The [Nodes tab](https://github.com/netdata/netdata/blob/master/docs/cloud/visualize/nodes.md) gives you the ability to see the status (offline or online), host details, alarm status and also a short overview of some key metrics from all your nodes at a glance. +- The [Nodes tab](https://github.com/netdata/netdata/blob/master/docs/cloud/visualize/nodes.md) gives you the ability to see the status (offline or online), host details, alert status and also a short overview of some key metrics from all your nodes at a glance. - [Kubernetes tab](https://github.com/netdata/netdata/blob/master/docs/cloud/visualize/kubernetes.md) is a logical grouping of charts regarding your Kubernetes clusters. It contains a subset of the charts available in the **Overview tab**. - The [Dashboards tab](https://github.com/netdata/netdata/blob/master/docs/cloud/visualize/dashboards.md) gives you the ability to have tailored made views of specific/targeted interfaces for your infrastructure using any number of charts from any number of nodes. -- The [Alerts tab](https://github.com/netdata/netdata/blob/master/docs/monitor/view-active-alarms.md) provides you with an overview for all the active alerts you receive for the nodes in this War Room, you can also see all the alerts that are configured to be triggered in any given moment. +- The [Alerts tab](https://github.com/netdata/netdata/blob/master/docs/monitor/view-active-alerts.md) provides you with an overview for all the active alerts you receive for the nodes in this War Room, you can also see all the alerts that are configured to be triggered in any given moment. - The [Anomalies tab](https://github.com/netdata/netdata/blob/master/docs/cloud/insights/anomaly-advisor.md) is dedicated to the Anomaly Advisor tool. @@ -181,7 +181,7 @@ collect from across your infrastructure with Netdata. <Box title="Alerts and notifications"> <BoxList> - <BoxListItemRegexLink to="[](https://github.com/netdata/netdata/blob/master/docs/monitor/view-active-alarms.md#netdata-cloud)" title="View active alerts" /> + <BoxListItemRegexLink to="[](https://github.com/netdata/netdata/blob/master/docs/monitor/view-active-alerts.md#netdata-cloud)" title="View active alerts" /> <BoxListItemRegexLink to="[](https://github.com/netdata/netdata/blob/master/docs/cloud/alerts-notifications/notifications.md)" title="Alert notifications" /> </BoxList> </Box> @@ -212,7 +212,7 @@ collect from across your infrastructure with Netdata. - [Kubernetes](https://github.com/netdata/netdata/blob/master/docs/cloud/visualize/kubernetes.md) - [Create new dashboards](https://github.com/netdata/netdata/blob/master/docs/cloud/visualize/dashboards.md) - Alerts and notifications - - [View active alerts](https://github.com/netdata/netdata/blob/master/docs/monitor/view-active-alarms.md#netdata-cloud) + - [View active alerts](https://github.com/netdata/netdata/blob/master/docs/monitor/view-active-alerts.md#netdata-cloud) - [Alert notifications](https://github.com/netdata/netdata/blob/master/docs/cloud/alerts-notifications/notifications.md) - Troubleshooting with Netdata Cloud - [Metric Correlations](https://github.com/netdata/netdata/blob/master/docs/cloud/insights/metric-correlations.md) diff --git a/docs/running-through-cf-tunnels.md b/docs/running-through-cf-tunnels.md new file mode 100644 index 00000000..9dc263b5 --- /dev/null +++ b/docs/running-through-cf-tunnels.md @@ -0,0 +1,113 @@ +# Running a Local Dashboard through Cloudflare Tunnels + +## Summary of tasks + +- Make a `netdata-web` HTTP tunnel on the parent node, so the web interface can be viewed publicly +- Make a `netdata-tcp` tcp tunnel on the parent node, so it can receive tcp streams from child nodes +- Provide access to the `netdata-tcp` tunnel on the child nodes, so you can send the tcp stream to the parent node +- Make sure the parent node uses port `19999` for both web and tcp streams +- Make sure that the child nodes have `mode = none` in the `[web]` section of the `netdata.conf` file, and `destination = tcp:127.0.0.1:19999` in the `[stream]` section of the `stream.conf` file + +## Detailed instructions with commands and service files + +- Install the `cloudflared` package on all your Netdata nodes, follow the repository instructions [here](https://pkg.cloudflare.com/index.html) + +- Login to cloudflare with `sudo cloudflared login` on all your Netdata nodes + +### Parent node: public web interface and receiving stats from Child nodes + +- Create the HTTP tunnel + `sudo cloudflared tunnel create netdata-web` +- Start routing traffic + `sudo cloudflared tunnel route dns netdata-web netdata-web.my.domain` +- Create a service by making a file called `/etc/systemd/system/cf-tun-netdata-web.service` and input: + +```ini +[Unit] +Description=cloudflare tunnel netdata-web +After=network-online.target + +[Service] +Type=simple +User=root +Group=root +ExecStart=/usr/bin/cloudflared --no-autoupdate tunnel run --url http://localhost:19999 netdata-web +Restart=on-failure +TimeoutStartSec=0 +RestartSec=5s + +[Install] +WantedBy=multi-user.target +``` + +- Create the TCP tunnel + `sudo cloudflared tunnel create netdata-tcp` +- Start routing traffic + `sudo cloudflared tunnel route dns netdata-tcp netdata-tcp.my.domain` +- Create a service by making a file called `/etc/systemd/system/cf-tun-netdata-tcp.service` and input: + +```ini +[Unit] +Description=cloudflare tunnel netdata-tcp +After=network-online.target + +[Service] +Type=simple +User=root +Group=root +ExecStart=/usr/bin/cloudflared --no-autoupdate tunnel run --url tcp://localhost:19999 netdata-tcp +Restart=on-failure +TimeoutStartSec=0 +RestartSec=5s + +[Install] +WantedBy=multi-user.target +``` + +### Child nodes: send stats to the Parent node + +- Create a service by making a file called `/etc/systemd/system/cf-acs-netdata-tcp.service` and input: + +```ini +[Unit] +Description=cloudflare access netdata-tcp +After=network-online.target + +[Service] +Type=simple +User=root +Group=root +ExecStart=/usr/bin/cloudflared --no-autoupdate access tcp --url localhost:19999 --tunnel-host netdata-tcp.my.domain +Restart=on-failure +TimeoutStartSec=0 +RestartSec=5s + +[Install] +WantedBy=multi-user.target +``` + +You can edit the configuration file using the `edit-config` script from the Netdata [config directory](https://github.com/netdata/netdata/blob/master/docs/configure/nodes.md#the-netdata-config-directory). + +- Edit `netdata.conf` and input: + +```ini +[web] + mode = none +``` + +- Edit `stream.conf` and input: + +```ini +[stream] + destination = tcp:127.0.0.1:19999 +``` + +[Restart the Agents](https://github.com/netdata/netdata/blob/master/docs/configure/start-stop-restart.md), and you are done! + +You should now be able to have a Local Dashboard that gets its metrics from Child instances, running through Cloudflare tunnels. + +> ### Note +> +> You can find the origin of this page in [this discussion](https://discord.com/channels/847502280503590932/1154164395799216189/1154556625944854618) in our Discord server. +> +> We thought it was going to be helpful to all users, so we included it in our docs. diff --git a/docs/store/change-metrics-storage.md b/docs/store/change-metrics-storage.md index 5e14fe24..ef1f8ee8 100644 --- a/docs/store/change-metrics-storage.md +++ b/docs/store/change-metrics-storage.md @@ -43,8 +43,8 @@ we will have a data point every minute in tier 1 and every minute in tier 2. Up to 5 tiers are supported. You may add, or remove tiers and/or modify these multipliers, as long as the product of all the "update every iterations" does not exceed 65535 (number of points for each tier0 point). -e.g. If you simply add a fourth tier by setting `storage tiers = 4` and defining the disk space for the new tier, -the product of the "update every iterations" will be 60 * 60 * 60 = 216,000, which is > 65535. So you'd need to reduce +e.g. If you simply add a fourth tier by setting `storage tiers = 4` and define the disk space for the new tier, +the product of the "update every iterations" will be 60 \* 60 \* 60 = 216,000, which is > 65535. So you'd need to reduce the `update every iterations` of the tiers, to stay under the limit. The exact retention that can be achieved by each tier depends on the number of metrics collected. The more @@ -163,6 +163,16 @@ Save the file and restart the Agent with `sudo systemctl restart netdata`, or the [appropriate method](https://github.com/netdata/netdata/blob/master/docs/configure/start-stop-restart.md) for your system, to change the database engine's size. +## Scaling dedicated parent nodes + +When you use streaming in medium to large infrastructures, you can have potentially millions of metrics per second reaching each parent node. +In the lab we have reliably collected 1 million metrics/sec with 16cores and 32GB RAM. + +Our suggestion for scaling parents is to have them running on dedicated VMs, using a maximum of 50% of cpu, and ensuring you have enough RAM +for the desired retention. When your infrastructure can lead a parent to exceed these characteristics, split the load to multiple parents that +do not communicate with each other. With each child sending data to only one of the parents, you can still have replication, high availability, +and infrastructure level observability via the Netdata Cloud UI. + ## Legacy configuration ### v1.35.1 and prior @@ -195,13 +205,3 @@ All new child nodes are automatically transferred to the multihost dbengine inst space. If you want to migrate a child node from its legacy dbengine instance to the multihost dbengine instance, you must delete the instance's directory, which is located in `/var/cache/netdata/MACHINE_GUID/dbengine`, after stopping the Agent. - -## Scaling dedicated parent nodes - -When you use streaming in medium to large infrastructures, you can have potentially millions of metrics per second reaching each parent node. -In the lab we have reliably collected 1 million metrics/sec with 16cores and 32GB RAM. - -Our suggestion for scaling parents is to have them running on dedicated VMs, using a maximum of 50% of cpu, and ensuring you have enough RAM -for the desired retention. When your infrastructure can lead a parent to exceed these characteristics, split the load to multiple parents that -do not communicate with each other. With each child sending data to only one of the parents, you can still have replication, high availability, -and infrastructure level observability via the Netdata Cloud UI. diff --git a/docs/store/distributed-data-architecture.md b/docs/store/distributed-data-architecture.md index 64ac9851..b5e6f376 100644 --- a/docs/store/distributed-data-architecture.md +++ b/docs/store/distributed-data-architecture.md @@ -68,8 +68,8 @@ When you use the database engine to store your metrics, you can always perform a Netdata Cloud does not store metric values. -To enable certain features, such as [viewing active alarms](https://github.com/netdata/netdata/blob/master/docs/monitor/view-active-alarms.md) +To enable certain features, such as [viewing active alerts](https://github.com/netdata/netdata/blob/master/docs/monitor/view-active-alerts.md) or [filtering by hostname](https://github.com/netdata/netdata/blob/master/docs/cloud/visualize/node-filter.md), Netdata Cloud does -store configured alarms, their status, and a list of active collectors. +store configured alerts, their status, and a list of active collectors. Netdata does not and never will sell your personal data or data about your deployment. |