
diff options
| author | Daniel Baumann <daniel.baumann@progress-linux.org> | 2022-04-14 18:12:14 +0000 |
|---|---|---|
| committer | Daniel Baumann <daniel.baumann@progress-linux.org> | 2022-04-14 18:12:14 +0000 |
| commit | bb50acdcb8073654ea667b8c0272e335bd43f844 (patch) | |
| tree | 1e00c8a29871426f8182658928dcb62e42d57ce8 /docs | |
| parent | Releasing debian version 1.33.1-1. (diff) | |
| download | netdata-bb50acdcb8073654ea667b8c0272e335bd43f844.tar.xz netdata-bb50acdcb8073654ea667b8c0272e335bd43f844.zip | |
Merging upstream version 1.34.0.
Signed-off-by: Daniel Baumann <daniel.baumann@progress-linux.org>
Diffstat (limited to 'docs')
74 files changed, 83 insertions, 91 deletions
diff --git a/docs/Add-more-charts-to-netdata.md b/docs/Add-more-charts-to-netdata.md index 44aa1aba..6090644e 100644 --- a/docs/Add-more-charts-to-netdata.md +++ b/docs/Add-more-charts-to-netdata.md @@ -11,5 +11,3 @@ This file has been deprecated. Please see our [collectors docs](/collectors/READ See the [list of supported collectors](/collectors/COLLECTORS.md) to see all the sources Netdata can collect metrics from. - -[]() diff --git a/docs/Demo-Sites.md b/docs/Demo-Sites.md index 5c0369c1..e6e8eb3d 100644 --- a/docs/Demo-Sites.md +++ b/docs/Demo-Sites.md @@ -22,4 +22,4 @@ You can also view live demos of Netdata at **[https://www.netdata.cloud](https:/ Netdata dashboards are mobile- and touch-friendly. -[](<>) + diff --git a/docs/Donations-netdata-has-received.md b/docs/Donations-netdata-has-received.md index df6c040b..a8623c5d 100644 --- a/docs/Donations-netdata-has-received.md +++ b/docs/Donations-netdata-has-received.md @@ -26,4 +26,4 @@ Thank you! Please contact me at costa@tsaousis.gr. -[](<>) + diff --git a/docs/README.md b/docs/README.md index 47950f38..e3b91561 100644 --- a/docs/README.md +++ b/docs/README.md @@ -14,4 +14,4 @@ perfect. Now get out there and build an exceptional infrastructure. -[](<>) + diff --git a/docs/Running-behind-apache.md b/docs/Running-behind-apache.md index de95f55e..989c51fc 100644 --- a/docs/Running-behind-apache.md +++ b/docs/Running-behind-apache.md @@ -368,4 +368,4 @@ Make sure the requests reach Netdata, by examining `/var/log/netdata/access.log` 1. if the requests do not reach Netdata, your apache does not forward them. 2. if the requests reach Netdata but the URLs are wrong, you have not re-written them properly. -[](<>) + diff --git a/docs/Running-behind-caddy.md b/docs/Running-behind-caddy.md index a20fd053..0282d075 100644 --- a/docs/Running-behind-caddy.md +++ b/docs/Running-behind-caddy.md @@ -31,4 +31,4 @@ You would also need to instruct Netdata to listen only to `127.0.0.1` or `::1`. To limit access to Netdata only from localhost, set `bind socket to IP = 127.0.0.1` or `bind socket to IP = ::1` in `/etc/netdata/netdata.conf`. -[](<>) + diff --git a/docs/Running-behind-haproxy.md b/docs/Running-behind-haproxy.md index d4b09f85..ee1790cf 100644 --- a/docs/Running-behind-haproxy.md +++ b/docs/Running-behind-haproxy.md @@ -6,7 +6,7 @@ custom_edit_url: https://github.com/netdata/netdata/edit/master/docs/Running-beh # Netdata via HAProxy > HAProxy is a free, very fast and reliable solution offering high availability, load balancing, -> and proxying for TCP and HTTP-based applications. It is particularly suited for very high traffic web sites +> and proxying for TCP and HTTP-based applications. It is particularly suited for very high traffic websites > and powers quite a number of the world's most visited ones. If Netdata is running on a host running HAProxy, rather than connecting to Netdata from a port number, a domain name can @@ -59,7 +59,7 @@ backend netdata_backend ## Configuration with subpath -A example where the base URL is used with a subpath `/netdata/`: +An example where the base URL is used with a subpath `/netdata/`: ### Frontend @@ -290,4 +290,4 @@ backend netdata_backend http-request set-header Connection "keep-alive" ``` -[](<>) + diff --git a/docs/Running-behind-lighttpd.md b/docs/Running-behind-lighttpd.md index 1e86f334..2623560e 100644 --- a/docs/Running-behind-lighttpd.md +++ b/docs/Running-behind-lighttpd.md @@ -68,4 +68,4 @@ You would also need to instruct Netdata to listen only to `127.0.0.1` or `::1`. To limit access to Netdata only from localhost, set `bind socket to IP = 127.0.0.1` or `bind socket to IP = ::1` in `/etc/netdata/netdata.conf`. -[](<>) + diff --git a/docs/Running-behind-nginx.md b/docs/Running-behind-nginx.md index 83720039..0cb16309 100644 --- a/docs/Running-behind-nginx.md +++ b/docs/Running-behind-nginx.md @@ -267,4 +267,4 @@ If you get an 502 Bad Gateway error you might check your Nginx error log: If you see something like the above, chances are high that SELinux prevents nginx from connecting to the backend server. To fix that, just use this policy: `setsebool -P httpd_can_network_connect true`. -[](<>) + diff --git a/docs/a-github-star-is-important.md b/docs/a-github-star-is-important.md index d309d392..22659ea6 100644 --- a/docs/a-github-star-is-important.md +++ b/docs/a-github-star-is-important.md @@ -21,4 +21,4 @@ Thank you! Costa Tsaousis -[](<>) + diff --git a/docs/agent-cloud.md b/docs/agent-cloud.md index fcec10af..ed54325c 100644 --- a/docs/agent-cloud.md +++ b/docs/agent-cloud.md @@ -75,5 +75,3 @@ about how you might want to use or configure Cloud, we recommend the following: onboarding and connect your first nodes. - Better understand how agents connect securely to the Cloud with [connect agent to Cloud](/claim/README.md) and [Agent-Cloud link](/aclk/README.md) documentation. - -[]() diff --git a/docs/anonymous-statistics.md b/docs/anonymous-statistics.md index 82c018e1..73ac8e97 100644 --- a/docs/anonymous-statistics.md +++ b/docs/anonymous-statistics.md @@ -8,8 +8,7 @@ custom_edit_url: https://github.com/netdata/netdata/edit/master/docs/anonymous-s # Anonymous statistics By default, Netdata collects anonymous usage information from the open-source monitoring agent using the open-source -product analytics platform [PostHog](https://github.com/PostHog/posthog). We self-host our PostHog instance, which means -your data is never sent or processed by any third parties outside of the Netdata infrastructure. +product analytics platform [PostHog](https://github.com/PostHog/posthog). We use their [cloud enterprise platform](https://posthog.com/product). We are strongly committed to your [data privacy](https://netdata.cloud/data-privacy/). @@ -86,11 +85,11 @@ installation, including manual, offline, and macOS installations. Create the fil **Pass the option `--disable-telemetry` to any of the installer scripts in the [installation docs](/packaging/installer/README.md).** You can append this option during the initial installation or a manual -update. You can also export the environment variable `DO_NOT_TRACK` with a non-zero or non-empty value -(e.g: `export DO_NOT_TRACK=1`). +update. You can also export the environment variable `DISABLE_TELEMETRY` with a non-zero or non-empty value +(e.g: `export DISABLE_TELEMETRY=1`). -When using Docker, **set your `DO_NOT_TRACK` environment variable to `1`.** You can set this variable with the following -command: `export DO_NOT_TRACK=1`. When creating a container using Netdata's [Docker +When using Docker, **set your `DISABLE_TELEMETRY` environment variable to `1`.** You can set this variable with the following +command: `export DISABLE_TELEMETRY=1`. When creating a container using Netdata's [Docker image](/packaging/docker/README.md#create-a-new-netdata-agent-container) for the first time, this variable will disable the anonymous statistics script inside of the container. @@ -98,7 +97,7 @@ Each of these opt-out processes does the following: - Prevents the daemon from executing the anonymous statistics script. - Forces the anonymous statistics script to exit immediately. -- Stops the PostHog Javascript snippet, which remains on the dashboard, from firing and sending any data to the Netdata PostHog. +- Stops the PostHog JavaScript snippet, which remains on the dashboard, from firing and sending any data to the Netdata PostHog. ## Migration from Google Analytics and Google Tag Manager. @@ -106,4 +105,3 @@ Prior to v1.29.4 we used Google Analytics to capture this information. This led While we migrate fully away from Google Analytics to PostHog there maybe be a small period of time where we run both in parallel before we remove all Google Analytics related code. This is to ensure we can fully test and validate the Netdata PostHog implementation before fully defaulting to it. -[]() diff --git a/docs/collect/application-metrics.md b/docs/collect/application-metrics.md index 4fb9ed6a..5af58b10 100644 --- a/docs/collect/application-metrics.md +++ b/docs/collect/application-metrics.md @@ -77,4 +77,4 @@ Collecting all the available metrics on your nodes, and across your entire infra puzzle. Next, learn more about Netdata's famous real-time visualizations by [seeing an overview of your infrastructure](/docs/visualize/overview-infrastructure.md) using Netdata Cloud. -[](<>) + diff --git a/docs/collect/container-metrics.md b/docs/collect/container-metrics.md index b5bb9da0..5d145362 100644 --- a/docs/collect/container-metrics.md +++ b/docs/collect/container-metrics.md @@ -96,4 +96,4 @@ brokers, and more. See more in the [application metrics doc](/docs/collect/appli If you already have all the information you need about collecting metrics, move into Netdata's meaningful visualizations with [seeing an overview of your infrastructure](/docs/visualize/overview-infrastructure.md) using Netdata Cloud. -[](<>) + diff --git a/docs/collect/enable-configure.md b/docs/collect/enable-configure.md index 584d2371..19e680c2 100644 --- a/docs/collect/enable-configure.md +++ b/docs/collect/enable-configure.md @@ -65,4 +65,4 @@ Netdata's visualization features. [See an overview of your infrastructure](/docs using Netdata Cloud, or learn how to [interact with dashboards and charts](/docs/visualize/interact-dashboards-charts.md). -[](<>) + diff --git a/docs/collect/how-collectors-work.md b/docs/collect/how-collectors-work.md index b4a6c879..983de35a 100644 --- a/docs/collect/how-collectors-work.md +++ b/docs/collect/how-collectors-work.md @@ -77,4 +77,4 @@ your infrastructure. See our [collectors reference](/collectors/REFERENCE.md) for detailed information on Netdata's collector architecture, troubleshooting a collector, developing a custom collector, and more. -[](<>) + diff --git a/docs/collect/system-metrics.md b/docs/collect/system-metrics.md index 14e2cc2a..62330289 100644 --- a/docs/collect/system-metrics.md +++ b/docs/collect/system-metrics.md @@ -63,4 +63,4 @@ should investigate Netdata's container compatibility if you use them heavily in If you don't use containers, skip ahead to collecting [application metrics](/docs/collect/application-metrics.md) with Netdata. -[](<>) + diff --git a/docs/configure/nodes.md b/docs/configure/nodes.md index 8399e89d..02cf6f05 100644 --- a/docs/configure/nodes.md +++ b/docs/configure/nodes.md @@ -19,7 +19,7 @@ anomaly, or change in infrastructure affects how their Agents should perform. ## The Netdata config directory On most Linux systems, using our [recommended one-line -installation](/docs/get-started.mdx#install-on-linux-with-one-line-installer-recommended), the **Netdata config +installation](/docs/get-started.mdx#install-on-linux-with-one-line-installer), the **Netdata config directory** is `/etc/netdata/`. The config directory contains several configuration files with the `.conf` extension, a few directories, and a shell script named `edit-config`. diff --git a/docs/contributing/contributing-documentation.md b/docs/contributing/contributing-documentation.md index 76fc609d..68b861d4 100644 --- a/docs/contributing/contributing-documentation.md +++ b/docs/contributing/contributing-documentation.md @@ -106,4 +106,4 @@ specific sections and ask for additional information or other fixes. After merging your PR, the Netdata team rebuilds the [documentation site](https://learn.netdata.cloud) to publish the changed documentation. -[](<>) + diff --git a/docs/contributing/style-guide.md b/docs/contributing/style-guide.md index 025b45f6..2af58d54 100644 --- a/docs/contributing/style-guide.md +++ b/docs/contributing/style-guide.md @@ -489,4 +489,4 @@ The following tables describe the standard spelling, capitalization, and usage o | **preconfigured** | The concept that many of Netdata's features come with sane defaults that users don't need to configure to find [immediate value](/docs/overview/why-netdata.md#simple-to-deploy). | | **real time**/**real-time** | Use _real time_ as a noun phrase, most often with _in_: _Netdata collects metrics in real time_. Use _real-time_ as an adjective: _Netdata collects real-time metrics from hundreds of supported applications and services. | -[](<>) + diff --git a/docs/export/enable-connector.md b/docs/export/enable-connector.md index 1ddecfd2..a914a114 100644 --- a/docs/export/enable-connector.md +++ b/docs/export/enable-connector.md @@ -92,4 +92,4 @@ labels](/docs/guides/using-host-labels.md) on exported metrics. - [OpenTSDB connector](/exporting/opentsdb/README.md) - [Graphite connector](/exporting/graphite/README.md) -[](<>) + diff --git a/docs/export/external-databases.md b/docs/export/external-databases.md index 6f7f488b..a542e8ee 100644 --- a/docs/export/external-databases.md +++ b/docs/export/external-databases.md @@ -85,6 +85,5 @@ Graphite_](/docs/guides/export/export-netdata-metrics-graphite.md). ### Related reference documentation - [Exporting engine reference](/exporting/README.md) -- [Backends reference (deprecated)](/backends/README.md) -[](<>) + diff --git a/docs/guides/collect-apache-nginx-web-logs.md b/docs/guides/collect-apache-nginx-web-logs.md index 1ffa9d3b..0298e1d4 100644 --- a/docs/guides/collect-apache-nginx-web-logs.md +++ b/docs/guides/collect-apache-nginx-web-logs.md @@ -159,4 +159,4 @@ into powerful real-time tools for keeping your servers happy. Don't forget to give GitHub user [Wing924](https://github.com/Wing924) a big 👍 for his hard work in starting up the Go refactoring effort. -[](<>) + diff --git a/docs/guides/collect-unbound-metrics.md b/docs/guides/collect-unbound-metrics.md index 5709c872..8edcab10 100644 --- a/docs/guides/collect-unbound-metrics.md +++ b/docs/guides/collect-unbound-metrics.md @@ -137,4 +137,4 @@ for improvement or refinement based on real-world use cases. Feel free to [file issue](https://github.com/netdata/netdata/issues/new?assignees=&labels=bug%2Cneeds+triage&template=BUG_REPORT.yml) with your thoughts. -[](<>) + diff --git a/docs/guides/deploy/ansible.md b/docs/guides/deploy/ansible.md index f7bf514e..7e5532b6 100644 --- a/docs/guides/deploy/ansible.md +++ b/docs/guides/deploy/ansible.md @@ -171,4 +171,4 @@ provisioning/infrastructure as code software, such as Chef or Puppet, in our [co repo](https://github.com/netdata/community). Anyone is able to fork the repo and submit a PR, either to improve this playbook, extend it, or create an entirely new experience for deploying Netdata across entire infrastructure. -[](<>) + diff --git a/docs/guides/export/export-netdata-metrics-graphite.md b/docs/guides/export/export-netdata-metrics-graphite.md index 37d2fdb5..007c30f8 100644 --- a/docs/guides/export/export-netdata-metrics-graphite.md +++ b/docs/guides/export/export-netdata-metrics-graphite.md @@ -180,4 +180,4 @@ often. For full details about each configuration option and what it does, see the [exporting reference guide](/exporting/README.md). -[](<>) + diff --git a/docs/guides/longer-metrics-storage.md b/docs/guides/longer-metrics-storage.md index b682125f..85edb55e 100644 --- a/docs/guides/longer-metrics-storage.md +++ b/docs/guides/longer-metrics-storage.md @@ -157,4 +157,4 @@ charts](/web/README.md#using-charts). And if you'd now like to reduce Netdata's resource usage, view our [performance guide](/docs/guides/configure/performance.md) for our best practices on optimization. -[](<>) + diff --git a/docs/guides/monitor-cockroachdb.md b/docs/guides/monitor-cockroachdb.md index 32723783..46dd2535 100644 --- a/docs/guides/monitor-cockroachdb.md +++ b/docs/guides/monitor-cockroachdb.md @@ -133,4 +133,4 @@ Also, be sure to check out these useful resources: - [Monitor CockroachDB with Prometheus](https://www.cockroachlabs.com/docs/stable/monitor-cockroachdb-with-prometheus.html) -[](<>) + diff --git a/docs/guides/monitor-hadoop-cluster.md b/docs/guides/monitor-hadoop-cluster.md index 69f2bc8e..62403f89 100644 --- a/docs/guides/monitor-hadoop-cluster.md +++ b/docs/guides/monitor-hadoop-cluster.md @@ -200,4 +200,4 @@ issue](https://github.com/netdata/netdata/issues/new?assignees=&labels=bug%2Cnee file](https://github.com/netdata/go.d.plugin/blob/master/config/go.d/zookeeper.conf) to understand how to configure global options or per-job options, timeouts, TLS certificates, and more. -[](<>) + diff --git a/docs/guides/monitor/anomaly-detection-python.md b/docs/guides/monitor/anomaly-detection-python.md index d10e9da4..ad8398cc 100644 --- a/docs/guides/monitor/anomaly-detection-python.md +++ b/docs/guides/monitor/anomaly-detection-python.md @@ -23,7 +23,7 @@ library](https://github.com/yzhao062/pyod/tree/master), which periodically runs quantify how anomalous certain charts are. All these metrics and alarms are available for centralized monitoring in [Netdata Cloud](https://app.netdata.cloud). If -you choose to sign up for Netdata Cloud and [coonect your nodes](/claim/README.md), you will have the ability to run +you choose to sign up for Netdata Cloud and [connect your nodes](/claim/README.md), you will have the ability to run tailored anomaly detection on every node in your infrastructure, regardless of its purpose or workload. In this guide, you'll learn how to set up the anomalies collector to instantly detect anomalies in an Nginx web server @@ -143,7 +143,7 @@ dimensions](https://user-images.githubusercontent.com/1153921/102813877-db5e4880 As you can see in the above screenshot, this node is now looking for anomalies in many places. The result is a single `anomalies_local.probability` chart with more than twenty dimensions, some of which the dashboard hides at the bottom of -a scroll-able area. In addition, training and analyzing the anomaly collector on many charts might require more CPU +a scrollable area. In addition, training and analyzing the anomaly collector on many charts might require more CPU utilization that you're willing to give. First, explicitly declare which `system.` charts to monitor rather than of all of them using regex (`system\..*`). diff --git a/docs/guides/monitor/dimension-templates.md b/docs/guides/monitor/dimension-templates.md index 7cbe7959..53912736 100644 --- a/docs/guides/monitor/dimension-templates.md +++ b/docs/guides/monitor/dimension-templates.md @@ -173,4 +173,4 @@ Or, at the very least, simplify your configuration files. For information about other advanced features in Netdata's health monitoring toolkit, check out our [health documentation](/health/README.md). And if you have some cool alarms you built using dimension templates, -[](<>) + diff --git a/docs/guides/monitor/kubernetes-k8s-netdata.md b/docs/guides/monitor/kubernetes-k8s-netdata.md index bd893ede..5cfefe89 100644 --- a/docs/guides/monitor/kubernetes-k8s-netdata.md +++ b/docs/guides/monitor/kubernetes-k8s-netdata.md @@ -251,4 +251,4 @@ clusters of all sizes. collector](https://learn.netdata.cloud/docs/agent/collectors/go.d.plugin/modules/k8s_kubeproxy) - [Netdata Agent · `cgroups.plugin`](/collectors/cgroups.plugin/README.md) -[](<>) + diff --git a/docs/guides/monitor/lamp-stack.md b/docs/guides/monitor/lamp-stack.md index 4fe0defb..595d6440 100644 --- a/docs/guides/monitor/lamp-stack.md +++ b/docs/guides/monitor/lamp-stack.md @@ -244,4 +244,3 @@ source of issues faster with [Metric Correlations](https://learn.netdata.cloud/d - [Netdata Agent · MySQL data collector](https://learn.netdata.cloud/docs/agent/collectors/go.d.plugin/modules/mysql) - [Netdata Agent · PHP-FPM data collector](https://learn.netdata.cloud/docs/agent/collectors/go.d.plugin/modules/phpfpm) -[](<>)
\ No newline at end of file diff --git a/docs/guides/monitor/pi-hole-raspberry-pi.md b/docs/guides/monitor/pi-hole-raspberry-pi.md index 9dc60d3a..721ba2a8 100644 --- a/docs/guides/monitor/pi-hole-raspberry-pi.md +++ b/docs/guides/monitor/pi-hole-raspberry-pi.md @@ -159,4 +159,4 @@ troubleshooting the health of your systems and services. If you have any questions about using Netdata to monitor your Raspberry Pi, Pi-hole, or any other applications, head on over to our [community forum](https://community.netdata.cloud/). -[](<>) + diff --git a/docs/guides/monitor/process.md b/docs/guides/monitor/process.md index d322035b..2f46d7ab 100644 --- a/docs/guides/monitor/process.md +++ b/docs/guides/monitor/process.md @@ -298,4 +298,4 @@ frameworks. - [Netdata Agent · Dashboards](/web/README.md#dimensions) - [Netdata Agent · MySQL collector](https://learn.netdata.cloud/docs/agent/collectors/go.d.plugin/modules/mysql) -[](<>) + diff --git a/docs/guides/monitor/raspberry-pi-anomaly-detection.md b/docs/guides/monitor/raspberry-pi-anomaly-detection.md index 029dfcbc..73f57cd0 100644 --- a/docs/guides/monitor/raspberry-pi-anomaly-detection.md +++ b/docs/guides/monitor/raspberry-pi-anomaly-detection.md @@ -122,4 +122,4 @@ feedback on our [community forum](https://community.netdata.cloud/t/anomalies-co - [Netdata Agent · Get Netdata](/docs/get-started.mdx) - [Netdata Agent · Anomalies collector](/collectors/python.d.plugin/anomalies/README.md) -[](<>) + diff --git a/docs/guides/monitor/statsd.md b/docs/guides/monitor/statsd.md index 214b488f..3e2f0f85 100644 --- a/docs/guides/monitor/statsd.md +++ b/docs/guides/monitor/statsd.md @@ -295,4 +295,4 @@ Netdata allows you easily visualize any StatsD metric without any configuration, - [Netdata Agent · StatsD](/collectors/statsd.plugin/README.md) -[](<>) + diff --git a/docs/guides/monitor/stop-notifications-alarms.md b/docs/guides/monitor/stop-notifications-alarms.md index ad054d5c..a8b73a86 100644 --- a/docs/guides/monitor/stop-notifications-alarms.md +++ b/docs/guides/monitor/stop-notifications-alarms.md @@ -89,4 +89,4 @@ You can also use Netdata's [Health Management API](/web/api/health/README.md#hea checks and notifications while Netdata runs. With this API, you can disable health checks during a maintenance window or backup process, for example. -[](<>) + diff --git a/docs/guides/monitor/visualize-monitor-anomalies.md b/docs/guides/monitor/visualize-monitor-anomalies.md index 9eace523..1f8c2c8f 100644 --- a/docs/guides/monitor/visualize-monitor-anomalies.md +++ b/docs/guides/monitor/visualize-monitor-anomalies.md @@ -139,4 +139,4 @@ that works well for monitoring some other popular application, like MySQL, Postg - [Netdata Agent · Anomalies collector](/collectors/python.d.plugin/anomalies/README.md) - [Netdata Cloud · Build new dashboards](https://learn.netdata.cloud/docs/cloud/visualize/dashboards) -[](<>) + diff --git a/docs/guides/python-collector.md b/docs/guides/python-collector.md index c3784194..f93c724b 100644 --- a/docs/guides/python-collector.md +++ b/docs/guides/python-collector.md @@ -483,4 +483,4 @@ Now we you ready to start developing our Netdata python Collector and share it w production-grade collectors. - Celebrate! You have contributed to an open-source project with hundreds of thousands of users! -[](<>) + diff --git a/docs/guides/step-by-step/step-00.md b/docs/guides/step-by-step/step-00.md index 3cb85ced..ab68fe74 100644 --- a/docs/guides/step-by-step/step-00.md +++ b/docs/guides/step-by-step/step-00.md @@ -117,4 +117,4 @@ MongoDB, TimescaleDB, and others. Run Netdata behind an Nginx proxy to improve performance, and enable TLS/HTTPS for better security. -[](<>) + diff --git a/docs/guides/step-by-step/step-01.md b/docs/guides/step-by-step/step-01.md index cdcfcd7a..f5430e3a 100644 --- a/docs/guides/step-by-step/step-01.md +++ b/docs/guides/step-by-step/step-01.md @@ -153,4 +153,4 @@ get right into that dashboard you've heard so much about. [Next: Get to know Netdata's dashboard →](step-02.md) -[](<>) + diff --git a/docs/guides/step-by-step/step-02.md b/docs/guides/step-by-step/step-02.md index c87712c9..4b802ffd 100644 --- a/docs/guides/step-by-step/step-02.md +++ b/docs/guides/step-by-step/step-02.md @@ -205,4 +205,4 @@ Next, you'll learn how to monitor multiple nodes through the dashboard. [Next: Monitor more than one system with Netdata →](step-03.md) -[](<>) + diff --git a/docs/guides/step-by-step/step-03.md b/docs/guides/step-by-step/step-03.md index a2f37bee..c1d283ba 100644 --- a/docs/guides/step-by-step/step-03.md +++ b/docs/guides/step-by-step/step-03.md @@ -88,4 +88,4 @@ customize your Netdata experience to your exact infrastructure and the informati [Next: The basics of configuring Netdata →](step-04.md) -[](<>) + diff --git a/docs/guides/step-by-step/step-04.md b/docs/guides/step-by-step/step-04.md index 41431b1d..37b4245b 100644 --- a/docs/guides/step-by-step/step-04.md +++ b/docs/guides/step-by-step/step-04.md @@ -141,4 +141,4 @@ choosing. [Next: Health monitoring alarms and notifications →](step-05.md) -[](<>) + diff --git a/docs/guides/step-by-step/step-05.md b/docs/guides/step-by-step/step-05.md index c0b62261..3cd8c5db 100644 --- a/docs/guides/step-by-step/step-05.md +++ b/docs/guides/step-by-step/step-05.md @@ -347,4 +347,4 @@ from hundreds of services with almost no configuration on your part. Onward! [Next: Collect metrics from more services and apps →](step-06.md) -[](<>) + diff --git a/docs/guides/step-by-step/step-06.md b/docs/guides/step-by-step/step-06.md index 61888607..89a8cb73 100644 --- a/docs/guides/step-by-step/step-06.md +++ b/docs/guides/step-by-step/step-06.md @@ -119,4 +119,4 @@ the dashboard to learn more about some of its more advanced features. [Next: Netdata's dashboard in depth →](step-07.md) -[](<>) + diff --git a/docs/guides/step-by-step/step-07.md b/docs/guides/step-by-step/step-07.md index f2f66557..17a02cd4 100644 --- a/docs/guides/step-by-step/step-07.md +++ b/docs/guides/step-by-step/step-07.md @@ -111,4 +111,4 @@ Next, you'll learn how to build your first custom dashboard! [Next: Build your first custom dashboard →](step-08.md) -[](<>) + diff --git a/docs/guides/step-by-step/step-08.md b/docs/guides/step-by-step/step-08.md index 76a1b077..e9c0f902 100644 --- a/docs/guides/step-by-step/step-08.md +++ b/docs/guides/step-by-step/step-08.md @@ -392,4 +392,4 @@ Next, you'll learn how to store long-term historical metrics in Netdata! [Next: Long-term metrics storage →](/docs/guides/step-by-step/step-09.md) -[](<>) + diff --git a/docs/guides/step-by-step/step-09.md b/docs/guides/step-by-step/step-09.md index 6e29d84c..6333dfe6 100644 --- a/docs/guides/step-by-step/step-09.md +++ b/docs/guides/step-by-step/step-09.md @@ -159,4 +159,4 @@ our Netdata dashboard. [Next: Set up a proxy →](/docs/guides/step-by-step/step-10.md) -[](<>) + diff --git a/docs/guides/step-by-step/step-10.md b/docs/guides/step-by-step/step-10.md index d1c065c5..c9acf5aa 100644 --- a/docs/guides/step-by-step/step-10.md +++ b/docs/guides/step-by-step/step-10.md @@ -156,7 +156,7 @@ sudo certbot --nginx > The requested nginx plugin does not appear to be installed` > ``` > -> You must install `python-certbox-nginx`. On Ubuntu or Debian systems, you can run `sudo apt-get install +> You must install `python-certbot-nginx`. On Ubuntu or Debian systems, you can run `sudo apt-get install > python-certbot-nginx` to download and install this package. You'll be prompted with a few questions. At the `Which names would you like to activate HTTPS for?` question, hit @@ -229,4 +229,4 @@ For some celebratory emoji and a clap on the back, head on over to our final ste [Next: The end. →](step-99.md) -[](<>) + diff --git a/docs/guides/step-by-step/step-99.md b/docs/guides/step-by-step/step-99.md index 06a826a1..58902fee 100644 --- a/docs/guides/step-by-step/step-99.md +++ b/docs/guides/step-by-step/step-99.md @@ -44,8 +44,8 @@ If that feels like too much possibility to you, why not one of these options: - Share your experience with Netdata and this guide. Be sure to [@mention](https://twitter.com/linuxnetdata) us on Twitter! - Contribute to what we do. Browse our [open issues](https://github.com/netdata/netdata/issues) and check out out - [contributions doc](/README.md#contribute) for ideas of how you can pitch in. + [contributions doc](https://learn.netdata.cloud/contribute/) for ideas of how you can pitch in. We can't wait to see what you monitor next! Bon voyage! ⛵ -[](<>) + diff --git a/docs/guides/troubleshoot/monitor-debug-applications-ebpf.md b/docs/guides/troubleshoot/monitor-debug-applications-ebpf.md index 688e7d29..3ebca542 100644 --- a/docs/guides/troubleshoot/monitor-debug-applications-ebpf.md +++ b/docs/guides/troubleshoot/monitor-debug-applications-ebpf.md @@ -267,4 +267,4 @@ we'd love to hear them: [info@netdata.cloud](mailto:info@netdata.cloud). Happy troubleshooting! -[](<>) + diff --git a/docs/guides/using-host-labels.md b/docs/guides/using-host-labels.md index d3a51bea..7a5381e9 100644 --- a/docs/guides/using-host-labels.md +++ b/docs/guides/using-host-labels.md @@ -86,7 +86,7 @@ They capture the following: - What virtualization layer the system runs on top of, if any - Whether the system is a streaming parent or child -If you want to organize your systems without manually creating host tags, try the automatic labels in some of the +If you want to organize your systems without manually creating host labels, try the automatic labels in some of the features below. ## Host labels in streaming @@ -209,4 +209,4 @@ If you have issues or questions around using host labels, don't hesitate to [fil issue](https://github.com/netdata/netdata/issues/new?assignees=&labels=bug%2Cneeds+triage&template=BUG_REPORT.yml) on GitHub. We're excited to make host labels even more valuable to our users, which we can only do with your input. -[](<>) + diff --git a/docs/monitor/configure-alarms.md b/docs/monitor/configure-alarms.md index 563e6156..ac458115 100644 --- a/docs/monitor/configure-alarms.md +++ b/docs/monitor/configure-alarms.md @@ -145,4 +145,4 @@ state. To build complex, dynamic alarms, read our guide on [dimension templates](/docs/guides/monitor/dimension-templates.md). -[](<>) + diff --git a/docs/monitor/enable-notifications.md b/docs/monitor/enable-notifications.md index d0ff04d9..8cf69797 100644 --- a/docs/monitor/enable-notifications.md +++ b/docs/monitor/enable-notifications.md @@ -144,4 +144,4 @@ architecture](/docs/store/distributed-data-architecture.md) for the best-in-clas - [Netdata Cloud · Alarm notifications](https://learn.netdata.cloud/docs/cloud/alerts-notifications/notifications) - [Netdata Agent · Notifications](/health/notifications/README.md) -[](<>) + diff --git a/docs/monitor/view-active-alarms.md b/docs/monitor/view-active-alarms.md index 99169c2c..be218268 100644 --- a/docs/monitor/view-active-alarms.md +++ b/docs/monitor/view-active-alarms.md @@ -72,4 +72,4 @@ If you're happy with the pre-configured alarms, skip ahead to [enable notifications](/docs/monitor/enable-notifications.md) to use Netdata Cloud's centralized alarm notifications and/or per-node notifications to endpoints like Slack, PagerDuty, Twilio, and more. -[](<>) + diff --git a/docs/netdata-for-IoT.md b/docs/netdata-for-IoT.md index 77b95229..35d77053 100644 --- a/docs/netdata-for-IoT.md +++ b/docs/netdata-for-IoT.md @@ -71,4 +71,4 @@ Then restart Netdata. You will get this: 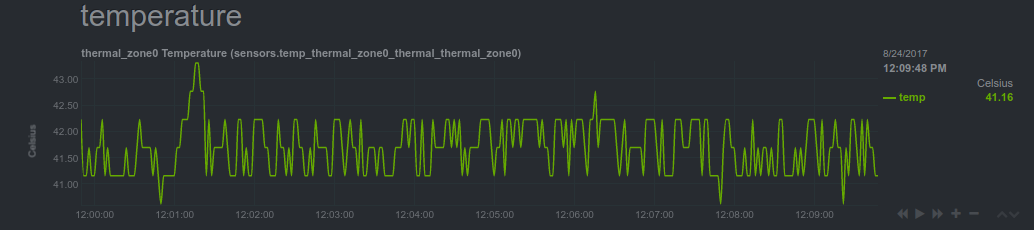 -[](<>) + diff --git a/docs/netdata-security.md b/docs/netdata-security.md index bb4ac30c..9bb26ad2 100644 --- a/docs/netdata-security.md +++ b/docs/netdata-security.md @@ -205,7 +205,7 @@ The default configuration uses a public registry under registry.my-netdata.io (m - The url where you open the web-ui in the browser (via http request referrer) - The hostnames of the Netdata servers -If sending this information to the central Netdata registry violates your security policies, you can configure Netdat to [run your own registry](/registry/README.md#run-your-own-registry). +If sending this information to the central Netdata registry violates your security policies, you can configure Netdata to [run your own registry](/registry/README.md#run-your-own-registry). ### Opt-out of anonymous statistics @@ -226,4 +226,4 @@ _actively_ contributing to Netdata's future. | `/var/lib/netdata`|user `netdata`<br/>group `netdata`|dirs `0750`<br/>files `0660`|reads, writes, creates, deletes|**Netdata permanent database files**<br/>Netdata stores here the registry data, health alarm log db, etc.| | `/var/log/netdata`|user `netdata`<br/>group `root`|dirs `0755`<br/>files `0644`|writes, creates|**Netdata log files**<br/>all the Netdata applications, logs their errors or other informational messages to files in this directory. These files should be log rotated.| -[](<>) + diff --git a/docs/overview/netdata-monitoring-stack.md b/docs/overview/netdata-monitoring-stack.md index 3a954f05..ae925227 100644 --- a/docs/overview/netdata-monitoring-stack.md +++ b/docs/overview/netdata-monitoring-stack.md @@ -59,4 +59,4 @@ charts, or use Netdata's health watchdog to send notifications whenever an anoma Whether you're using Netdata standalone or as part of a larger monitoring stack, the next step is the same: [**Get Netdata**](/docs/get-started.mdx). -[](<>) + diff --git a/docs/overview/what-is-netdata.md b/docs/overview/what-is-netdata.md index 37f974ad..3df1d949 100644 --- a/docs/overview/what-is-netdata.md +++ b/docs/overview/what-is-netdata.md @@ -71,4 +71,4 @@ case: Learn more about [why you should use Netdata](/docs/overview/why-netdata.md), or [how Netdata works with your existing monitoring stack](/docs/overview/netdata-monitoring-stack.md). -[](<>) + diff --git a/docs/overview/why-netdata.md b/docs/overview/why-netdata.md index 27a30a4c..9a308f25 100644 --- a/docs/overview/why-netdata.md +++ b/docs/overview/why-netdata.md @@ -60,4 +60,4 @@ Whether you already have a monitoring stack you want to integrate Netdata into, ground-up, you should read more on how Netdata can work either [standalone or as an interoperable part of a monitoring stack](/docs/overview/netdata-monitoring-stack.md). -[](<>) + diff --git a/docs/quickstart/infrastructure.md b/docs/quickstart/infrastructure.md index ea803cf1..9db66c05 100644 --- a/docs/quickstart/infrastructure.md +++ b/docs/quickstart/infrastructure.md @@ -182,4 +182,4 @@ To change how the Netdata Agent runs on each node, dig in to configuration files GitHub](https://learn.netdata.cloud/docs/cloud/manage/sign-in) - [Netdata Cloud · Nodes view](https://learn.netdata.cloud/docs/cloud/visualize/nodes) -[](<>) + diff --git a/docs/quickstart/single-node.md b/docs/quickstart/single-node.md index ab98a838..7855a487 100644 --- a/docs/quickstart/single-node.md +++ b/docs/quickstart/single-node.md @@ -89,4 +89,4 @@ out some of Netdata's other visualization and health monitoring features: - [Export metrics](/docs/export/external-databases.md) to an external time-series database to use Netdata alongside other monitoring and troubleshooting tools. -[](<>) + diff --git a/docs/store/change-metrics-storage.md b/docs/store/change-metrics-storage.md index 2ed026c5..99760e8d 100644 --- a/docs/store/change-metrics-storage.md +++ b/docs/store/change-metrics-storage.md @@ -74,4 +74,4 @@ further analysis, visualization, or correlation with other tools. - [Netdata Agent · Database engine](/database/engine/README.md) -[](<>) + diff --git a/docs/store/distributed-data-architecture.md b/docs/store/distributed-data-architecture.md index 0ec5c142..c834d710 100644 --- a/docs/store/distributed-data-architecture.md +++ b/docs/store/distributed-data-architecture.md @@ -68,4 +68,4 @@ You can configure the Netdata Agent to store days, weeks, or months worth of dis resources required to retain your desired amount of metrics, and expand or contract the database by editing a single setting. -[](<>) + diff --git a/docs/visualize/create-dashboards.md b/docs/visualize/create-dashboards.md index 91a8dccc..696cd1a7 100644 --- a/docs/visualize/create-dashboards.md +++ b/docs/visualize/create-dashboards.md @@ -61,4 +61,4 @@ While it's useful to see real-time metrics on flexible dashboards, you need ways strikes. Every Netdata Agent comes with a health watchdog that uses [alarms](/docs/monitor/configure-alarms.md) and [notifications](/docs/monitor/enable-notifications.md) to notify you of issues seconds after they strike. -[](<>) + diff --git a/docs/visualize/interact-dashboards-charts.md b/docs/visualize/interact-dashboards-charts.md index c5b4c1b6..5dbbf19a 100644 --- a/docs/visualize/interact-dashboards-charts.md +++ b/docs/visualize/interact-dashboards-charts.md @@ -128,4 +128,4 @@ to get informed when something goes wrong in your infrastructure. - [Netdata Cloud · Nodes](https://learn.netdata.cloud/docs/cloud/visualize/nodes) - [Netdata Cloud · Build new dashboards](https://learn.netdata.cloud/docs/cloud/visualize/dashboards) -[](<>) + diff --git a/docs/visualize/overview-infrastructure.md b/docs/visualize/overview-infrastructure.md index 288bfc51..4edbb0f3 100644 --- a/docs/visualize/overview-infrastructure.md +++ b/docs/visualize/overview-infrastructure.md @@ -108,4 +108,4 @@ visualizations_](/docs/guides/monitor/kubernetes-k8s-netdata.md), for a full wal - [Netdata Cloud · Nodes view](https://learn.netdata.cloud/docs/cloud/visualize/nodes) - [Netdata Cloud · Kubernetes visualizations](https://learn.netdata.cloud/docs/cloud/visualize/kubernetes) -[](<>) + diff --git a/docs/why-netdata/1s-granularity.md b/docs/why-netdata/1s-granularity.md index a2cc65b8..4fc7fab2 100644 --- a/docs/why-netdata/1s-granularity.md +++ b/docs/why-netdata/1s-granularity.md @@ -56,4 +56,4 @@ Netdata has been designed to: So, for Netdata 1s granularity is easy, the natural outcome... -[](<>) + diff --git a/docs/why-netdata/README.md b/docs/why-netdata/README.md index 39cda51e..c482ee94 100644 --- a/docs/why-netdata/README.md +++ b/docs/why-netdata/README.md @@ -32,4 +32,4 @@ Netdata's helps us troubleshoot slowdowns without touching the console. So, everything is a bit different. -[](<>) + diff --git a/docs/why-netdata/immediate-results.md b/docs/why-netdata/immediate-results.md index ba7c7d68..b35aa538 100644 --- a/docs/why-netdata/immediate-results.md +++ b/docs/why-netdata/immediate-results.md @@ -43,4 +43,4 @@ Netdata: - Does not introduce any query languages or any other technology to be learned. Of course some familiarity with the tool is required, but nothing too complicated. - Includes all the community expertise and experience for monitoring systems and applications. -[](<>) + diff --git a/docs/why-netdata/meaningful-presentation.md b/docs/why-netdata/meaningful-presentation.md index 64d83b4f..fc670e33 100644 --- a/docs/why-netdata/meaningful-presentation.md +++ b/docs/why-netdata/meaningful-presentation.md @@ -65,4 +65,4 @@ But it simplifies everything else. Data collection, metrics database and visuali Netdata goes a step further, by enriching the dashboard with information that is useful for most people. So, to improve clarity and help users be more effective, Netdata includes right in the dashboard the community knowledge and expertise about the metrics. So, that Netdata users can focus on solving their infrastructure problem, not on the technicalities of data collection and visualization. -[](<>) + diff --git a/docs/why-netdata/unlimited-metrics.md b/docs/why-netdata/unlimited-metrics.md index 8e50062c..b79a4ede 100644 --- a/docs/why-netdata/unlimited-metrics.md +++ b/docs/why-netdata/unlimited-metrics.md @@ -46,4 +46,4 @@ Due to Netdata's distributed nature, the number of metrics collected does not ha Of course, since Netdata is also about [meaningful presentation](meaningful-presentation.md), the number of metrics makes Netdata development slower. We, the Netdata developers, need to have a good understanding of the metrics before adding them into Netdata. We need to organize the metrics, add information related to them, configure alarms for them, so that you, the Netdata users, will have the best out-of-the-box experience and all the information required to kill the console for troubleshooting slowdowns. -[](<>) + |