
diff options
| author | Daniel Baumann <daniel.baumann@progress-linux.org> | 2019-08-04 08:57:13 +0000 |
|---|---|---|
| committer | Daniel Baumann <daniel.baumann@progress-linux.org> | 2019-08-04 08:57:13 +0000 |
| commit | cbf70980c060bde02906a8e9de2064459bacc93c (patch) | |
| tree | 5b9ade02e0ed32a4b33f5e8647092d0c02ea586d /docs | |
| parent | Releasing debian version 1.16.0-1. (diff) | |
| download | netdata-cbf70980c060bde02906a8e9de2064459bacc93c.tar.xz netdata-cbf70980c060bde02906a8e9de2064459bacc93c.zip | |
Merging upstream version 1.16.1.
Signed-off-by: Daniel Baumann <daniel.baumann@progress-linux.org>
Diffstat (limited to 'docs')
| -rw-r--r-- | docs/Demo-Sites.md | 1 | ||||
| -rw-r--r-- | docs/README.md | 7 | ||||
| -rw-r--r-- | docs/Running-behind-apache.md | 45 | ||||
| -rw-r--r-- | docs/Running-behind-haproxy.md | 280 | ||||
| -rw-r--r-- | docs/Running-behind-nginx.md | 87 | ||||
| -rw-r--r-- | docs/configuration-guide.md | 2 | ||||
| -rwxr-xr-x | docs/generator/buildhtml.sh | 16 | ||||
| -rwxr-xr-x | docs/generator/buildyaml.sh | 22 | ||||
| -rwxr-xr-x | docs/generator/checklinks.sh | 32 | ||||
| -rw-r--r-- | docs/generator/custom/css/netdata.css | 68 | ||||
| -rw-r--r-- | docs/netdata-security.md | 2 | ||||
| -rw-r--r-- | docs/what-is-netdata.md | 385 |
12 files changed, 891 insertions, 56 deletions
diff --git a/docs/Demo-Sites.md b/docs/Demo-Sites.md index 0d478d73..5a2ae534 100644 --- a/docs/Demo-Sites.md +++ b/docs/Demo-Sites.md @@ -7,7 +7,6 @@ Location | Netdata demo URL | 60 mins reqs | VM Donated by London (UK)|**[london.my-netdata.io](https://london.my-netdata.io)**<br/>(this is the global Netdata **registry** and has **named** and **mysql** charts)|[](https://london.my-netdata.io)|[DigitalOcean.com](https://m.do.co/c/83dc9f941745) Atlanta (USA)|**[cdn77.my-netdata.io](https://cdn77.my-netdata.io)**<br/>(with **named** and **mysql** charts)|[](https://cdn77.my-netdata.io)|[CDN77.com](https://www.cdn77.com/) Israel|**[octopuscs.my-netdata.io](https://octopuscs.my-netdata.io)**|[](https://octopuscs.my-netdata.io)|[OctopusCS.com](https://www.octopuscs.com) -Roubaix (France)|**[ventureer.my-netdata.io](https://ventureer.my-netdata.io)**|[](https://ventureer.my-netdata.io)|[Ventureer.com](https://ventureer.com/) Madrid (Spain)|**[stackscale.my-netdata.io](https://stackscale.my-netdata.io)**|[](https://stackscale.my-netdata.io)|[StackScale Spain](https://www.stackscale.es/) Bangalore (India)|**[bangalore.my-netdata.io](https://bangalore.my-netdata.io)**|[](https://bangalore.my-netdata.io)|[DigitalOcean.com](https://m.do.co/c/83dc9f941745) Frankfurt (Germany)|**[frankfurt.my-netdata.io](https://frankfurt.my-netdata.io)**|[](https://frankfurt.my-netdata.io)|[DigitalOcean.com](https://m.do.co/c/83dc9f941745) diff --git a/docs/README.md b/docs/README.md new file mode 100644 index 00000000..8dd0c7a6 --- /dev/null +++ b/docs/README.md @@ -0,0 +1,7 @@ +# Read documentation on https://docs.netdata.cloud + +Welcome to the Netdata documentation! While you can read Netdata documentation here, or throughout the Netdata repository, our intention is that these pages are read on [docs.netdata.cloud](https://docs.netdata.cloud). + +Links between documentation pages will work fine here, but the formatting may not be perfect, as our documentation site uses a few extra Markdown features that GitHub doesn't support natively. Other things might be missing or look less than perfect. + +Now get out there and build an exceptional infrastructure.
\ No newline at end of file diff --git a/docs/Running-behind-apache.md b/docs/Running-behind-apache.md index a71897f4..c4def5f6 100644 --- a/docs/Running-behind-apache.md +++ b/docs/Running-behind-apache.md @@ -3,7 +3,7 @@ Below you can find instructions for configuring an apache server to: 1. proxy a single Netdata via an HTTP and HTTPS virtual host -2. dynamically proxy any number of Netdata +2. dynamically proxy any number of Netdata servers 3. add user authentication 4. adjust Netdata settings to get optimal results @@ -145,13 +145,15 @@ sudo a2ensite netdata.conf && service apache2 reload ## Netdata proxy in Plesk _Assuming the main goal is to make Netdata running in HTTPS._ + 1. Make a subdomain for Netdata on which you enable and force HTTPS - You can use a free Let's Encrypt certificate 2. Go to "Apache & nginx Settings", and in the following section, add: + ``` RewriteEngine on RewriteRule (.*) http://localhost:19999/$1 [P,L] ``` -3. Optional: If your server is remote, then just replace "localhost" with your actual hostname or IP, it just works. +3. Optional: If your server is remote, then just replace "localhost" with your actual hostname or IP, it just works. Repeat the operation for as many servers as you need. @@ -164,6 +166,7 @@ Install the package `apache2-utils`. On debian / ubuntu run `sudo apt-get instal Then, generate password for user `netdata`, using `htpasswd -c /etc/apache2/.htpasswd netdata` +**Apache 2.2 Example:** Modify the virtual host with these: ``` @@ -186,6 +189,34 @@ Modify the virtual host with these: Specify `Location /` if Netdata is running on dedicated virtual host. + + +**Apache 2.4 (dedicated virtual host) Example:** + +``` +<VirtualHost *:80> + RewriteEngine On + ProxyRequests Off + ProxyPreserveHost On + + ServerName netdata.domain.tld + + <Proxy *> + AllowOverride None + AuthType Basic + AuthName "Protected site" + AuthUserFile /etc/apache2/.htpasswd + Require valid-user + </Proxy> + + ProxyPass "/" "http://localhost:19999/" connectiontimeout=5 timeout=30 keepalive=on + ProxyPassReverse "/" "http://localhost:19999/" + + ErrorLog ${APACHE_LOG_DIR}/netdata-error.log + CustomLog ${APACHE_LOG_DIR}/netdata-access.log combined +</VirtualHost> +``` + Note: Changes are applied by reloading or restarting Apache. # Netdata configuration @@ -230,6 +261,14 @@ You can also use a unix domain socket. This will also provide a faster route bet [web] bind to = unix:/tmp/netdata.sock ``` + +Apache 2.4.24+ can not read from `/tmp` so create your socket in `/var/run/netdata` + +``` +[web] + bind to = unix:/var/run/netdata/netdata.sock +``` + _note: Netdata v1.8+ support unix domain sockets_ At the apache side, prepend the 2nd argument to `ProxyPass` with `unix:/tmp/netdata.sock|`, like this: @@ -265,6 +304,6 @@ apache logs accesses and Netdata logs them too. You can prevent Netdata from gen Make sure the requests reach Netdata, by examing `/var/log/netdata/access.log`. 1. if the requests do not reach Netdata, your apache does not forward them. -2. if the requests reach Netdata by the URLs are wrong, you have not re-written them properly. +2. if the requests reach Netdata but the URLs are wrong, you have not re-written them properly. []() diff --git a/docs/Running-behind-haproxy.md b/docs/Running-behind-haproxy.md new file mode 100644 index 00000000..2c1835f5 --- /dev/null +++ b/docs/Running-behind-haproxy.md @@ -0,0 +1,280 @@ +# Netdata via HAProxy + +> HAProxy is a free, very fast and reliable solution offering high availability, load balancing, and proxying for TCP and HTTP-based applications. It is particularly suited for very high traffic web sites and powers quite a number of the world's most visited ones. + +If Netdata is running on a host running HAProxy, rather than connecting to Netdata from a port number, a domain name can be pointed at HAProxy, and HAProxy can redirect connections to the Netdata port. This can make it possible to connect to Netdata at https://example.com or https://example.com/netdata/, which is a much nicer experience then http://example.com:19999. + +To proxy requests from [HAProxy](https://github.com/haproxy/haproxy) to Netdata, the following configuration can be used: + +## Default Configuration + +For all examples, set the mode to `http` + +``` +defaults + mode http +``` + +## Simple Configuration + +A simple example where the base URL, say http://example.com, is used with no subpath: + +### Frontend + +Create a frontend to recieve the request. + +``` +frontend http_frontend + ## HTTP ipv4 and ipv6 on all ips ## + bind :::80 v4v6 + + default_backend netdata_backend +``` + +### Backend + +Create the Netdata backend which will send requests to port `19999`. + +``` +backend netdata_backend + option forwardfor + server netdata_local 127.0.0.1:19999 + + http-request set-header Host %[src] + http-request set-header X-Forwarded-For %[src] + http-request set-header X-Forwarded-Port %[dst_port] + http-request set-header Connection "keep-alive" +``` + +## Configuration with subpath + +A example where the base URL is used with a subpath `/netdata/`: + +### Frontend + +To use a subpath, create an ACL, which will set a variable based on the subpath. + +``` +frontend http_frontend + ## HTTP ipv4 and ipv6 on all ips ## + bind :::80 v4v6 + + # URL begins with /netdata + acl is_netdata url_beg /netdata + + # if trailing slash is missing, redirect to /netdata/ + http-request redirect scheme https drop-query append-slash if is_netdata ! { path_beg /netdata/ } + + ## Backends ## + use_backend netdata_backend if is_netdata + + # Other requests go here (optional) + # put netdata_backend here if no others are used + default_backend www_backend +``` + +### Backend + +Same as simple example, expept remove `/netdata/` with regex. + +``` +backend netdata_backend + option forwardfor + server netdata_local 127.0.0.1:19999 + + http-request set-path %[path,regsub(^/netdata/,/)] + + http-request set-header Host %[src] + http-request set-header X-Forwarded-For %[src] + http-request set-header X-Forwarded-Port %[dst_port] + http-request set-header Connection "keep-alive" +``` + +## Using TLS communication + +TLS can be used by adding port `443` and a cert to the frontend. This example will only use Netdata if host matches example.com (replace with your domain). + +### Frontend + +This frontend uses a certificate list. + +``` +frontend https_frontend + ## HTTP ## + bind :::80 v4v6 + # Redirect all HTTP traffic to HTTPS with 301 redirect + redirect scheme https code 301 if !{ ssl_fc } + + ## HTTPS ## + # Bind to all v4/v6 addresses, use a list of certs in file + bind :::443 v4v6 ssl crt-list /etc/letsencrypt/certslist.txt + + ## ACL ## + # Optionally check host for Netdata + acl is_example_host hdr_sub(host) -i example.com + + ## Backends ## + use_backend netdata_backend if is_example_host + # Other requests go here (optional) + default_backend www_backend +``` + +In the cert list file place a mapping from a certificate file to the domain used: + +`/etc/letsencrypt/certslist.txt`: + +``` +example.com /etc/letsencrypt/live/example.com/example.com.pem +``` + +The file `/etc/letsencrypt/live/example.com/example.com.pem` should contain the key and certificate (in that order) concatenated into a `.pem` file.: + +``` +$ cat /etc/letsencrypt/live/example.com/fullchain.pem \ + /etc/letsencrypt/live/example.com/privkey.pem > \ + /etc/letsencrypt/live/example.com/example.com.pem +``` + +### Backend + +Same as simple, except set protocol `https`. + +``` +backend netdata_backend + option forwardfor + server netdata_local 127.0.0.1:19999 + + http-request add-header X-Forwarded-Proto https + http-request set-header Host %[src] + http-request set-header X-Forwarded-For %[src] + http-request set-header X-Forwarded-Port %[dst_port] + http-request set-header Connection "keep-alive" +``` + +## Enable authentication + +To use basic HTTP Authentication, create a authentication list: + +``` +# HTTP Auth +userlist basic-auth-list + group is-admin + # Plaintext password + user admin password passwordhere groups is-admin +``` + +You can create a hashed password using the `mkpassword` utility. + +``` +$ printf "passwordhere" | mkpasswd --stdin --method=sha-256 +$5$l7Gk0VPIpKO$f5iEcxvjfdF11khw.utzSKqP7W.0oq8wX9nJwPLwzy1 +``` + +Replace `passwordhere` with hash: + +``` +user admin password $5$l7Gk0VPIpKO$f5iEcxvjfdF11khw.utzSKqP7W.0oq8wX9nJwPLwzy1 groups is-admin +``` + +Now add at the top of the backend: + +``` +acl devops-auth http_auth_group(basic-auth-list) is-admin +http-request auth realm netdata_local unless devops-auth +``` + +## Full Example + +Full example configuration with HTTP auth over TLS with subpath: + +``` +global + maxconn 20000 + + log /dev/log local0 + log /dev/log local1 notice + user haproxy + group haproxy + pidfile /run/haproxy.pid + + stats socket /run/haproxy/admin.sock mode 660 level admin expose-fd listeners + stats timeout 30s + daemon + + tune.ssl.default-dh-param 4096 # Max size of DHE key + + # Default ciphers to use on SSL-enabled listening sockets. + ssl-default-bind-ciphers ECDH+AESGCM:DH+AESGCM:ECDH+AES256:DH+AES256:ECDH+AES128:DH+AES:RSA+AESGCM:RSA+AES:!aNULL:!MD5:!DSS + ssl-default-bind-options no-sslv3 + +defaults + log global + mode http + option httplog + option dontlognull + timeout connect 5000 + timeout client 50000 + timeout server 50000 + errorfile 400 /etc/haproxy/errors/400.http + errorfile 403 /etc/haproxy/errors/403.http + errorfile 408 /etc/haproxy/errors/408.http + errorfile 500 /etc/haproxy/errors/500.http + errorfile 502 /etc/haproxy/errors/502.http + errorfile 503 /etc/haproxy/errors/503.http + errorfile 504 /etc/haproxy/errors/504.http + +frontend https_frontend + ## HTTP ## + bind :::80 v4v6 + # Redirect all HTTP traffic to HTTPS with 301 redirect + redirect scheme https code 301 if !{ ssl_fc } + + ## HTTPS ## + # Bind to all v4/v6 addresses, use a list of certs in file + bind :::443 v4v6 ssl crt-list /etc/letsencrypt/certslist.txt + + ## ACL ## + # Optionally check host for Netdata + acl is_example_host hdr_sub(host) -i example.com + acl is_netdata url_beg /netdata + + http-request redirect scheme https drop-query append-slash if is_netdata ! { path_beg /netdata/ } + + ## Backends ## + use_backend netdata_backend if is_example_host is_netdata + default_backend www_backend + +# HTTP Auth +userlist basic-auth-list + group is-admin + # Hashed password + user admin password $5$l7Gk0VPIpKO$f5iEcxvjfdF11khw.utzSKqP7W.0oq8wX9nJwPLwzy1 groups is-admin + +## Default server(s) (optional)## +backend www_backend + mode http + balance roundrobin + timeout connect 5s + timeout server 30s + timeout queue 30s + + http-request add-header 'X-Forwarded-Proto: https' + server other_server 111.111.111.111:80 check + +backend netdata_backend + acl devops-auth http_auth_group(basic-auth-list) is-admin + http-request auth realm netdata_local unless devops-auth + + option forwardfor + server netdata_local 127.0.0.1:19999 + + http-request set-path %[path,regsub(^/netdata/,/)] + + http-request add-header X-Forwarded-Proto https + http-request set-header Host %[src] + http-request set-header X-Forwarded-For %[src] + http-request set-header X-Forwarded-Port %[dst_port] + http-request set-header Connection "keep-alive" +``` + +[]() diff --git a/docs/Running-behind-nginx.md b/docs/Running-behind-nginx.md index b38d27fa..81ebc1a7 100644 --- a/docs/Running-behind-nginx.md +++ b/docs/Running-behind-nginx.md @@ -1,9 +1,43 @@ -# Netdata via nginx +# Running Netdata behind Nginx -To pass Netdata via a nginx, use this: +## Intro + +[Nginx](https://nginx.org/en/) is an HTTP and reverse proxy server, a mail proxy server, and a generic TCP/UDP proxy server used to host websites and applications of all sizes. + +The software is known for its low impact on memory resources, high scalability, and its modular, event-driven architecture which can offer secure, predictable performance. + +## Why Nginx + +- By default, Nginx is fast and lightweight out of the box. + +- Nginx is used and useful in cases when you want to access different instances of Netdata from a single server. + +- Password-protect access to Netdata, until distributed authentication is implemented via the Netdata cloud Sign In mechanism. + +- A proxy was necessary to encrypt the communication to netdata, until v1.16.0, which provided TLS (HTTPS) support. + +## Nginx configuration file + +All Nginx configurations can be found in the `/etc/nginx/` directory. The main configuration file is `/etc/nginx/nginx.conf`. Website or app-specific configurations can be found in the `/etc/nginx/site-available/` directory. + +Configuration options in Nginx are known as directives. Directives are organized into groups known as blocks or contexts. The two terms can be used interchangeably. + +Depending on your installation source, you’ll find an example configuration file at `/etc/nginx/conf.d/default.conf` or `etc/nginx/sites-enabled/default`, in some cases you may have to manually create the `sites-available` and `sites-enabled` directories. + +You can edit the Nginx configuration file with Nano, Vim or any other text editors you are comfortable with. + +After making changes to the configuration files: + +- Test Nginx configuration with `nginx -t`. + +- Restart Nginx to effect the change with `/etc/init.d/nginx restart` or `service nginx restart`. + +## Ways to access Netdata via Nginx ### As a virtual host +With this method instead of `SERVER_IP_ADDRESS:19999`, the Netdata dashboard can be accessed via a human-readable URL such as `netdata.example.com` used in the configuration below. + ``` upstream backend { # the Netdata server @@ -30,9 +64,11 @@ server { } } ``` - ### As a subfolder to an existing virtual host +This method is recommended when Netdata is to be served from a subfolder (or directory). +In this case, the virtual host `netdata.example.com` already exists and Netdata has to be accessed via `netdata.example.com/netdata/`. + ``` upstream netdata { server 127.0.0.1:19999; @@ -69,7 +105,9 @@ server { } ``` -### As a subfolder for multiple Netdata servers, via one nginx +### As a subfolder for multiple Netdata servers, via one Nginx + +This is the recommended configuration when one Nginx will be used to manage multiple Netdata servers via subfolders. ``` upstream backend-server1 { @@ -114,34 +152,33 @@ Of course you can add as many backend servers as you like. Using the above, you access Netdata on the backend servers, like this: -- `http://nginx.server/netdata/server1/` to reach `backend-server1` -- `http://nginx.server/netdata/server2/` to reach `backend-server2` - -### Using TLS communication +- `http://netdata.example.com/netdata/server1/` to reach `backend-server1` +- `http://netdata.example.com/netdata/server2/` to reach `backend-server2` -In case the Netdata web server has been [configured to use TLS](../web/server/#enabling-tls-support), -you must also encrypt the communication between Nginx and Netdata. +### Encrypt the communication between Nginx and Netdata -To enable encryption, first [enable SSL on nginx](http://nginx.org/en/docs/http/configuring_https_servers.html) and then put the following in the location section of the Nginx configuration: +In case Netdata's web server has been [configured to use TLS](../web/server/#enabling-tls-support), it is necessary to specify inside the Nginx configuration that the final destination is using TLS. To do this, please, append the following parameters in your `nginx.conf` ``` proxy_set_header X-Forwarded-Proto https; proxy_pass https://localhost:19999; ``` -If nginx is not configured as described here, you will probably receive the error `SSL_ERROR_RX_RECORD_TOO_LONG`. +Optionally it is also possible to [enable TLS/SSL on Nginx](http://nginx.org/en/docs/http/configuring_https_servers.html), this way the user will encrypt not only the communication between Nginx and Netdata but also between the user and Nginx. + +If Nginx is not configured as described here, you will probably receive the error `SSL_ERROR_RX_RECORD_TOO_LONG`. ### Enable authentication -Create an authentication file to enable the nginx basic authentication. -Do not use authentication without SSL/TLS! -If you haven't one you can do the following: +Create an authentication file to enable basic authentication via Nginx, this secures your Netdata dashboard. + +If you don't have an authentication file, you can use the following command: ``` printf "yourusername:$(openssl passwd -apr1)" > /etc/nginx/passwords ``` -And enable the authentication inside your server directive: +And then enable the authentication inside your server directive: ``` server { @@ -152,9 +189,9 @@ server { } ``` -## limit direct access to Netdata +## Limit direct access to Netdata -If your nginx is on `localhost`, you can use this to protect your Netdata: +If your Nginx is on `localhost`, you can use this to protect your Netdata: ``` [web] @@ -163,7 +200,7 @@ If your nginx is on `localhost`, you can use this to protect your Netdata: --- -You can also use a unix domain socket. This will also provide a faster route between nginx and Netdata: +You can also use a unix domain socket. This will also provide a faster route between Nginx and Netdata: ``` [web] @@ -171,7 +208,7 @@ You can also use a unix domain socket. This will also provide a faster route bet ``` _note: Netdata v1.8+ support unix domain sockets_ -At the nginx side, use something like this to use the same unix domain socket: +At the Nginx side, use something like this to use the same unix domain socket: ``` upstream backend { @@ -182,7 +219,7 @@ upstream backend { --- -If your nginx server is not on localhost, you can set: +If your Nginx server is not on localhost, you can set: ``` [web] @@ -194,9 +231,9 @@ _note: Netdata v1.9+ support `allow connections from`_ `allow connections from` accepts [Netdata simple patterns](../libnetdata/simple_pattern/) to match against the connection IP address. -## prevent the double access.log +## Prevent the double access.log -nginx logs accesses and Netdata logs them too. You can prevent Netdata from generating its access log, by setting this in `/etc/netdata/netdata.conf`: +Nginx logs accesses and Netdata logs them too. You can prevent Netdata from generating its access log, by setting this in `/etc/netdata/netdata.conf`: ``` [global] @@ -205,7 +242,7 @@ nginx logs accesses and Netdata logs them too. You can prevent Netdata from gene ## SELinux -If you get an 502 Bad Gateway error you might check your nginx error log: +If you get an 502 Bad Gateway error you might check your Nginx error log: ```sh # cat /var/log/nginx/error.log: @@ -215,4 +252,4 @@ If you get an 502 Bad Gateway error you might check your nginx error log: If you see something like the above, chances are high that SELinux prevents nginx from connecting to the backend server. To fix that, just use this policy: `setsebool -P httpd_can_network_connect true`. -[]() +[]()
\ No newline at end of file diff --git a/docs/configuration-guide.md b/docs/configuration-guide.md index 2a9539dc..1c79e027 100644 --- a/docs/configuration-guide.md +++ b/docs/configuration-guide.md @@ -59,7 +59,7 @@ Entire plugins can be turned off from the [netdata.conf [plugins]](../daemon/con ##### Show charts with zero metrics -By default, Netdata will enable monitoring metrics for disks, memory, and network only when they are not zero. If they are constantly zero they are ignored. Metrics that will start having values, after netdata is started, will be detected and charts will be automatically added to the dashboard (a refresh of the dashboard is needed for them to appear though). Use `yes` instead of `auto` in plugin configuration sections to enable these charts permanently. +By default, Netdata will enable monitoring metrics for disks, memory, and network only when they are not zero. If they are constantly zero they are ignored. Metrics that will start having values, after netdata is started, will be detected and charts will be automatically added to the dashboard (a refresh of the dashboard is needed for them to appear though). Use `yes` instead of `auto` in plugin configuration sections to enable these charts permanently. You can also set the `enable zero metrics` option to `yes` in the `[global]` section which enables charts with zero metrics for all internal Netdata plugins. ### Modify alarms and notifications diff --git a/docs/generator/buildhtml.sh b/docs/generator/buildhtml.sh index e1c108fb..dbd30391 100755 --- a/docs/generator/buildhtml.sh +++ b/docs/generator/buildhtml.sh @@ -27,10 +27,9 @@ find . -type d \( -path ./${GENERATOR_DIR} -o -path ./node_modules \) -prune -o # Copy Netdata html resources cp -a ./${GENERATOR_DIR}/custom ./${SRC_DIR}/ - # Modify the first line of the main README.md, to enable proper static html generation echo "Modifying README header" -sed -i -e '0,/# Netdata /s//# Introduction\n\n/' ${SRC_DIR}/README.md +sed -i -e '0,/# Netdata /s//# Netdata Documentation\n\n/' ${SRC_DIR}/README.md # Remove all GA tracking code find ${SRC_DIR} -name "*.md" -print0 | xargs -0 sed -i -e 's/\[!\[analytics.*UA-64295674-3)\]()//g' @@ -39,7 +38,6 @@ find ${SRC_DIR} -name "*.md" -print0 | xargs -0 sed -i -e 's/\[!\[analytics.*UA- declare -a EXCLUDE_LIST=( "HISTORICAL_CHANGELOG.md" "contrib/sles11/README.md" - "packaging/maintainers/README.md" ) for f in "${EXCLUDE_LIST[@]}"; do @@ -56,13 +54,12 @@ MKDOCS_CONFIG_FILE="${GENERATOR_DIR}/mkdocs.yml" MKDOCS_DIR="doc" DOCS_DIR=${GENERATOR_DIR}/${MKDOCS_DIR} rm -rf ${DOCS_DIR} -mkdir ${DOCS_DIR} prep_html() { lang="${1}" echo "Creating ${lang} mkdocs.yaml" - if [ "${lang}" = "en" ] ; then + if [ "${lang}" == "en" ] ; then SITE_DIR="build" else SITE_DIR="build/${lang}" @@ -86,16 +83,21 @@ prep_html() { if [ "${lang}" != "en" ] ; then find "${GENERATOR_DIR}/${SITE_DIR}" -name "*.html" -print0 | xargs -0 sed -i -e 's/https:\/\/github.com\/netdata\/netdata\/blob\/master\/\S*md/https:\/\/github.com\/netdata\/localization\//g' fi + + # Replace index.html with DOCUMENTATION/index.html. Since we're moving it up one directory, we need to remove ../ from the links + echo "Replacing index.html with DOCUMENTATION/index.html" + sed 's/\.\.\///g' ${GENERATOR_DIR}/${SITE_DIR}/DOCUMENTATION/index.html > ${GENERATOR_DIR}/${SITE_DIR}/index.html + } for d in "en" $(find ${LOC_DIR} -mindepth 1 -maxdepth 1 -name .git -prune -o -type d -printf '%f ') ; do echo "Preparing source for $d" - cp -a ${SRC_DIR}/* ${DOCS_DIR}/ + cp -r ${SRC_DIR} ${DOCS_DIR} if [ "${d}" != "en" ] ; then cp -a ${LOC_DIR}/${d}/* ${DOCS_DIR}/ fi prep_html $d - rm -rf ${DOCS_DIR}/* + rm -rf ${DOCS_DIR} done # Remove cloned projects and temp directories diff --git a/docs/generator/buildyaml.sh b/docs/generator/buildyaml.sh index e4a5466a..f887c695 100755 --- a/docs/generator/buildyaml.sh +++ b/docs/generator/buildyaml.sh @@ -48,11 +48,12 @@ navpart() { } echo -e 'site_name: Netdata Documentation +site_url: https://docs.netdata.cloud repo_url: https://github.com/netdata/netdata repo_name: GitHub edit_uri: blob/master site_description: Netdata Documentation -copyright: Netdata, 2018 +copyright: Netdata, 2019 docs_dir: '${docs_dir}' site_dir: '${site_dir}' #use_directory_urls: false @@ -67,6 +68,9 @@ extra: link: "https://www.facebook.com/linuxnetdata/" theme: name: "material" + palette: + primary: "blue grey" + accent: "light green" custom_dir: custom/themes/material favicon: custom/img/favicon.ico language: '${language}' @@ -85,7 +89,6 @@ markdown_extensions: - footnotes - tables - admonition - - codehilite - meta - sane_lists - smarty @@ -99,6 +102,9 @@ markdown_extensions: - pymdownx.caret - pymdownx.critic - pymdownx.details + - pymdownx.highlight: + pygments_style: manni + noclasses: true - pymdownx.inlinehilite - pymdownx.magiclink - pymdownx.mark @@ -117,9 +123,12 @@ markdown_extensions: - pymdownx.extrarawhtml nav:' -navpart 1 . README "About" +navpart 1 . "README" "" -echo -ne " - 'docs/Demo-Sites.md' +navpart 1 . . "About Netdata" + +echo -ne " - 'docs/what-is-netdata.md' + - 'docs/Demo-Sites.md' - 'docs/netdata-security.md' - 'docs/anonymous-statistics.md' - 'docs/Donations-netdata-has-received.md' @@ -138,6 +147,7 @@ echo -ne " - 'docs/Demo-Sites.md' - 'packaging/installer/README.md' - 'packaging/docker/README.md' - 'packaging/installer/UPDATE.md' + - 'packaging/DISTRIBUTIONS.md' - 'packaging/installer/UNINSTALL.md' - 'docs/GettingStarted.md' - Running Netdata: @@ -153,6 +163,7 @@ echo -ne " - Running behind another web server: - 'docs/Running-behind-apache.md' - 'docs/Running-behind-lighttpd.md' - 'docs/Running-behind-caddy.md' + - 'docs/Running-behind-haproxy.md' " #navpart 2 system navpart 2 database @@ -253,9 +264,10 @@ navpart 2 web/api/badges "" "" 2 navpart 2 web/api/health "" "" 2 navpart 2 web/api/queries "" "Queries" 2 -echo -ne "- Hacking Netdata: +echo -ne "- Additional Info: - CODE_OF_CONDUCT.md - CONTRIBUTORS.md + - packaging/maintainers/README.md " navpart 2 packaging/makeself "" "" 4 navpart 2 libnetdata "" "libnetdata" 4 diff --git a/docs/generator/checklinks.sh b/docs/generator/checklinks.sh index acc14465..5012ad17 100755 --- a/docs/generator/checklinks.sh +++ b/docs/generator/checklinks.sh @@ -5,6 +5,8 @@ # Validates and tries to fix all links that will cause issues either in the repo, or in the html site GENERATOR_DIR="docs/generator" +MKDOCS_DIR="doc" +DOCS_DIR=${GENERATOR_DIR}/${MKDOCS_DIR} dbg () { if [ "$VERBOSE" -eq 1 ] ; then printf "%s\\n" "${1}" ; fi @@ -186,25 +188,27 @@ ck_netdata_relative () { fi ;; * ) - if [ -f "$fpath/$rlnk" ] ; then - dbg "-- # (path/someotherfile) $rlnk" - if [ "$fpath" = "." ] ; then - s="https://github.com/netdata/netdata/tree/master/$rlnk" - else - s="https://github.com/netdata/netdata/tree/master/$fpath/$rlnk" + if [ -d "$fpath/$rlnk" ] ; then + dbg "-- # (path) -> htmldoc (path/)" + testf "$f" "$fpath/$rlnk/README.md" + if [ $? -eq 0 ] ; then + s="$rlnk/" + if [ "$fname" != "README.md" ] ; then s="../$s"; fi fi else - if [ -d "$fpath/$rlnk" ] ; then - dbg "-- # (path) -> htmldoc (path/)" - testf "$f" "$fpath/$rlnk/README.md" - if [ $? -eq 0 ] ; then - s="$rlnk/" - if [ "$fname" != "README.md" ] ; then s="../$s"; fi + cd - >/dev/null + if [ -f "$fpath/$rlnk" ] ; then + dbg "-- # (path/someotherfile) $rlnk" + if [ "$fpath" = "." ] ; then + s="https://github.com/netdata/netdata/tree/master/$rlnk" + else + s="https://github.com/netdata/netdata/tree/master/$fpath/$rlnk" fi else echo "-- ERROR: $f - $rlnk is neither a file or a directory. Giving up!" EXITCODE=1 fi + cd $DOCS_DIR >/dev/null fi ;; esac @@ -212,7 +216,7 @@ ck_netdata_relative () { if [[ ! -z $s ]] ; then srch=$(echo "$rlnk" | sed 's/\//\\\//g') rplc=$(echo "$s" | sed 's/\//\\\//g') - fix "sed -i 's/($srch)/($rplc)/g' $GENERATOR_DIR/doc/$f" + fix "sed -i 's/($srch)/($rplc)/g' $f" fi } @@ -314,9 +318,11 @@ if [ -z "${file}" ] ; then printhelp exit 1 fi + cd ${DOCS_DIR} for f in $(find . -type d \( -path ./${GENERATOR_DIR} -o -path ./node_modules \) -prune -o -name "*.md" -print); do checklinks "$f" done + cd - else if [ $RECURSIVE -eq 1 ] ; then printhelp diff --git a/docs/generator/custom/css/netdata.css b/docs/generator/custom/css/netdata.css index d9003be1..27f1b08c 100644 --- a/docs/generator/custom/css/netdata.css +++ b/docs/generator/custom/css/netdata.css @@ -5,3 +5,71 @@ .md-typeset { font-size: .75rem } + +/* Underline text */ + +.md-typeset a:not(.nav-button):not(.md-icon):not(.headerlink) { + border-bottom: 1px solid #272b30; +} + +/* Custom styling for the new documentation homepage. + In particular, the three buttons for install/getting started/configuration. */ + +.homepage-nav { + display: flex; + margin-top: 1.4rem; +} + +.homepage-nav div { + flex: 1; +} + +.homepage-nav .nav-install { + margin-right: 1rem; +} + +.homepage-nav .nav-configuration { + margin-left: 1rem; +} + +.nav-button { + border: 2px solid black; + border-radius: 4px; + display: block; + font-weight: 700; + margin: 0 auto; + padding: 0.6rem 0; + text-align: center; +} + +/* Hide the label at the top of the navigation menu. Does nothing. + Well, it does do something on mobile, and this media query makes + sure it's hidden only on screens wide enough to not use the mobile sidebar. */ +@media only screen and (min-width:76.25em) { + .md-nav--primary .md-nav__title { + display: none; + } +} + +/* Change the language selector dropdown to match new color. */ +.md-header-nav select#sel { + background-color: rgba(0,0,0,.26) !important; + padding: 3px; + margin-left: 5px; + margin-right: 20px; +} + +/* Add some whitespace to the bottom of each doc. */ +.md-content { + margin-bottom: 6rem; +} + +/* Make sure inline code in tables doesn't break. */ +.md-typeset__table code { + word-break: normal; +} + +/* Bold the first item on the docs sidebar: Netdata Documentation */ +.md-nav--primary > .md-nav__list > .md-nav__item:first-of-type { + font-weight: 700; +}
\ No newline at end of file diff --git a/docs/netdata-security.md b/docs/netdata-security.md index 955abebd..a905717d 100644 --- a/docs/netdata-security.md +++ b/docs/netdata-security.md @@ -89,7 +89,7 @@ In Netdata v1.9+ there is also access list support, like this: #### Use an authenticating web server in proxy mode -Use one web server to provide authentication in front of **all your Netdata servers**. So, you will be accessing all your Netdata with URLs like `http://{HOST}/netdata/{NETDATA_HOSTNAME}/` and authentication will be shared among all of them (you will sign-in once for all your servers). Instructions are provided on how to set the proxy configuration to have Netdata run behind [nginx](Running-behind-nginx.md#netdata-via-nginx), [Apache](Running-behind-apache.md), [lighthttpd](Running-behind-lighttpd.md#netdata-via-lighttpd-v14x) and [Caddy](Running-behind-caddy.md#netdata-via-caddy). +Use one web server to provide authentication in front of **all your Netdata servers**. So, you will be accessing all your Netdata with URLs like `http://{HOST}/netdata/{NETDATA_HOSTNAME}/` and authentication will be shared among all of them (you will sign-in once for all your servers). Instructions are provided on how to set the proxy configuration to have Netdata run behind [nginx](Running-behind-nginx.md), [Apache](Running-behind-apache.md), [lighthttpd](Running-behind-lighttpd.md#netdata-via-lighttpd-v14x) and [Caddy](Running-behind-caddy.md#netdata-via-caddy). To use this method, you should firewall protect all your Netdata servers, so that only the web server IP will allowed to directly access Netdata. To do this, run this on each of your servers (or use your firewall manager): diff --git a/docs/what-is-netdata.md b/docs/what-is-netdata.md new file mode 100644 index 00000000..6664897d --- /dev/null +++ b/docs/what-is-netdata.md @@ -0,0 +1,385 @@ +# What is Netdata? + +[](https://travis-ci.com/netdata/netdata) [](https://bestpractices.coreinfrastructure.org/projects/2231) [](https://www.gnu.org/licenses/gpl-3.0) []() + +[](https://codeclimate.com/github/netdata/netdata) [](https://www.codacy.com/app/netdata/netdata?utm_source=github.com&utm_medium=referral&utm_content=netdata/netdata&utm_campaign=Badge_Grade) [](https://lgtm.com/projects/g/netdata/netdata/context:cpp) [](https://lgtm.com/projects/g/netdata/netdata/context:javascript) [](https://lgtm.com/projects/g/netdata/netdata/context:python) + +--- + +**Netdata** is **distributed, real-time, performance and health monitoring for systems and applications**. It is a highly optimized monitoring agent you install on all your systems and containers. + +Netdata provides **unparalleled insights**, **in real-time**, of everything happening on the systems it runs (including web servers, databases, applications), using **highly interactive web dashboards**. It can run autonomously, without any third party components, or it can be integrated to existing monitoring tool chains (Prometheus, Graphite, OpenTSDB, Kafka, Grafana, etc). + +_Netdata is **fast** and **efficient**, designed to permanently run on all systems (**physical** & **virtual** servers, **containers**, **IoT** devices), without disrupting their core function._ + +Netdata is **free, open-source software** and it currently runs on **Linux**, **FreeBSD**, and **MacOS**. + +--- + +## How it looks + +The following animated image, shows the top part of a typical Netdata dashboard. + + + +*A typical Netdata dashboard, in 1:1 timing. Charts can be panned by dragging them, zoomed in/out with `SHIFT` + `mouse wheel`, an area can be selected for zoom-in with `SHIFT` + `mouse selection`. Netdata is highly interactive and **real-time**, optimized to get the work done!* + +> *We have a few online demos to experience it live: [https://www.netdata.cloud](https://www.netdata.cloud/#live-demo)* + +## User base + +Netdata is used by hundreds of thousands of users all over the world. +Check our [GitHub watchers list](https://github.com/netdata/netdata/watchers). +You will find people working for **Amazon**, **Atos**, **Baidu**, **Cisco Systems**, **Citrix**, **Deutsche Telekom**, **DigitalOcean**, +**Elastic**, **EPAM Systems**, **Ericsson**, **Google**, **Groupon**, **Hortonworks**, **HP**, **Huawei**, +**IBM**, **Microsoft**, **NewRelic**, **Nvidia**, **Red Hat**, **SAP**, **Selectel**, **TicketMaster**, +**Vimeo**, and many more! + +### Docker pulls +We provide docker images for the most common architectures. These are statistics reported by docker hub: + +[](https://hub.docker.com/r/netdata/netdata/) [](https://hub.docker.com/r/firehol/netdata/) [](https://hub.docker.com/r/titpetric/netdata/) + +### Registry +When you install multiple Netdata, they are integrated into **one distributed application**, via a [Netdata registry](../registry/#registry). This is a web browser feature and it allows us to count the number of unique users and unique Netdata servers installed. The following information comes from the global public Netdata registry we run: + +[](https://registry.my-netdata.io/#menu_netdata_submenu_registry) [](https://registry.my-netdata.io/#menu_netdata_submenu_registry) [](https://registry.my-netdata.io/#menu_netdata_submenu_registry) + +*in the last 24 hours:*<br/> [](https://registry.my-netdata.io/#menu_netdata_submenu_registry) [](https://registry.my-netdata.io/#menu_netdata_submenu_registry) [](https://registry.my-netdata.io/#menu_netdata_submenu_registry) + +## Why Netdata + +Netdata has a quite different approach to monitoring. + +Netdata is a monitoring agent you install on all your systems. It is: + +- a **metrics collector** - for system and application metrics (including web servers, databases, containers, etc) +- a **time-series database** - all stored in memory (does not touch the disks while it runs) +- a **metrics visualizer** - super fast, interactive, modern, optimized for anomaly detection +- an **alarms notification engine** - an advanced watchdog for detecting performance and availability issues + +All the above, are packaged together in a very flexible, extremely modular, distributed application. + +This is how Netdata compares to other monitoring solutions: + +Netdata|others (open-source and commercial) +:---:|:---: +**High resolution metrics** (1s granularity)|Low resolution metrics (10s granularity at best) +Monitors everything, **thousands of metrics per node**|Monitor just a few metrics +UI is super fast, optimized for **anomaly detection**|UI is good for just an abstract view +**Meaningful presentation**, to help you understand the metrics|You have to know the metrics before you start +Install and get results **immediately**|Long preparation is required to get any useful results +Use it for **troubleshooting** performance problems|Use them to get *statistics of past performance* +**Kills the console** for tracing performance issues|The console is always required for troubleshooting +Requires **zero dedicated resources**|Require large dedicated resources + +Netdata is **open-source**, **free**, super **fast**, very **easy**, completely **open**, extremely **efficient**, +**flexible** and integrate-able. + +It has been designed by **SysAdmins**, **DevOps** and **Developers** for troubleshooting performance problems, +not just visualize metrics. + +## How it works + +Netdata is a highly efficient, highly modular, metrics management engine. Its lockless design makes it ideal for concurrent operations on the metrics. + +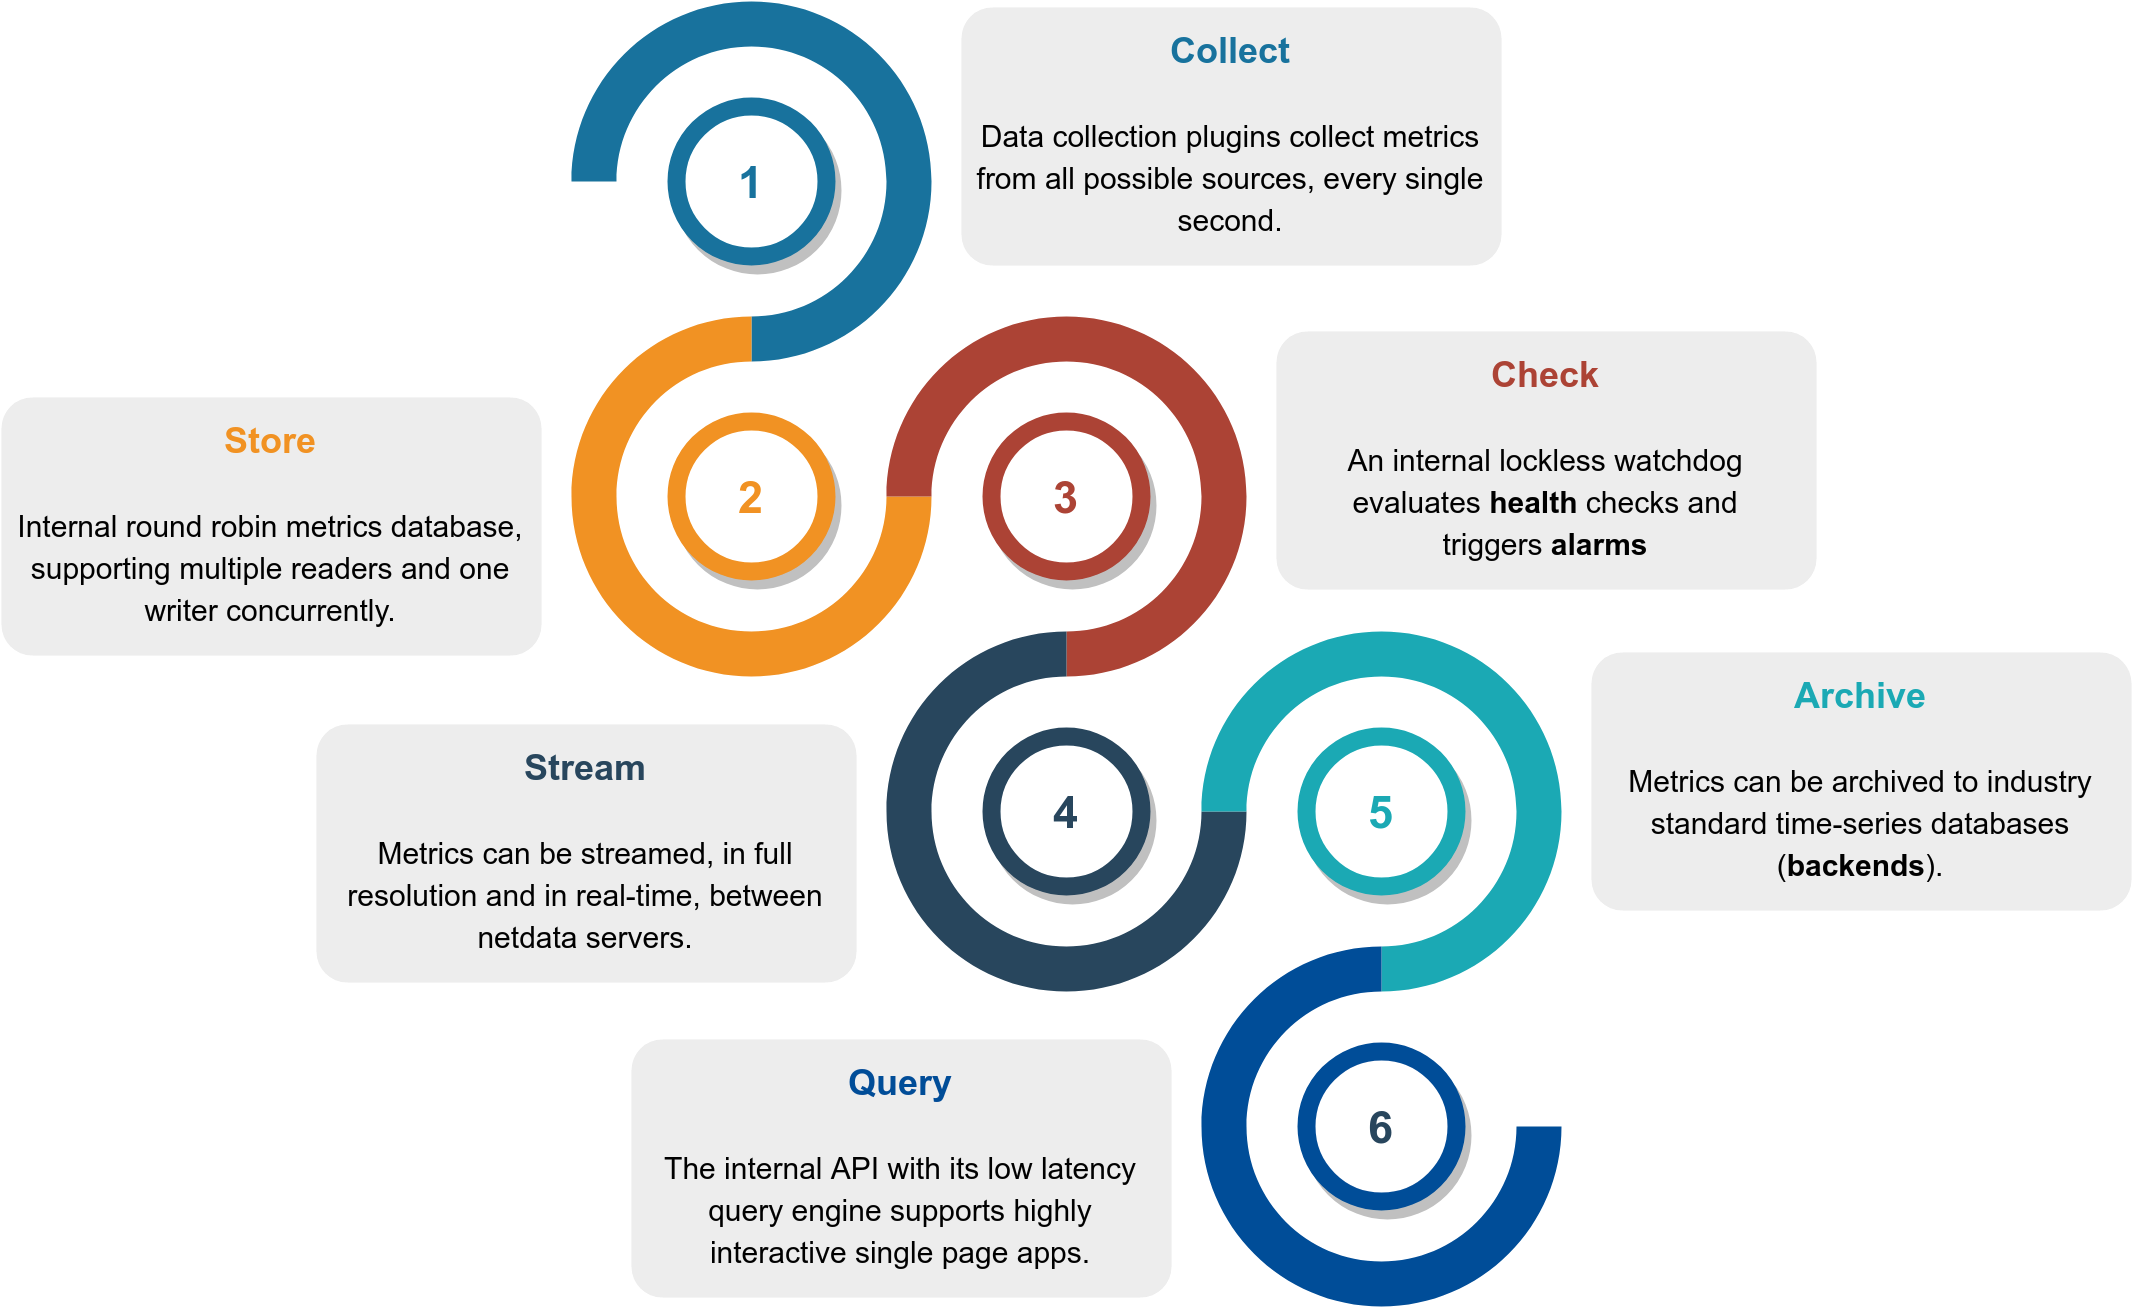 + +This is how it works: + +Function|Description|Documentation +:---:|:---|:---: +**Collect**|Multiple independent data collection workers are collecting metrics from their sources using the optimal protocol for each application and push the metrics to the database. Each data collection worker has lockless write access to the metrics it collects.|[`collectors`](../collectors/#data-collection-plugins) +**Store**|Metrics are stored in RAM in a round robin database (ring buffer), using a custom made floating point number for minimal footprint.|[`database`](../database/#database) +**Check**|A lockless independent watchdog is evaluating **health checks** on the collected metrics, triggers alarms, maintains a health transaction log and dispatches alarm notifications.|[`health`](../health/#health-monitoring) +**Stream**|An lockless independent worker is streaming metrics, in full detail and in real-time, to remote Netdata servers, as soon as they are collected.|[`streaming`](../streaming/#streaming-and-replication) +**Archive**|A lockless independent worker is down-sampling the metrics and pushes them to **backend** time-series databases.|[`backends`](../backends/) +**Query**|Multiple independent workers are attached to the [internal web server](../web/server/#web-server), servicing API requests, including [data queries](../web/api/queries/#database-queries).|[`web/api`](../web/api/#api) + +The result is a highly efficient, low latency system, supporting multiple readers and one writer on each metric. + +## Infographic + +This is a high level overview of Netdata feature set and architecture. +Click it to to interact with it (it has direct links to documentation). + +[](https://my-netdata.io/infographic.html) + + +## Features + + + +This is what you should expect from Netdata: + +### General +- **1s granularity** - the highest possible resolution for all metrics. +- **Unlimited metrics** - collects all the available metrics, the more the better. +- **1% CPU utilization of a single core** - it is super fast, unbelievably optimized. +- **A few MB of RAM** - by default it uses 25MB RAM. [You size it](../database). +- **Zero disk I/O** - while it runs, it does not load or save anything (except `error` and `access` logs). +- **Zero configuration** - auto-detects everything, it can collect up to 10000 metrics per server out of the box. +- **Zero maintenance** - You just run it, it does the rest. +- **Zero dependencies** - it is even its own web server, for its static web files and its web API (though its plugins may require additional libraries, depending on the applications monitored). +- **Scales to infinity** - you can install it on all your servers, containers, VMs and IoTs. Metrics are not centralized by default, so there is no limit. +- **Several operating modes** - Autonomous host monitoring (the default), headless data collector, forwarding proxy, store and forward proxy, central multi-host monitoring, in all possible configurations. Each node may have different metrics retention policy and run with or without health monitoring. + +### Health Monitoring & Alarms +- **Sophisticated alerting** - comes with hundreds of alarms, **out of the box**! Supports dynamic thresholds, hysteresis, alarm templates, multiple role-based notification methods. +- **Notifications**: [alerta.io](../health/notifications/alerta/), [amazon sns](../health/notifications/awssns/), [discordapp.com](../health/notifications/discord/), [email](../health/notifications/email/), [flock.com](../health/notifications/flock/), [irc](../health/notifications/irc/), [kavenegar.com](../health/notifications/kavenegar/), [messagebird.com](../health/notifications/messagebird/), [pagerduty.com](../health/notifications/pagerduty/), [prowl](../health/notifications/prowl/), [pushbullet.com](../health/notifications/pushbullet/), [pushover.net](../health/notifications/pushover/), [rocket.chat](../health/notifications/rocketchat/), [slack.com](../health/notifications/slack/), [smstools3](../health/notifications/smstools3/), [syslog](../health/notifications/syslog/), [telegram.org](../health/notifications/telegram/), [twilio.com](../health/notifications/twilio/), [web](../health/notifications/web/) and [custom notifications](../health/notifications/custom/). + +### Integrations +- **time-series dbs** - can archive its metrics to **Graphite**, **OpenTSDB**, **Prometheus**, **AWS Kinesis**, **JSON document DBs**, in the same or lower resolution (lower: to prevent it from congesting these servers due to the amount of data collected). Netdata also supports **Prometheus remote write API** which allows storing metrics to **Elasticsearch**, **Gnocchi**, **InfluxDB**, **Kafka**, **PostgreSQL/TimescaleDB**, **Splunk**, **VictoriaMetrics** and a lot of other [storage providers](https://prometheus.io/docs/operating/integrations/#remote-endpoints-and-storage). + +## Visualization + +- **Stunning interactive dashboards** - mouse, touchpad and touch-screen friendly in 2 themes: `slate` (dark) and `white`. +- **Amazingly fast visualization** - responds to all queries in less than 1 ms per metric, even on low-end hardware. +- **Visual anomaly detection** - the dashboards are optimized for detecting anomalies visually. +- **Embeddable** - its charts can be embedded on your web pages, wikis and blogs. You can even use [Atlassian's Confluence as a monitoring dashboard](../web/gui/confluence/). +- **Customizable** - custom dashboards can be built using simple HTML (no javascript necessary). + +### Positive and negative values + +To improve clarity on charts, Netdata dashboards present **positive** values for metrics representing `read`, `input`, `inbound`, `received` and **negative** values for metrics representing `write`, `output`, `outbound`, `sent`. + + + +*Netdata charts showing the bandwidth and packets of a network interface. `received` is positive and `sent` is negative.* + +### Autoscaled y-axis + +Netdata charts automatically zoom vertically, to visualize the variation of each metric within the visible time-frame. + + + +*A zero based `stacked` chart, automatically switches to an auto-scaled `area` chart when a single dimension is selected.* + +### Charts are synchronized + +Charts on Netdata dashboards are synchronized to each other. There is no master chart. Any chart can be panned or zoomed at any time, and all other charts will follow. + + + +*Charts are panned by dragging them with the mouse. Charts can be zoomed in/out with`SHIFT` + `mouse wheel` while the mouse pointer is over a chart.* + +> The visible time-frame (pan and zoom) is propagated from Netdata server to Netdata server, when navigating via the [node menu](../registry#registry). + +### Highlighted time-frame + +To improve visual anomaly detection across charts, the user can highlight a time-frame (by pressing `ALT` + `mouse selection`) on all charts. + + + +*A highlighted time-frame can be given by pressing `ALT` + `mouse selection` on any chart. Netdata will highlight the same range on all charts.* + +> Highlighted ranges are propagated from Netdata server to Netdata server, when navigating via the [node menu](../registry#registry). + + +## What does it monitor + +Netdata data collection is **extensible** - you can monitor anything you can get a metric for. +Its [Plugin API](../collectors/plugins.d/) supports all programing languages (anything can be a Netdata plugin, BASH, python, perl, node.js, java, Go, ruby, etc). + +- For better performance, most system related plugins (cpu, memory, disks, filesystems, networking, etc) have been written in `C`. +- For faster development and easier contributions, most application related plugins (databases, web servers, etc) have been written in `python`. + +#### APM (Application Performance Monitoring) +- **[statsd](../collectors/statsd.plugin/)** - Netdata is a fully featured statsd server. +- **[Go expvar](../collectors/python.d.plugin/go_expvar/)** - collects metrics exposed by applications written in the Go programming language using the expvar package. +- **[Spring Boot](../collectors/python.d.plugin/springboot/)** - monitors running Java Spring Boot applications that expose their metrics with the use of the Spring Boot Actuator included in Spring Boot library. +- **[uWSGI](../collectors/python.d.plugin/uwsgi/)** - collects performance metrics from uWSGI applications. + +#### System Resources +- **[CPU Utilization](../collectors/proc.plugin/)** - total and per core CPU usage. +- **[Interrupts](../collectors/proc.plugin/)** - total and per core CPU interrupts. +- **[SoftIRQs](../collectors/proc.plugin/)** - total and per core SoftIRQs. +- **[SoftNet](../collectors/proc.plugin/)** - total and per core SoftIRQs related to network activity. +- **[CPU Throttling](../collectors/proc.plugin/)** - collects per core CPU throttling. +- **[CPU Frequency](../collectors/proc.plugin/)** - collects the current CPU frequency. +- **[CPU Idle](../collectors/proc.plugin/)** - collects the time spent per processor state. +- **[IdleJitter](../collectors/idlejitter.plugin/)** - measures CPU latency. +- **[Entropy](../collectors/proc.plugin/)** - random numbers pool, using in cryptography. +- **[Interprocess Communication - IPC](../collectors/proc.plugin/)** - such as semaphores and semaphores arrays. + +#### Memory +- **[ram](../collectors/proc.plugin/)** - collects info about RAM usage. +- **[swap](../collectors/proc.plugin/)** - collects info about swap memory usage. +- **[available memory](../collectors/proc.plugin/)** - collects the amount of RAM available for userspace processes. +- **[committed memory](../collectors/proc.plugin/)** - collects the amount of RAM committed to userspace processes. +- **[Page Faults](../collectors/proc.plugin/)** - collects the system page faults (major and minor). +- **[writeback memory](../collectors/proc.plugin/)** - collects the system dirty memory and writeback activity. +- **[huge pages](../collectors/proc.plugin/)** - collects the amount of RAM used for huge pages. +- **[KSM](../collectors/proc.plugin/)** - collects info about Kernel Same Merging (memory dedupper). +- **[Numa](../collectors/proc.plugin/)** - collects Numa info on systems that support it. +- **[slab](../collectors/proc.plugin/)** - collects info about the Linux kernel memory usage. + +#### Disks +- **[block devices](../collectors/proc.plugin/)** - per disk: I/O, operations, backlog, utilization, space, etc. +- **[BCACHE](../collectors/proc.plugin/)** - detailed performance of SSD caching devices. +- **[DiskSpace](../collectors/proc.plugin/)** - monitors disk space usage. +- **[mdstat](../collectors/proc.plugin/)** - software RAID. +- **[hddtemp](../collectors/python.d.plugin/hddtemp/)** - disk temperatures. +- **[smartd](../collectors/python.d.plugin/smartd_log/)** - disk S.M.A.R.T. values. +- **[device mapper](../collectors/proc.plugin/)** - naming disks. +- **[Veritas Volume Manager](../collectors/proc.plugin/)** - naming disks. +- **[megacli](../collectors/python.d.plugin/megacli/)** - adapter, physical drives and battery stats. +- **[adaptec_raid](../collectors/python.d.plugin/adaptec_raid/)** - logical and physical devices health metrics. +- **[ioping](../collectors/ioping.plugin/)** - to measure disk read/write latency. + +#### Filesystems +- **[BTRFS](../collectors/proc.plugin/)** - detailed disk space allocation and usage. +- **[Ceph](../collectors/python.d.plugin/ceph/)** - OSD usage, Pool usage, number of objects, etc. +- **[NFS file servers and clients](../collectors/proc.plugin/)** - NFS v2, v3, v4: I/O, cache, read ahead, RPC calls +- **[Samba](../collectors/python.d.plugin/samba/)** - performance metrics of Samba SMB2 file sharing. +- **[ZFS](../collectors/proc.plugin/)** - detailed performance and resource usage. + +#### Networking +- **[Network Stack](../collectors/proc.plugin/)** - everything about the networking stack (both IPv4 and IPv6 for all protocols: TCP, UDP, SCTP, UDPLite, ICMP, Multicast, Broadcast, etc), and all network interfaces (per interface: bandwidth, packets, errors, drops). +- **[Netfilter](../collectors/proc.plugin/)** - everything about the netfilter connection tracker. +- **[SynProxy](../collectors/proc.plugin/)** - collects performance data about the linux SYNPROXY (DDoS). +- **[NFacct](../collectors/nfacct.plugin/)** - collects accounting data from iptables. +- **[Network QoS](../collectors/tc.plugin/)** - the only tool that visualizes network `tc` classes in real-time +- **[FPing](../collectors/fping.plugin/)** - to measure latency and packet loss between any number of hosts. +- **[ISC dhcpd](../collectors/python.d.plugin/isc_dhcpd/)** - pools utilization, leases, etc. +- **[AP](../collectors/charts.d.plugin/ap/)** - collects Linux access point performance data (`hostapd`). +- **[SNMP](../collectors/node.d.plugin/snmp/)** - SNMP devices can be monitored too (although you will need to configure these). +- **[port_check](../collectors/python.d.plugin/portcheck/)** - checks TCP ports for availability and response time. + +#### Virtual Private Networks +- **[OpenVPN](../collectors/python.d.plugin/ovpn_status_log/)** - collects status per tunnel. +- **[LibreSwan](../collectors/charts.d.plugin/libreswan/)** - collects metrics per IPSEC tunnel. +- **[Tor](../collectors/python.d.plugin/tor/)** - collects Tor traffic statistics. + +#### Processes +- **[System Processes](../collectors/proc.plugin/)** - running, blocked, forks, active. +- **[Applications](../collectors/apps.plugin/)** - by grouping the process tree and reporting CPU, memory, disk reads, disk writes, swap, threads, pipes, sockets - per process group. +- **[systemd](../collectors/cgroups.plugin/)** - monitors systemd services using CGROUPS. + +#### Users +- **[Users and User Groups resource usage](../collectors/apps.plugin/)** - by summarizing the process tree per user and group, reporting: CPU, memory, disk reads, disk writes, swap, threads, pipes, sockets +- **[logind](../collectors/python.d.plugin/logind/)** - collects sessions, users and seats connected. + +#### Containers and VMs +- **[Containers](../collectors/cgroups.plugin/)** - collects resource usage for all kinds of containers, using CGROUPS (systemd-nspawn, lxc, lxd, docker, kubernetes, etc). +- **[libvirt VMs](../collectors/cgroups.plugin/)** - collects resource usage for all kinds of VMs, using CGROUPS. +- **[dockerd](../collectors/python.d.plugin/dockerd/)** - collects docker health metrics. + +#### Web Servers +- **[Apache and lighttpd](../collectors/python.d.plugin/apache/)** - `mod-status` (v2.2, v2.4) and cache log statistics, for multiple servers. +- **[IPFS](../collectors/python.d.plugin/ipfs/)** - bandwidth, peers. +- **[LiteSpeed](../collectors/python.d.plugin/litespeed/)** - reads the litespeed rtreport files to collect metrics. +- **[Nginx](../collectors/python.d.plugin/nginx/)** - `stub-status`, for multiple servers. +- **[Nginx+](../collectors/python.d.plugin/nginx_plus/)** - connects to multiple nginx_plus servers (local or remote) to collect real-time performance metrics. +- **[PHP-FPM](../collectors/python.d.plugin/phpfpm/)** - multiple instances, each reporting connections, requests, performance, etc. +- **[Tomcat](../collectors/python.d.plugin/tomcat/)** - accesses, threads, free memory, volume, etc. +- **[web server `access.log` files](../collectors/python.d.plugin/web_log/)** - extracting in real-time, web server and proxy performance metrics and applying several health checks, etc. +- **[HTTP check](../collectors/python.d.plugin/httpcheck/)** - checks one or more web servers for HTTP status code and returned content. + +#### Proxies, Balancers, Accelerators +- **[HAproxy](../collectors/python.d.plugin/haproxy/)** - bandwidth, sessions, backends, etc. +- **[Squid](../collectors/python.d.plugin/squid/)** - multiple servers, each showing: clients bandwidth and requests, servers bandwidth and requests. +- **[Traefik](../collectors/python.d.plugin/traefik/)** - connects to multiple traefik instances (local or remote) to collect API metrics (response status code, response time, average response time and server uptime). +- **[Varnish](../collectors/python.d.plugin/varnish/)** - threads, sessions, hits, objects, backends, etc. +- **[IPVS](../collectors/proc.plugin/)** - collects metrics from the Linux IPVS load balancer. + +#### Database Servers +- **[CouchDB](../collectors/python.d.plugin/couchdb/)** - reads/writes, request methods, status codes, tasks, replication, per-db, etc. +- **[MemCached](../collectors/python.d.plugin/memcached/)** - multiple servers, each showing: bandwidth, connections, items, etc. +- **[MongoDB](../collectors/python.d.plugin/mongodb/)** - operations, clients, transactions, cursors, connections, asserts, locks, etc. +- **[MySQL and mariadb](../collectors/python.d.plugin/mysql/)** - multiple servers, each showing: bandwidth, queries/s, handlers, locks, issues, tmp operations, connections, binlog metrics, threads, innodb metrics, and more. +- **[PostgreSQL](../collectors/python.d.plugin/postgres/)** - multiple servers, each showing: per database statistics (connections, tuples read - written - returned, transactions, locks), backend processes, indexes, tables, write ahead, background writer and more. +- **[Proxy SQL](../collectors/python.d.plugin/proxysql/)** - collects Proxy SQL backend and frontend performance metrics. +- **[Redis](../collectors/python.d.plugin/redis/)** - multiple servers, each showing: operations, hit rate, memory, keys, clients, slaves. +- **[RethinkDB](../collectors/python.d.plugin/rethinkdbs/)** - connects to multiple rethinkdb servers (local or remote) to collect real-time metrics. + +#### Message Brokers +- **[beanstalkd](../collectors/python.d.plugin/beanstalk/)** - global and per tube monitoring. +- **[RabbitMQ](../collectors/python.d.plugin/rabbitmq/)** - performance and health metrics. + +#### Search and Indexing +- **[ElasticSearch](../collectors/python.d.plugin/elasticsearch/)** - search and index performance, latency, timings, cluster statistics, threads statistics, etc. + +#### DNS Servers +- **[bind_rndc](../collectors/python.d.plugin/bind_rndc/)** - parses `named.stats` dump file to collect real-time performance metrics. All versions of bind after 9.6 are supported. +- **[dnsdist](../collectors/python.d.plugin/dnsdist/)** - performance and health metrics. +- **[ISC Bind (named)](../collectors/node.d.plugin/named/)** - multiple servers, each showing: clients, requests, queries, updates, failures and several per view metrics. All versions of bind after 9.9.10 are supported. +- **[NSD](../collectors/python.d.plugin/nsd/)** - queries, zones, protocols, query types, transfers, etc. +- **[PowerDNS](../collectors/python.d.plugin/powerdns/)** - queries, answers, cache, latency, etc. +- **[unbound](../collectors/python.d.plugin/unbound/)** - performance and resource usage metrics. +- **[dns_query_time](../collectors/python.d.plugin/dns_query_time/)** - DNS query time statistics. + +#### Time Servers +- **[chrony](../collectors/python.d.plugin/chrony/)** - uses the `chronyc` command to collect chrony statistics (Frequency, Last offset, RMS offset, Residual freq, Root delay, Root dispersion, Skew, System time). +- **[ntpd](../collectors/python.d.plugin/ntpd/)** - connects to multiple ntpd servers (local or remote) to provide statistics of system variables and optional also peer variables. + +#### Mail Servers +- **[Dovecot](../collectors/python.d.plugin/dovecot/)** - POP3/IMAP servers. +- **[Exim](../collectors/python.d.plugin/exim/)** - message queue (emails queued). +- **[Postfix](../collectors/python.d.plugin/postfix/)** - message queue (entries, size). + +#### Hardware Sensors +- **[IPMI](../collectors/freeipmi.plugin/)** - enterprise hardware sensors and events. +- **[lm-sensors](../collectors/python.d.plugin/sensors/)** - temperature, voltage, fans, power, humidity, etc. +- **[Nvidia](../collectors/python.d.plugin/nvidia_smi/)** - collects information for Nvidia GPUs. +- **[RPi](../collectors/charts.d.plugin/sensors/)** - Raspberry Pi temperature sensors. +- **[w1sensor](../collectors/python.d.plugin/w1sensor/)** - collects data from connected 1-Wire sensors. + +#### UPSes +- **[apcupsd](../collectors/charts.d.plugin/apcupsd/)** - load, charge, battery voltage, temperature, utility metrics, output metrics +- **[NUT](../collectors/charts.d.plugin/nut/)** - load, charge, battery voltage, temperature, utility metrics, output metrics +- **[Linux Power Supply](../collectors/proc.plugin/)** - collects metrics reported by power supply drivers on Linux. + +#### Social Sharing Servers +- **[RetroShare](../collectors/python.d.plugin/retroshare/)** - connects to multiple retroshare servers (local or remote) to collect real-time performance metrics. + +#### Security +- **[Fail2Ban](../collectors/python.d.plugin/fail2ban/)** - monitors the fail2ban log file to check all bans for all active jails. + +#### Authentication, Authorization, Accounting (AAA, RADIUS, LDAP) Servers +- **[FreeRadius](../collectors/python.d.plugin/freeradius/)** - uses the `radclient` command to provide freeradius statistics (authentication, accounting, proxy-authentication, proxy-accounting). + +#### Telephony Servers +- **[opensips](../collectors/charts.d.plugin/opensips/)** - connects to an opensips server (localhost only) to collect real-time performance metrics. + +#### Household Appliances +- **[SMA webbox](../collectors/node.d.plugin/sma_webbox/)** - connects to multiple remote SMA webboxes to collect real-time performance metrics of the photovoltaic (solar) power generation. +- **[Fronius](../collectors/node.d.plugin/fronius/)** - connects to multiple remote Fronius Symo servers to collect real-time performance metrics of the photovoltaic (solar) power generation. +- **[StiebelEltron](../collectors/node.d.plugin/stiebeleltron/)** - collects the temperatures and other metrics from your Stiebel Eltron heating system using their Internet Service Gateway (ISG web). + +#### Game Servers +- **[SpigotMC](../collectors/python.d.plugin/spigotmc/)** - monitors Spigot Minecraft server ticks per second and number of online players using the Minecraft remote console. + +#### Distributed Computing +- **[BOINC](../collectors/python.d.plugin/boinc/)** - monitors task states for local and remote BOINC client software using the remote GUI RPC interface. Also provides alarms for a handful of error conditions. + +#### Media Streaming Servers +- **[IceCast](../collectors/python.d.plugin/icecast/)** - collects the number of listeners for active sources. + +### Monitoring Systems +- **[Monit](../collectors/python.d.plugin/monit/)** - collects metrics about monit targets (filesystems, applications, networks). + +#### Provisioning Systems +- **[Puppet](../collectors/python.d.plugin/puppet/)** - connects to multiple Puppet Server and Puppet DB instances (local or remote) to collect real-time status metrics. + +You can easily extend Netdata, by writing plugins that collect data from any source, using any computer language. + +## Community + +We welcome [contributions](../CONTRIBUTING.md). So, feel free to join the team. + +To report bugs, or get help, use [GitHub Issues](https://github.com/netdata/netdata/issues). + +You can also find Netdata on: + +- [Facebook](https://www.facebook.com/linuxnetdata/) +- [Twitter](https://twitter.com/linuxnetdata) +- [OpenHub](https://www.openhub.net/p/netdata) +- [Repology](https://repology.org/metapackage/netdata/versions) +- [StackShare](https://stackshare.io/netdata) + +## License + +Netdata is [GPLv3+](../LICENSE). + +Netdata re-distributes other open-source tools and libraries. Please check the [third party licenses](../REDISTRIBUTED.md).
\ No newline at end of file |