
diff options
| author | Daniel Baumann <daniel.baumann@progress-linux.org> | 2023-07-20 04:50:01 +0000 |
|---|---|---|
| committer | Daniel Baumann <daniel.baumann@progress-linux.org> | 2023-07-20 04:50:01 +0000 |
| commit | cd4377fab21e0f500bef7f06543fa848a039c1e0 (patch) | |
| tree | ba00a55e430c052d6bed0b61c0f8bbe8ebedd313 /docs | |
| parent | Releasing debian version 1.40.1-1. (diff) | |
| download | netdata-cd4377fab21e0f500bef7f06543fa848a039c1e0.tar.xz netdata-cd4377fab21e0f500bef7f06543fa848a039c1e0.zip | |
Merging upstream version 1.41.0.
Signed-off-by: Daniel Baumann <daniel.baumann@progress-linux.org>
Diffstat (limited to 'docs')
20 files changed, 574 insertions, 193 deletions
diff --git a/docs/.templates/integration/schema.json b/docs/.templates/integration/schema.json new file mode 100644 index 00000000..5f2b2a85 --- /dev/null +++ b/docs/.templates/integration/schema.json @@ -0,0 +1,109 @@ +{ + "$schema": "http://json-schema.org/draft-07/schema#", + "type": "object", + "title": "Netdata Integrations file", + "properties": { + "categories": { + "type": "object", + "description": "A list defining all the available categories for the integrations.", + "properties": { + "list": { + "type": "array", + "items": { + "type": "object", + "description": "", + "properties": { + "id": { + "type": "string", + "description": "ID of the category, can be found in integrations/categories.yaml for every category." + }, + "description": { + "type": "string", + "description": "Text that will be presented below the category title, or that will be accompanying the category in the UI in any form." + }, + "priority": { + "type": "integer", + "description": "Priority of the category. A number expressing where the category should be in the menu. Currently, a static number gets assigned to all categories, with a higher priority one for the most-popular flagged categories." + }, + "children": { + "type": "array", + "description": "an array that recursively has the same elements as the parent.", + "items": { + "$ref": "#" + } + } + } + } + } + } + }, + "integrations": { + "type": "array", + "description": "A list of integration elements, combination of metadata.yaml and other sources.", + "items": { + "type": "object", + "properties": { + "id": { + "type": "string", + "description": "A unique string identifier for the integration." + }, + "name": { + "type": "string" + }, + "categories": { + "type": "array", + "description": "an array of categories that the integration belongs to", + "items": { + "type": "object", + "properties": { + "category_id": { + "type": "string", + "description": "The category_ID for this integration. This is the category ID mentioned inside integrations/category.yaml, for the respective category." + }, + "priority": { + "type": "integer", + "description": "Priority for this specific category. Will control where the integration will be positioned in this category" + } + } + } + }, + "icon": { + "type": "string", + "description": "path to the icon for this integration." + }, + "keywords": { + "type": "array", + "description": "An array of terms related to the integration.", + "items": { + "type": "string" + } + }, + "overview": { + "type": "string", + "description": "The text that will go in the top of the page, in markdown format." + }, + "metrics": { + "type": "string", + "description": "Metrics section rendered in markdown format." + }, + "alerts": { + "type": "string", + "description": "Alerts section rendered in markdown format." + }, + "setup": { + "type": "string", + "description": "Setup section rendered in markdown format." + }, + "troubleshooting": { + "type": "string", + "description": "troubleshooting section rendered in markdown format." + }, + "related_resources": { + "type": "string", + "description": "Related Resources section rendered in markdown format." + } + } + } + } + } +}
\ No newline at end of file diff --git a/docs/category-overview-pages/accessing-netdata-dashboards.md b/docs/category-overview-pages/accessing-netdata-dashboards.md index 46c0bcff..024d0bd7 100644 --- a/docs/category-overview-pages/accessing-netdata-dashboards.md +++ b/docs/category-overview-pages/accessing-netdata-dashboards.md @@ -1,3 +1,27 @@ # Accessing Netdata Dashboards -This section contains documentation on how you can access the Netdata Agent's dashboards, and the Netdata Cloud's dashboards.
\ No newline at end of file +This section contains documentation on how you can access the Netdata dashboard, which are the same both for the Agent and Cloud. + +A user accessing the Netdata dashboard **from the Cloud** will always be presented with the latest Netdata dashboard version. + +A user accessing the Netdata dashboard **from the Agent** will, by default, be presented with the latest Netdata dashboard version (the same as Netdata Cloud) except in the following scenarios: +* Agent doesn't have Internet access, and is unable to get the latest Netdata dashboards, as a result it falls back to the Netdata dashboard version that +was shipped with the agent. +* Users have defined, e.g. through URL bookmark, that they wants to see the previous version of the dashboard (accessible `http://NODE:19999/v1`, replacing `NODE` with the IP address or hostname of your Agent). + +## Main sections + +The Netdata dashboard consists of the following main sections: +* [Netdata charts](https://github.com/netdata/netdata/blob/master/docs/cloud/visualize/interact-new-charts.md) +* [Infrastructure Overview](https://github.com/netdata/netdata/blob/master/docs/visualize/overview-infrastructure.md) +* [Nodes view](https://github.com/netdata/netdata/blob/master/docs/cloud/visualize/nodes.md) +* [Custom dashboards](https://learn.netdata.cloud/docs/visualizations/custom-dashboards) +* [Alerts](https://github.com/netdata/netdata/blob/master/docs/monitor/view-active-alarms.md) +* [Anomaly Advisor](https://github.com/netdata/netdata/blob/master/docs/cloud/insights/anomaly-advisor.md) +* [Functions](https://github.com/netdata/netdata/blob/master/docs/cloud/netdata-functions.md) +* [Events feed](https://github.com/netdata/netdata/blob/master/docs/cloud/insights/events-feed.md) + +> ⚠️ Some sections of the dashboard, when accessed through the agent, may require the user to be signed-in to Netdata Cloud or having the Agent claimed to Netdata Cloud for their full functionality. Examples include saving visualization settings on charts or custom dashboards, claiming the node to Netdata Cloud, or executing functions on an Agent. + + +Documentation for previous Agent dashboard can still be found [here](https://github.com/netdata/netdata/blob/master/web/gui/README.md).
\ No newline at end of file diff --git a/docs/category-overview-pages/metrics-streaming-and-replication.md b/docs/category-overview-pages/metrics-streaming-and-replication.md index 37b040e9..f473105f 100644 --- a/docs/category-overview-pages/metrics-streaming-and-replication.md +++ b/docs/category-overview-pages/metrics-streaming-and-replication.md @@ -1,3 +1,175 @@ -# Metrics Streaming and Replication Overview +# Netdata Parents (Streaming and Replication) -This section contains documentation to help you understand and configure streaming and replication with Netdata.
\ No newline at end of file +## What are they and why do we need them? + +A “Parent” is a Netdata Agent, like the ones we install on all our systems, but is configured as a central node that receives, stores and processes metrics data from other Netdata “Child” nodes in our infrastructure. + +Netdata Parents are flexible. You can have one big active-active cluster of Netdata Parents, or you can spread a lot of independent Parents across the infrastructure. + +This “distributed still centralized” setup provides a lot of benefits. Let’s see them: + +## Infrastructure-Level Dashboards: All Nodes in One Dashboard + +A Parent node receives and aggregates metrics data from all child nodes that push metrics to it, presenting all of them on a single, centralized dashboard. + +Metrics streaming between Netdata nodes is real-time and low-latency, so that the Parent can provide the same resolution and detail its children provide. + +Each chart on the Parent’s dashboard is automatically turned into a multi-node chart, allowing instant aggregation of the data across the entire dashboard. This is transparent and automatic for all kinds of charts, even application-specific ones. For example, when you have 2 PostgreSQL servers in your infrastructure, the parent will present one set of charts for PostgreSQL and these charts will include data from both servers. + +## Increased Data Retention: Store More, Learn More + +Netdata’s database (`dbengine`), supports multiple tiers of variable resolution for storing metrics’ samples. Tier 0 is the high-resolution one and usually stores per second data. Tier 1 is the middle resolution one, downsampling data to per minute. Tier 2 is the low-resolution one, downsampling data to per hour. With this setup, a default Netdata setup is usually able to maintain 2-3 days of high resolution and up to a year of low-resolution data, all in less than 1 GB of disk space. + +In many cases, however, organizations require a lot more retention than this. A Netdata Parent can be configured to have weeks or even months of high-resolution data and several years of low-resolution data for all its Child nodes, by allowing the Netdata database to grow to hundreds of GiBs or even several TiBs. + +## Monitoring Ephemeral Nodes: No Node Left Behind + +Production systems are often ephemeral by nature. In containerized and orchestrated environments, like Kubernetes, nodes may come and go due to scaling policies, maintenance tasks, or as part of regular operations. + +Netdata Parents come to the rescue in such scenarios. They can continuously receive metrics from ephemeral nodes during their lifecycle. As these nodes are removed or replaced, the Parent retains their performance history, essentially archiving the life of each node. + +The Netdata dashboards on the Parents automatically bring into the charts data from archived nodes when users pan the dashboard to the time-window these nodes were alive. This means that no data is lost and visibility is maintained across the entire lifespan of every node, regardless of its ephemeral nature. + +## Unified Alerts Management: Silence the Noise + +Each Netdata Agent is able to run health checks, trigger alerts and send notifications on its own. However, in a large-scale infrastructure with numerous nodes, each capable of generating alerts, managing these notifications can quickly become a challenge. Duplicate alerts and non-centralized management can lead to unnecessary noise, causing alert fatigue and possibly overlooking critical warnings. + +Netdata Parents provide a solution to this problem. By configuring a Parent node to handle all alerts and health checks, and disabling health monitoring on the Child nodes, you centralize your alerts management, meaning that all alerts are now generated from a single place, reducing noise and ensuring that each unique issue only triggers a single notification. + +In addition to making alert management more straightforward, this setup also allows for more refined control over your alert configurations. Instead of managing alert settings across multiple nodes, you can handle all configurations in one place, ensuring consistency and ease of management. + +## Offloading Production Systems: Prioritize Performance + +In a production environment, every bit of system resources is crucial. Minimizing the overhead due to monitoring and observability is vital to ensure optimal system performance. Although the Netdata Agent is designed to be lightweight and efficient, using a Netdata Parent can allow the Netdata Agents on your production systems to focus on the absolutely necessary for collecting metrics and pushing them to their Parent. + +On your production systems, by configuring the Netdata Agents to use the `alloc` database mode with 5-10 minutes of retention time and disabling health monitoring and Machine Learning (ML) processing, you significantly reduce the system resources consumed by the monitoring system. + +Netdata, with the `alloc` database mode, doesn't touch the disk at all (apart from logging - which can also be disabled). This approach eliminates any potential disk I/O impact from Netdata on your production applications, which could be particularly beneficial in I/O-sensitive environments. + +## Fault Tolerance and Redundancy: Ensure Continuous Monitoring + +Netdata Agents stream metrics to one Netdata Parent at a time. But more than one Parent can be configured on each child. The first available at any given time is used. + +Similarly, Netdata Parents can be configured to stream/proxy the data they receive to another Netdata Parent. And they can support multiple Parents too, one of which will be used at any given time. + +Configuration allows setting up a circular streaming setup. Parent A streams to Parent B and Parent B streams to Parent A. Child nodes are configured to stream to any of Parents A and B and they will automatically fall back and switch parents as necessary. + +With the replication feature (enabled by default), all nodes replicate missing data on their Parent, before streaming live metrics, filling up any gap the Parent may have. + +The same setup can work for 2 or even more parents, to form an active-active multi-node cluster. Child nodes can connect to any of the parent nodes available and the parent nodes will automatically replicate and stream metrics to each other. + +The setup is optimized even for wide-area connections between child nodes and parents, or for cases where the bandwidth between child nodes and parents has a cost associated with it. At any given time each child node sends its data only once. The parents then replicate and stream this data to each other. + +## Security and Isolation: Protect Your Production Systems + +Parent nodes can be set up in your organization's Demilitarized Zone (DMZ), acting as a protective barrier or application firewall, shielding your production Netdata agents from the outside world. + +With Netdata Parents configured, the Netdata Agents running on your production systems need only one connection to these parents. They don’t need to run data queries, they will never send alert notifications, or even connect to Netdata Cloud. + +Especially for Netdata Cloud, when the Parent node is connected to Netdata Cloud, it registers its Child nodes to it and can serve all functions required by the Cloud on behalf of the Child nodes. So, although only the parent is connected to Netdata Cloud, there is no difference in the user features you enjoy on Netdata Cloud in regard to your production systems. They will all be there. + +## FAQ about Netdata Parents + +### How much can a Parent node scale? + +For about 1 million real-time metrics, with a default configuration: + +- collected and streamed to it per second, +- stored in 3 database tiers (high, mid, low resolution), +- with ML training and anomaly detection running, +- health for alerts and notifications + +And about 2 TiB of storage for metrics, you will need about 5-8 CPU cores and 32GiB of RAM. On such a setup you can have: + +- 15 days of high resolution metrics +- 3 months of mid resolution metrics +- 1 year of low resolution metrics + +For such a setup, we recommend a 16 CPU cores system so that there is spare capacity for queries. More RAM and faster disks will give faster queries. + +So, depending on the number of metrics per node you have and the size of your Parents, you may be able to aggregate 200 to 500 nodes per Parent. + +### If I set up 2 active-active parents, will I be able to have more Child nodes stream to them? + +No. When you set up an active-active cluster, even if child nodes connect randomly to one or the other, all the parent nodes receive all the metrics of all the child nodes. So, all of them do all the work. + +There is a feature we currently work on, to allow Parent nodes to detect that they receive ML information with the streamed metric data (they receive it already but they ignore it), to prevent them from training their own ML models and running anomaly detection again for the child node. But this is not ready yet. + +### How much retention do the child nodes need? + +Child nodes need to have only the retention required in order to connect to another Parent if one fails or stops for maintenance. + +- If you have an active-active cluster of parents, 5 to 10 minutes in `alloc` mode is enough. +- If you have only 1 parent, it would be better to run the child nodes with `dbengine` so that they will have enough retention to backfill the parent nodes if it stops for a few hours for maintenance. + +### Does streaming between child nodes and parents support encryption? + +Yes. You can configure your parent nodes to enable TLS and configure the child nodes to connect with TLS to it. The streaming connection is also compressed with LZ4 and this works even on top of TLS. + +### Can I have an HTTP proxy between parent and child nodes? + +No. The streaming protocol works on the same port as the internal web server of Netdata Agents, but the protocol is not HTTP-friendly and cannot be understood by HTTP proxy servers. + +### Should I load balance the parents with a TCP load balancer? + +Although this can be done and for streaming between child and parent nodes it could work, we recommend not doing it. It can lead to several kinds of problems. + +It is better to configure all the parent nodes directly in the child nodes `stream.conf`. The child nodes will do everything in their power to find a parent node to connect and they will never give up. + +### When I have an active-active cluster of parents, will I receive alert notifications from both of them? + +If both are configured to run health checks and trigger alerts, yes. + +We recommend using Netdata Cloud to avoid receiving duplicate alert notifications. Netdata Cloud deduplicates alert notifications so that you will receive them only once. On top of that, you can control silencing and routing directly from the Netdata Cloud UI. + +### When I have only Parents connected to Netdata Cloud, will I be able to use the Functions feature on my child nodes? + +Yes. + +Functions is a feature of data collection plugins to expose functions that can be run from the dashboard to view more detailed information about a data collection. For example, apps.plugin exposes the processes function that returns a list of all the processes running, together with information about their CPU utilization, memory consumption, disk I/O operations, bandwidth, and a lot more. + +When a parent receives a Function request, it forwards it to the plugin that exposes it. If the plugin is available over a streaming connection, the parent will forward the request to the socket it receives metrics from. This process will be repeated even if many parents are chained in order to reach the child. + +### If I have a set of 2 active-active parents and get one out for maintenance for a few hours, will it have missing data when it returns back online? + +There are 2 reasons you may have gaps in your data after you bring it back online: + +1. Replication does not replicate metrics that are not actively collected. So, when the parent comes back, if there are samples that this parent does not have, for metrics that are not currently being collected, these samples will not be propagated to that parent. [We are working to fix this issue](https://github.com/netdata/netdata/issues/15198). +2. If the parent has been offline for a long time and the child nodes run in db mode `alloc`, you need to plan how you will bring this parent back online. Child nodes in this mode do not have enough retention to backfill the parent and if they connect to it before the other parent, you will end up with missing information on that parent. + +The simplest way to solve this is to block at the firewall all connections to port 19999 from child nodes, but allow connections from the other parent nodes. Once replication finishes for all nodes, you can unblock the connections from child nodes to it. + +### I got a parent out of maintenance but it replicates (backfills) missing data slowly. Can I speed it up? + +Yes, there is a setting on `netdata.conf` under section `[db]` called `replication threads`. The default value is 1. + +Usually, each thread is able to replicate about 2-5 million samples per second. We suggest setting this to 5 threads for all parents. Generally do not use too many threads because you are risking congesting the disks and/or the CPU cores available. Keep in mind that the sending parent needs this setting. + +There is no need to increase this number on child nodes. Each node has one replication sender, so when hundreds of nodes are replicating to a parent, there are already a lot of senders pushing metrics to it. + +### I have multiple active-active parents. Which one is used by Netdata Cloud for queries? + +When you have multiple parents available, the one that is further away from the child node is used by Netdata Cloud, unless it does not have the data required. + +This works like this: The child has `hops = 0`. Each parent receiving metrics for this child increases the `hops` by 1. So the first parent will have `hops = 1`, the second parent will have `hops = 2` and so on. + +Netdata Cloud knows the retention of each parent. So, when it needs data from this child, it first checks the available retention each parent has for it and then it uses the parent with the higher `hops`. If no parent is available and the child node is directly connected to Netdata Cloud, it uses the child. + +### Is there a way to balance child nodes to the parent nodes of an active-active cluster? + +If you have 2 parent nodes A and B, you can configure them on half the child nodes as A, B, and the other half as B, A. The child nodes will connect to the first available (left to right). If both A and B are online, half of the child nodes will connect to A and the other half to B. + +Keep in mind, however, that if you restart a parent, all the child nodes that were connected to it will automatically reconnect to the other parent. Once this happens, the child nodes will stay connected to it. + +### Is there a way to get notified when a child gets disconnected? + +There are 2 kinds of production nodes: +1. **Permanent nodes** + These are nodes that should be available permanently and if they disconnect an alert should be triggered to notify you. + By default, all nodes are considered permanent (not ephemeral). +2. **Ephemeral nodes** + These are nodes that are ephemeral by nature and they may shutdown at any point in time without any impact on the services you run. + +To set the ephemeral flag on a node, edit its `netdata.conf` and in the `[health]` section set is `ephemeral = yes`. This setting is propagated to parent nodes and Netdata Cloud. + +When using Netdata Cloud (via a parent or directly) and a permanent node gets disconnected, Netdata Cloud sends node disconnection notifications. diff --git a/docs/cloud/alerts-notifications/add-rocketchat-notification-configuration.md b/docs/cloud/alerts-notifications/add-rocketchat-notification-configuration.md new file mode 100644 index 00000000..6a81ad1d --- /dev/null +++ b/docs/cloud/alerts-notifications/add-rocketchat-notification-configuration.md @@ -0,0 +1,49 @@ +# Add RocketChat notification configuration + +From the Cloud interface, you can manage your space's notification settings and from these you can add a specific configuration to get notifications delivered on RocketChat. + +## Prerequisites + +To add RocketChat notification configurations you need: + +- A Netdata Cloud account +- Access to the space as an **administrator** +- Space needs to be on **Business** plan or higher +- Have a RocketChat app on your workspace to receive the webhooks, for more details check [how to configure this on RocketChat](#settings-on-rocketchat) + +## Steps + +1. Click on the **Space settings** cog (located above your profile icon) +1. Click on the **Notification** tab +1. Click on the **+ Add configuration** button (near the top-right corner of your screen) +1. On the **RocketChat** card click on **+ Add** +1. A modal will be presented to you to enter the required details to enable the configuration: + 1. **Notification settings** are Netdata specific settings + - Configuration name - you can optionally provide a name for your configuration you can easily refer to it + - Rooms - by specifying a list of Rooms you are select to which nodes or areas of your infrastructure you want to be notified using this configuration + - Notification - you specify which notifications you want to be notified using this configuration: All Alerts and unreachable, All Alerts, Critical only + 1. **Integration configuration** are the specific notification integration required settings, which vary by notification method. For RocketChat: + - Webhook URL - URL provided on RocketChat for the channel you want to receive your notifications. For more details check [how to configure this on RocketChat](#settings-on-rocketchat) + +## Settings on RocketChat + +To enable the webhook integrations on RocketChat you need: +1. In RocketChat, Navigate to Administration > Workspace > Integrations. + +2. Click +New at the top right corner. + +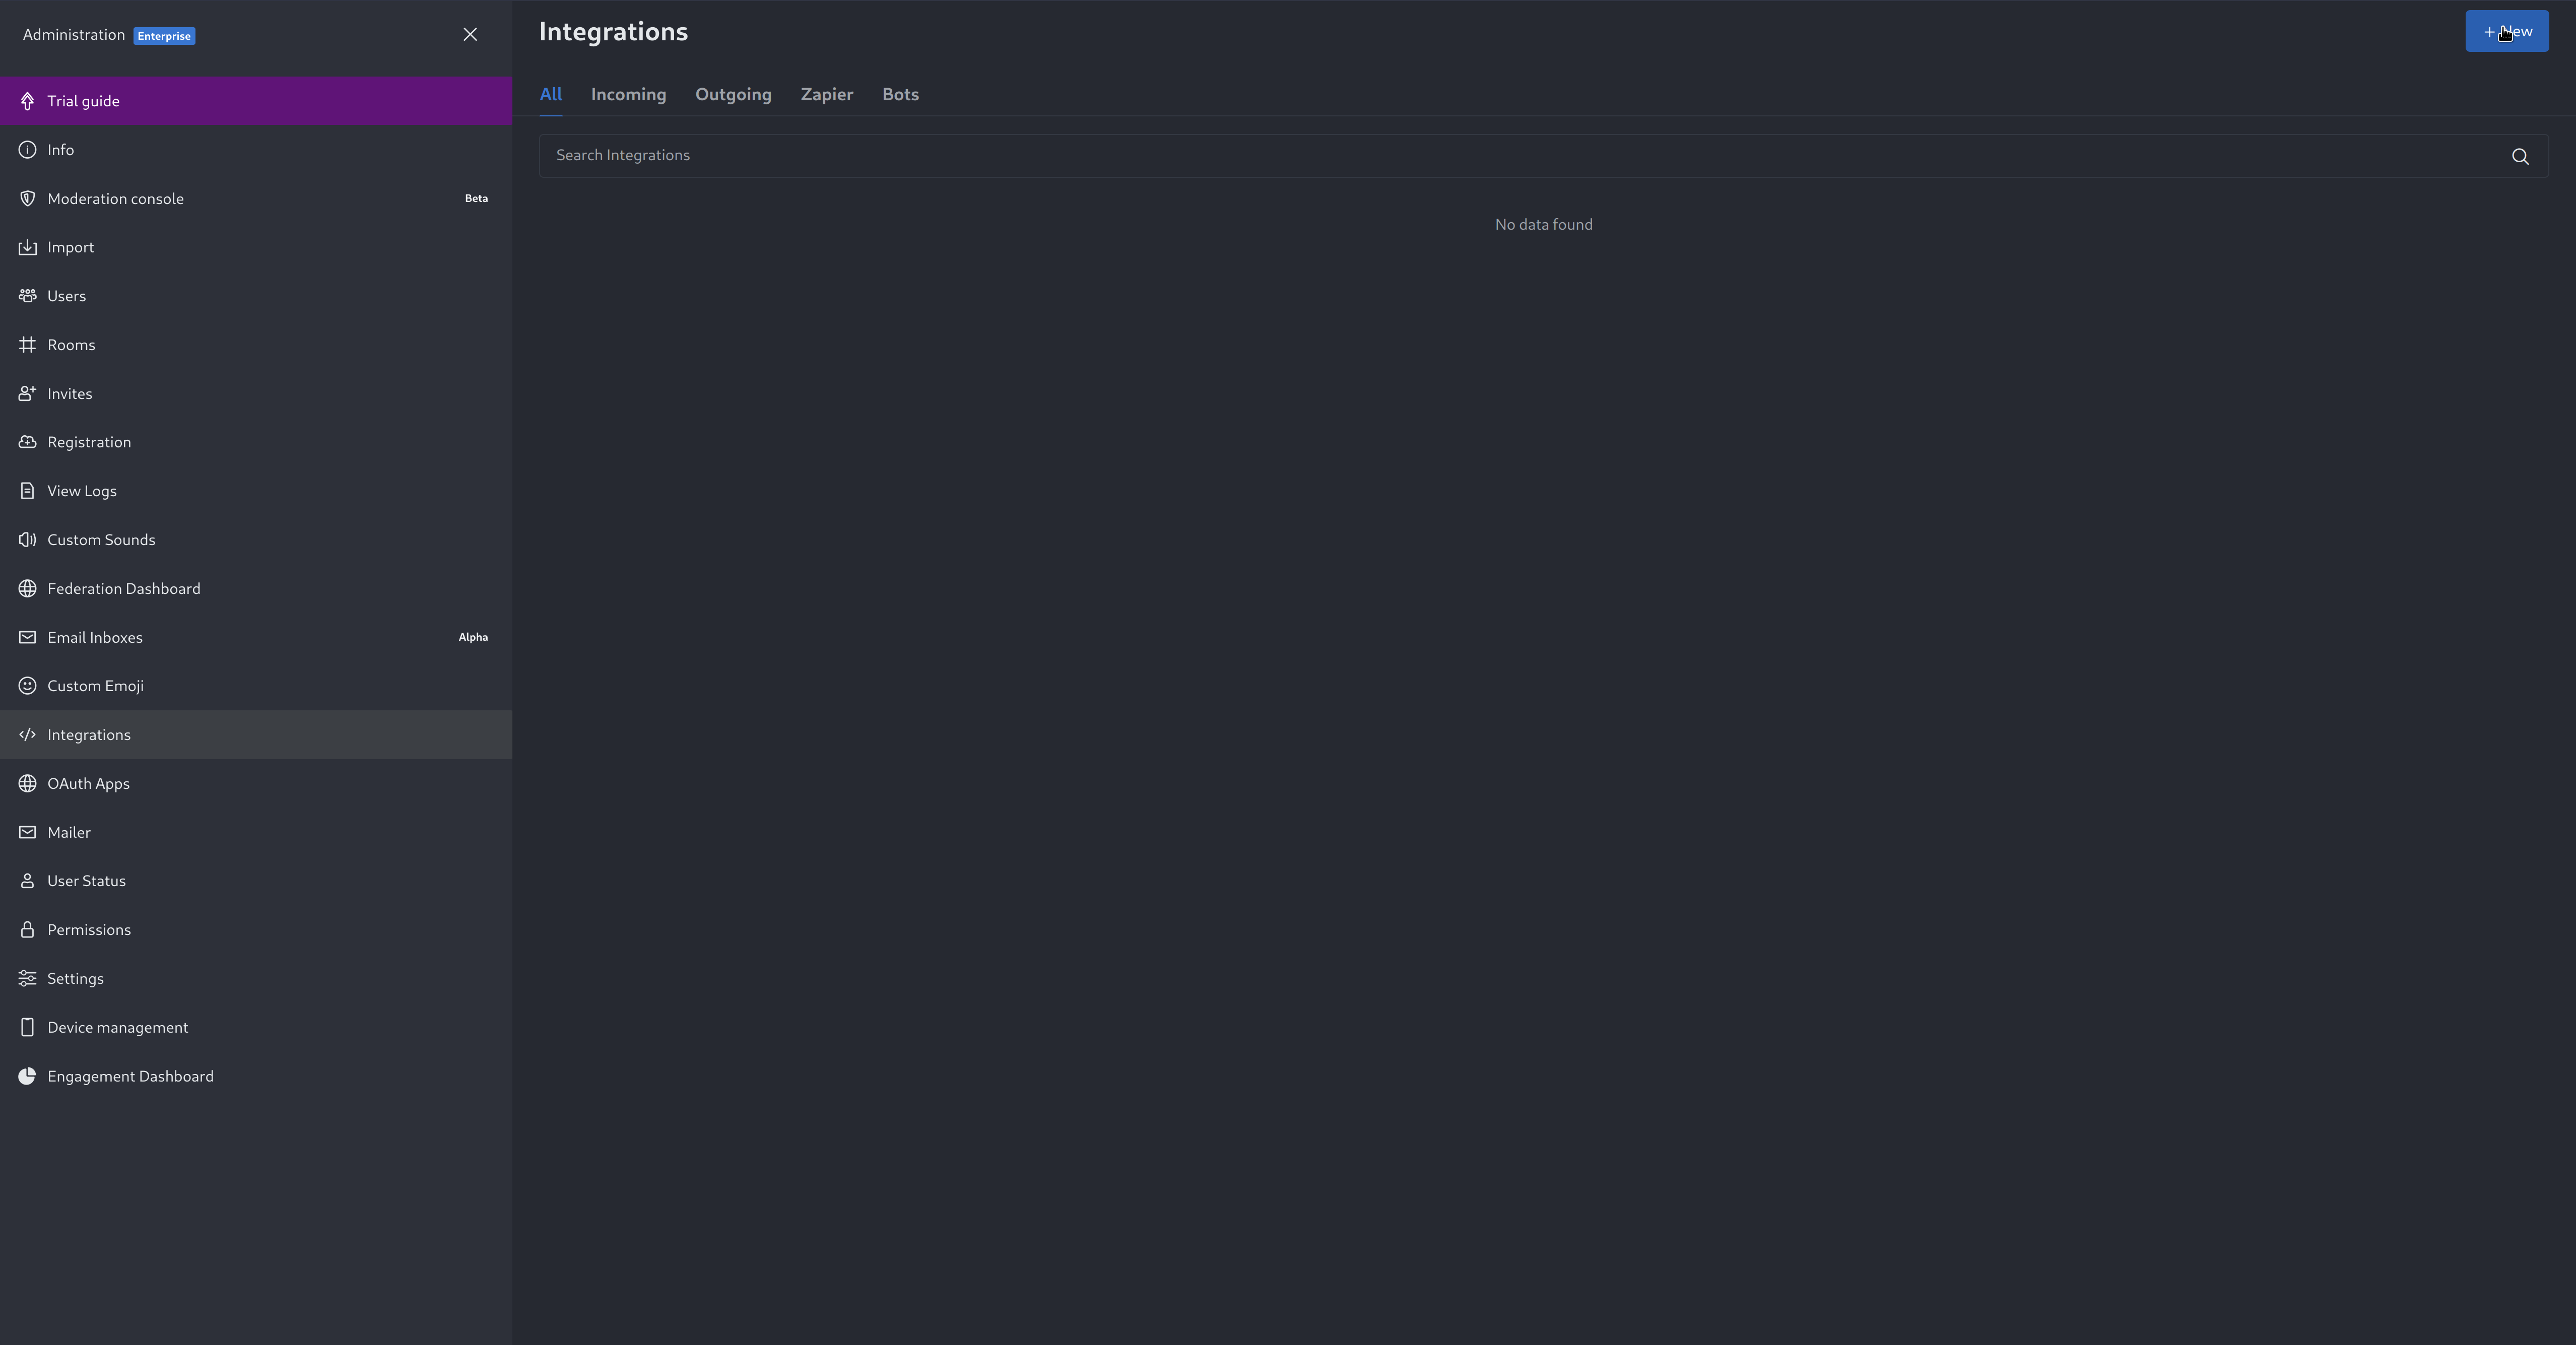 + +3. For more details about each parameter, check [create-a-new-incoming-webhook](https://docs.rocket.chat/use-rocket.chat/workspace-administration/integrations#create-a-new-incoming-webhook). + +4. After configuring integration, click Save. + +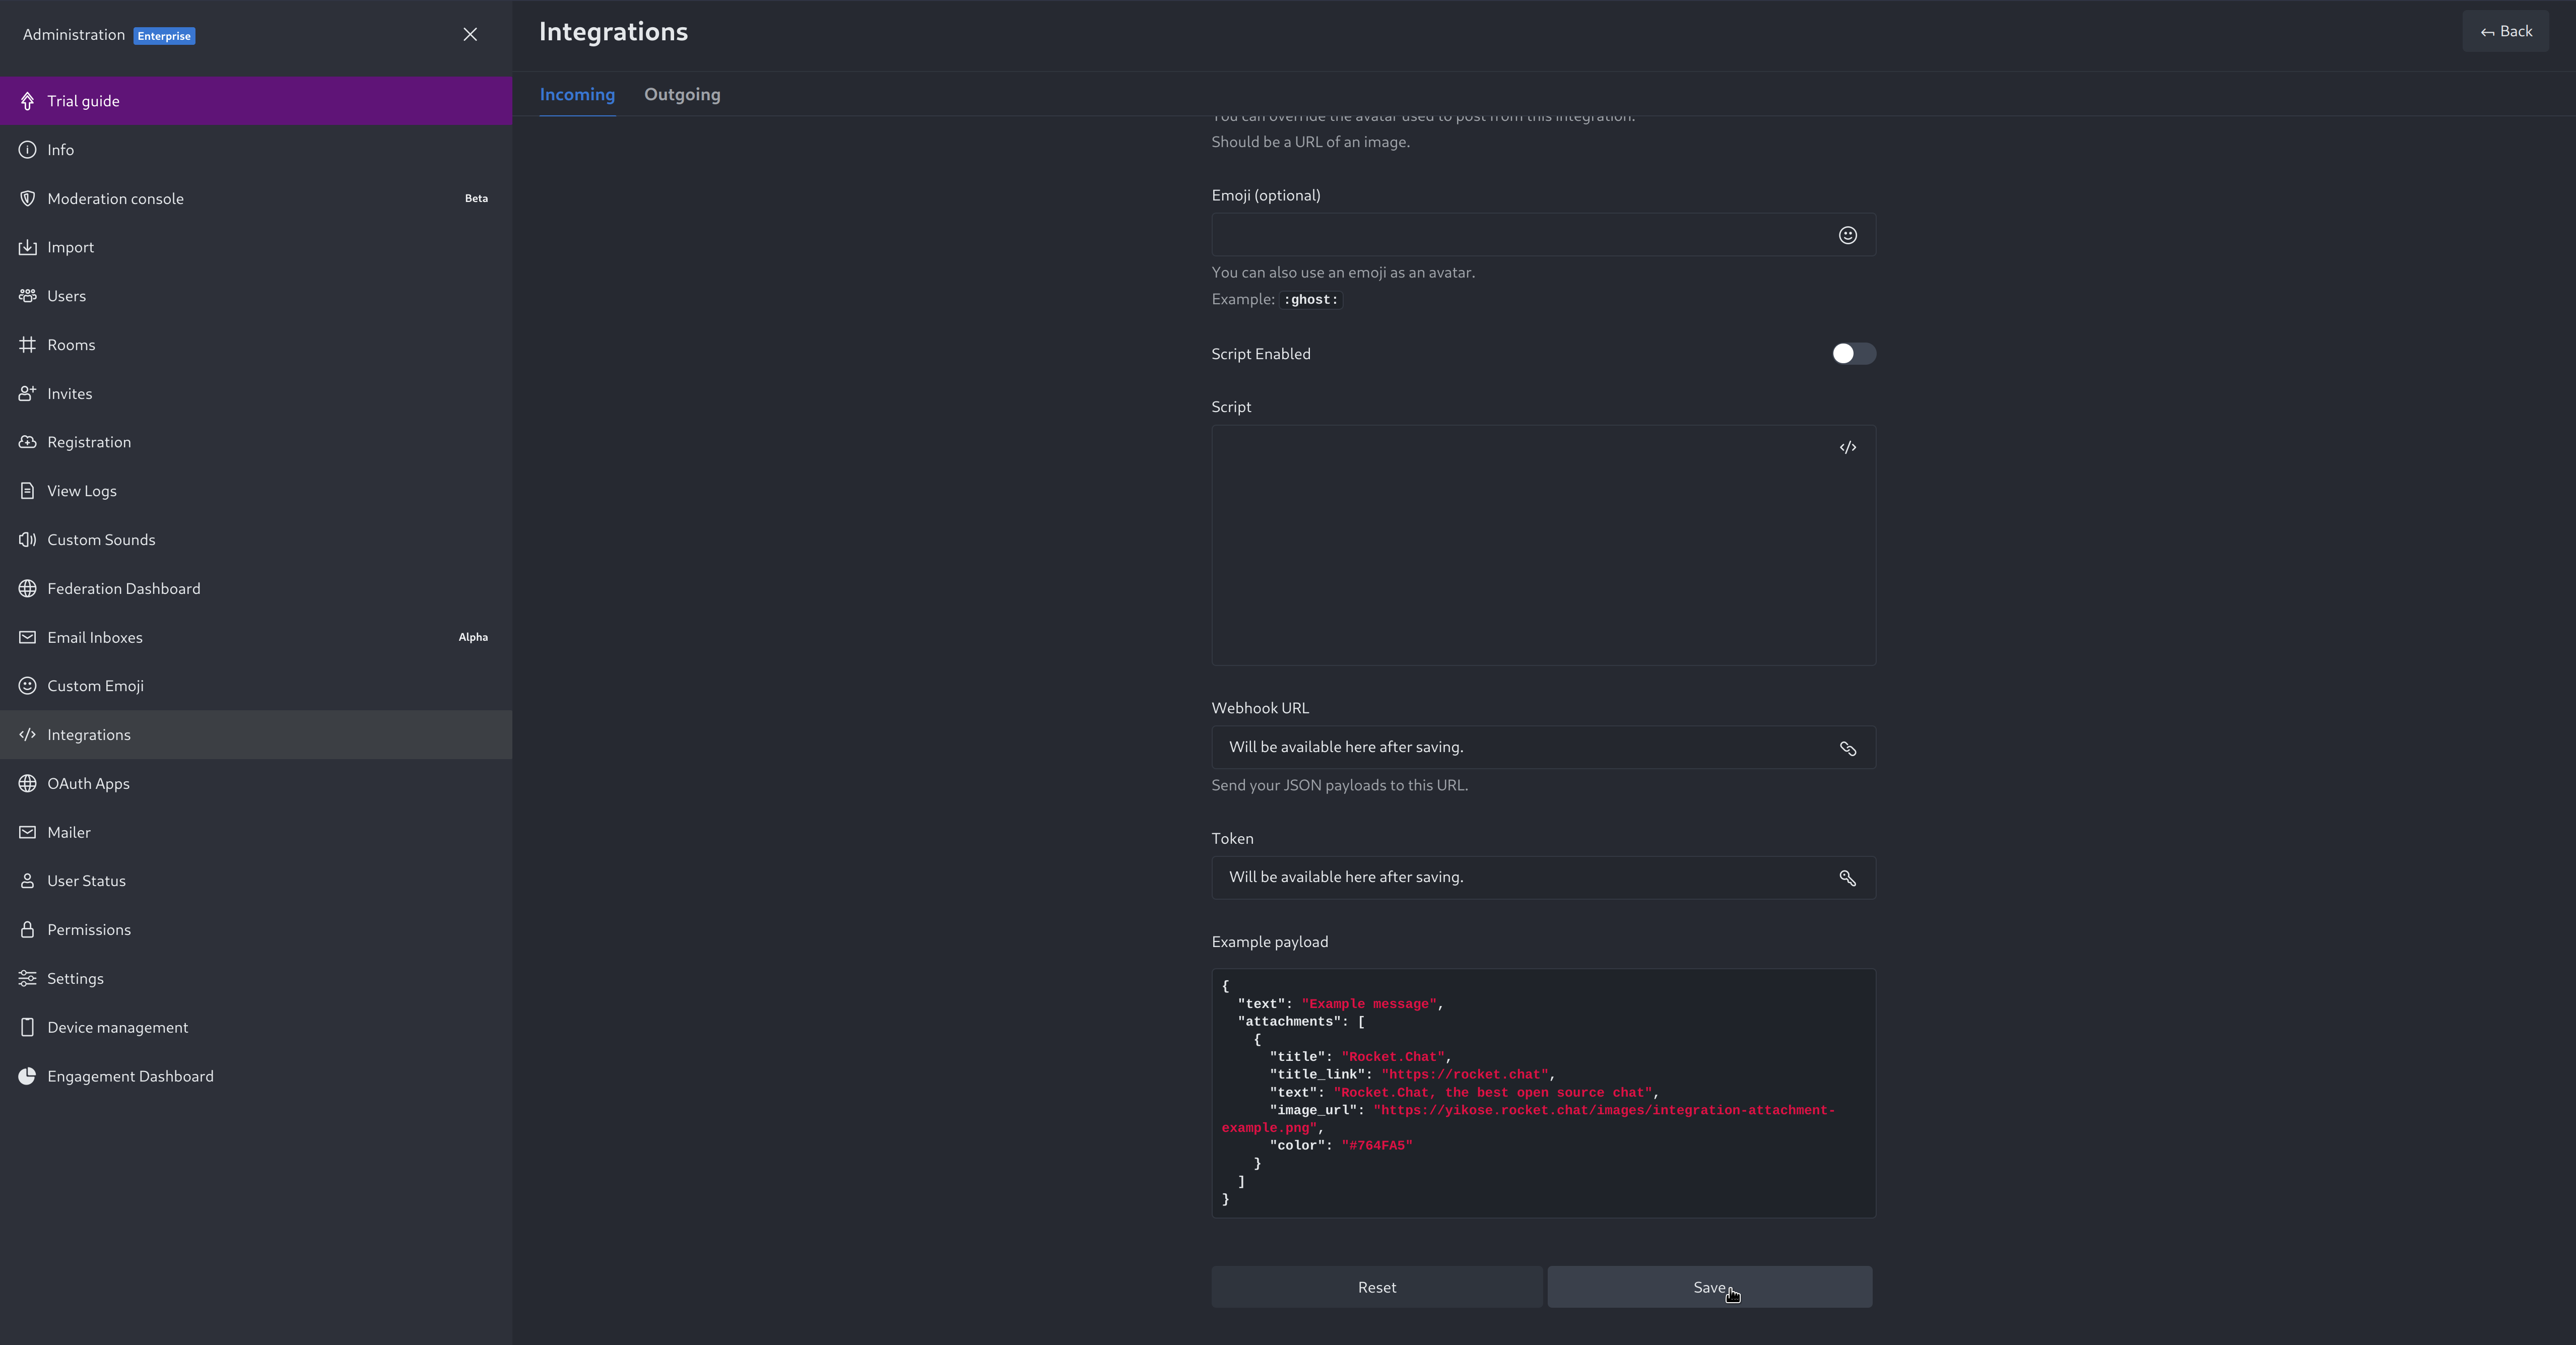 + +4. You will end up with a webhook endpoint that looks like so: +``` +https://your-server.rocket.chat/hooks/YYYYYYYYYYYYYYYYYYYYYYYY/XXXXXXXXXXXXXXXXXXXXXXXXXXXXXXXXXXXXXXXXXXXXXXXX +``` + - Treat this endpoint as a secret. Anyone who has it will be able to post messages to your RocketChat instance. + +For more details please check RocketChat's article [Incoming webhooks for RocketChat](https://docs.rocket.chat/use-rocket.chat/workspace-administration/integrations/). diff --git a/docs/cloud/manage/invite-your-team.md b/docs/cloud/manage/invite-your-team.md deleted file mode 100644 index da2d51f7..00000000 --- a/docs/cloud/manage/invite-your-team.md +++ /dev/null @@ -1,24 +0,0 @@ -# Invite your team - -Invite your entire SRE, DevOPs, or ITOps team to Netdata Cloud, to give everyone insights into your infrastructure from a single pane of glass. - -Invite new users to your Space by clicking on **Invite Users** in -the [Space](https://github.com/netdata/netdata/blob/master/docs/cloud/spaces.md) management area. - -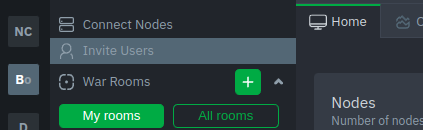 - - -You will be prompted to enter the email addresses for the users you want to invite to your Space. You can enter any number of email addresses, separated by a comma, to send multiple invitations at once. - -Next, choose the War Rooms you want to invite these users to. Once logged in, these users are not restricted only to -these War Rooms. They can be invited to others, or join any that are public. - -Next, pick a role for the invited user. You can read more about [which roles are available](https://github.com/netdata/netdata/blob/master/docs/cloud/manage/role-based-access.md#what-roles-are-available) based on your [subscription plan](https://github.com/netdata/netdata/blob/master/docs/cloud/manage/plans.md). - -Click the **Send** button to send an email invitation, which will prompt them -to [sign up](https://github.com/netdata/netdata/blob/master/docs/cloud/manage/sign-in.md) and join your Space. - -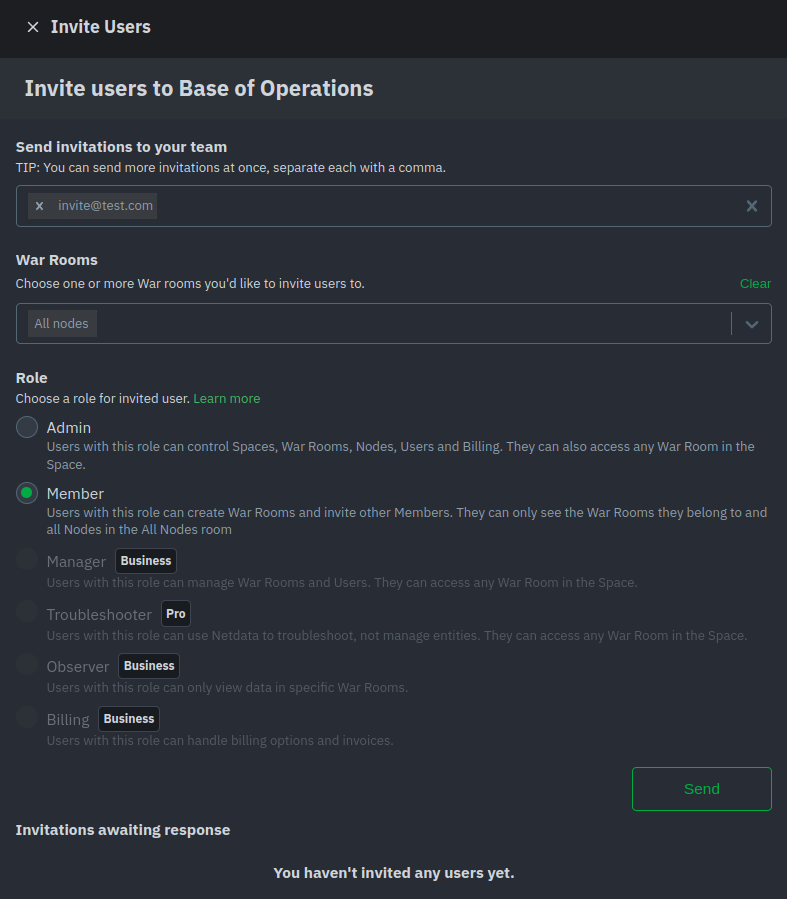 - -Any unaccepted invitations remain under **Invitations awaiting response**. These invitations can be rescinded at any -time by clicking the trash can icon. diff --git a/docs/cloud/manage/organize-your-infrastrucutre-invite-your-team.md b/docs/cloud/manage/organize-your-infrastrucutre-invite-your-team.md new file mode 100644 index 00000000..95bc1741 --- /dev/null +++ b/docs/cloud/manage/organize-your-infrastrucutre-invite-your-team.md @@ -0,0 +1,169 @@ +# Organize Your Infrastructure and Invite your Team + +Netdata Cloud provides you with features such as [Spaces](#netdata-cloud-spaces) and [War Rooms](#netdata-cloud-war-rooms) that allow you to better organize your infrastructure and ensure your team can also have access to it through invites. + +## Netdata Cloud Spaces + +Organize your multi-organization infrastructure monitoring on Netdata Cloud by creating Spaces to completely isolate access to your Agent-monitored nodes. + +A Space is a high-level container. It's a collaboration space where you can organize team members, access levels and the +nodes you want to monitor. + +Let's talk through some strategies for creating the most intuitive Cloud experience for your team. + +### How to organize your Netdata Cloud + +You can use any number of Spaces you want, but as you organize your Cloud experience, keep in mind that _you can only +add any given node to a single Space_. This 1:1 relationship between node and Space may dictate whether you use one +encompassing Space for your entire team and separate them by War Rooms, or use different Spaces for teams monitoring +discrete parts of your infrastructure. + +If you have been invited to Netdata Cloud by another user by default you will able to see that space. If you are a new +user the first space is already created. + +The other consideration for the number of Spaces you use to organize your Netdata Cloud experience is the size and +complexity of your organization. + +For smaller teams and infrastructures, we recommend sticking to a single Space so that you can keep all your nodes and their +respective metrics in one place. You can then use +multiple [War Rooms](#netdata-cloud-war-rooms) +to further organize your infrastructure monitoring. + +Enterprises may want to create multiple Spaces for each of their larger teams, particularly if those teams have +different responsibilities or parts of the overall infrastructure to monitor. For example, you might have one SRE team +for your user-facing SaaS application and a second team for infrastructure tooling. If they don't need to monitor the +same nodes, you can create separate Spaces for each team. + +### Navigate between spaces + +Click on any of the boxes to switch between available Spaces. + +Netdata Cloud abbreviates each Space to the first letter of the name, or the first two letters if the name is two words +or more. Hover over each icon to see the full name in a tooltip. + +To add a new Space click on the green **+** button. Enter the name of the Space and click **Save**. + + + +### Manage Spaces + +Manage your spaces by selecting a particular space and clicking on the small gear icon in the lower left corner. This +will open a side tab in which you can: + +1. _Configure this Space*_, in the first tab (**Space**) you can change the name, description or/and some privilege + options of this space + +2. _Edit the War Rooms*_, click on the **War rooms** tab to add or remove War Rooms. + +3. _Connect nodes*_, click on **Nodes** tab. Copy the claiming script to your node and run it. See the + [connect to Cloud doc](https://github.com/netdata/netdata/blob/master/claim/README.md) for details. + +4. _Manage the users*_, click on **Users**. + The [invitation doc](#invite-your-team) + details the invitation process. + +5. _Manage notification setting*_, click on **Notifications** tab to turn off/on notification methods. + +6. _Manage your bookmarks*_, click on the **Bookmarks** tab to add or remove bookmarks that you need. + +> #### Note +> +> \* This action requires admin rights for this space + +### Obsoleting offline nodes from a Space + +Netdata admin users now have the ability to remove obsolete nodes from a space. + +- Only admin users have the ability to obsolete nodes +- Only offline nodes can be marked obsolete (Live nodes and stale nodes cannot be obsoleted) +- Node obsoletion works across the entire space, so the obsoleted node will be removed from all rooms belonging to the + space +- If the obsoleted nodes eventually become live or online once more they will be automatically re-added to the space + + + +## Netdata Cloud War rooms + +Netdata Cloud uses War Rooms to organize your connected nodes and provide infrastructure-wide dashboards using real-time metrics and visualizations. + +Once you add nodes to a Space, all of your nodes will be visible in the **All nodes** War Room. This is a special War Room +which gives you an overview of all of your nodes in this particular Space. Then you can create functional separations of +your nodes into more War Rooms. Every War Room has its own dashboards, navigation, indicators, and management tools. + +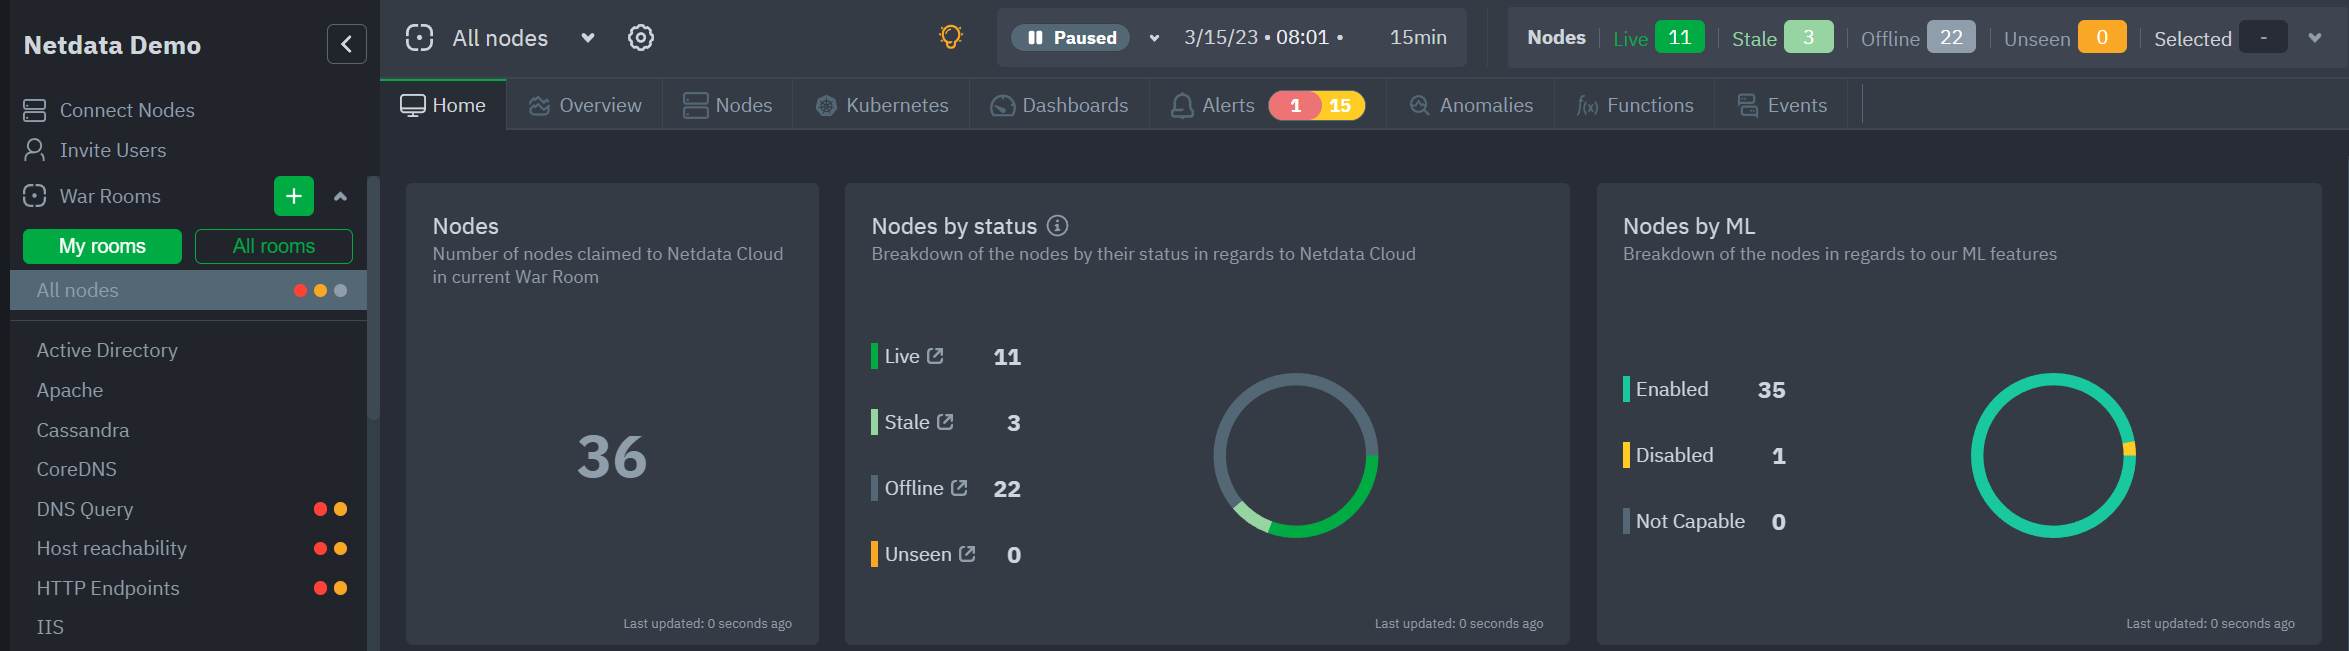 + +### War Room organization + +We recommend a few strategies for organizing your War Rooms. + +- **Service, purpose, location, etc.** + You can group War Rooms by a service (Nginx, MySQL, Pulsar, and so on), their purpose (webserver, database, application), their physical location, whether they're "bare metal" or a Docker container, the PaaS/cloud provider it runs on, and much more. + This allows you to see entire slices of your infrastructure by moving from one War Room to another. + +- **End-to-end apps/services** + If you have a user-facing SaaS product, or an internal service that this said product relies on, you may want to monitor that entire stack in a single War Room. This might include Kubernetes clusters, Docker containers, proxies, databases, web servers, brokers, and more. + End-to-end War Rooms are valuable tools for ensuring the health and performance of your organization's essential services. + +- **Incident response** + You can also create new War Rooms as one of the first steps in your incident response process. + For example, you have a user-facing web app that relies on Apache Pulsar for a message queue, and one of your nodes using the [Pulsar collector](https://github.com/netdata/go.d.plugin/blob/master/modules/pulsar/README.md) begins reporting a suspiciously low messages rate. + You can create a War Room called `$year-$month-$day-pulsar-rate`, add all your Pulsar nodes in addition to nodes they connect to, and begin diagnosing the root cause in a War Room optimized for getting to resolution as fast as possible. + +### Add War Rooms + +To add new War Rooms to any Space, click on the green plus icon **+** next to the **War Rooms** heading on the left (Space's) sidebar. + +In the panel, give the War Room a name and description, and choose whether it's public or private. +Anyone in your Space can join public War Rooms, but can only join private War Rooms with an invitation. + +### Manage War Rooms + +All the users and nodes involved in a particular Space can be part of a War Room. + +Any user can change simple settings of a War room, like the name or the users participating in it. +Click on the gear icon of the War Room's name in the top of the page to do that. A sidebar will open with options for this War Room: + +1. To **change a War Room's name, description, or public/private status**, click on **War Room** tab. + +2. To **include an existing node** to a War Room or **connect a new node\*** click on **Nodes** tab. Choose any connected node you want to add to this War Room by clicking on the checkbox next to its hostname, then click **+ Add** at the top of the panel. + +3. To **add existing users to a War Room**, click on **Add Users**. + See our [invite doc](#invite-your-team.md) for details on inviting new users to your Space in Netdata Cloud. + +> #### Note +> +>\* This action requires **admin** rights for this Space + +#### More actions + +To **view or remove nodes** in a War Room, click on the **Nodes tab**. To remove a node from the current War Room, click on +the **🗑** icon. + +> #### Info +> +> Removing a node from a War Room does not remove it from your Space. + +## Invite your team + +Invite your entire SRE, DevOPs, or ITOps team to Netdata Cloud, to give everyone insights into your infrastructure from a single pane of glass. + +Invite new users to your Space by clicking on **Invite Users** in +the [Space](#netdata-cloud-spaces) management area. + + + + +You will be prompted to enter the email addresses of the users you want to invite to your Space. You can enter any number of email addresses, separated by a comma, to send multiple invitations at once. + +Next, choose the War Rooms you want to invite these users to. Once logged in, these users are not restricted only to +these War Rooms. They can be invited to others, or join any that are public. + +Next, pick a role for the invited user. You can read more about [which roles are available](https://github.com/netdata/netdata/blob/master/docs/cloud/manage/role-based-access.md#what-roles-are-available) based on your [subscription plan](https://github.com/netdata/netdata/blob/master/docs/cloud/manage/plans.md). + +Click the **Send** button to send an email invitation, which will prompt them +to [sign up](https://github.com/netdata/netdata/blob/master/docs/cloud/manage/sign-in.md) and join your Space. + + + +Any unaccepted invitations remain under **Invitations awaiting response**. These invitations can be rescinded at any +time by clicking the trash can icon. diff --git a/docs/cloud/manage/plans.md b/docs/cloud/manage/plans.md index 23077f89..f84adaa8 100644 --- a/docs/cloud/manage/plans.md +++ b/docs/cloud/manage/plans.md @@ -113,7 +113,7 @@ For more details check the documentation under [Alert Notifications](https://git #### **Related Concepts** -* [Spaces](https://github.com/netdata/netdata/blob/master/docs/cloud/spaces.md) +* [Spaces](https://github.com/netdata/netdata/blob/master/docs/cloud/manage/organize-your-infrastrucutre-invite-your-team.md#netdata-cloud-spaces) * [Alert Notifications](https://github.com/netdata/netdata/blob/master/docs/cloud/alerts-notifications/notifications.md) * [Events feed](https://github.com/netdata/netdata/blob/master/docs/cloud/insights/events-feed.md) * [Role-Based Access model](https://github.com/netdata/netdata/blob/master/docs/cloud/manage/role-based-access.md) diff --git a/docs/cloud/netdata-assistant.md b/docs/cloud/netdata-assistant.md new file mode 100644 index 00000000..afa13f6e --- /dev/null +++ b/docs/cloud/netdata-assistant.md @@ -0,0 +1,20 @@ +# Alert troubleshooting with Netdata Assistant + +The Netdata Assistant is a feature that uses large language models and the Netdata community's collective knowledge to guide you during troubleshooting. It is designed to make understanding and root causing alerts simpler and faster. + +## Using Netdata Assistant + +- Navigate to the alerts tab +- If there are active alerts, the `Actions` column will have an Assistant button + + 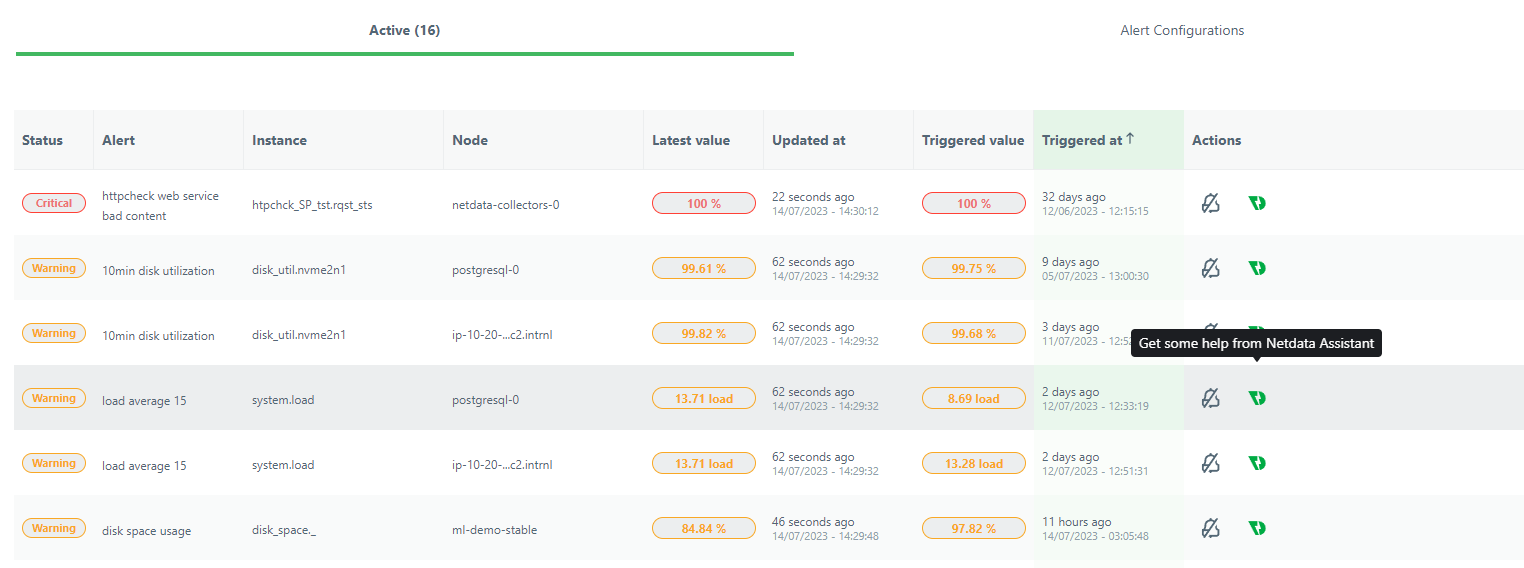 + +- Clicking on the Assistant button opens up as a floating window with customized information and troubleshooting tips for this alert (note that the window can follow you through your troubleshooting journey on Netdata dashboards) + + 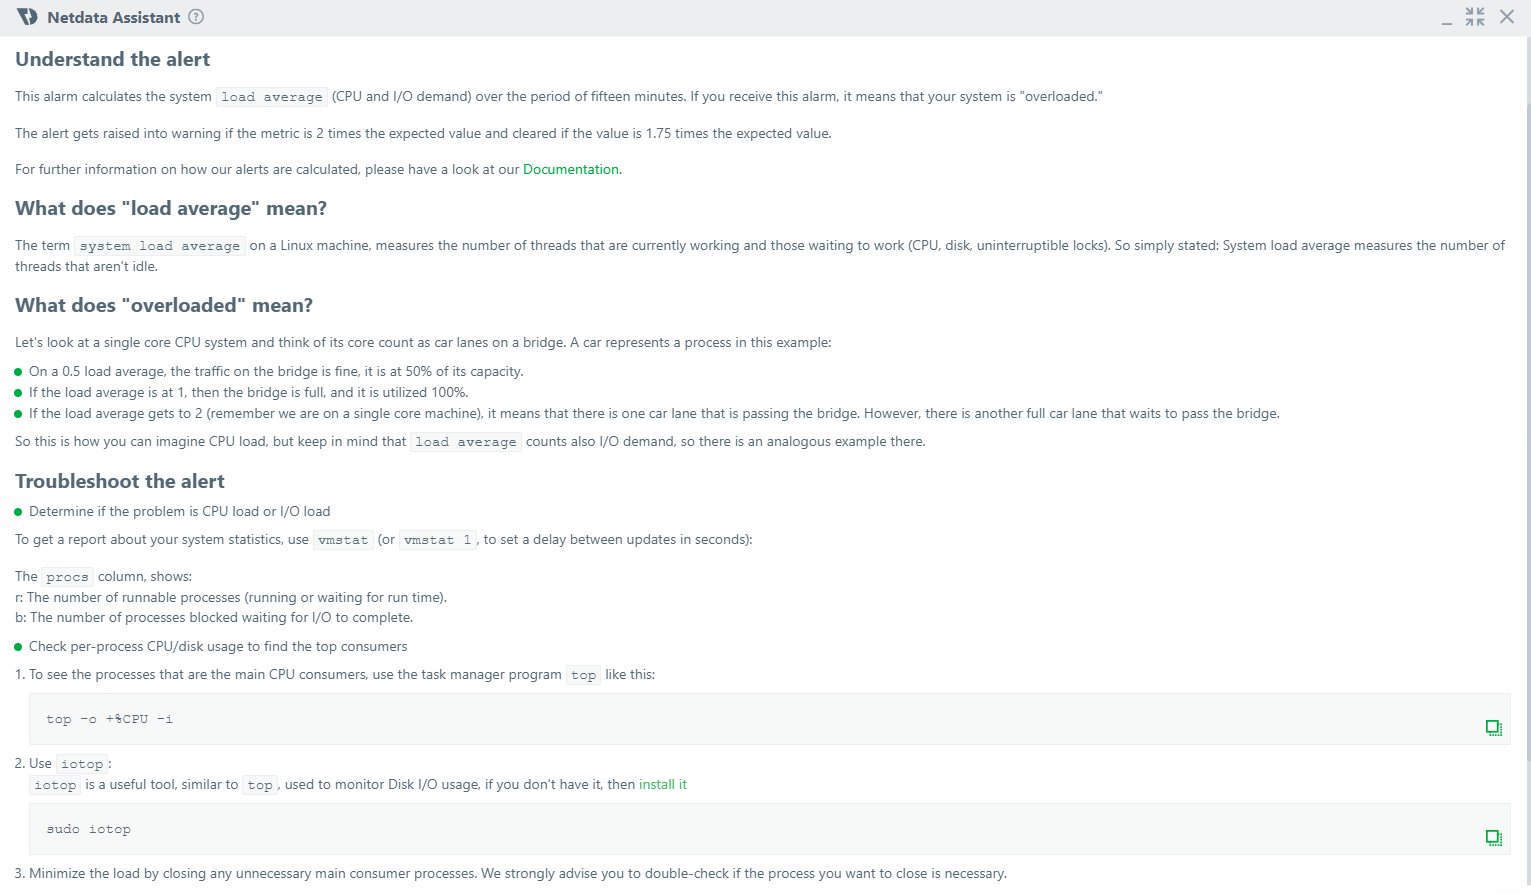 + +- In case you need more information, or want to understand deeper, Netdata Assistant also provides useful web links to resources that can help. + +  + +- If there are no active alerts, you can still use Netdata Assistant by clicking the Assistant button on the Alert Configuration view. diff --git a/docs/cloud/netdata-functions.md b/docs/cloud/netdata-functions.md index 9fcf732c..8e9415eb 100644 --- a/docs/cloud/netdata-functions.md +++ b/docs/cloud/netdata-functions.md @@ -33,6 +33,7 @@ functions - [plugins.d](https://github.com/netdata/netdata/blob/master/collector | Function | Description | plugin - module | | :-- | :-- | :-- | | processes | Detailed information on the currently running processes on the node. | [apps.plugin](https://github.com/netdata/netdata/blob/master/collectors/apps.plugin/README.md) | +| ebpf_thread | Controller for eBPF threads. | [ebpf.plugin](https://github.com/netdata/netdata/blob/master/collectors/ebpf.plugin/README.md) | If you have ideas or requests for other functions: * open a [Feature request](https://github.com/netdata/netdata-cloud/issues/new?assignees=&labels=feature+request%2Cneeds+triage&template=FEAT_REQUEST.yml&title=%5BFeat%5D%3A+) on Netdata Cloud repo diff --git a/docs/cloud/spaces.md b/docs/cloud/spaces.md deleted file mode 100644 index 2a275c14..00000000 --- a/docs/cloud/spaces.md +++ /dev/null @@ -1,79 +0,0 @@ -# Netdata Cloud Spaces - -Organize your multi-organization infrastructure monitoring on Netdata Cloud by creating Spaces to completely isolate access to your Agent-monitored nodes. - -A Space is a high-level container. It's a collaboration space where you can organize team members, access levels and the -nodes you want to monitor. - -Let's talk through some strategies for creating the most intuitive Cloud experience for your team. - -## How to organize your Netdata Cloud - -You can use any number of Spaces you want, but as you organize your Cloud experience, keep in mind that _you can only -add any given node to a single Space_. This 1:1 relationship between node and Space may dictate whether you use one -encompassing Space for your entire team and separate them by War Rooms, or use different Spaces for teams monitoring -discrete parts of your infrastructure. - -If you have been invited to Netdata Cloud by another user by default you will able to see this space. If you are a new -user the first space is already created. - -The other consideration for the number of Spaces you use to organize your Netdata Cloud experience is the size and -complexity of your organization. - -For small team and infrastructures we recommend sticking to a single Space so that you can keep all your nodes and their -respective metrics in one place. You can then use -multiple [War Rooms](https://github.com/netdata/netdata/blob/master/docs/cloud/war-rooms.md) -to further organize your infrastructure monitoring. - -Enterprises may want to create multiple Spaces for each of their larger teams, particularly if those teams have -different responsibilities or parts of the overall infrastructure to monitor. For example, you might have one SRE team -for your user-facing SaaS application and a second team for infrastructure tooling. If they don't need to monitor the -same nodes, you can create separate Spaces for each team. - -## Navigate between spaces - -Click on any of the boxes to switch between available Spaces. - -Netdata Cloud abbreviates each Space to the first letter of the name, or the first two letters if the name is two words -or more. Hover over each icon to see the full name in a tooltip. - -To add a new Space click on the green **+** button . Enter the name of the Space and click **Save**. - - - -## Manage Spaces - -Manage your spaces by selecting in a particular space and clicking in the small gear icon in the lower left corner. This -will open a side tab in which you can: - -1. _Configure this Space*_, in the first tab (**Space**) you can change the name, description or/and some privilege - options of this space - -2. _Edit the War Rooms*_, click on the **War rooms** tab to add or remove War Rooms. - -3. _Connect nodes*_, click on **Nodes** tab. Copy the claiming script to your node and run it. See the - [connect to Cloud doc](https://github.com/netdata/netdata/blob/master/claim/README.md) for details. - -4. _Manage the users*_, click on **Users**. - The [invitation doc](https://github.com/netdata/netdata/blob/master/docs/cloud/manage/invite-your-team.md) - details the invitation process. - -5. _Manage notification setting*_, click on **Notifications** tab to turn off/on notification methods. - -6. _Manage your bookmarks*_, click on the **Bookmarks** tab to add or remove bookmarks that you need. - -> ### Note -> -> \* This action requires admin rights for this space - -## Obsoleting offline nodes from a Space - -Netdata admin users now have the ability to remove obsolete nodes from a space. - -- Only admin users have the ability to obsolete nodes -- Only offline nodes can be marked obsolete (Live nodes and stale nodes cannot be obsoleted) -- Node obsoletion works across the entire space, so the obsoleted node will be removed from all rooms belonging to the - space -- If the obsoleted nodes eventually become live or online once more they will be automatically re-added to the space - - diff --git a/docs/cloud/visualize/dashboards.md b/docs/cloud/visualize/dashboards.md index a9376db1..8291d6f1 100644 --- a/docs/cloud/visualize/dashboards.md +++ b/docs/cloud/visualize/dashboards.md @@ -106,6 +106,6 @@ Because of the visual complexity of individual charts, dashboards require a mini ## What's next? Once you've designed a dashboard or two, make sure -to [invite your team](https://github.com/netdata/netdata/blob/master/docs/cloud/manage/invite-your-team.md) if +to [invite your team](https://github.com/netdata/netdata/blob/master/docs/cloud/manage/organize-your-infrastrucutre-invite-your-team.md#invite-your-team) if you haven't already. You can add these new users to the same War Room to let them see the same dashboards without any effort. diff --git a/docs/cloud/visualize/kubernetes.md b/docs/cloud/visualize/kubernetes.md index 46e46bc1..82c33fd3 100644 --- a/docs/cloud/visualize/kubernetes.md +++ b/docs/cloud/visualize/kubernetes.md @@ -79,7 +79,7 @@ and `k8s_node_name`. The default is `k8s_controller_name`. ### Filtering -Filtering behaves identically to the [node filter in War Rooms](https://github.com/netdata/netdata/blob/master/docs/cloud/war-rooms.md#node-filter), with the ability to +Filtering behaves identically to the [node filter in War Rooms](https://github.com/netdata/netdata/blob/master/docs/cloud/visualize/node-filter.md), with the ability to filter pods/containers by `container_id` and `namespace`. ### Detailed information diff --git a/docs/cloud/visualize/nodes.md b/docs/cloud/visualize/nodes.md index 4160166f..b770c1b8 100644 --- a/docs/cloud/visualize/nodes.md +++ b/docs/cloud/visualize/nodes.md @@ -14,9 +14,9 @@ real-time charts. Use the [Overview](https://github.com/netdata/netdata/blob/master/docs/cloud/visualize/overview.md) for monitoring an infrastructure in real time using composite charts and Netdata's familiar dashboard UI. -Check the [War Room docs](https://github.com/netdata/netdata/blob/master/docs/cloud/war-rooms.md) for details on the utility bar, which contains the [node -filter](https://github.com/netdata/netdata/blob/master/docs/cloud/war-rooms.md#node-filter) and the [timeframe -selector](https://github.com/netdata/netdata/blob/master/docs/cloud/war-rooms.md#play-pause-force-play-and-timeframe-selector). +Check the [node +filter](https://github.com/netdata/netdata/blob/master/docs/cloud/visualize/node-filter.md) and the [Visualization date time controls +selector](https://github.com/netdata/netdata/blob/master/docs/dashboard/visualization-date-and-time-controls.md) for tools available on the utility bar. ## Add and customize metrics columns diff --git a/docs/cloud/war-rooms.md b/docs/cloud/war-rooms.md deleted file mode 100644 index c599fd5b..00000000 --- a/docs/cloud/war-rooms.md +++ /dev/null @@ -1,60 +0,0 @@ -# Netdata Cloud War rooms - -Netdata Cloud uses War Rooms to organize your connected nodes and provide infrastructure-wide dashboards using real-time metrics and visualizations. - -Once you add nodes to a Space, all of your nodes will be visible in the **All nodes** War Room. This is a special War Room -which gives you an overview of all of your nodes in this particular Space. Then you can create functional separations of -your nodes into more War Rooms. Every War Room has its own dashboards, navigation, indicators, and management tools. - - - -## War Room organization - -We recommend a few strategies for organizing your War Rooms. - -- **Service, purpose, location, etc.** - You can group War Rooms by a service (Nginx, MySQL, Pulsar, and so on), their purpose (webserver, database, application), their physical location, whether they're "bare metal" or a Docker container, the PaaS/cloud provider it runs on, and much more. - This allows you to see entire slices of your infrastructure by moving from one War Room to another. - -- **End-to-end apps/services** - If you have a user-facing SaaS product, or an internal service that this said product relies on, you may want to monitor that entire stack in a single War Room. This might include Kubernetes clusters, Docker containers, proxies, databases, web servers, brokers, and more. - End-to-end War Rooms are valuable tools for ensuring the health and performance of your organization's essential services. - -- **Incident response** - You can also create new War Rooms as one of the first steps in your incident response process. - For example, you have a user-facing web app that relies on Apache Pulsar for a message queue, and one of your nodes using the [Pulsar collector](https://github.com/netdata/go.d.plugin/blob/master/modules/pulsar/README.md) begins reporting a suspiciously low messages rate. - You can create a War Room called `$year-$month-$day-pulsar-rate`, add all your Pulsar nodes in addition to nodes they connect to, and begin diagnosing the root cause in a War Room optimized for getting to resolution as fast as possible. - -## Add War Rooms - -To add new War Rooms to any Space, click on the green plus icon **+** next the **War Rooms** heading on the left (Space's) sidebar. - -In the panel, give the War Room a name and description, and choose whether it's public or private. -Anyone in your Space can join public War Rooms, but can only join private War Rooms with an invitation. - -## Manage War Rooms - -All the users and nodes involved in a particular Space can be part of a War Room. - -Any user can change simple settings of a War room, like the name or the users participating in it. -Click on the gear icon of the War Room's name in the top of the page to do that. A sidebar will open with options for this War Room: - -1. To **change a War Room's name, description, or public/private status**, click on **War Room** tab. - -2. To **include an existing node** to a War Room or **connect a new node\*** click on **Nodes** tab. Choose any connected node you want to add to this War Room by clicking on the checkbox next to its hostname, then click **+ Add** at the top of the panel. - -3. To **add existing users to a War Room**, click on **Add Users**. - See our [invite doc](https://github.com/netdata/netdata/blob/master/docs/cloud/manage/invite-your-team.md) for details on inviting new users to your Space in Netdata Cloud. - -> ### Note -> ->\* This action requires **admin** rights for this Space - -### More actions - -To **view or remove nodes** in a War Room, click on the **Nodes tab**. To remove a node from the current War Room, click on -the **🗑** icon. - -> ### Info -> -> Removing a node from a War Room does not remove it from your Space. diff --git a/docs/glossary.md b/docs/glossary.md index fe61cc11..c0b9db69 100644 --- a/docs/glossary.md +++ b/docs/glossary.md @@ -27,7 +27,7 @@ Use the alphabatized list below to find the answer to your single-term questions ## B -- [**Bookmarks**](https://github.com/netdata/netdata/blob/master/docs/cloud/spaces.md#manage-spaces): Netdata Cloud's bookmarks put your tools in one accessible place. Bookmarks are shared between all War Rooms in a Space, so any users in your Space will be able to see and use them. +- [**Bookmarks**](https://github.com/netdata/netdata/blob/master/docs/cloud/manage/organize-your-infrastrucutre-invite-your-team.md#manage-spaces): Netdata Cloud's bookmarks put your tools in one accessible place. Bookmarks are shared between all War Rooms in a Space, so any users in your Space will be able to see and use them. ## C @@ -126,7 +126,7 @@ metrics, troubleshoot complex performance problems, and make data interoperable ## O -- [**Obsoletion**(of nodes)](https://github.com/netdata/netdata/blob/master/docs/cloud/spaces.md#obsoleting-offline-nodes-from-a-space): Removing nodes from a space. +- [**Obsoletion**(of nodes)](https://github.com/netdata/netdata/blob/master/docs/cloud/manage/organize-your-infrastrucutre-invite-your-team.md#obsoleting-offline-nodes-from-a-space): Removing nodes from a space. - [**Orchestrators**](https://github.com/netdata/netdata/blob/master/collectors/README.md#collector-architecture-and-terminology): External plugins that run and manage one or more modules. They run as independent processes. @@ -146,7 +146,7 @@ metrics, troubleshoot complex performance problems, and make data interoperable - [**Replication Streaming**](https://github.com/netdata/netdata/blob/master/streaming/README.md): Streaming configuration where child `A`, _with_ a database and web dashboard, streams metrics to parent `B`. -- [**Room** or **War Room**](https://github.com/netdata/netdata/blob/master/docs/cloud/war-rooms.md): War Rooms organize your connected nodes and provide infrastructure-wide dashboards using real-time metrics and visualizations. +- [**Room** or **War Room**](https://github.com/netdata/netdata/blob/master/docs/cloud/manage/organize-your-infrastrucutre-invite-your-team.md#netdata-cloud-war-rooms): War Rooms organize your connected nodes and provide infrastructure-wide dashboards using real-time metrics and visualizations. ## S @@ -154,7 +154,7 @@ metrics, troubleshoot complex performance problems, and make data interoperable <!-- No link for this file in current structure. - **Snapshots** https://github.com/netdata/netdata/blob/master/docs/tasks/miscellaneous/snapshot-data.md: An image of your dashboard at any given time, whicn can be imiported into any other node running Netdata or used to genereated a PDF file for your records. --> -- [**Space**](https://github.com/netdata/netdata/blob/master/docs/cloud/spaces.md): A high-level container and virtual collaboration area where you can organize team members, access levels,and the nodes you want to monitor. +- [**Space**](https://github.com/netdata/netdata/blob/master/docs/cloud/manage/organize-your-infrastrucutre-invite-your-team.md#netdata-cloud-spaces): A high-level container and virtual collaboration area where you can organize team members, access levels,and the nodes you want to monitor. ## T @@ -173,7 +173,7 @@ even thousands of nodes. There are no actual bottlenecks especially if you retai ## W -- [**War Room** or **Room**](https://github.com/netdata/netdata/blob/master/docs/cloud/war-rooms.md): War Rooms organize your connected nodes and provide infrastructure-wide dashboards using real-time metrics and visualizations. +- [**War Room** or **Room**](https://github.com/netdata/netdata/blob/master/docs/cloud/manage/organize-your-infrastrucutre-invite-your-team.md#netdata-cloud-war-rooms): War Rooms organize your connected nodes and provide infrastructure-wide dashboards using real-time metrics and visualizations. ## Z diff --git a/docs/guides/troubleshoot/monitor-debug-applications-ebpf.md b/docs/guides/troubleshoot/monitor-debug-applications-ebpf.md index 856985ec..f393e8e0 100644 --- a/docs/guides/troubleshoot/monitor-debug-applications-ebpf.md +++ b/docs/guides/troubleshoot/monitor-debug-applications-ebpf.md @@ -248,7 +248,7 @@ from any number of distributed nodes to see how your application interacts with systems. Now that you can see eBPF metrics in Netdata Cloud, you can [invite your -team](https://github.com/netdata/netdata/blob/master/docs/cloud/manage/invite-your-team.md) and share your findings with others. +team](https://github.com/netdata/netdata/blob/master/docs/cloud/manage/organize-your-infrastrucutre-invite-your-team.md#invite-your-team) and share your findings with others. diff --git a/docs/guides/using-host-labels.md b/docs/guides/using-host-labels.md index b9b15611..5b9ab2e8 100644 --- a/docs/guides/using-host-labels.md +++ b/docs/guides/using-host-labels.md @@ -5,7 +5,7 @@ Netdata allows to organize your observability infrastructure with spaces, war ro ## Spaces and war rooms -[Spaces](https://github.com/netdata/netdata/blob/master/docs/cloud/spaces.md) are used for organization-level or infrastructure-level +[Spaces](https://github.com/netdata/netdata/blob/master/docs/cloud/manage/organize-your-infrastrucutre-invite-your-team.md#netdata-cloud-spaces) are used for organization-level or infrastructure-level grouping of nodes and people. A node can only appear in a single space, while people can have access to multiple spaces. The [war rooms](https://github.com/netdata/netdata/edit/master/docs/cloud/war-rooms.md) in a space bring together nodes and people in diff --git a/docs/quickstart/infrastructure.md b/docs/quickstart/infrastructure.md index c76948f6..647b2b9c 100644 --- a/docs/quickstart/infrastructure.md +++ b/docs/quickstart/infrastructure.md @@ -41,11 +41,11 @@ SRE team for the user-facing SaaS application, and a second IT team for managing don't monitor the same nodes, they can work in separate Spaces and then further organize their nodes into War Rooms. Next, set up War Rooms. Netdata Cloud creates dashboards and visualizations based on the nodes added to a given War -Room. You can [organize War Rooms](https://github.com/netdata/netdata/blob/master/docs/cloud/war-rooms.md#war-room-organization) in any way +Room. You can [organize War Rooms](https://github.com/netdata/netdata/blob/master/docs/cloud/manage/organize-your-infrastrucutre-invite-your-team.md#war-room-organization) in any way you want, such as by the application type, for end-to-end application monitoring, or as an incident response tool. -Learn more about [Spaces](https://github.com/netdata/netdata/blob/master/docs/cloud/spaces.md) and [War -Rooms](https://github.com/netdata/netdata/blob/master/docs/cloud/war-rooms.md), including how to manage each, in their respective reference +Learn more about [Spaces](https://github.com/netdata/netdata/blob/master/docs/cloud/manage/organize-your-infrastrucutre-invite-your-team.md#netdata-cloud-spaces) and [War +Rooms](https://github.com/netdata/netdata/blob/master/docs/cloud/manage/organize-your-infrastrucutre-invite-your-team.md#netdata-cloud-war-rooms), including how to manage each, in their respective reference documentation. ### Invite your team @@ -55,7 +55,7 @@ inviting others, you can better synchronize with your team or colleagues to unde When something goes wrong, you'll be ready to collaboratively troubleshoot complex performance problems from a single pane of glass. -To [invite new users](https://github.com/netdata/netdata/blob/master/docs/cloud/manage/invite-your-team.md), click on **Invite Users** in the +To [invite new users](https://github.com/netdata/netdata/blob/master/docs/cloud/manage/organize-your-infrastrucutre-invite-your-team.md#invite-your-team), click on **Invite Users** in the Space management Area. Choose which War Rooms to add this user to, then click **Send**. If your team members have trouble signing in, direct them to the [Netdata Cloud sign @@ -165,8 +165,8 @@ collect from across your infrastructure with Netdata. <Box title="Spaces and War Rooms"> <BoxList> - <BoxListItemRegexLink to="[](https://github.com/netdata/netdata/blob/master/docs/cloud/spaces.md)" title="Spaces" /> - <BoxListItemRegexLink to="[](https://github.com/netdata/netdata/blob/master/docs/cloud/war-rooms.md)" title="War Rooms" /> + <BoxListItemRegexLink to="[](https://github.com/netdata/netdata/blob/master/docs/cloud/manage/organize-your-infrastrucutre-invite-your-team.md#netdata-cloud-spaces)" title="Spaces" /> + <BoxListItemRegexLink to="[](https://github.com/netdata/netdata/blob/master/docs/cloud/manage/organize-your-infrastrucutre-invite-your-team.md#netdata-cloud-war-rooms)" title="War Rooms" /> </BoxList> </Box> <Box @@ -195,7 +195,7 @@ collect from across your infrastructure with Netdata. title="Management and settings"> <BoxList> <BoxListItemRegexLink to="[](https://github.com/netdata/netdata/blob/master/docs/cloud/manage/sign-in.md)" title="Sign in with email, Google, or GitHub" /> - <BoxListItemRegexLink to="[](https://github.com/netdata/netdata/blob/master/docs/cloud/manage/invite-your-team.md)" title="Invite your team" /> + <BoxListItemRegexLink to="[](https://github.com/netdata/netdata/blob/master/docs/cloud/manage/organize-your-infrastrucutre-invite-your-team.md#invite-your-team)" title="Invite your team" /> <BoxListItemRegexLink to="[](https://github.com/netdata/netdata/blob/master/docs/cloud/manage/themes.md)" title="Choose your Netdata Cloud theme" /> <BoxListItemRegexLink to="[](https://github.com/netdata/netdata/blob/master/docs/cloud/manage/role-based-access.md)" title="Role-Based Access" /> <BoxListItemRegexLink to="[](https://github.com/netdata/netdata/blob/master/docs/cloud/manage/plans.md)" title="Paid Plans" /> @@ -204,8 +204,8 @@ collect from across your infrastructure with Netdata. </Grid> - Spaces and War Rooms - - [Spaces](https://github.com/netdata/netdata/blob/master/docs/cloud/spaces.md) - - [War Rooms](https://github.com/netdata/netdata/blob/master/docs/cloud/war-rooms.md) + - [Spaces](https://github.com/netdata/netdata/blob/master/docs/cloud/manage/organize-your-infrastrucutre-invite-your-team.md#netdata-cloud-spaces) + - [War Rooms](https://github.com/netdata/netdata/blob/master/docs/cloud/manage/organize-your-infrastrucutre-invite-your-team.md#netdata-cloud-war-rooms) - Dashboards - [Overview](https://github.com/netdata/netdata/blob/master/docs/cloud/visualize/overview.md) - [Nodes tab](https://github.com/netdata/netdata/blob/master/docs/cloud/visualize/nodes.md) @@ -220,7 +220,7 @@ collect from across your infrastructure with Netdata. - [Events Feed](https://github.com/netdata/netdata/blob/master/docs/cloud/insights/events-feed.md) - Management and settings - [Sign in with email, Google, or GitHub](https://github.com/netdata/netdata/blob/master/docs/cloud/manage/sign-in.md) - - [Invite your team](https://github.com/netdata/netdata/blob/master/docs/cloud/manage/invite-your-team.md) + - [Invite your team](hhttps://github.com/netdata/netdata/blob/master/docs/cloud/manage/organize-your-infrastrucutre-invite-your-team.md#invite-your-team) - [Choose your Netdata Cloud theme](https://github.com/netdata/netdata/blob/master/docs/cloud/manage/themes.md) - [Role-Based Access](https://github.com/netdata/netdata/blob/master/docs/cloud/manage/role-based-access.md) - [Paid Plans](https://github.com/netdata/netdata/blob/master/docs/cloud/manage/plans.md) diff --git a/docs/store/distributed-data-architecture.md b/docs/store/distributed-data-architecture.md index b08a265a..64ac9851 100644 --- a/docs/store/distributed-data-architecture.md +++ b/docs/store/distributed-data-architecture.md @@ -69,7 +69,7 @@ When you use the database engine to store your metrics, you can always perform a Netdata Cloud does not store metric values. To enable certain features, such as [viewing active alarms](https://github.com/netdata/netdata/blob/master/docs/monitor/view-active-alarms.md) -or [filtering by hostname/service](https://github.com/netdata/netdata/blob/master/docs/cloud/war-rooms.md), Netdata Cloud does +or [filtering by hostname](https://github.com/netdata/netdata/blob/master/docs/cloud/visualize/node-filter.md), Netdata Cloud does store configured alarms, their status, and a list of active collectors. Netdata does not and never will sell your personal data or data about your deployment. diff --git a/docs/visualize/overview-infrastructure.md b/docs/visualize/overview-infrastructure.md index c09e9aea..3b1f7fcc 100644 --- a/docs/visualize/overview-infrastructure.md +++ b/docs/visualize/overview-infrastructure.md @@ -36,8 +36,8 @@ Let's walk through some examples of using the Overview to monitor and troublesho ### Filter nodes and pick relevant times While not exclusive to Overview, you can use two important features, [node -filtering](https://github.com/netdata/netdata/blob/master/docs/cloud/war-rooms.md#node-filter) and the [time & date -picker](https://github.com/netdata/netdata/blob/master/docs/cloud/war-rooms.md#time--date-picker), to widen or narrow your infrastructure +filtering](https://github.com/netdata/netdata/blob/master/docs/cloud/visualize/node-filter.md) and the [time & date +picker](https://github.com/netdata/netdata/blob/master/docs/dashboard/visualization-date-and-time-controls.md), to widen or narrow your infrastructure monitoring focus. By default, the Overview shows composite charts aggregated from every node in the War Room, but you can change that @@ -52,7 +52,7 @@ establishing a baseline of infrastructure performance or targeted root cause ana For example, use the **Quick Selector** options to pick the 12-hour option first thing in the morning to check your infrastructure for any odd behavior overnight. Use the 7-day option to observe trends between various days of the week. -See the [War Rooms](https://github.com/netdata/netdata/blob/master/docs/cloud/war-rooms.md) docs for more details on both features. +See the [War Rooms](https://github.com/netdata/netdata/blob/master/docs/cloud/manage/organize-your-infrastrucutre-invite-your-team.md#netdata-cloud-war-rooms) docs for more details on both features. ### Configure composite charts to identify problems |