
diff options
| author | Daniel Baumann <daniel.baumann@progress-linux.org> | 2019-09-03 10:23:48 +0000 |
|---|---|---|
| committer | Daniel Baumann <daniel.baumann@progress-linux.org> | 2019-09-03 10:23:48 +0000 |
| commit | cd7ed12292aef11d9062b64f61215174e8cc1860 (patch) | |
| tree | 9998ab03d153956743d9319cf3a0279b9593ce36 /docs | |
| parent | Releasing debian version 1.16.1-6. (diff) | |
| download | netdata-cd7ed12292aef11d9062b64f61215174e8cc1860.tar.xz netdata-cd7ed12292aef11d9062b64f61215174e8cc1860.zip | |
Merging upstream version 1.17.0.
Signed-off-by: Daniel Baumann <daniel.baumann@progress-linux.org>
Diffstat (limited to 'docs')
35 files changed, 1650 insertions, 721 deletions
diff --git a/docs/Add-more-charts-to-netdata.md b/docs/Add-more-charts-to-netdata.md index 285713b02..3b1bb9626 100644 --- a/docs/Add-more-charts-to-netdata.md +++ b/docs/Add-more-charts-to-netdata.md @@ -4,36 +4,36 @@ Netdata collects system metrics by itself. It has many [internal plugins](../col To collect non-system metrics, Netdata supports a plugin architecture. The following are the currently available external plugins: -- **[Web Servers](#web-servers)**, such as apache, nginx, nginx_plus, tomcat, litespeed -- **[Web Logs](#web-log-parsers)**, such as apache, nginx, lighttpd, gunicorn, squid access logs, apache cache.log -- **[Load Balancers](#load-balancers)**, like haproxy -- **[Message Brokers](#message-brokers)**, like rabbitmq, beanstalkd -- **[Database Servers](#database-servers)**, such as mysql, mariadb, postgres, couchdb, mongodb, rethinkdb -- **[Social Sharing Servers](#social-sharing-servers)**, like retroshare -- **[Proxy Servers](#proxy-servers)**, like squid -- **[HTTP accelerators](#http-accelerators)**, like varnish cache -- **[Search engines](#search-engines)**, like elasticsearch -- **[Name Servers](#name-servers)** (DNS), like bind, nsd, powerdns, dnsdist -- **[DHCP Servers](#dhcp-servers)**, like ISC DHCP -- **[UPS](#ups)**, such as APC UPS, NUT -- **[RAID](#raid)**, such as MegaRAID -- **[Mail Servers](#mail-servers)**, like postfix, exim, dovecot -- **[File Servers](#file-servers)**, like samba, NFS, ftp, sftp, WebDAV -- **[Print Servers](#print-servers)**, like CUPS -- **[Hypervisors](#hypervisors)**, like XenServer, XCP-ng -- **[System](#system)**, for processes and other system metrics -- **[Sensors](#sensors)**, like temperature, fans speed, voltage, humidity, HDD/SSD S.M.A.R.T attributes -- **[Network](#network)**, such as SNMP devices, `fping`, access points, dns_query_time, nfacct -- **[Time Servers](#time-servers)**, like chrony -- **[Security](#security)**, like FreeRADIUS, OpenVPN, Fail2ban -- **[Telephony Servers](#telephony-servers)**, like openSIPS -- **[Go applications](#go-applications)** -- **[Household appliances](#household-appliances)**, like SMA WebBox (solar power), Fronius Symo solar power, Stiebel Eltron heating -- **[Java Processes](#java-processes)**, via JMX or Spring Boot Actuator -- **[Provisioning Systems](#provisioning-systems)**, like Puppet -- **[Game Servers](#game-servers)**, like SpigotMC -- **[Distributed Computing Clients](#distributed-computing-clients)**, like BOINC -- **[Skeleton Plugins](#skeleton-plugins)**, for writing your own data collectors +- **[Web Servers](#web-servers)**, such as apache, nginx, nginx_plus, tomcat, litespeed +- **[Web Logs](#web-log-parsers)**, such as apache, nginx, lighttpd, gunicorn, squid access logs, apache cache.log +- **[Load Balancers](#load-balancers)**, like haproxy +- **[Message Brokers](#message-brokers)**, like rabbitmq, beanstalkd +- **[Database Servers](#database-servers)**, such as mysql, mariadb, postgres, couchdb, mongodb, rethinkdb +- **[Social Sharing Servers](#social-sharing-servers)**, like retroshare +- **[Proxy Servers](#proxy-servers)**, like squid +- **[HTTP accelerators](#http-accelerators)**, like varnish cache +- **[Search engines](#search-engines)**, like elasticsearch +- **[Name Servers](#name-servers)** (DNS), like bind, nsd, powerdns, dnsdist +- **[DHCP Servers](#dhcp-servers)**, like ISC DHCP +- **[UPS](#ups)**, such as APC UPS, NUT +- **[RAID](#raid)**, such as MegaRAID +- **[Mail Servers](#mail-servers)**, like postfix, exim, dovecot +- **[File Servers](#file-servers)**, like samba, NFS, ftp, sftp, WebDAV +- **[Print Servers](#print-servers)**, like CUPS +- **[Hypervisors](#hypervisors)**, like XenServer, XCP-ng +- **[System](#system)**, for processes and other system metrics +- **[Sensors](#sensors)**, like temperature, fans speed, voltage, humidity, HDD/SSD S.M.A.R.T attributes +- **[Network](#network)**, such as SNMP devices, `fping`, access points, dns_query_time, nfacct +- **[Time Servers](#time-servers)**, like chrony +- **[Security](#security)**, like FreeRADIUS, OpenVPN, Fail2ban +- **[Telephony Servers](#telephony-servers)**, like openSIPS +- **[Go applications](#go-applications)** +- **[Household appliances](#household-appliances)**, like SMA WebBox (solar power), Fronius Symo solar power, Stiebel Eltron heating +- **[Java Processes](#java-processes)**, via JMX or Spring Boot Actuator +- **[Provisioning Systems](#provisioning-systems)**, like Puppet +- **[Game Servers](#game-servers)**, like SpigotMC +- **[Distributed Computing Clients](#distributed-computing-clients)**, like BOINC +- **[Skeleton Plugins](#skeleton-plugins)**, for writing your own data collectors Check also [Third Party Plugins](Third-Party-Plugins.md) for a list of plugins distributed by third parties. @@ -41,8 +41,8 @@ Check also [Third Party Plugins](Third-Party-Plugins.md) for a list of plugins d Netdata comes with **internal** and **external** plugins: -1. The **internal** ones are written in `C` and run as threads within the Netdata daemon. -2. The **external** ones can be written in any computer language. The Netdata daemon spawns these as processes (shown with `ps fax`) and reads their metrics using pipes (so the `stdout` of external plugins is connected to Netdata for metrics collection and the `stderr` of external plugins is connected to `/var/log/netdata/error.log`). +1. The **internal** ones are written in `C` and run as threads within the Netdata daemon. +2. The **external** ones can be written in any computer language. The Netdata daemon spawns these as processes (shown with `ps fax`) and reads their metrics using pipes (so the `stdout` of external plugins is connected to Netdata for metrics collection and the `stderr` of external plugins is connected to `/var/log/netdata/error.log`). To make it easier to develop plugins, and minimize the number of threads and processes running, Netdata supports **plugin orchestrators**, each of them supporting one or more data collection **modules**. Currently we ship plugin orchestrators for 4 languages: `C`, `python`, `node.js` and `bash` and 2 more are under development (`go` and `java`). @@ -107,27 +107,26 @@ This is a map of the all supported configuration options: #### map of configuration files -plugin | language | plugin<br/>configuration | modules<br/>configuration | ----:|:---:|:---:|:---| -`apps.plugin`<br/>(external plugin for monitoring the process tree on Linux and FreeBSD)|`C`|`netdata.conf` section `[plugin:apps]`|Custom configuration for the processes to be monitored at `apps_groups.conf` -`freebsd.plugin`<br/>(internal plugin for monitoring FreeBSD system resources)|`C`|`netdata.conf` section `[plugin:freebsd]`|one section for each module `[plugin:freebsd:MODULE]`. Each module may provide additional sections in the form of `[plugin:freebsd:MODULE:SUBSECTION]`. -`cgroups.plugin`<br/>(internal plugin for monitoring Linux containers, VMs and systemd services)|`C`|`netdata.conf` section `[plugin:cgroups]`|N/A -`charts.d.plugin`<br/>(external plugin orchestrator for BASH modules)|`BASH`|`charts.d.conf`|a file for each module in `/etc/netdata/charts.d/` -`diskspace.plugin`<br/>(internal plugin for collecting Linux mount points usage)|`C`|`netdata.conf` section `[plugin:diskspace]`|N/A -`fping.plugin`<br/>(external plugin for collecting network latencies)|`C`|`fping.conf`|This plugin is a wrapper for the `fping` command. -`ioping.plugin`<br/>(external plugin for collecting disk latencies)|`C`|`ioping.conf`|This plugin is a wrapper for the `ioping` command. -`freeipmi.plugin`<br/>(external plugin for collecting IPMI h/w sensors)|`C`|`netdata.conf` section `[plugin:freeipmi]` -`nfacct.plugin`<br/>(external plugin for monitoring netfilter firewall and connection tracker)|`C`|`netdata.conf` section `[plugin:nfacct]`|N/A -`xenstat.plugin`<br/>(external plugin for monitoring XCP-ng and XenServer)|`C`|`netdata.conf` section `[plugin:xenstat]`|N/A -`perf.plugin`<br/>(external plugin for monitoring CPU performance on Linux)|`C`|`netdata.conf` section `[plugin:perf]`|N/A -`idlejitter.plugin`<br/>(internal plugin for monitoring CPU jitter)|`C`|N/A|N/A -`macos.plugin`<br/>(internal plugin for monitoring MacOS system resources)|`C`|`netdata.conf` section `[plugin:macos]`|one section for each module `[plugin:macos:MODULE]`. Each module may provide additional sections in the form of `[plugin:macos:MODULE:SUBSECTION]`. -`node.d.plugin`<br/>(external plugin orchestrator of node.js modules)|`node.js`|`node.d.conf`|a file for each module in `/etc/netdata/node.d/`. -`proc.plugin`<br/>(internal plugin for monitoring Linux system resources)|`C`|`netdata.conf` section `[plugin:proc]`|one section for each module `[plugin:proc:MODULE]`. Each module may provide additional sections in the form of `[plugin:proc:MODULE:SUBSECTION]`. -`python.d.plugin`<br/>(external plugin orchestrator for running python modules)|`python`<br/>v2 or v3<br/>both are supported|`python.d.conf`|a file for each module in `/etc/netdata/python.d/`. -`statsd.plugin`<br/>(internal plugin for collecting statsd metrics)|`C`|`netdata.conf` section `[statsd]`|Synthetic statsd charts can be configured with files in `/etc/netdata/statsd.d/`. -`tc.plugin`<br/>(internal plugin for collecting Linux traffic QoS)|`C`|`netdata.conf` section `[plugin:tc]`|The plugin runs an external helper called `tc-qos-helper.sh` to interface with the `tc` command. This helper supports a few additional options using `tc-qos-helper.conf`. - +| plugin | language | plugin<br/>configuration | modules<br/>configuration | +|-----:|:------:|:----------------------:|:------------------------| +| `apps.plugin`<br/>(external plugin for monitoring the process tree on Linux and FreeBSD)|`C`|`netdata.conf` section `[plugin:apps]`|Custom configuration for the processes to be monitored at `apps_groups.conf`| +| `freebsd.plugin`<br/>(internal plugin for monitoring FreeBSD system resources)|`C`|`netdata.conf` section `[plugin:freebsd]`|one section for each module `[plugin:freebsd:MODULE]`. Each module may provide additional sections in the form of `[plugin:freebsd:MODULE:SUBSECTION]`.| +| `cgroups.plugin`<br/>(internal plugin for monitoring Linux containers, VMs and systemd services)|`C`|`netdata.conf` section `[plugin:cgroups]`|N/A| +| `charts.d.plugin`<br/>(external plugin orchestrator for BASH modules)|`BASH`|`charts.d.conf`|a file for each module in `/etc/netdata/charts.d/`| +| `diskspace.plugin`<br/>(internal plugin for collecting Linux mount points usage)|`C`|`netdata.conf` section `[plugin:diskspace]`|N/A| +| `fping.plugin`<br/>(external plugin for collecting network latencies)|`C`|`fping.conf`|This plugin is a wrapper for the `fping` command.| +| `ioping.plugin`<br/>(external plugin for collecting disk latencies)|`C`|`ioping.conf`|This plugin is a wrapper for the `ioping` command.| +| `freeipmi.plugin`<br/>(external plugin for collecting IPMI h/w sensors)|`C`|`netdata.conf` section `[plugin:freeipmi]`|| +| `nfacct.plugin`<br/>(external plugin for monitoring netfilter firewall and connection tracker)|`C`|`netdata.conf` section `[plugin:nfacct]`|N/A| +| `xenstat.plugin`<br/>(external plugin for monitoring XCP-ng and XenServer)|`C`|`netdata.conf` section `[plugin:xenstat]`|N/A| +| `perf.plugin`<br/>(external plugin for monitoring CPU performance on Linux)|`C`|`netdata.conf` section `[plugin:perf]`|N/A| +| `idlejitter.plugin`<br/>(internal plugin for monitoring CPU jitter)|`C`|N/A|N/A| +| `macos.plugin`<br/>(internal plugin for monitoring MacOS system resources)|`C`|`netdata.conf` section `[plugin:macos]`|one section for each module `[plugin:macos:MODULE]`. Each module may provide additional sections in the form of `[plugin:macos:MODULE:SUBSECTION]`.| +| `node.d.plugin`<br/>(external plugin orchestrator of node.js modules)|`node.js`|`node.d.conf`|a file for each module in `/etc/netdata/node.d/`.| +| `proc.plugin`<br/>(internal plugin for monitoring Linux system resources)|`C`|`netdata.conf` section `[plugin:proc]`|one section for each module `[plugin:proc:MODULE]`. Each module may provide additional sections in the form of `[plugin:proc:MODULE:SUBSECTION]`.| +| `python.d.plugin`<br/>(external plugin orchestrator for running python modules)|`python`<br/>v2 or v3<br/>both are supported|`python.d.conf`|a file for each module in `/etc/netdata/python.d/`.| +| `statsd.plugin`<br/>(internal plugin for collecting statsd metrics)|`C`|`netdata.conf` section `[statsd]`|Synthetic statsd charts can be configured with files in `/etc/netdata/statsd.d/`.| +| `tc.plugin`<br/>(internal plugin for collecting Linux traffic QoS)|`C`|`netdata.conf` section `[plugin:tc]`|The plugin runs an external helper called `tc-qos-helper.sh` to interface with the `tc` command. This helper supports a few additional options using `tc-qos-helper.conf`.| ## writing data collection modules @@ -141,317 +140,296 @@ These are all the data collection plugins currently available. ### Web Servers -application|language|notes| -:---------:|:------:|:----| -apache|python<br/>v2 or v3|Connects to multiple apache servers (local or remote) to collect real-time performance metrics.<br/> <br/>Netdata plugin: [python.d.plugin](../collectors/python.d.plugin)<br/>plugin module: [apache.chart.py](../collectors/python.d.plugin/apache)<br/>configuration file: [python.d/apache.conf](../collectors/python.d.plugin/apache)| -apache|BASH<br/>Shell Script|Connects to an apache server (local or remote) to collect real-time performance metrics.<br/><br/>DEPRECATED IN FAVOR OF THE PYTHON ONE. It is still supplied only as an example module to shell scripting plugins.<br/> <br/>Netdata plugin: [charts.d.plugin](../collectors/charts.d.plugin#chartsdplugin)<br/>plugin module: [apache.chart.sh](../collectors/charts.d.plugin/apache)<br/>configuration file: [charts.d/apache.conf](../collectors/charts.d.plugin/apache)| -ipfs|python<br/>v2 or v3|Connects to multiple ipfs servers (local or remote) to collect real-time performance metrics.<br/> <br/>Netdata plugin: [python.d.plugin](../collectors/python.d.plugin)<br/>plugin module: [ipfs.chart.py](../collectors/python.d.plugin/ipfs)<br/>configuration file: [python.d/ipfs.conf](../collectors/python.d.plugin/ipfs)| -litespeed|python<br/>v2 or v3|reads the litespeed `rtreport` files to collect metrics.<br/> <br/>Netdata plugin: [python.d.plugin](../collectors/python.d.plugin)<br/>plugin module: [litespeed.chart.py](../collectors/python.d.plugin/litespeed)<br/>configuration file: [python.d/litespeed.conf](../collectors/python.d.plugin/litespeed) -nginx|python<br/>v2 or v3|Connects to multiple nginx servers (local or remote) to collect real-time performance metrics.<br/> <br/>Netdata plugin: [python.d.plugin](../collectors/python.d.plugin)<br/>plugin module: [nginx.chart.py](../collectors/python.d.plugin/nginx)<br/>configuration file: [python.d/nginx.conf](../collectors/python.d.plugin/nginx)| -nginx_plus|python<br/>v2 or v3|Connects to multiple nginx_plus servers (local or remote) to collect real-time performance metrics.<br/> <br/>Netdata plugin: [python.d.plugin](../collectors/python.d.plugin)<br/>plugin module: [nginx_plus.chart.py](../collectors/python.d.plugin/nginx_plus)<br/>configuration file: [python.d/nginx_plus.conf](../collectors/python.d.plugin/nginx_plus)| -nginx|BASH<br/>Shell Script|Connects to an nginx server (local or remote) to collect real-time performance metrics.<br/><br/>DEPRECATED IN FAVOR OF THE PYTHON ONE. It is still supplied only as an example module to shell scripting plugins.<br/> <br/>Netdata plugin: [charts.d.plugin](../collectors/charts.d.plugin#chartsdplugin)<br/>plugin module: [nginx.chart.sh](../collectors/charts.d.plugin/nginx)<br/>configuration file: [charts.d/nginx.conf](../collectors/charts.d.plugin/nginx)| -phpfpm|python<br/>v2 or v3|Connects to multiple phpfpm servers (local or remote) to collect real-time performance metrics.<br/> <br/>Netdata plugin: [python.d.plugin](../collectors/python.d.plugin)<br/>plugin module: [phpfpm.chart.py](../collectors/python.d.plugin/phpfpm)<br/>configuration file: [python.d/phpfpm.conf](../collectors/python.d.plugin/phpfpm)| -phpfpm|BASH<br/>Shell Script|Connects to one or more phpfpm servers (local or remote) to collect real-time performance metrics.<br/><br/>DEPRECATED IN FAVOR OF THE PYTHON ONE. It is still supplied only as an example module to shell scripting plugins.<br/> <br/>Netdata plugin: [charts.d.plugin](../collectors/charts.d.plugin#chartsdplugin)<br/>plugin module: [phpfpm.chart.sh](../collectors/charts.d.plugin/phpfpm)<br/>configuration file: [charts.d/phpfpm.conf](../collectors/charts.d.plugin/phpfpm)| -tomcat|python<br/>v2 or v3|Connects to multiple tomcat servers (local or remote) to collect real-time performance metrics.<br/> <br/>Netdata plugin: [python.d.plugin](../collectors/python.d.plugin)<br/>plugin module: [tomcat.chart.py](../collectors/python.d.plugin/tomcat)<br/>configuration file: [python.d/tomcat.conf](../collectors/python.d.plugin/tomcat)| -tomcat|BASH<br/>Shell Script|Connects to a tomcat server (local or remote) to collect real-time performance metrics.<br/><br/>DEPRECATED IN FAVOR OF THE PYTHON ONE. It is still supplied only as an example module to shell scripting plugins.<br/> <br/>Netdata plugin: [charts.d.plugin](../collectors/charts.d.plugin#chartsdplugin)<br/>plugin module: [tomcat.chart.sh](../collectors/charts.d.plugin/tomcat)<br/>configuration file: [charts.d/tomcat.conf](../collectors/charts.d.plugin/tomcat)| - +| application | language | notes | +|:---------:|:------:|:----| +| apache|python<br/>v2 or v3|Connects to multiple apache servers (local or remote) to collect real-time performance metrics.<br/> <br/>Netdata plugin: [python.d.plugin](../collectors/python.d.plugin)<br/>plugin module: [apache.chart.py](../collectors/python.d.plugin/apache)<br/>configuration file: [python.d/apache.conf](../collectors/python.d.plugin/apache)| +| apache|BASH<br/>Shell Script|Connects to an apache server (local or remote) to collect real-time performance metrics.<br/><br/>DEPRECATED IN FAVOR OF THE PYTHON ONE. It is still supplied only as an example module to shell scripting plugins.<br/> <br/>Netdata plugin: [charts.d.plugin](../collectors/charts.d.plugin#chartsdplugin)<br/>plugin module: [apache.chart.sh](../collectors/charts.d.plugin/apache)<br/>configuration file: [charts.d/apache.conf](../collectors/charts.d.plugin/apache)| +| ipfs|python<br/>v2 or v3|Connects to multiple ipfs servers (local or remote) to collect real-time performance metrics.<br/> <br/>Netdata plugin: [python.d.plugin](../collectors/python.d.plugin)<br/>plugin module: [ipfs.chart.py](../collectors/python.d.plugin/ipfs)<br/>configuration file: [python.d/ipfs.conf](../collectors/python.d.plugin/ipfs)| +| litespeed|python<br/>v2 or v3|reads the litespeed `rtreport` files to collect metrics.<br/> <br/>Netdata plugin: [python.d.plugin](../collectors/python.d.plugin)<br/>plugin module: [litespeed.chart.py](../collectors/python.d.plugin/litespeed)<br/>configuration file: [python.d/litespeed.conf](../collectors/python.d.plugin/litespeed)| +| nginx|python<br/>v2 or v3|Connects to multiple nginx servers (local or remote) to collect real-time performance metrics.<br/> <br/>Netdata plugin: [python.d.plugin](../collectors/python.d.plugin)<br/>plugin module: [nginx.chart.py](../collectors/python.d.plugin/nginx)<br/>configuration file: [python.d/nginx.conf](../collectors/python.d.plugin/nginx)| +| nginx_plus|python<br/>v2 or v3|Connects to multiple nginx_plus servers (local or remote) to collect real-time performance metrics.<br/> <br/>Netdata plugin: [python.d.plugin](../collectors/python.d.plugin)<br/>plugin module: [nginx_plus.chart.py](../collectors/python.d.plugin/nginx_plus)<br/>configuration file: [python.d/nginx_plus.conf](../collectors/python.d.plugin/nginx_plus)| +| nginx|BASH<br/>Shell Script|Connects to an nginx server (local or remote) to collect real-time performance metrics.<br/><br/>DEPRECATED IN FAVOR OF THE PYTHON ONE. It is still supplied only as an example module to shell scripting plugins.<br/> <br/>Netdata plugin: [charts.d.plugin](../collectors/charts.d.plugin#chartsdplugin)<br/>plugin module: [nginx.chart.sh](../collectors/charts.d.plugin/nginx)<br/>configuration file: [charts.d/nginx.conf](../collectors/charts.d.plugin/nginx)| +| phpfpm|python<br/>v2 or v3|Connects to multiple phpfpm servers (local or remote) to collect real-time performance metrics.<br/> <br/>Netdata plugin: [python.d.plugin](../collectors/python.d.plugin)<br/>plugin module: [phpfpm.chart.py](../collectors/python.d.plugin/phpfpm)<br/>configuration file: [python.d/phpfpm.conf](../collectors/python.d.plugin/phpfpm)| +| phpfpm|BASH<br/>Shell Script|Connects to one or more phpfpm servers (local or remote) to collect real-time performance metrics.<br/><br/>DEPRECATED IN FAVOR OF THE PYTHON ONE. It is still supplied only as an example module to shell scripting plugins.<br/> <br/>Netdata plugin: [charts.d.plugin](../collectors/charts.d.plugin#chartsdplugin)<br/>plugin module: [phpfpm.chart.sh](../collectors/charts.d.plugin/phpfpm)<br/>configuration file: [charts.d/phpfpm.conf](../collectors/charts.d.plugin/phpfpm)| +| tomcat|python<br/>v2 or v3|Connects to multiple tomcat servers (local or remote) to collect real-time performance metrics.<br/> <br/>Netdata plugin: [python.d.plugin](../collectors/python.d.plugin)<br/>plugin module: [tomcat.chart.py](../collectors/python.d.plugin/tomcat)<br/>configuration file: [python.d/tomcat.conf](../collectors/python.d.plugin/tomcat)| +| tomcat|BASH<br/>Shell Script|Connects to a tomcat server (local or remote) to collect real-time performance metrics.<br/><br/>DEPRECATED IN FAVOR OF THE PYTHON ONE. It is still supplied only as an example module to shell scripting plugins.<br/> <br/>Netdata plugin: [charts.d.plugin](../collectors/charts.d.plugin#chartsdplugin)<br/>plugin module: [tomcat.chart.sh](../collectors/charts.d.plugin/tomcat)<br/>configuration file: [charts.d/tomcat.conf](../collectors/charts.d.plugin/tomcat)| --- ### Web Log Parsers -application|language|notes| -:---------:|:------:|:----| -web_log|python<br/>v2 or v3|powerful plugin, capable of incrementally parsing any number of web server log files <br/> <br/>Netdata plugin: [python.d.plugin](../collectors/python.d.plugin)<br/>plugin module: [web_log.chart.py](../collectors/python.d.plugin/web_log)<br/>configuration file: [python.d/web_log.conf](../collectors/python.d.plugin/web_log)| - +| application|language|notes| +|:---------:|:------:|:----| +| web_log|python<br/>v2 or v3|powerful plugin, capable of incrementally parsing any number of web server log files <br/> <br/>Netdata plugin: [python.d.plugin](../collectors/python.d.plugin)<br/>plugin module: [web_log.chart.py](../collectors/python.d.plugin/web_log)<br/>configuration file: [python.d/web_log.conf](../collectors/python.d.plugin/web_log)| --- ### Database Servers -application|language|notes| -:---------:|:------:|:----| -couchdb|python<br/>v2 or v3|Connects to multiple couchdb servers (local or remote) to collect real-time performance metrics.<br/> <br/>Netdata plugin: [python.d.plugin](../collectors/python.d.plugin)<br/>plugin module: [couchdb.chart.py](../collectors/python.d.plugin/couchdb)<br/>configuration file: [python.d/couchdb.conf](../collectors/python.d.plugin/couchdb)| -memcached|python<br/>v2 or v3|Connects to multiple memcached servers (local or remote) to collect real-time performance metrics.<br/> <br/>Netdata plugin: [python.d.plugin](../collectors/python.d.plugin)<br/>plugin module: [memcached.chart.py](../collectors/python.d.plugin/memcached)<br/>configuration file: [python.d/memcached.conf](../collectors/python.d.plugin/memcached)| -mongodb|python<br/>v2 or v3|Connects to multiple `mongodb` servers (local or remote) to collect real-time performance metrics.<br/> <br/>Requires package `python-pymongo`.<br/> <br/>Netdata plugin: [python.d.plugin](../collectors/python.d.plugin)<br/>plugin module: [mongodb.chart.py](../collectors/python.d.plugin/mongodb)<br/>configuration file: [python.d/mongodb.conf](../collectors/python.d.plugin/mongodb)| -mysql<br/>mariadb|python<br/>v2 or v3|Connects to multiple mysql or mariadb servers (local or remote) to collect real-time performance metrics.<br/> <br/>Requires package `python-mysqldb` (faster and preferred), or `python-pymysql`. <br/> <br/>Netdata plugin: [python.d.plugin](../collectors/python.d.plugin)<br/>plugin module: [mysql.chart.py](../collectors/python.d.plugin/mysql)<br/>configuration file: [python.d/mysql.conf](../collectors/python.d.plugin/mysql)| -mysql<br/>mariadb|BASH<br/>Shell Script|Connects to multiple mysql or mariadb servers (local or remote) to collect real-time performance metrics.<br/><br/>DEPRECATED IN FAVOR OF THE PYTHON ONE. It is still supplied only as an example module to shell scripting plugins.<br/> <br/>Netdata plugin: [charts.d.plugin](../collectors/charts.d.plugin#chartsdplugin)<br/>plugin module: [mysql.chart.sh](../collectors/charts.d.plugin/mysql)<br/>configuration file: [charts.d/mysql.conf](../collectors/charts.d.plugin/mysql)| -postgres|python<br/>v2 or v3|Connects to multiple postgres servers (local or remote) to collect real-time performance metrics.<br/> <br/>Requires package `python-psycopg2`.<br/> <br/>Netdata plugin: [python.d.plugin](../collectors/python.d.plugin)<br/>plugin module: [postgres.chart.py](../collectors/python.d.plugin/postgres)<br/>configuration file: [python.d/postgres.conf](../collectors/python.d.plugin/postgres)| -redis|python<br/>v2 or v3|Connects to multiple redis servers (local or remote) to collect real-time performance metrics.<br/> <br/>Netdata plugin: [python.d.plugin](../collectors/python.d.plugin)<br/>plugin module: [redis.chart.py](../collectors/python.d.plugin/redis)<br/>configuration file: [python.d/redis.conf](../collectors/python.d.plugin/redis)| -rethinkdb|python<br/>v2 or v3|Connects to multiple rethinkdb servers (local or remote) to collect real-time metrics.<br/> <br/>Netdata plugin: [python.d.plugin](../collectors/python.d.plugin)<br/>plugin module: [rethinkdb.chart.py](../collectors/python.d.plugin/rethinkdbs)<br/>configuration file: [python.d/rethinkdb.conf](../collectors/python.d.plugin/rethinkdbs)| - +| application|language|notes| +|:---------:|:------:|:----| +| couchdb|python<br/>v2 or v3|Connects to multiple couchdb servers (local or remote) to collect real-time performance metrics.<br/> <br/>Netdata plugin: [python.d.plugin](../collectors/python.d.plugin)<br/>plugin module: [couchdb.chart.py](../collectors/python.d.plugin/couchdb)<br/>configuration file: [python.d/couchdb.conf](../collectors/python.d.plugin/couchdb)| +| memcached|python<br/>v2 or v3|Connects to multiple memcached servers (local or remote) to collect real-time performance metrics.<br/> <br/>Netdata plugin: [python.d.plugin](../collectors/python.d.plugin)<br/>plugin module: [memcached.chart.py](../collectors/python.d.plugin/memcached)<br/>configuration file: [python.d/memcached.conf](../collectors/python.d.plugin/memcached)| +| mongodb|python<br/>v2 or v3|Connects to multiple `mongodb` servers (local or remote) to collect real-time performance metrics.<br/> <br/>Requires package `python-pymongo`.<br/> <br/>Netdata plugin: [python.d.plugin](../collectors/python.d.plugin)<br/>plugin module: [mongodb.chart.py](../collectors/python.d.plugin/mongodb)<br/>configuration file: [python.d/mongodb.conf](../collectors/python.d.plugin/mongodb)| +| mysql<br/>mariadb|python<br/>v2 or v3|Connects to multiple mysql or mariadb servers (local or remote) to collect real-time performance metrics.<br/> <br/>Requires package `python-mysqldb` (faster and preferred), or `python-pymysql`. <br/> <br/>Netdata plugin: [python.d.plugin](../collectors/python.d.plugin)<br/>plugin module: [mysql.chart.py](../collectors/python.d.plugin/mysql)<br/>configuration file: [python.d/mysql.conf](../collectors/python.d.plugin/mysql)| +| mysql<br/>mariadb|BASH<br/>Shell Script|Connects to multiple mysql or mariadb servers (local or remote) to collect real-time performance metrics.<br/><br/>DEPRECATED IN FAVOR OF THE PYTHON ONE. It is still supplied only as an example module to shell scripting plugins.<br/> <br/>Netdata plugin: [charts.d.plugin](../collectors/charts.d.plugin#chartsdplugin)<br/>plugin module: [mysql.chart.sh](../collectors/charts.d.plugin/mysql)<br/>configuration file: [charts.d/mysql.conf](../collectors/charts.d.plugin/mysql)| +| postgres|python<br/>v2 or v3|Connects to multiple postgres servers (local or remote) to collect real-time performance metrics.<br/> <br/>Requires package `python-psycopg2`.<br/> <br/>Netdata plugin: [python.d.plugin](../collectors/python.d.plugin)<br/>plugin module: [postgres.chart.py](../collectors/python.d.plugin/postgres)<br/>configuration file: [python.d/postgres.conf](../collectors/python.d.plugin/postgres)| +| redis|python<br/>v2 or v3|Connects to multiple redis servers (local or remote) to collect real-time performance metrics.<br/> <br/>Netdata plugin: [python.d.plugin](../collectors/python.d.plugin)<br/>plugin module: [redis.chart.py](../collectors/python.d.plugin/redis)<br/>configuration file: [python.d/redis.conf](../collectors/python.d.plugin/redis)| +| rethinkdb|python<br/>v2 or v3|Connects to multiple rethinkdb servers (local or remote) to collect real-time metrics.<br/> <br/>Netdata plugin: [python.d.plugin](../collectors/python.d.plugin)<br/>plugin module: [rethinkdb.chart.py](../collectors/python.d.plugin/rethinkdbs)<br/>configuration file: [python.d/rethinkdb.conf](../collectors/python.d.plugin/rethinkdbs)| --- ### Social Sharing Servers -application|language|notes| -:---------:|:------:|:----| -retroshare|python<br/>v2 or v3|Connects to multiple retroshare servers (local or remote) to collect real-time performance metrics.<br/> <br/>netdata plugin: [python.d.plugin](../collectors/python.d.plugin)<br/>plugin module: [retroshare.chart.py](../collectors/python.d.plugin/retroshare)<br/>configuration file: [python.d/retroshare.conf](../collectors/python.d.plugin/retroshare)| - +| application | language | notes | +|:---------:|:------:|:----| +| retroshare | python<br/>v2 or v3|Connects to multiple retroshare servers (local or remote) to collect real-time performance metrics.<br/> <br/>Netdata plugin: [python.d.plugin](../collectors/python.d.plugin)<br/>plugin module: [retroshare.chart.py](../collectors/python.d.plugin/retroshare)<br/>configuration file: [python.d/retroshare.conf](../collectors/python.d.plugin/retroshare)| --- ### Proxy Servers -application|language|notes| -:---------:|:------:|:----| -squid|python<br/>v2 or v3|Connects to multiple squid servers (local or remote) to collect real-time performance metrics.<br/> <br/>netdata plugin: [python.d.plugin](../collectors/python.d.plugin)<br/>plugin module: [squid.chart.py](../collectors/python.d.plugin/squid)<br/>configuration file: [python.d/squid.conf](../collectors/python.d.plugin/squid)| -squid|BASH<br/>Shell Script|Connects to a squid server (local or remote) to collect real-time performance metrics.<br/><br/>DEPRECATED IN FAVOR OF THE PYTHON ONE. It is still supplied only as an example module to shell scripting plugins.<br/> <br/>Netdata plugin: [charts.d.plugin](../collectors/charts.d.plugin#chartsdplugin)<br/>plugin module: [squid.chart.sh](../collectors/charts.d.plugin/squid)<br/>configuration file: [charts.d/squid.conf](../collectors/charts.d.plugin/squid)| - +|application|language|notes| +|:---------:|:------:|:----| +|squid|python<br/>v2 or v3|Connects to multiple squid servers (local or remote) to collect real-time performance metrics.<br/> <br/>Netdata plugin: [python.d.plugin](../collectors/python.d.plugin)<br/>plugin module: [squid.chart.py](../collectors/python.d.plugin/squid)<br/>configuration file: [python.d/squid.conf](../collectors/python.d.plugin/squid)| +|squid|BASH<br/>Shell Script|Connects to a squid server (local or remote) to collect real-time performance metrics.<br/><br/>DEPRECATED IN FAVOR OF THE PYTHON ONE. It is still supplied only as an example module to shell scripting plugins.<br/> <br/>Netdata plugin: [charts.d.plugin](../collectors/charts.d.plugin#chartsdplugin)<br/>plugin module: [squid.chart.sh](../collectors/charts.d.plugin/squid)<br/>configuration file: [charts.d/squid.conf](../collectors/charts.d.plugin/squid)| --- ### HTTP Accelerators -application|language|notes| -:---------:|:------:|:----| -varnish|python<br/>v2 or v3|Uses the varnishstat command to provide varnish cache statistics (client metrics, cache perfomance, thread-related metrics, backend health, memory usage etc.).<br/> <br/>Netdata plugin: [python.d.plugin](../collectors/python.d.plugin)<br/>plugin module: [varnish.chart.py](../collectors/python.d.plugin/varnish)<br/>configuration file: [python.d/varnish.conf](../collectors/python.d.plugin/varnish)| - +| application|language|notes| +|:---------:|:------:|:----| +| varnish|python<br/>v2 or v3|Uses the varnishstat command to provide varnish cache statistics (client metrics, cache perfomance, thread-related metrics, backend health, memory usage etc.).<br/> <br/>Netdata plugin: [python.d.plugin](../collectors/python.d.plugin)<br/>plugin module: [varnish.chart.py](../collectors/python.d.plugin/varnish)<br/>configuration file: [python.d/varnish.conf](../collectors/python.d.plugin/varnish)| --- ### Search Engines -application|language|notes| -:---------:|:------:|:----| -elasticsearch|python<br/>v2 or v3|Monitor elasticsearch performance and health metrics.<br/> <br/>Netdata plugin: [python.d.plugin](../collectors/python.d.plugin)<br/>plugin module: [elasticsearch.chart.py](../collectors/python.d.plugin/elasticsearch)<br/>configuration file: [python.d/elasticsearch.conf](../collectors/python.d.plugin/elasticsearch)| - +| application|language|notes| +|:---------:|:------:|:----| +| elasticsearch|python<br/>v2 or v3|Monitor elasticsearch performance and health metrics.<br/> <br/>Netdata plugin: [python.d.plugin](../collectors/python.d.plugin)<br/>plugin module: [elasticsearch.chart.py](../collectors/python.d.plugin/elasticsearch)<br/>configuration file: [python.d/elasticsearch.conf](../collectors/python.d.plugin/elasticsearch)| --- ### Name Servers -application|language|notes| -:---------:|:------:|:----| -named|node.js|Connects to multiple named (ISC-Bind) servers (local or remote) to collect real-time performance metrics. All versions of bind after 9.9.10 are supported.<br/> <br/>Netdata plugin: [node.d.plugin](../collectors/node.d.plugin#nodedplugin)<br/>plugin module: [named.node.js](../collectors/node.d.plugin/named)<br/>configuration file: [node.d/named.conf](../collectors/node.d.plugin/named)| -bind_rndc|python<br/>v2 or v3|Parses named.stats dump file to collect real-time performance metrics. All versions of bind after 9.6 are supported.<br/> <br/>Netdata plugin: [python.d.plugin](../collectors/python.d.plugin)<br/>plugin module: [bind_rndc.chart.py](../collectors/python.d.plugin/bind_rndc)<br/>configuration file: [python.d/bind_rndc.conf](../collectors/python.d.plugin/bind_rndc)| -nsd|python<br/>v2 or v3|Charts the nsd received queries and zones.<br/> <br/>Netdata plugin: [python.d.plugin](../collectors/python.d.plugin)<br/>plugin module: [nsd.chart.py](../collectors/python.d.plugin/nsd)<br/>configuration file: [python.d/nsd.conf](../collectors/python.d.plugin/nsd) -powerdns|python<br/>v2 or v3|Monitors powerdns performance and health metrics <br/> <br/>Netdata plugin: [python.d.plugin](../collectors/python.d.plugin)<br/>plugin module: [powerdns.chart.py](../collectors/python.d.plugin/powerdns)<br/>configuration file: [python.d/powerdns.conf](../collectors/python.d.plugin/powerdns)| -dnsdist|python<br/>v2 or v3|Monitors dnsdist performance and health metrics <br/> <br/>Netdata plugin: [python.d.plugin](../collectors/python.d.plugin)<br/>plugin module: [dnsdist.chart.py](../collectors/python.d.plugin/dnsdist)<br/>configuration file: [python.d/dnsdist.conf](../collectors/python.d.plugin/dnsdist)| -unbound|python<br/>v2 or v3|Monitors Unbound performance and resource usage metrics <br/> <br/>Netdata plugin: [python.d.plugin](../collectors/python.d.plugin)<br/>plugin module: [unbound.chart.py](../collectors/python.d.plugin/unbound)<br/>configuration file: [python.d/unbound.conf](../collectors/python.d.plugin/unbound)| - +| application|language|notes| +|:---------:|:------:|:----| +| named|node.js|Connects to multiple named (ISC-Bind) servers (local or remote) to collect real-time performance metrics. All versions of bind after 9.9.10 are supported.<br/> <br/>Netdata plugin: [node.d.plugin](../collectors/node.d.plugin#nodedplugin)<br/>plugin module: [named.node.js](../collectors/node.d.plugin/named)<br/>configuration file: [node.d/named.conf](../collectors/node.d.plugin/named)| +| bind_rndc|python<br/>v2 or v3|Parses named.stats dump file to collect real-time performance metrics. All versions of bind after 9.6 are supported.<br/> <br/>Netdata plugin: [python.d.plugin](../collectors/python.d.plugin)<br/>plugin module: [bind_rndc.chart.py](../collectors/python.d.plugin/bind_rndc)<br/>configuration file: [python.d/bind_rndc.conf](../collectors/python.d.plugin/bind_rndc)| +| nsd|python<br/>v2 or v3|Charts the nsd received queries and zones.<br/> <br/>Netdata plugin: [python.d.plugin](../collectors/python.d.plugin)<br/>plugin module: [nsd.chart.py](../collectors/python.d.plugin/nsd)<br/>configuration file: [python.d/nsd.conf](../collectors/python.d.plugin/nsd)| +| powerdns|python<br/>v2 or v3|Monitors powerdns performance and health metrics <br/> <br/>Netdata plugin: [python.d.plugin](../collectors/python.d.plugin)<br/>plugin module: [powerdns.chart.py](../collectors/python.d.plugin/powerdns)<br/>configuration file: [python.d/powerdns.conf](../collectors/python.d.plugin/powerdns)| +| dnsdist|python<br/>v2 or v3|Monitors dnsdist performance and health metrics <br/> <br/>Netdata plugin: [python.d.plugin](../collectors/python.d.plugin)<br/>plugin module: [dnsdist.chart.py](../collectors/python.d.plugin/dnsdist)<br/>configuration file: [python.d/dnsdist.conf](../collectors/python.d.plugin/dnsdist)| +| unbound|python<br/>v2 or v3|Monitors Unbound performance and resource usage metrics <br/> <br/>Netdata plugin: [python.d.plugin](../collectors/python.d.plugin)<br/>plugin module: [unbound.chart.py](../collectors/python.d.plugin/unbound)<br/>configuration file: [python.d/unbound.conf](../collectors/python.d.plugin/unbound)| --- ### DHCP Servers -application|language|notes| -:---------:|:------:|:----| -isc dhcp|python<br/>v2 or v3|Monitor lease database to show all active leases.<br/> <br/>Python v2 requires package `python-ipaddress`.<br/> <br/>Netdata plugin: [python.d.plugin](../collectors/python.d.plugin)<br/>plugin module: [isc-dhcpd.chart.py](../collectors/python.d.plugin/isc_dhcpd)<br/>configuration file: [python.d/isc-dhcpd.conf](../collectors/python.d.plugin/isc_dhcpd)| - +| application|language|notes| +|:---------:|:------:|:----| +| isc dhcp|python<br/>v2 or v3|Monitor lease database to show all active leases.<br/> <br/>Python v2 requires package `python-ipaddress`.<br/> <br/>Netdata plugin: [python.d.plugin](../collectors/python.d.plugin)<br/>plugin module: [isc-dhcpd.chart.py](../collectors/python.d.plugin/isc_dhcpd)<br/>configuration file: [python.d/isc-dhcpd.conf](../collectors/python.d.plugin/isc_dhcpd)| --- ### Load Balancers -application|language|notes| -:---------:|:------:|:----| -haproxy|python<br/>v2 or v3|Monitor frontend, backend and health metrics.<br/> <br/>Netdata plugin: [python.d.plugin](../collectors/python.d.plugin)<br/>plugin module: [haproxy.chart.py](../collectors/python.d.plugin/haproxy)<br/>configuration file: [python.d/haproxy.conf](../collectors/python.d.plugin/haproxy)| -traefik|python<br/>v2 or v3|Connects to multiple traefik instances (local or remote) to collect API metrics (response status code, response time, average response time and server uptime).<br/> <br/>Netdata plugin: [python.d.plugin](../collectors/python.d.plugin)<br/>plugin module: [traefik.chart.py](../collectors/python.d.plugin/traefik)<br/>configuration file: [python.d/traefik.conf](../collectors/python.d.plugin/traefik)| +| application|language|notes| +|:---------:|:------:|:----| +| haproxy|python<br/>v2 or v3|Monitor frontend, backend and health metrics.<br/> <br/>Netdata plugin: [python.d.plugin](../collectors/python.d.plugin)<br/>plugin module: [haproxy.chart.py](../collectors/python.d.plugin/haproxy)<br/>configuration file: [python.d/haproxy.conf](../collectors/python.d.plugin/haproxy)| +| traefik|python<br/>v2 or v3|Connects to multiple traefik instances (local or remote) to collect API metrics (response status code, response time, average response time and server uptime).<br/> <br/>Netdata plugin: [python.d.plugin](../collectors/python.d.plugin)<br/>plugin module: [traefik.chart.py](../collectors/python.d.plugin/traefik)<br/>configuration file: [python.d/traefik.conf](../collectors/python.d.plugin/traefik)| --- ### Message Brokers -application|language|notes| -:---------:|:------:|:----| -rabbitmq|python<br/>v2 or v3|Monitor rabbitmq performance and health metrics.<br/> <br/>Netdata plugin: [python.d.plugin](../collectors/python.d.plugin)<br/>plugin module: [rabbitmq.chart.py](../collectors/python.d.plugin/rabbitmq)<br/>configuration file: [python.d/rabbitmq.conf](../collectors/python.d.plugin/rabbitmq)| -beanstalkd|python<br/>v2 or v3|Provides server and tube level statistics.<br/> <br/>Requires beanstalkc python package (`pip install beanstalkc` or install package `python-beanstalkc`, which also installs `python-yaml`).<br/> <br/>Netdata plugin: [python.d.plugin](../collectors/python.d.plugin)<br/>plugin module: [beanstalk.chart.py](../collectors/python.d.plugin/beanstalk)<br/>configuration file: [python.d/beanstalk.conf](../collectors/python.d.plugin/beanstalk)| - +| application | language|notes| +|:---------:|:------:|:----| +| rabbitmq | python<br/>v2 or v3|Monitor rabbitmq performance and health metrics.<br/> <br/>Netdata plugin: [python.d.plugin](../collectors/python.d.plugin)<br/>plugin module: [rabbitmq.chart.py](../collectors/python.d.plugin/rabbitmq)<br/>configuration file: [python.d/rabbitmq.conf](../collectors/python.d.plugin/rabbitmq)| +| beanstalkd | python<br/>v2 or v3|Provides server and tube level statistics.<br/> <br/>Requires beanstalkc python package (`pip install beanstalkc` or install package `python-beanstalkc`, which also installs `python-yaml`).<br/> <br/>Netdata plugin: [python.d.plugin](../collectors/python.d.plugin)<br/>plugin module: [beanstalk.chart.py](../collectors/python.d.plugin/beanstalk)<br/>configuration file: [python.d/beanstalk.conf](../collectors/python.d.plugin/beanstalk)| --- ### UPS -application|language|notes| -:---------:|:------:|:----| -apcupsd|BASH<br/>Shell Script|Connects to an apcupsd server to collect real-time statistics of an APC UPS.<br/> <br/>Netdata plugin: [charts.d.plugin](../collectors/charts.d.plugin#chartsdplugin)<br/>plugin module: [apcupsd.chart.sh](../collectors/charts.d.plugin/apcupsd)<br/>configuration file: [charts.d/apcupsd.conf](../collectors/charts.d.plugin/apcupsd)| -nut|BASH<br/>Shell Script|Connects to a nut server (upsd) to collect real-time UPS statistics.<br/> <br/>Netdata plugin: [charts.d.plugin](../collectors/charts.d.plugin#chartsdplugin)<br/>plugin module: [nut.chart.sh](../collectors/charts.d.plugin/nut)<br/>configuration file: [charts.d/nut.conf](../collectors/charts.d.plugin/nut)| - +| application|language|notes| +|:---------:|:------:|:----| +| apcupsd|BASH<br/>Shell Script|Connects to an apcupsd server to collect real-time statistics of an APC UPS.<br/> <br/>Netdata plugin: [charts.d.plugin](../collectors/charts.d.plugin#chartsdplugin)<br/>plugin module: [apcupsd.chart.sh](../collectors/charts.d.plugin/apcupsd)<br/>configuration file: [charts.d/apcupsd.conf](../collectors/charts.d.plugin/apcupsd)| +| nut|BASH<br/>Shell Script|Connects to a nut server (upsd) to collect real-time UPS statistics.<br/> <br/>Netdata plugin: [charts.d.plugin](../collectors/charts.d.plugin#chartsdplugin)<br/>plugin module: [nut.chart.sh](../collectors/charts.d.plugin/nut)<br/>configuration file: [charts.d/nut.conf](../collectors/charts.d.plugin/nut)| --- ### RAID -application|language|notes| -:---------:|:------:|:----| -megacli|python<br/>v2 or v3|Collects adapter, physical drives and battery stats..<br/> <br/>Netdata plugin: [python.d.plugin](../collectors/python.d.plugin)<br/>plugin module: [megacli.chart.py](../collectors/python.d.plugin/megacli)<br/>configuration file: [python.d/megacli.conf](../collectors/python.d.plugin/megacli)| +|application|language|notes| +|:---------:|:------:|:----| +|megacli|python<br/>v2 or v3|Collects adapter, physical drives and battery stats..<br/> <br/>Netdata plugin: [python.d.plugin](../collectors/python.d.plugin)<br/>plugin module: [megacli.chart.py](../collectors/python.d.plugin/megacli)<br/>configuration file: [python.d/megacli.conf](../collectors/python.d.plugin/megacli)| --- ### Mail Servers -application|language|notes| -:---------:|:------:|:----| -dovecot|python<br/>v2 or v3|Connects to multiple dovecot servers (local or remote) to collect real-time performance metrics.<br/> <br/>Netdata plugin: [python.d.plugin](../collectors/python.d.plugin)<br/>plugin module: [dovecot.chart.py](../collectors/python.d.plugin/dovecot)<br/>configuration file: [python.d/dovecot.conf](../collectors/python.d.plugin/dovecot)| -exim|python<br/>v2 or v3|Charts the exim queue size.<br/> <br/>Netdata plugin: [python.d.plugin](../collectors/python.d.plugin)<br/>plugin module: [exim.chart.py](../collectors/python.d.plugin/exim)<br/>configuration file: [python.d/exim.conf](../collectors/python.d.plugin/exim)| -exim|BASH<br/>Shell Script|Charts the exim queue size.<br/><br/>DEPRECATED IN FAVOR OF THE PYTHON ONE. It is still supplied only as an example module to shell scripting plugins.<br/> <br/>Netdata plugin: [charts.d.plugin](../collectors/charts.d.plugin#chartsdplugin)<br/>plugin module: [exim.chart.sh](../collectors/charts.d.plugin/exim)<br/>configuration file: [charts.d/exim.conf](../collectors/charts.d.plugin/exim)| -postfix|python<br/>v2 or v3|Charts the postfix queue size (supports multiple queues).<br/> <br/>Netdata plugin: [python.d.plugin](../collectors/python.d.plugin)<br/>plugin module: [postfix.chart.py](../collectors/python.d.plugin/postfix)<br/>configuration file: [python.d/postfix.conf](../collectors/python.d.plugin/postfix)| -postfix|BASH<br/>Shell Script|Charts the postfix queue size.<br/><br/>DEPRECATED IN FAVOR OF THE PYTHON ONE. It is still supplied only as an example module to shell scripting plugins.<br/> <br/>Netdata plugin: [charts.d.plugin](../collectors/charts.d.plugin#chartsdplugin)<br/>plugin module: [postfix.chart.sh](../collectors/charts.d.plugin/postfix)<br/>configuration file: [charts.d/postfix.conf](../collectors/charts.d.plugin/postfix)| - +| application|language|notes| +|:---------:|:------:|:----| +| dovecot|python<br/>v2 or v3|Connects to multiple dovecot servers (local or remote) to collect real-time performance metrics.<br/> <br/>Netdata plugin: [python.d.plugin](../collectors/python.d.plugin)<br/>plugin module: [dovecot.chart.py](../collectors/python.d.plugin/dovecot)<br/>configuration file: [python.d/dovecot.conf](../collectors/python.d.plugin/dovecot)| +| exim|python<br/>v2 or v3|Charts the exim queue size.<br/> <br/>Netdata plugin: [python.d.plugin](../collectors/python.d.plugin)<br/>plugin module: [exim.chart.py](../collectors/python.d.plugin/exim)<br/>configuration file: [python.d/exim.conf](../collectors/python.d.plugin/exim)| +| exim|BASH<br/>Shell Script|Charts the exim queue size.<br/><br/>DEPRECATED IN FAVOR OF THE PYTHON ONE. It is still supplied only as an example module to shell scripting plugins.<br/> <br/>Netdata plugin: [charts.d.plugin](../collectors/charts.d.plugin#chartsdplugin)<br/>plugin module: [exim.chart.sh](../collectors/charts.d.plugin/exim)<br/>configuration file: [charts.d/exim.conf](../collectors/charts.d.plugin/exim)| +| postfix|python<br/>v2 or v3|Charts the postfix queue size (supports multiple queues).<br/> <br/>Netdata plugin: [python.d.plugin](../collectors/python.d.plugin)<br/>plugin module: [postfix.chart.py](../collectors/python.d.plugin/postfix)<br/>configuration file: [python.d/postfix.conf](../collectors/python.d.plugin/postfix)| +| postfix|BASH<br/>Shell Script|Charts the postfix queue size.<br/><br/>DEPRECATED IN FAVOR OF THE PYTHON ONE. It is still supplied only as an example module to shell scripting plugins.<br/> <br/>Netdata plugin: [charts.d.plugin](../collectors/charts.d.plugin#chartsdplugin)<br/>plugin module: [postfix.chart.sh](../collectors/charts.d.plugin/postfix)<br/>configuration file: [charts.d/postfix.conf](../collectors/charts.d.plugin/postfix)| --- ### File Servers -application|language|notes| -:---------:|:------:|:----| -NFS Client|`C`|This is handled entirely by the Netdata daemon.<br/> <br/>Configuration: `netdata.conf`, section `[plugin:proc:/proc/net/rpc/nfs]`. -NFS Server|`C`|This is handled entirely by the netdata daemon.<br/> <br/>Configuration: `netdata.conf`, section `[plugin:proc:/proc/net/rpc/nfsd]`. -samba|python<br/>v2 or v3|Performance metrics of Samba SMB2 file sharing.<br/> <br/>documentation page: [python.d.plugin module samba](../collectors/python.d.plugin/samba)<br/>netdata plugin: [python.d.plugin](../collectors/python.d.plugin)<br/>plugin module: [samba.chart.py](../collectors/python.d.plugin/samba)<br/>configuration file: [python.d/samba.conf](../collectors/python.d.plugin/samba)| +| application|language|notes| +|:---------:|:------:|:----| +| NFS Client|`C`|This is handled entirely by the Netdata daemon.<br/> <br/>Configuration: `netdata.conf`, section `[plugin:proc:/proc/net/rpc/nfs]`.| +| NFS Server|`C`|This is handled entirely by the `netdata` daemon.<br/> <br/>Configuration: `netdata.conf`, section `[plugin:proc:/proc/net/rpc/nfsd]`.| +| samba|python<br/>v2 or v3|Performance metrics of Samba SMB2 file sharing.<br/> <br/>documentation page: [python.d.plugin module samba](../collectors/python.d.plugin/samba)<br/>Netdata plugin: [python.d.plugin](../collectors/python.d.plugin)<br/>plugin module: [samba.chart.py](../collectors/python.d.plugin/samba)<br/>configuration file: [python.d/samba.conf](../collectors/python.d.plugin/samba)| --- ### Print Servers -application|language|notes| -:---------:|:------:|:----| -CUPS|C|Charts metrics of printers, jobs and other cups destinations.<br/> <br/>netdata plugin: [cups.plugin](../collectors/cups.plugin) +| application|language|notes| +|:---------:|:------:|:----| +| CUPS|C|Charts metrics of printers, jobs and other cups destinations.<br/> <br/>Netdata plugin: [cups.plugin](../collectors/cups.plugin)| --- ### Hypervisors -application|language|notes| -:---------:|:------:|:----| -xenstat|C|Collects host and domain statistics for XenServer or XCP-ng hypervisors.<br/> <br/>netdata plugin: [xenstat.plugin](../collectors/xenstat.plugin) +| application|language|notes| +|:---------:|:------:|:----| +| xenstat|C|Collects host and domain statistics for XenServer or XCP-ng hypervisors.<br/> <br/>Netdata plugin: [xenstat.plugin](../collectors/xenstat.plugin)| --- ### System -application|language|notes| -:---------:|:------:|:----| -apps|C|`apps.plugin` collects resource usage statistics for all processes running in the system. It groups the entire process tree and reports dozens of metrics for CPU utilization, memory footprint, disk I/O, swap memory, network connections, open files and sockets, etc. It reports metrics for application groups, users and user groups.<br/> <br/>[Documentation of `apps.plugin`](../collectors/apps.plugin/).<br/> <br/>Netdata plugin: [`apps_plugin.c`](../collectors/apps.plugin)<br/>configuration file: [`apps_groups.conf`](../collectors/apps.plugin)| -ioping|C|Charts disk latency statistics for a directory/file/device, using the `ioping` command. A recent (probably unreleased) version of ioping is required. The plugin supplied can install it in `/usr/local`.<br/> <br/>Netdata plugin: [ioping.plugin](../collectors/ioping.plugin) (this is a shell wrapper to start ioping - once ioping is started, Netdata and ioping communicate directly - it can also install the right version of ioping)<br/>configuration file: [ioping.conf](../collectors/ioping.plugin)| -perf|C|`perf.plugin` collects CPU performance metrics using hardware performance monitoring units (PMU).<br/> <br/>[Documentation of `perf.plugin`](../collectors/perf.plugin/).<br/> <br/>Netdata plugin: [`perf_plugin.c`](../collectors/perf.plugin)| -cpu_apps|BASH<br/>Shell Script|Collects the CPU utilization of select apps.<br/><br/>DEPRECATED IN FAVOR OF `apps.plugin`. It is still supplied only as an example module to shell scripting plugins.<br/> <br/>Netdata plugin: [charts.d.plugin](../collectors/charts.d.plugin#chartsdplugin)<br/>plugin module: [cpu_apps.chart.sh](../collectors/charts.d.plugin/cpu_apps)<br/>configuration file: [charts.d/cpu_apps.conf](../collectors/charts.d.plugin/cpu_apps)| -load_average|BASH<br/>Shell Script|Collects the current system load average.<br/><br/>DEPRECATED IN FAVOR OF THE NETDATA INTERNAL ONE. It is still supplied only as an example module to shell scripting plugins.<br/> <br/>Netdata plugin: [charts.d.plugin](../collectors/charts.d.plugin#chartsdplugin)<br/>plugin module: [load_average.chart.sh](../collectors/charts.d.plugin/load_average)<br/>configuration file: [charts.d/load_average.conf](../collectors/charts.d.plugin/load_average)| -mem_apps|BASH<br/>Shell Script|Collects the memory footprint of select applications.<br/><br/>DEPRECATED IN FAVOR OF `apps.plugin`. It is still supplied only as an example module to shell scripting plugins.<br/> <br/>Netdata plugin: [charts.d.plugin](../collectors/charts.d.plugin#chartsdplugin)<br/>plugin module: [mem_apps.chart.sh](../collectors/charts.d.plugin/mem_apps)<br/>configuration file: [charts.d/mem_apps.conf](../collectors/charts.d.plugin/mem_apps)| - +| application|language|notes| +|:---------:|:------:|:----| +| apps|C|`apps.plugin` collects resource usage statistics for all processes running in the system. It groups the entire process tree and reports dozens of metrics for CPU utilization, memory footprint, disk I/O, swap memory, network connections, open files and sockets, etc. It reports metrics for application groups, users and user groups.<br/> <br/>[Documentation of `apps.plugin`](../collectors/apps.plugin/).<br/> <br/>Netdata plugin: [`apps_plugin.c`](../collectors/apps.plugin)<br/>configuration file: [`apps_groups.conf`](../collectors/apps.plugin)| +| ioping|C|Charts disk latency statistics for a directory/file/device, using the `ioping` command. A recent (probably unreleased) version of ioping is required. The plugin supplied can install it in `/usr/local`.<br/> <br/>Netdata plugin: [ioping.plugin](../collectors/ioping.plugin) (this is a shell wrapper to start ioping - once ioping is started, Netdata and ioping communicate directly - it can also install the right version of ioping)<br/>configuration file: [ioping.conf](../collectors/ioping.plugin)| +| perf|C|`perf.plugin` collects CPU performance metrics using hardware performance monitoring units (PMU).<br/> <br/>[Documentation of `perf.plugin`](../collectors/perf.plugin/).<br/> <br/>Netdata plugin: [`perf_plugin.c`](../collectors/perf.plugin)| +| cpu_apps|BASH<br/>Shell Script|Collects the CPU utilization of select apps.<br/><br/>DEPRECATED IN FAVOR OF `apps.plugin`. It is still supplied only as an example module to shell scripting plugins.<br/> <br/>Netdata plugin: [charts.d.plugin](../collectors/charts.d.plugin#chartsdplugin)<br/>plugin module: [cpu_apps.chart.sh](../collectors/charts.d.plugin/cpu_apps)<br/>configuration file: [charts.d/cpu_apps.conf](../collectors/charts.d.plugin/cpu_apps)| +| load_average|BASH<br/>Shell Script|Collects the current system load average.<br/><br/>DEPRECATED IN FAVOR OF THE NETDATA INTERNAL ONE. It is still supplied only as an example module to shell scripting plugins.<br/> <br/>Netdata plugin: [charts.d.plugin](../collectors/charts.d.plugin#chartsdplugin)<br/>plugin module: [load_average.chart.sh](../collectors/charts.d.plugin/load_average)<br/>configuration file: [charts.d/load_average.conf](../collectors/charts.d.plugin/load_average)| +| mem_apps|BASH<br/>Shell Script|Collects the memory footprint of select applications.<br/><br/>DEPRECATED IN FAVOR OF `apps.plugin`. It is still supplied only as an example module to shell scripting plugins.<br/> <br/>Netdata plugin: [charts.d.plugin](../collectors/charts.d.plugin#chartsdplugin)<br/>plugin module: [mem_apps.chart.sh](../collectors/charts.d.plugin/mem_apps)<br/>configuration file: [charts.d/mem_apps.conf](../collectors/charts.d.plugin/mem_apps)| --- ### Sensors -application|language|notes| -:---------:|:------:|:----| -cpufreq|BASH<br/>Shell Script|Collects current CPU frequency from `/sys/devices`.<br/><br/>DEPRECATED IN FAVOR OF THE PYTHON ONE. It is still supplied only as an example module to shell scripting plugins.<br/> <br/>Netdata plugin: [charts.d.plugin](../collectors/charts.d.plugin#chartsdplugin)<br/>plugin module: [cpufreq.chart.sh](../collectors/charts.d.plugin/cpufreq)<br/>configuration file: [charts.d/cpufreq.conf](../collectors/charts.d.plugin/cpufreq)| -IPMI|C|Collects temperatures, voltages, currents, power, fans and `SEL` events from IPMI using `libipmimonitoring`.<br/>Check [Monitoring IPMI](../collectors/freeipmi.plugin/) for more information<br/> <br/>Netdata plugin: [freeipmi.plugin](../collectors/freeipmi.plugin)<br/>configuration file: none required - to enable it, compile/install Netdata with `--enable-plugin-freeipmi`| -hddtemp|python<br/>v2 or v3|Connects to multiple hddtemp servers (local or remote) to collect real-time performance metrics.<br/> <br/>Netdata plugin: [python.d.plugin](../collectors/python.d.plugin)<br/>plugin module: [hddtemp.chart.py](../collectors/python.d.plugin/hddtemp)<br/>configuration file: [python.d/hddtemp.conf](../collectors/python.d.plugin/hddtemp)| -hddtemp|BASH<br/>Shell Script|Connects to a hddtemp server (local or remote) to collect real-time performance metrics.<br/><br/>DEPRECATED IN FAVOR OF THE PYTHON ONE. It is still supplied only as an example module to shell scripting plugins.<br/> <br/>Netdata plugin: [charts.d.plugin](../collectors/charts.d.plugin#chartsdplugin)<br/>plugin module: [hddtemp.chart.sh](../collectors/charts.d.plugin/hddtemp)<br/>configuration file: [charts.d/hddtemp.conf](../collectors/charts.d.plugin/hddtemp)| -sensors|BASH<br/>Shell Script|Collects sensors values from files in `/sys`.<br/><br/>DEPRECATED IN FAVOR OF THE PYTHON ONE. It is still supplied only as an example module to shell scripting plugins.<br/> <br/>Netdata plugin: [charts.d.plugin](../collectors/charts.d.plugin#chartsdplugin)<br/>plugin module: [sensors.chart.sh](../collectors/charts.d.plugin/sensors)<br/>configuration file: [charts.d/sensors.conf](../collectors/charts.d.plugin/sensors)| -sensors|python<br/>v2 or v3|Uses `lm-sensors` to collect sensor data.<br/> <br/>Netdata plugin: [python.d.plugin](../collectors/python.d.plugin)<br/>plugin module: [sensors.chart.py](../collectors/python.d.plugin/sensors)<br/>configuration file: [python.d/sensors.conf](../collectors/python.d.plugin/sensors)| -smartd_log|python<br/>v2 or v3|Collects the S.M.A.R.T attributes from `smartd` log files.<br/> <br/>Netdata plugin: [python.d.plugin](../collectors/python.d.plugin)<br/>plugin module: [smartd_log.chart.py](../collectors/python.d.plugin/smartd_log)<br/>configuration file: [python.d/smartd_log.conf](../collectors/python.d.plugin/smartd_log)| -w1sensor|python<br/>v2 or v3|Collects data from connected 1-Wire sensors.<br/> <br/>Netdata plugin: [python.d.plugin](../collectors/python.d.plugin)<br/>plugin module: [w1sensor.chart.py](../collectors/python.d.plugin/w1sensor)<br/>configuration file: [python.d/w1sensor.conf](../collectors/python.d.plugin/w1sensor)| - +| application|language|notes| +|:---------:|:------:|:----| +| cpufreq|BASH<br/>Shell Script|Collects current CPU frequency from `/sys/devices`.<br/><br/>DEPRECATED IN FAVOR OF THE PYTHON ONE. It is still supplied only as an example module to shell scripting plugins.<br/> <br/>Netdata plugin: [charts.d.plugin](../collectors/charts.d.plugin#chartsdplugin)<br/>plugin module: [cpufreq.chart.sh](../collectors/charts.d.plugin/cpufreq)<br/>configuration file: [charts.d/cpufreq.conf](../collectors/charts.d.plugin/cpufreq)| +| IPMI|C|Collects temperatures, voltages, currents, power, fans and `SEL` events from IPMI using `libipmimonitoring`.<br/>Check [Monitoring IPMI](../collectors/freeipmi.plugin/) for more information<br/> <br/>Netdata plugin: [freeipmi.plugin](../collectors/freeipmi.plugin)<br/>configuration file: none required - to enable it, compile/install Netdata with `--enable-plugin-freeipmi`| +| hddtemp|python<br/>v2 or v3|Connects to multiple hddtemp servers (local or remote) to collect real-time performance metrics.<br/> <br/>Netdata plugin: [python.d.plugin](../collectors/python.d.plugin)<br/>plugin module: [hddtemp.chart.py](../collectors/python.d.plugin/hddtemp)<br/>configuration file: [python.d/hddtemp.conf](../collectors/python.d.plugin/hddtemp)| +| hddtemp|BASH<br/>Shell Script|Connects to a hddtemp server (local or remote) to collect real-time performance metrics.<br/><br/>DEPRECATED IN FAVOR OF THE PYTHON ONE. It is still supplied only as an example module to shell scripting plugins.<br/> <br/>Netdata plugin: [charts.d.plugin](../collectors/charts.d.plugin#chartsdplugin)<br/>plugin module: [hddtemp.chart.sh](../collectors/charts.d.plugin/hddtemp)<br/>configuration file: [charts.d/hddtemp.conf](../collectors/charts.d.plugin/hddtemp)| +| sensors|BASH<br/>Shell Script|Collects sensors values from files in `/sys`.<br/><br/>DEPRECATED IN FAVOR OF THE PYTHON ONE. It is still supplied only as an example module to shell scripting plugins.<br/> <br/>Netdata plugin: [charts.d.plugin](../collectors/charts.d.plugin#chartsdplugin)<br/>plugin module: [sensors.chart.sh](../collectors/charts.d.plugin/sensors)<br/>configuration file: [charts.d/sensors.conf](../collectors/charts.d.plugin/sensors)| +| sensors|python<br/>v2 or v3|Uses `lm-sensors` to collect sensor data.<br/> <br/>Netdata plugin: [python.d.plugin](../collectors/python.d.plugin)<br/>plugin module: [sensors.chart.py](../collectors/python.d.plugin/sensors)<br/>configuration file: [python.d/sensors.conf](../collectors/python.d.plugin/sensors)| +| smartd_log|python<br/>v2 or v3|Collects the S.M.A.R.T attributes from `smartd` log files.<br/> <br/>Netdata plugin: [python.d.plugin](../collectors/python.d.plugin)<br/>plugin module: [smartd_log.chart.py](../collectors/python.d.plugin/smartd_log)<br/>configuration file: [python.d/smartd_log.conf](../collectors/python.d.plugin/smartd_log)| +| w1sensor|python<br/>v2 or v3|Collects data from connected 1-Wire sensors.<br/> <br/>Netdata plugin: [python.d.plugin](../collectors/python.d.plugin)<br/>plugin module: [w1sensor.chart.py](../collectors/python.d.plugin/w1sensor)<br/>configuration file: [python.d/w1sensor.conf](../collectors/python.d.plugin/w1sensor)| --- ### Network -application|language|notes| -:---------:|:------:|:----| -ap|BASH<br/>Shell Script|Uses the `iw` command to provide statistics of wireless clients connected to a wireless access point running on this host (works well with `hostapd`).<br/> <br/>Netdata plugin: [charts.d.plugin](../collectors/charts.d.plugin#chartsdplugin)<br/>plugin module: [ap.chart.sh](../collectors/charts.d.plugin/ap)<br/>configuration file: [charts.d/ap.conf](../collectors/charts.d.plugin/ap)| -fping|C|Charts network latency statistics for any number of nodes, using the `fping` command. A recent (probably unreleased) version of fping is required. The plugin supplied can install it in `/usr/local`.<br/> <br/>Netdata plugin: [fping.plugin](../collectors/fping.plugin) (this is a shell wrapper to start fping - once fping is started, Netdata and fping communicate directly - it can also install the right version of fping)<br/>configuration file: [fping.conf](../collectors/fping.plugin)| -snmp|node.js|Connects to multiple snmp servers to collect real-time performance metrics.<br/> <br/>Netdata plugin: [node.d.plugin](../collectors/node.d.plugin#nodedplugin)<br/>plugin module: [snmp.node.js](../collectors/node.d.plugin/snmp)<br/>configuration file: [node.d/snmp.conf](../collectors/node.d.plugin/snmp)| -nfacct|C|collects netfilter firewall, connection tracker and accounting metrics using `libmnl` and `libnetfilter_acct`| -dns_query_time|python<br/>v2 or v3|Provides DNS query time statistics.<br/> <br/>Requires package `dnspython` (`pip install dnspython` or install package `python-dnspython`).<br/> <br/>Netdata plugin: [python.d.plugin](../collectors/python.d.plugin)<br/>plugin module: [dns_query_time.chart.py](../collectors/python.d.plugin/dns_query_time)<br/>configuration file: [python.d/dns_query_time.conf](../collectors/python.d.plugin/dns_query_time)| -http|python<br />v2 or v3|Monitors a generic web page for status code and returned content in HTML -port|ptyhon<br />v2 or v3|Checks if a generic TCP port for its availability and response time - +| application|language|notes| +|:---------:|:------:|:----| +| ap|BASH<br/>Shell Script|Uses the `iw` command to provide statistics of wireless clients connected to a wireless access point running on this host (works well with `hostapd`).<br/> <br/>Netdata plugin: [charts.d.plugin](../collectors/charts.d.plugin#chartsdplugin)<br/>plugin module: [ap.chart.sh](../collectors/charts.d.plugin/ap)<br/>configuration file: [charts.d/ap.conf](../collectors/charts.d.plugin/ap)| +| fping|C|Charts network latency statistics for any number of nodes, using the `fping` command. A recent (probably unreleased) version of fping is required. The plugin supplied can install it in `/usr/local`.<br/> <br/>Netdata plugin: [fping.plugin](../collectors/fping.plugin) (this is a shell wrapper to start fping - once fping is started, Netdata and fping communicate directly - it can also install the right version of fping)<br/>configuration file: [fping.conf](../collectors/fping.plugin)| +| snmp|node.js|Connects to multiple snmp servers to collect real-time performance metrics.<br/> <br/>Netdata plugin: [node.d.plugin](../collectors/node.d.plugin#nodedplugin)<br/>plugin module: [snmp.node.js](../collectors/node.d.plugin/snmp)<br/>configuration file: [node.d/snmp.conf](../collectors/node.d.plugin/snmp)| +| nfacct|C|collects netfilter firewall, connection tracker and accounting metrics using `libmnl` and `libnetfilter_acct`| +| dns_query_time|python<br/>v2 or v3|Provides DNS query time statistics.<br/> <br/>Requires package `dnspython` (`pip install dnspython` or install package `python-dnspython`).<br/> <br/>Netdata plugin: [python.d.plugin](../collectors/python.d.plugin)<br/>plugin module: [dns_query_time.chart.py](../collectors/python.d.plugin/dns_query_time)<br/>configuration file: [python.d/dns_query_time.conf](../collectors/python.d.plugin/dns_query_time)| +| http|python<br />v2 or v3|Monitors a generic web page for status code and returned content in HTML| +| port|ptyhon<br />v2 or v3|Checks if a generic TCP port for its availability and response time| --- ### Time Servers -application|language|notes| -:---------:|:------:|:----| -chrony|python<br/>v2 or v3|Uses the chronyc command to provide chrony statistics (Frequency, Last offset, RMS offset, Residual freq, Root delay, Root dispersion, Skew, System time).<br/> <br/>Netdata plugin: [python.d.plugin](../collectors/python.d.plugin)<br/>plugin module: [chrony.chart.py](../collectors/python.d.plugin/chrony)<br/>configuration file: [python.d/chrony.conf](../collectors/python.d.plugin/chrony)| -ntpd|python<br/>v2 or v3|Connects to multiple ntpd servers (local or remote) to provide statistics of system variables and optional also peer variables (if enabled in the configuration).<br/> <br/>Netdata plugin: [python.d.plugin](../collectors/python.d.plugin)<br/>plugin module: [ntpd.chart.py](../collectors/python.d.plugin/ntpd)<br/>configuration file: [python.d/ntpd.conf](../collectors/python.d.plugin/ntpd)| - +| application|language|notes| +|:---------:|:------:|:----| +| chrony|python<br/>v2 or v3|Uses the chronyc command to provide chrony statistics (Frequency, Last offset, RMS offset, Residual freq, Root delay, Root dispersion, Skew, System time).<br/> <br/>Netdata plugin: [python.d.plugin](../collectors/python.d.plugin)<br/>plugin module: [chrony.chart.py](../collectors/python.d.plugin/chrony)<br/>configuration file: [python.d/chrony.conf](../collectors/python.d.plugin/chrony)| +| ntpd|python<br/>v2 or v3|Connects to multiple ntpd servers (local or remote) to provide statistics of system variables and optional also peer variables (if enabled in the configuration).<br/> <br/>Netdata plugin: [python.d.plugin](../collectors/python.d.plugin)<br/>plugin module: [ntpd.chart.py](../collectors/python.d.plugin/ntpd)<br/>configuration file: [python.d/ntpd.conf](../collectors/python.d.plugin/ntpd)| --- ### Security -application|language|notes| -:---------:|:------:|:----| -freeradius|python<br/>v2 or v3|Uses the radclient command to provide freeradius statistics (authentication, accounting, proxy-authentication, proxy-accounting).<br/> <br/>Netdata plugin: [python.d.plugin](../collectors/python.d.plugin)<br/>plugin module: [freeradius.chart.py](../collectors/python.d.plugin/freeradius)<br/>configuration file: [python.d/freeradius.conf](../collectors/python.d.plugin/freeradius)| -openvpn|python<br/>v2 or v3|All data from openvpn-status.log in your dashboard! <br/> <br/>Netdata plugin: [python.d.plugin](../collectors/python.d.plugin)<br/>plugin module: [ovpn_status_log.chart.py](../collectors/python.d.plugin/ovpn_status_log)<br/>configuration file: [python.d/ovpn_status_log.conf](../collectors/python.d.plugin/ovpn_status_log)| -fail2ban|python<br/>v2 or v3|Monitor fail2ban log file to show all bans for all active jails <br/> <br/>Netdata plugin: [python.d.plugin](../collectors/python.d.plugin)<br/>plugin module: [fail2ban.chart.py](../collectors/python.d.plugin/fail2ban)<br/>configuration file: [python.d/fail2ban.conf](../collectors/python.d.plugin/fail2ban)| - +| application|language|notes| +|:---------:|:------:|:----| +| freeradius|python<br/>v2 or v3|Uses the radclient command to provide freeradius statistics (authentication, accounting, proxy-authentication, proxy-accounting).<br/> <br/>Netdata plugin: [python.d.plugin](../collectors/python.d.plugin)<br/>plugin module: [freeradius.chart.py](../collectors/python.d.plugin/freeradius)<br/>configuration file: [python.d/freeradius.conf](../collectors/python.d.plugin/freeradius)| +| openvpn|python<br/>v2 or v3|All data from openvpn-status.log in your dashboard! <br/> <br/>Netdata plugin: [python.d.plugin](../collectors/python.d.plugin)<br/>plugin module: [ovpn_status_log.chart.py](../collectors/python.d.plugin/ovpn_status_log)<br/>configuration file: [python.d/ovpn_status_log.conf](../collectors/python.d.plugin/ovpn_status_log)| +| fail2ban|python<br/>v2 or v3|Monitor fail2ban log file to show all bans for all active jails <br/> <br/>Netdata plugin: [python.d.plugin](../collectors/python.d.plugin)<br/>plugin module: [fail2ban.chart.py](../collectors/python.d.plugin/fail2ban)<br/>configuration file: [python.d/fail2ban.conf](../collectors/python.d.plugin/fail2ban)| --- ### Telephony Servers -application|language|notes| -:---------:|:------:|:----| -opensips|BASH<br/>Shell Script|Connects to an opensips server (local only) to collect real-time performance metrics.<br/> <br/>Netdata plugin: [charts.d.plugin](../collectors/charts.d.plugin#chartsdplugin)<br/>plugin module: [opensips.chart.sh](../collectors/charts.d.plugin/opensips)<br/>configuration file: [charts.d/opensips.conf](../collectors/charts.d.plugin/opensips)| - +| application|language|notes| +|:---------:|:------:|:----| +| opensips|BASH<br/>Shell Script|Connects to an opensips server (local only) to collect real-time performance metrics.<br/> <br/>Netdata plugin: [charts.d.plugin](../collectors/charts.d.plugin#chartsdplugin)<br/>plugin module: [opensips.chart.sh](../collectors/charts.d.plugin/opensips)<br/>configuration file: [charts.d/opensips.conf](../collectors/charts.d.plugin/opensips)| --- ### Go applications -application|language|notes| -:---------:|:------:|:----| -go_expvar|python<br/>v2 or v3|Parses metrics exposed by applications written in the Go programming language using the [expvar package](https://golang.org/pkg/expvar/).<br/> <br/>Netdata plugin: [python.d.plugin](../collectors/python.d.plugin)<br/>plugin module: [go_expvar.chart.py](../collectors/python.d.plugin/go_expvar)<br/>configuration file: [python.d/go_expvar.conf](../collectors/python.d.plugin/go_expvar)<br/>documentation: [Monitoring Go Applications](../collectors/python.d.plugin/go_expvar/)| - +| application|language|notes| +|:---------:|:------:|:----| +| go_expvar|python<br/>v2 or v3|Parses metrics exposed by applications written in the Go programming language using the [expvar package](https://golang.org/pkg/expvar/).<br/> <br/>Netdata plugin: [python.d.plugin](../collectors/python.d.plugin)<br/>plugin module: [go_expvar.chart.py](../collectors/python.d.plugin/go_expvar)<br/>configuration file: [python.d/go_expvar.conf](../collectors/python.d.plugin/go_expvar)<br/>documentation: [Monitoring Go Applications](../collectors/python.d.plugin/go_expvar/)| --- ### Household Appliances -application|language|notes| -:---------:|:------:|:----| -sma_webbox|node.js|Connects to multiple remote SMA webboxes to collect real-time performance metrics of the photovoltaic (solar) power generation.<br/> <br/>Netdata plugin: [node.d.plugin](../collectors/node.d.plugin#nodedplugin)<br/>plugin module: [sma_webbox.node.js](../collectors/node.d.plugin/sma_webbox)<br/>configuration file: [node.d/sma_webbox.conf](../collectors/node.d.plugin/sma_webbox)| -fronius|node.js|Connects to multiple remote Fronius Symo servers to collect real-time performance metrics of the photovoltaic (solar) power generation.<br/> <br/>Netdata plugin: [node.d.plugin](../collectors/node.d.plugin#nodedplugin)<br/>plugin module: [fronius.node.js](../collectors/node.d.plugin/fronius)<br/>configuration file: [node.d/fronius.conf](../collectors/node.d.plugin/fronius)| -stiebeleltron|node.js|Collects the temperatures and other metrics from your Stiebel Eltron heating system using their Internet Service Gateway (ISG web).<br/> <br/>Netdata plugin: [node.d.plugin](../collectors/node.d.plugin#nodedplugin)<br/>plugin module: [stiebeleltron.node.js](../collectors/node.d.plugin/stiebeleltron)<br/>configuration file: [node.d/stiebeleltron.conf](../collectors/node.d.plugin/stiebeleltron)| - +| application|language|notes| +|:---------:|:------:|:----| +| sma_webbox|node.js|Connects to multiple remote SMA webboxes to collect real-time performance metrics of the photovoltaic (solar) power generation.<br/> <br/>Netdata plugin: [node.d.plugin](../collectors/node.d.plugin#nodedplugin)<br/>plugin module: [sma_webbox.node.js](../collectors/node.d.plugin/sma_webbox)<br/>configuration file: [node.d/sma_webbox.conf](../collectors/node.d.plugin/sma_webbox)| +| fronius|node.js|Connects to multiple remote Fronius Symo servers to collect real-time performance metrics of the photovoltaic (solar) power generation.<br/> <br/>Netdata plugin: [node.d.plugin](../collectors/node.d.plugin#nodedplugin)<br/>plugin module: [fronius.node.js](../collectors/node.d.plugin/fronius)<br/>configuration file: [node.d/fronius.conf](../collectors/node.d.plugin/fronius)| +| stiebeleltron|node.js|Collects the temperatures and other metrics from your Stiebel Eltron heating system using their Internet Service Gateway (ISG web).<br/> <br/>Netdata plugin: [node.d.plugin](../collectors/node.d.plugin#nodedplugin)<br/>plugin module: [stiebeleltron.node.js](../collectors/node.d.plugin/stiebeleltron)<br/>configuration file: [node.d/stiebeleltron.conf](../collectors/node.d.plugin/stiebeleltron)| --- ### Java Processes -application|language|notes| -:---------:|:------:|:----| -Spring Boot Application|java|Monitors running Java [Spring Boot](https://spring.io/) applications that expose their metrics with the use of the **Spring Boot Actuator** included in Spring Boot library.<br/> <br/>Netdata plugin: [python.d.plugin](../collectors/python.d.plugin)<br/>plugin module: [springboot](../collectors/python.d.plugin/springboot)<br/>configuration file: [python.d/springboot.conf](../collectors/python.d.plugin/springboot) - +| application|language|notes| +|:---------:|:------:|:----| +| Spring Boot Application|java|Monitors running Java [Spring Boot](https://spring.io/) applications that expose their metrics with the use of the **Spring Boot Actuator** included in Spring Boot library.<br/> <br/>Netdata plugin: [python.d.plugin](../collectors/python.d.plugin)<br/>plugin module: [springboot](../collectors/python.d.plugin/springboot)<br/>configuration file: [python.d/springboot.conf](../collectors/python.d.plugin/springboot)| --- ### Provisioning Systems -application|language|notes| -:---------:|:------:|:----| -puppet|python<br/>v2 or v3|Connects to multiple Puppet Server and Puppet DB instances (local or remote) to collect real-time status metrics.<br/> <br/>Netdata plugin: [python.d.plugin](../collectors/python.d.plugin)<br/>plugin module: [puppet.chart.py](../collectors/python.d.plugin/puppet)<br/>configuration file: [python.d/puppet.conf](../collectors/python.d.plugin/puppet)| +| application|language|notes| +|:---------:|:------:|:----| +| puppet|python<br/>v2 or v3|Connects to multiple Puppet Server and Puppet DB instances (local or remote) to collect real-time status metrics.<br/> <br/>Netdata plugin: [python.d.plugin](../collectors/python.d.plugin)<br/>plugin module: [puppet.chart.py](../collectors/python.d.plugin/puppet)<br/>configuration file: [python.d/puppet.conf](../collectors/python.d.plugin/puppet)| --- ### Game Servers -application|language|notes| -:---------:|:------:|:----| -SpigotMC|Python<br/>v2 or v3|Monitors Spigot Minecraft server ticks per second and number of online players using the Minecraft remote console.<br/> <br/>Netdata plugin: [python.d.plugin](../collectors/python.d.plugin)<br/>plugin module: [spigotmc.chart.py](../collectors/python.d.plugin/spigotmc)<br/>configuration file: [python.d/spigotmc.conf](../collectors/python.d.plugin/spigotmc)| +| application|language|notes| +|:---------:|:------:|:----| +| SpigotMC|Python<br/>v2 or v3|Monitors Spigot Minecraft server ticks per second and number of online players using the Minecraft remote console.<br/> <br/>Netdata plugin: [python.d.plugin](../collectors/python.d.plugin)<br/>plugin module: [spigotmc.chart.py](../collectors/python.d.plugin/spigotmc)<br/>configuration file: [python.d/spigotmc.conf](../collectors/python.d.plugin/spigotmc)| --- ### Distributed Computing Clients -application|language|notes| -:---------:|:------:|:----| -BOINC|Python<br/>v2 or v3|Monitors task states for local and remote BOINC client software using the remote GUI RPC interface. Also provides alarms for a handful of error conditions. Requires manual configuration<br/> <br/>Netdata plugin: [python.d.plugin](../collectors/python.d.plugin)<br/>plugin module: [boinc.chart.py](../collectors/python.d.plugin/boinc)<br/>configuration file: [python.d/boinc.conf](../collectors/python.d.plugin/boinc)| +| application|language|notes| +|:---------:|:------:|:----| +| BOINC|Python<br/>v2 or v3|Monitors task states for local and remote BOINC client software using the remote GUI RPC interface. Also provides alarms for a handful of error conditions. Requires manual configuration<br/> <br/>Netdata plugin: [python.d.plugin](../collectors/python.d.plugin)<br/>plugin module: [boinc.chart.py](../collectors/python.d.plugin/boinc)<br/>configuration file: [python.d/boinc.conf](../collectors/python.d.plugin/boinc)| --- ### Skeleton Plugins -application|language|notes| -:---------:|:------:|:----| -example|BASH<br/>Shell Script|Skeleton plugin in BASH.<br/><br/>DEPRECATED IN FAVOR OF THE PYTHON ONE. It is still supplied only as an example module to shell scripting plugins.<br/> <br/>Netdata plugin: [charts.d.plugin](../collectors/charts.d.plugin#chartsdplugin)<br/>plugin module: [example.chart.sh](../collectors/charts.d.plugin/example)<br/>configuration file: [charts.d/example.conf](../collectors/charts.d.plugin/example)| -example|python<br/>v2 or v3|Skeleton plugin in Python.<br/> <br/>Netdata plugin: [python.d.plugin](../collectors/python.d.plugin)<br/>plugin module: [example.chart.py](../collectors/python.d.plugin/example)<br/>configuration file: [python.d/example.conf](../collectors/python.d.plugin/example)| +| application|language|notes| +|:---------:|:------:|:----| +| example|BASH<br/>Shell Script|Skeleton plugin in BASH.<br/><br/>DEPRECATED IN FAVOR OF THE PYTHON ONE. It is still supplied only as an example module to shell scripting plugins.<br/> <br/>Netdata plugin: [charts.d.plugin](../collectors/charts.d.plugin#chartsdplugin)<br/>plugin module: [example.chart.sh](../collectors/charts.d.plugin/example)<br/>configuration file: [charts.d/example.conf](../collectors/charts.d.plugin/example)| +| example|python<br/>v2 or v3|Skeleton plugin in Python.<br/> <br/>Netdata plugin: [python.d.plugin](../collectors/python.d.plugin)<br/>plugin module: [example.chart.py](../collectors/python.d.plugin/example)<br/>configuration file: [python.d/example.conf](../collectors/python.d.plugin/example)| -[]() +[](<>) diff --git a/docs/Charts.md b/docs/Charts.md index 42ac4453b..70d360a88 100644 --- a/docs/Charts.md +++ b/docs/Charts.md @@ -24,4 +24,4 @@ A context is a grouping of identical charts, for each instance of the hardware o For example, let's take the `net.packets` context. You will see on the dashboard as many charts with context net.packets as you have network interfaces (families). These charts will be named `net_packets.[family]`. For the example of the two interfaces `eth0` and `eth1`, you will see charts named `net_packets.eth0` and `net_packets.eth1`. Both of these charts show the exact same dimensions, but for different instances of a network interface. -[]() +[](<>) diff --git a/docs/Demo-Sites.md b/docs/Demo-Sites.md index 5a2ae5344..6bb501de4 100644 --- a/docs/Demo-Sites.md +++ b/docs/Demo-Sites.md @@ -2,19 +2,19 @@ Live demo installations of Netdata are available at **[https://www.netdata.cloud](https://www.netdata.cloud/#live-demo)**: -Location | Netdata demo URL | 60 mins reqs | VM Donated by -:-------:|:-----------------:|:----------:|:------------- -London (UK)|**[london.my-netdata.io](https://london.my-netdata.io)**<br/>(this is the global Netdata **registry** and has **named** and **mysql** charts)|[](https://london.my-netdata.io)|[DigitalOcean.com](https://m.do.co/c/83dc9f941745) -Atlanta (USA)|**[cdn77.my-netdata.io](https://cdn77.my-netdata.io)**<br/>(with **named** and **mysql** charts)|[](https://cdn77.my-netdata.io)|[CDN77.com](https://www.cdn77.com/) -Israel|**[octopuscs.my-netdata.io](https://octopuscs.my-netdata.io)**|[](https://octopuscs.my-netdata.io)|[OctopusCS.com](https://www.octopuscs.com) -Madrid (Spain)|**[stackscale.my-netdata.io](https://stackscale.my-netdata.io)**|[](https://stackscale.my-netdata.io)|[StackScale Spain](https://www.stackscale.es/) -Bangalore (India)|**[bangalore.my-netdata.io](https://bangalore.my-netdata.io)**|[](https://bangalore.my-netdata.io)|[DigitalOcean.com](https://m.do.co/c/83dc9f941745) -Frankfurt (Germany)|**[frankfurt.my-netdata.io](https://frankfurt.my-netdata.io)**|[](https://frankfurt.my-netdata.io)|[DigitalOcean.com](https://m.do.co/c/83dc9f941745) -New York (USA)|**[newyork.my-netdata.io](https://newyork.my-netdata.io)**|[](https://newyork.my-netdata.io)|[DigitalOcean.com](https://m.do.co/c/83dc9f941745) -San Francisco (USA)|**[sanfrancisco.my-netdata.io](https://sanfrancisco.my-netdata.io)**|[](https://sanfrancisco.my-netdata.io)|[DigitalOcean.com](https://m.do.co/c/83dc9f941745) -Singapore|**[singapore.my-netdata.io](https://singapore.my-netdata.io)**|[](https://singapore.my-netdata.io)|[DigitalOcean.com](https://m.do.co/c/83dc9f941745) -Toronto (Canada)|**[toronto.my-netdata.io](https://toronto.my-netdata.io)**|[](https://toronto.my-netdata.io)|[DigitalOcean.com](https://m.do.co/c/83dc9f941745) +| Location|Netdata demo URL|60 mins reqs|VM Donated by| +|:------:|:--------------:|:----------:|:------------| +| London (UK)|**[london.my-netdata.io](https://london.my-netdata.io)**<br/>(this is the global Netdata **registry** and has **named** and **mysql** charts)|[](https://london.my-netdata.io)|[DigitalOcean.com](https://m.do.co/c/83dc9f941745)| +| Atlanta (USA)|**[cdn77.my-netdata.io](https://cdn77.my-netdata.io)**<br/>(with **named** and **mysql** charts)|[](https://cdn77.my-netdata.io)|[CDN77.com](https://www.cdn77.com/)| +| Israel|**[octopuscs.my-netdata.io](https://octopuscs.my-netdata.io)**|[](https://octopuscs.my-netdata.io)|[OctopusCS.com](https://www.octopuscs.com)| +| Madrid (Spain)|**[stackscale.my-netdata.io](https://stackscale.my-netdata.io)**|[](https://stackscale.my-netdata.io)|[StackScale Spain](https://www.stackscale.es/)| +| Bangalore (India)|**[bangalore.my-netdata.io](https://bangalore.my-netdata.io)**|[](https://bangalore.my-netdata.io)|[DigitalOcean.com](https://m.do.co/c/83dc9f941745)| +| Frankfurt (Germany)|**[frankfurt.my-netdata.io](https://frankfurt.my-netdata.io)**|[](https://frankfurt.my-netdata.io)|[DigitalOcean.com](https://m.do.co/c/83dc9f941745)| +| New York (USA)|**[newyork.my-netdata.io](https://newyork.my-netdata.io)**|[](https://newyork.my-netdata.io)|[DigitalOcean.com](https://m.do.co/c/83dc9f941745)| +| San Francisco (USA)|**[sanfrancisco.my-netdata.io](https://sanfrancisco.my-netdata.io)**|[](https://sanfrancisco.my-netdata.io)|[DigitalOcean.com](https://m.do.co/c/83dc9f941745)| +| Singapore|**[singapore.my-netdata.io](https://singapore.my-netdata.io)**|[](https://singapore.my-netdata.io)|[DigitalOcean.com](https://m.do.co/c/83dc9f941745)| +| Toronto (Canada)|**[toronto.my-netdata.io](https://toronto.my-netdata.io)**|[](https://toronto.my-netdata.io)|[DigitalOcean.com](https://m.do.co/c/83dc9f941745)| -*Netdata dashboards are mobile and touch friendly.* +_Netdata dashboards are mobile and touch friendly._ -[]() +[](<>) diff --git a/docs/Donations-netdata-has-received.md b/docs/Donations-netdata-has-received.md index 062cb02b5..8b46980ae 100644 --- a/docs/Donations-netdata-has-received.md +++ b/docs/Donations-netdata-has-received.md @@ -2,17 +2,17 @@ This is a list of the donations we have received for Netdata (sorted alphabetically on their name): -what donated|related links|who donated|description of the donation -----:|:-----:|:---:|:----------- -Packages Distribution|-|**[PackageCloud.io](https://packagecloud.io/)**|**PackageCloud.io** donated to a free open-source subscription to their awesome Package Distribution services. -Cross Browser Testing|-|**[BrowserStack.com](https://www.browserstack.com/)**|**BrowserStack.com** donated a free subscription to their awesome Browser Testing services (all three of them: Live, Screenshots, Responsive). -Cloud VM|[cdn77.my-netdata.io](http://cdn77.my-netdata.io)|**[CDN77.com](https://www.cdn77.com/)**|**CDN77.com** donated a VM with 2 CPU cores, 4GB RAM and 20GB HD, on their excellent CDN network. -Localization Management|[Netdata localization project](https://crowdin.com/project/netdata) (check issue [#279](https://github.com/netdata/netdata/issues/279))|**[Crowdin.com](https://crowdin.com/)**|**Crowdin.com** donated an open source license to their Localization Management Platform. -Cloud VMs|[london.my-netdata.io](https://london.my-netdata.io) (Several VMs)|**[DigitalOcean.com](https://www.digitalocean.com/)**|**DigitalOcean.com** donated 1000 USD to be used in their excellent Cloud Computing services. Many thanks to [Justin Paine](https://github.com/xxdesmus) for making this happen. -Development IDE|-|**[JetBrains.com](https://www.jetbrains.com/)**|**JetBrains.com** donated an open source license for 4 developers for 1 year, to their excellent IDEs. -Cloud VM|[octopuscs.my-netdata.io](https://octopuscs.my-netdata.io)|**[OctopusCS.com](https://octopuscs.com/)**|**OctopusCS.com** donated a VM with 4 CPU cores, 16GB RAM and 50GB HD in their excellent Cloud Computing services. -Cloud VM|[ventureer.my-netdata.io](https://ventureer.my-netdata.io)|**[Ventureer.com](https://ventureer.com/)**|**Ventureer.com** donated a VM with 4 CPU cores, 8GB RAM and 50GB HD in their excellent Cloud Computing services. -Cloud VM|[stackscale.my-netdata.io](https://stackscale.my-netdata.io)|**[stackscale.com](https://www.stackscale.com/)**|**StackScale.com** donated a VM with 4 CPU cores, 16GB RAM and 100GB HD in their excellent Cloud Computing services. +| what donated|related links|who donated|description of the donation| +|-----------:|:-----------:|:---------:|:--------------------------| +| Packages Distribution|-|**[PackageCloud.io](https://packagecloud.io/)**|**PackageCloud.io** donated to a free open-source subscription to their awesome Package Distribution services.| +| Cross Browser Testing|-|**[BrowserStack.com](https://www.browserstack.com/)**|**BrowserStack.com** donated a free subscription to their awesome Browser Testing services (all three of them: Live, Screenshots, Responsive).| +| Cloud VM|[cdn77.my-netdata.io](http://cdn77.my-netdata.io)|**[CDN77.com](https://www.cdn77.com/)**|**CDN77.com** donated a VM with 2 CPU cores, 4GB RAM and 20GB HD, on their excellent CDN network.| +| Localization Management|[Netdata localization project](https://crowdin.com/project/netdata) (check issue [#279](https://github.com/netdata/netdata/issues/279))|**[Crowdin.com](https://crowdin.com/)**|**Crowdin.com** donated an open source license to their Localization Management Platform.| +| Cloud VMs|[london.my-netdata.io](https://london.my-netdata.io) (Several VMs)|**[DigitalOcean.com](https://www.digitalocean.com/)**|**DigitalOcean.com** donated 1000 USD to be used in their excellent Cloud Computing services. Many thanks to [Justin Paine](https://github.com/xxdesmus) for making this happen.| +| Development IDE|-|**[JetBrains.com](https://www.jetbrains.com/)**|**JetBrains.com** donated an open source license for 4 developers for 1 year, to their excellent IDEs.| +| Cloud VM|[octopuscs.my-netdata.io](https://octopuscs.my-netdata.io)|**[OctopusCS.com](https://octopuscs.com/)**|**OctopusCS.com** donated a VM with 4 CPU cores, 16GB RAM and 50GB HD in their excellent Cloud Computing services.| +| Cloud VM|[ventureer.my-netdata.io](https://ventureer.my-netdata.io)|**[Ventureer.com](https://ventureer.com/)**|**Ventureer.com** donated a VM with 4 CPU cores, 8GB RAM and 50GB HD in their excellent Cloud Computing services.| +| Cloud VM|[stackscale.my-netdata.io](https://stackscale.my-netdata.io)|**[stackscale.com](https://www.stackscale.com/)**|**StackScale.com** donated a VM with 4 CPU cores, 16GB RAM and 100GB HD in their excellent Cloud Computing services.| Thank you! @@ -22,4 +22,4 @@ Thank you! Please contact me at costa@tsaousis.gr. -[]() +[](<>) diff --git a/docs/GettingStarted.md b/docs/GettingStarted.md index 3ddf4c388..7fd7a5382 100644 --- a/docs/GettingStarted.md +++ b/docs/GettingStarted.md @@ -32,16 +32,16 @@ If still Netdata does not receive the requests, something is blocking them. A fi </details> <br/> -When you install multiple Netdata servers, all your servers will appear at the node menu at the top left of the dashboard. For this to work, you have to manually access just once, the dashboard of each of your netdata servers. +When you install multiple Netdata servers, all your servers will appear at the node menu at the top left of the dashboard. For this to work, you have to manually access just once, the dashboard of each of your Netdata servers. -The node menu is more than just browser bookmarks. When switching Netdata servers from that menu, any settings of the current view are propagated to the other netdata server: +The node menu is more than just browser bookmarks. When switching Netdata servers from that menu, any settings of the current view are propagated to the other Netdata server: -- the current charts panning (drag the charts left or right), -- the current charts zooming (`SHIFT` + mouse wheel over a chart), -- the highlighted time-frame (`ALT` + select an area on a chart), -- the scrolling position of the dashboard, -- the theme you use, -- etc. +- the current charts panning (drag the charts left or right), +- the current charts zooming (`SHIFT` + mouse wheel over a chart), +- the highlighted time-frame (`ALT` + select an area on a chart), +- the scrolling position of the dashboard, +- the theme you use, +- etc. are all sent over to other Netdata server, to allow you troubleshoot cross-server performance issues easily. @@ -51,9 +51,9 @@ Netdata installer integrates Netdata to your init / systemd environment. To start/stop Netdata, depending on your environment, you should use: -- `systemctl start netdata` and `systemctl stop netdata` -- `service netdata start` and `service netdata stop` -- `/etc/init.d/netdata start` and `/etc/init.d/netdata stop` +- `systemctl start netdata` and `systemctl stop netdata` +- `service netdata start` and `service netdata stop` +- `/etc/init.d/netdata start` and `/etc/init.d/netdata stop` Once Netdata is installed, the installer configures it to start at boot and stop at shutdown. @@ -89,10 +89,10 @@ Netdata supports auto-detection of data collection sources. It auto-detects almo This auto-detection process happens **only once**, when Netdata starts. To have Netdata re-discover data sources, you need to restart it. There are a few exceptions to this: -- containers and VMs are auto-detected forever (when Netdata is running at the host). -- many data sources are collected but are silenced by default, until there is useful information to collect (for example network interface dropped packet, will appear after a packet has been dropped). -- services that are not optimal to collect on all systems, are disabled by default. -- services we received feedback from users that caused issues when monitored, are also disabled by default (for example, `chrony` is disabled by default, because CentOS ships a version of it that uses 100% CPU when queried for statistics). +- containers and VMs are auto-detected forever (when Netdata is running at the host). +- many data sources are collected but are silenced by default, until there is useful information to collect (for example network interface dropped packet, will appear after a packet has been dropped). +- services that are not optimal to collect on all systems, are disabled by default. +- services we received feedback from users that caused issues when monitored, are also disabled by default (for example, `chrony` is disabled by default, because CentOS ships a version of it that uses 100% CPU when queried for statistics). Once a data collection source is detected, Netdata will never quit trying to collect data from it, until Netdata is restarted. So, if you stop your web server, Netdata will pick it up automatically when it is started again. @@ -100,15 +100,15 @@ Since Netdata is installed on all your systems (even inside containers), auto-de A few well known data collection sources that commonly need to be configured are: -- [systemd services utilization](../collectors/cgroups.plugin/#monitoring-systemd-services) are not exposed by default on most systems, so `systemd` has to be configured to expose those metrics. +- [systemd services utilization](../collectors/cgroups.plugin/#monitoring-systemd-services) are not exposed by default on most systems, so `systemd` has to be configured to expose those metrics. ## Configuration quick start In Netdata we have: -- **internal** data collection plugins (running inside the Netdata daemon) -- **external** data collection plugins (independent processes, sending data to Netdata over pipes) -- modular plugin **orchestrators** (external plugins that have multiple data collection modules) +- **internal** data collection plugins (running inside the Netdata daemon) +- **external** data collection plugins (independent processes, sending data to Netdata over pipes) +- modular plugin **orchestrators** (external plugins that have multiple data collection modules) You can enable and disable plugins (internal and external) via `netdata.conf` at the section `[plugins]`. @@ -174,9 +174,9 @@ and set `SEND_EMAIL="NO"`. ## What is next? -- Check [Data Collection](../collectors) for configuring data collection plugins. -- Check [Health Monitoring](../health) for configuring your own alarms, or setting up alarm notifications. -- Check [Streaming](../streaming) for centralizing Netdata metrics. -- Check [Backends](../backends) for long term archiving of Netdata metrics to time-series databases. +- Check [Data Collection](../collectors) for configuring data collection plugins. +- Check [Health Monitoring](../health) for configuring your own alarms, or setting up alarm notifications. +- Check [Streaming](../streaming) for centralizing Netdata metrics. +- Check [Backends](../backends) for long term archiving of Netdata metrics to time-series databases. -[]() +[](<>) diff --git a/docs/Performance.md b/docs/Performance.md index fbc6d5761..8205c70ee 100644 --- a/docs/Performance.md +++ b/docs/Performance.md @@ -3,19 +3,21 @@ Netdata performance is affected by: **Data collection** -- the number of charts for which data are collected -- the number of plugins running -- the technology of the plugins (i.e. BASH plugins are slower than binary plugins) -- the frequency of data collection + +- the number of charts for which data are collected +- the number of plugins running +- the technology of the plugins (i.e. BASH plugins are slower than binary plugins) +- the frequency of data collection You can control all the above. **Web clients accessing the data** -- the duration of the charts in the dashboard -- the number of charts refreshes requested -- the compression level of the web responses ---- +- the duration of the charts in the dashboard +- the number of charts refreshes requested +- the compression level of the web responses + +- - - ## Netdata Daemon @@ -24,9 +26,10 @@ For most server systems, with a few hundred charts and a few thousand dimensions To prove Netdata scalability, check issue [#1323](https://github.com/netdata/netdata/issues/1323#issuecomment-265501668) where Netdata collects 95.000 metrics per second, with 12% CPU utilization of a single core! In embedded systems, if the Netdata daemon is using a lot of CPU without any web clients accessing it, you should lower the data collection frequency. To set the data collection frequency, edit `/etc/netdata/netdata.conf` and set `update_every` to a higher number (this is the frequency in seconds data are collected for all charts: higher number of seconds = lower frequency, the default is 1 for per second data collection). You can also set this frequency per module or chart. Check the [daemon configuration](../daemon/config) for plugins and charts. For specific modules, the configuration needs to be changed in: -- `python.d.conf` for [python](../collectors/python.d.plugin/#pythondplugin) -- `node.d.conf` for [nodejs](../collectors/node.d.plugin/#nodedplugin) -- `charts.d.conf` for [bash](../collectors/charts.d.plugin/#chartsdplugin) + +- `python.d.conf` for [python](../collectors/python.d.plugin/#pythondplugin) +- `node.d.conf` for [nodejs](../collectors/node.d.plugin/#nodedplugin) +- `charts.d.conf` for [bash](../collectors/charts.d.plugin/#chartsdplugin) ## Plugins @@ -42,7 +45,6 @@ Netdata runs with the lowest possible process priority, so even if 1000 users ar To lower the CPU utilization of Netdata when clients are accessing the dashboard, set `web compression level = 1`, or disable web compression completely by setting `enable web responses gzip compression = no`. Both settings are in the `[web]` section. - ## Monitoring a heavy loaded system Netdata, while running, does not depend on disk I/O (apart its log files and `access.log` is written with buffering enabled and can be disabled). Some plugins that need disk may stop and show gaps during heavy system load, but the Netdata daemon itself should be able to work and collect values from `/proc` and `/sys` and serve web clients accessing it. @@ -119,17 +121,17 @@ Edit `/etc/netdata/netdata.conf`, find the `[plugins]` section: In detail: -plugin|description -:---:|:--------- -`proc`|the internal plugin used to monitor the system. Normally, you don't want to disable this. You can disable individual functions of it at the next section. -`tc`|monitoring network interfaces QoS (tc classes) -`idlejitter`|internal plugin (written in C) that attempts show if the systems starved for CPU. Disabling it will eliminate a thread. -`cgroups`|monitoring linux containers. Most probably you are not going to need it. This will also eliminate another thread. -`checks`|a debugging plugin, which is disabled by default. -`apps`|a plugin that monitors system processes. It is very complex and heavy (consumes twice the CPU resources of the Netdata daemon), so if you don't need to monitor the process tree, you can disable it. -`charts.d`|BASH plugins (squid, nginx, mysql, etc). This is a heavy plugin, that consumes twice the CPU resources of the Netdata daemon. -`node.d`|node.js plugin, currently used for SNMP data collection and monitoring named (the name server). -`python.d`|has many modules and can use over 20MB of memory. +| plugin|description| +|:----:|:----------| +| `proc`|the internal plugin used to monitor the system. Normally, you don't want to disable this. You can disable individual functions of it at the next section.| +| `tc`|monitoring network interfaces QoS (tc classes)| +| `idlejitter`|internal plugin (written in C) that attempts show if the systems starved for CPU. Disabling it will eliminate a thread.| +| `cgroups`|monitoring linux containers. Most probably you are not going to need it. This will also eliminate another thread.| +| `checks`|a debugging plugin, which is disabled by default.| +| `apps`|a plugin that monitors system processes. It is very complex and heavy (consumes twice the CPU resources of the Netdata daemon), so if you don't need to monitor the process tree, you can disable it.| +| `charts.d`|BASH plugins (squid, nginx, mysql, etc). This is a heavy plugin, that consumes twice the CPU resources of the Netdata daemon.| +| `node.d`|node.js plugin, currently used for SNMP data collection and monitoring named (the name server).| +| `python.d`|has many modules and can use over 20MB of memory.| For most IoT devices, you can disable all plugins except `proc`. For `proc` there is another section that controls which functions of it you need. Check the next section. @@ -170,6 +172,7 @@ Normally, you will not need them. To disable them, set: error log = none access log = none ``` + ### 5. Set memory mode to RAM Setting the memory mode to `ram` will disable loading and saving the round robin database. This will not affect anything while running Netdata, but it might be required if you have very limited storage available. @@ -192,7 +195,6 @@ The units for history is `[global].update every` seconds. So if `[global].update Check also [Database](../database) for directions on calculating the size of the round robin database. - ### 7. Disable gzip compression of responses Gzip compression of the web responses is using more CPU that the rest of Netdata. You can lower the compression level or disable gzip compression completely. You can disable it, like this: @@ -217,4 +219,4 @@ Finally, if no web server is installed on your device, you can use port tcp/80 f port = 80 ``` -[]() +[](<>) diff --git a/docs/README.md b/docs/README.md index 8dd0c7a63..752802f6d 100644 --- a/docs/README.md +++ b/docs/README.md @@ -1,7 +1,7 @@ -# Read documentation on https://docs.netdata.cloud +# Read documentation on <https://docs.netdata.cloud> Welcome to the Netdata documentation! While you can read Netdata documentation here, or throughout the Netdata repository, our intention is that these pages are read on [docs.netdata.cloud](https://docs.netdata.cloud). Links between documentation pages will work fine here, but the formatting may not be perfect, as our documentation site uses a few extra Markdown features that GitHub doesn't support natively. Other things might be missing or look less than perfect. -Now get out there and build an exceptional infrastructure.
\ No newline at end of file +Now get out there and build an exceptional infrastructure. diff --git a/docs/Running-behind-apache.md b/docs/Running-behind-apache.md index c4def5f6b..6c5ab6776 100644 --- a/docs/Running-behind-apache.md +++ b/docs/Running-behind-apache.md @@ -2,11 +2,10 @@ Below you can find instructions for configuring an apache server to: -1. proxy a single Netdata via an HTTP and HTTPS virtual host -2. dynamically proxy any number of Netdata servers -3. add user authentication -4. adjust Netdata settings to get optimal results - +1. proxy a single Netdata via an HTTP and HTTPS virtual host +2. dynamically proxy any number of Netdata servers +3. add user authentication +4. adjust Netdata settings to get optimal results ## Requirements @@ -20,14 +19,14 @@ sudo apt-get install apache2-bin Also make sure they are enabled: -``` +```sh sudo a2enmod proxy sudo a2enmod proxy_http ``` Ensure your rewrite module is enabled: -``` +```sh sudo a2enmod rewrite ``` @@ -41,7 +40,7 @@ On any **existing** and already **working** apache virtual host, you can redirec Add the following on top of any existing virtual host. It will allow you to access Netdata as `http://virtual.host/netdata/`. -``` +```conf <VirtualHost *:80> RewriteEngine On @@ -71,7 +70,7 @@ Add the following on top of any existing virtual host. It will allow you to acce Add the following on top of any existing virtual host. It will allow you to access multiple Netdata as `http://virtual.host/netdata/HOSTNAME/`, where `HOSTNAME` is the hostname of any other Netdata server you have (to access the `localhost` Netdata, use `http://virtual.host/netdata/localhost/`). -``` +```conf <VirtualHost *:80> RewriteEngine On @@ -117,7 +116,7 @@ nano /etc/apache2/sites-available/netdata.conf with this content: -``` +```conf <VirtualHost *:80> RewriteEngine On ProxyRequests Off @@ -144,19 +143,20 @@ sudo a2ensite netdata.conf && service apache2 reload ``` ## Netdata proxy in Plesk + _Assuming the main goal is to make Netdata running in HTTPS._ -1. Make a subdomain for Netdata on which you enable and force HTTPS - You can use a free Let's Encrypt certificate -2. Go to "Apache & nginx Settings", and in the following section, add: +1. Make a subdomain for Netdata on which you enable and force HTTPS - You can use a free Let's Encrypt certificate +2. Go to "Apache & nginx Settings", and in the following section, add: -``` +```conf RewriteEngine on RewriteRule (.*) http://localhost:19999/$1 [P,L] ``` -3. Optional: If your server is remote, then just replace "localhost" with your actual hostname or IP, it just works. -Repeat the operation for as many servers as you need. +3. Optional: If your server is remote, then just replace "localhost" with your actual hostname or IP, it just works. +Repeat the operation for as many servers as you need. ## Enable Basic Auth @@ -166,10 +166,10 @@ Install the package `apache2-utils`. On debian / ubuntu run `sudo apt-get instal Then, generate password for user `netdata`, using `htpasswd -c /etc/apache2/.htpasswd netdata` -**Apache 2.2 Example:** +**Apache 2.2 Example:**\ Modify the virtual host with these: -``` +```conf # replace the <Proxy *> section <Proxy *> Order deny,allow @@ -189,11 +189,9 @@ Modify the virtual host with these: Specify `Location /` if Netdata is running on dedicated virtual host. - - **Apache 2.4 (dedicated virtual host) Example:** -``` +```conf <VirtualHost *:80> RewriteEngine On ProxyRequests Off @@ -219,6 +217,16 @@ Specify `Location /` if Netdata is running on dedicated virtual host. Note: Changes are applied by reloading or restarting Apache. +## Configuration of Content Security Policy + +If you want to enable CSP within your Apache, you should consider some special requirements of the headers. Modify your configuration like that: + +``` + Header always set Content-Security-Policy "default-src http: 'unsafe-inline' 'self' 'unsafe-eval'; script-src http: 'unsafe-inline' 'self' 'unsafe-eval'; style-src http: 'self' 'unsafe-inline'" +``` + +Note: Changes are applied by reloading or restarting Apache. + # Netdata configuration You might edit `/etc/netdata/netdata.conf` to optimize your setup a bit. For applying these changes you need to restart Netdata. @@ -242,12 +250,16 @@ You would also need to instruct Netdata to listen only on `localhost`, `127.0.0. [web] bind to = localhost ``` + or + ``` [web] bind to = 127.0.0.1 ``` + or + ``` [web] bind to = ::1 @@ -286,7 +298,8 @@ If your apache server is not on localhost, you can set: bind to = * allow connections from = IP_OF_APACHE_SERVER ``` -_note: Netdata v1.9+ support `allow connections from`_ + +*note: Netdata v1.9+ support `allow connections from`* `allow connections from` accepts [Netdata simple patterns](../libnetdata/simple_pattern/) to match against the connection IP address. @@ -303,7 +316,7 @@ apache logs accesses and Netdata logs them too. You can prevent Netdata from gen Make sure the requests reach Netdata, by examing `/var/log/netdata/access.log`. -1. if the requests do not reach Netdata, your apache does not forward them. -2. if the requests reach Netdata but the URLs are wrong, you have not re-written them properly. +1. if the requests do not reach Netdata, your apache does not forward them. +2. if the requests reach Netdata but the URLs are wrong, you have not re-written them properly. -[]() +[](<>) diff --git a/docs/Running-behind-caddy.md b/docs/Running-behind-caddy.md index 4e530e948..866d488d0 100644 --- a/docs/Running-behind-caddy.md +++ b/docs/Running-behind-caddy.md @@ -2,7 +2,7 @@ To run Netdata via [Caddy's proxying,](https://caddyserver.com/docs/proxy) set your Caddyfile up like this: -``` +```caddyfile netdata.domain.tld { proxy / localhost:19999 } @@ -12,7 +12,7 @@ Other directives can be added between the curly brackets as needed. To run Netdata in a subfolder: -``` +```caddyfile netdata.domain.tld { proxy /netdata/ localhost:19999 { without /netdata @@ -26,4 +26,4 @@ You would also need to instruct Netdata to listen only to `127.0.0.1` or `::1`. To limit access to Netdata only from localhost, set `bind socket to IP = 127.0.0.1` or `bind socket to IP = ::1` in `/etc/netdata/netdata.conf`. -[]() +[](<>) diff --git a/docs/Running-behind-haproxy.md b/docs/Running-behind-haproxy.md index 2c1835f50..cf95a491c 100644 --- a/docs/Running-behind-haproxy.md +++ b/docs/Running-behind-haproxy.md @@ -2,7 +2,7 @@ > HAProxy is a free, very fast and reliable solution offering high availability, load balancing, and proxying for TCP and HTTP-based applications. It is particularly suited for very high traffic web sites and powers quite a number of the world's most visited ones. -If Netdata is running on a host running HAProxy, rather than connecting to Netdata from a port number, a domain name can be pointed at HAProxy, and HAProxy can redirect connections to the Netdata port. This can make it possible to connect to Netdata at https://example.com or https://example.com/netdata/, which is a much nicer experience then http://example.com:19999. +If Netdata is running on a host running HAProxy, rather than connecting to Netdata from a port number, a domain name can be pointed at HAProxy, and HAProxy can redirect connections to the Netdata port. This can make it possible to connect to Netdata at <https://example.com> or <https://example.com/netdata/>, which is a much nicer experience then <http://example.com:19999>. To proxy requests from [HAProxy](https://github.com/haproxy/haproxy) to Netdata, the following configuration can be used: @@ -17,7 +17,7 @@ defaults ## Simple Configuration -A simple example where the base URL, say http://example.com, is used with no subpath: +A simple example where the base URL, say <http://example.com>, is used with no subpath: ### Frontend @@ -277,4 +277,4 @@ backend netdata_backend http-request set-header Connection "keep-alive" ``` -[]() +[](<>) diff --git a/docs/Running-behind-lighttpd.md b/docs/Running-behind-lighttpd.md index 8e43a0382..8f05973b8 100644 --- a/docs/Running-behind-lighttpd.md +++ b/docs/Running-behind-lighttpd.md @@ -26,11 +26,14 @@ $SERVER["socket"] == ":19998" { If the only thing the server is exposing via the web is Netdata (and thus no suburl rewriting required), then you can get away with just + ``` proxy.server = ( "" => ( ( "host" => "127.0.0.1", "port" => 19999 ))) ``` + Though if it's public facing you might then want to put some authentication on it. htdigest support looks like: + ``` auth.backend = "htdigest" auth.backend.htdigest.userfile = "/etc/lighttpd/lighttpd.htdigest" @@ -40,6 +43,7 @@ auth.require = ( "" => ( "method" => "digest", ) ) ``` + other auth methods, and more info on htdigest, can be found in lighttpd's [mod_auth docs](http://redmine.lighttpd.net/projects/lighttpd/wiki/Docs_ModAuth). --- @@ -47,7 +51,7 @@ other auth methods, and more info on htdigest, can be found in lighttpd's [mod_a It seems that lighttpd (or some versions of it), fail to proxy compressed web responses. To solve this issue, disable web response compression in Netdata. -Open /etc/netdata/netdata.conf and set in [global]: +Open `/etc/netdata/netdata.conf` and set in [global]\: ``` enable web responses gzip compression = no @@ -59,4 +63,4 @@ You would also need to instruct Netdata to listen only to `127.0.0.1` or `::1`. To limit access to Netdata only from localhost, set `bind socket to IP = 127.0.0.1` or `bind socket to IP = ::1` in `/etc/netdata/netdata.conf`. -[]() +[](<>) diff --git a/docs/Running-behind-nginx.md b/docs/Running-behind-nginx.md index 81ebc1a75..cad416263 100644 --- a/docs/Running-behind-nginx.md +++ b/docs/Running-behind-nginx.md @@ -8,13 +8,13 @@ The software is known for its low impact on memory resources, high scalability, ## Why Nginx -- By default, Nginx is fast and lightweight out of the box. +- By default, Nginx is fast and lightweight out of the box. -- Nginx is used and useful in cases when you want to access different instances of Netdata from a single server. +- Nginx is used and useful in cases when you want to access different instances of Netdata from a single server. -- Password-protect access to Netdata, until distributed authentication is implemented via the Netdata cloud Sign In mechanism. +- Password-protect access to Netdata, until distributed authentication is implemented via the Netdata cloud Sign In mechanism. -- A proxy was necessary to encrypt the communication to netdata, until v1.16.0, which provided TLS (HTTPS) support. +- A proxy was necessary to encrypt the communication to Netdata, until v1.16.0, which provided TLS (HTTPS) support. ## Nginx configuration file @@ -28,9 +28,9 @@ You can edit the Nginx configuration file with Nano, Vim or any other text edito After making changes to the configuration files: -- Test Nginx configuration with `nginx -t`. +- Test Nginx configuration with `nginx -t`. -- Restart Nginx to effect the change with `/etc/init.d/nginx restart` or `service nginx restart`. +- Restart Nginx to effect the change with `/etc/init.d/nginx restart` or `service nginx restart`. ## Ways to access Netdata via Nginx @@ -38,7 +38,7 @@ After making changes to the configuration files: With this method instead of `SERVER_IP_ADDRESS:19999`, the Netdata dashboard can be accessed via a human-readable URL such as `netdata.example.com` used in the configuration below. -``` +```conf upstream backend { # the Netdata server server 127.0.0.1:19999; @@ -64,12 +64,13 @@ server { } } ``` + ### As a subfolder to an existing virtual host This method is recommended when Netdata is to be served from a subfolder (or directory). In this case, the virtual host `netdata.example.com` already exists and Netdata has to be accessed via `netdata.example.com/netdata/`. -``` +```conf upstream netdata { server 127.0.0.1:19999; keepalive 64; @@ -109,7 +110,7 @@ server { This is the recommended configuration when one Nginx will be used to manage multiple Netdata servers via subfolders. -``` +```conf upstream backend-server1 { server 10.1.1.103:19999; keepalive 64; @@ -152,14 +153,14 @@ Of course you can add as many backend servers as you like. Using the above, you access Netdata on the backend servers, like this: -- `http://netdata.example.com/netdata/server1/` to reach `backend-server1` -- `http://netdata.example.com/netdata/server2/` to reach `backend-server2` +- `http://netdata.example.com/netdata/server1/` to reach `backend-server1` +- `http://netdata.example.com/netdata/server2/` to reach `backend-server2` ### Encrypt the communication between Nginx and Netdata In case Netdata's web server has been [configured to use TLS](../web/server/#enabling-tls-support), it is necessary to specify inside the Nginx configuration that the final destination is using TLS. To do this, please, append the following parameters in your `nginx.conf` -``` +```conf proxy_set_header X-Forwarded-Proto https; proxy_pass https://localhost:19999; ``` @@ -174,13 +175,13 @@ Create an authentication file to enable basic authentication via Nginx, this sec If you don't have an authentication file, you can use the following command: -``` +```sh printf "yourusername:$(openssl passwd -apr1)" > /etc/nginx/passwords ``` And then enable the authentication inside your server directive: -``` +```conf server { # ... auth_basic "Protected"; @@ -206,11 +207,12 @@ You can also use a unix domain socket. This will also provide a faster route bet [web] bind to = unix:/tmp/netdata.sock ``` -_note: Netdata v1.8+ support unix domain sockets_ + +*note: Netdata v1.8+ support unix domain sockets* At the Nginx side, use something like this to use the same unix domain socket: -``` +```conf upstream backend { server unix:/tmp/netdata.sock; keepalive 64; @@ -227,7 +229,7 @@ If your Nginx server is not on localhost, you can set: allow connections from = IP_OF_NGINX_SERVER ``` -_note: Netdata v1.9+ support `allow connections from`_ +*note: Netdata v1.9+ support `allow connections from`* `allow connections from` accepts [Netdata simple patterns](../libnetdata/simple_pattern/) to match against the connection IP address. @@ -251,5 +253,4 @@ If you get an 502 Bad Gateway error you might check your Nginx error log: If you see something like the above, chances are high that SELinux prevents nginx from connecting to the backend server. To fix that, just use this policy: `setsebool -P httpd_can_network_connect true`. - -[]()
\ No newline at end of file +[](<>) diff --git a/docs/Third-Party-Plugins.md b/docs/Third-Party-Plugins.md index 8d227203f..1b7344b12 100644 --- a/docs/Third-Party-Plugins.md +++ b/docs/Third-Party-Plugins.md @@ -28,4 +28,4 @@ Collect [number of currently logged-on users](https://github.com/veksh/netdata-n There is an unofficial [nim plugin helper](https://github.com/FedericoCeratto/nim-netdata-plugin) -[]() +[](<>) diff --git a/docs/a-github-star-is-important.md b/docs/a-github-star-is-important.md index cac01f3e3..6bac3acef 100644 --- a/docs/a-github-star-is-important.md +++ b/docs/a-github-star-is-important.md @@ -12,4 +12,4 @@ Thank you! Costa Tsaousis -[]() +[](<>) diff --git a/docs/anonymous-statistics.md b/docs/anonymous-statistics.md index 376a2c4aa..7f175a1c9 100644 --- a/docs/anonymous-statistics.md +++ b/docs/anonymous-statistics.md @@ -3,13 +3,14 @@ From Netdata v1.12 and above, anonymous usage information is collected by default and sent to Google Analytics. The statistics calculated from this information will be used for: -1. **Quality assurance**, to help us understand if Netdata behaves as expected and help us identify repeating issues for certain distributions or environment. +1. **Quality assurance**, to help us understand if Netdata behaves as expected and help us identify repeating issues for certain distributions or environment. -2. **Usage statistics**, to help us focus on the parts of Netdata that are used the most, or help us identify the extend our development decisions influence the community. +2. **Usage statistics**, to help us focus on the parts of Netdata that are used the most, or help us identify the extend our development decisions influence the community. Information is sent to Netdata via two different channels: -- Google Tag Manager is used when an agent's dashboard is accessed. -- The script `anonymous-statistics.sh` is executed by the Netdata daemon, when Netdata starts, stops cleanly, or fails. + +- Google Tag Manager is used when an agent's dashboard is accessed. +- The script `anonymous-statistics.sh` is executed by the Netdata daemon, when Netdata starts, stops cleanly, or fails. Both methods are controlled via the same [opt-out mechanism](#opt-out) @@ -21,21 +22,21 @@ We have configured GTM to trigger the tag only when the variable `anonymous_stat To ensure anonymity of the stored information, we have configured GTM's GA variable "Fields to set" as follows: -|Field Name|Value -|---|--- -|page|netdata-dashboard -|hostname|dashboard.my-netdata.io -|anonymizeIp|true -|title|netdata dashboard -|campaignSource|{{machine_guid}} -|campaignMedium|web -|referrer|http://dashboard.my-netdata.io -|Page URL|http://dashboard.my-netdata.io/netdata-dashboard -|Page Hostname|http://dashboard.my-netdata.io -|Page Path|/netdata-dashboard -|location|http://dashboard.my-netdata.io - -In addition, the netdata-generated unique machine guid is sent to GA via a custom dimension. +| Field Name|Value| +|----------|-----| +| page|netdata-dashboard| +| hostname|dashboard.my-netdata.io| +| anonymizeIp|true| +| title|Netdata dashboard| +| campaignSource|{{machine_guid}}| +| campaignMedium|web| +| referrer|<http://dashboard.my-netdata.io>| +| Page URL|<http://dashboard.my-netdata.io/netdata-dashboard>| +| Page Hostname|<http://dashboard.my-netdata.io>| +| Page Path|/netdata-dashboard| +| location|<http://dashboard.my-netdata.io>| + +In addition, the Netdata-generated unique machine guid is sent to GA via a custom dimension. You can verify the effect of these settings by examining the GA `collect` request parameters. The only thing that's impossible for us to prevent from being **sent** is the URL in the "Referrer" Header of the browser request to GA. However, the settings above ensure that all **stored** URLs and host names are anonymized. @@ -43,21 +44,23 @@ The only thing that's impossible for us to prevent from being **sent** is the UR ## Anonymous Statistics Script Every time the daemon is started or stopped and every time a fatal condition is encountered, Netdata uses the anonymous statistics script to collect system information and send it to GA via an http call. The information collected for all events is: - - Netdata version - - OS name, version, id, id_like - - Kernel name, version, architecture - - Virtualization technology - - Containerization technology + +- Netdata version +- OS name, version, id, id_like +- Kernel name, version, architecture +- Virtualization technology +- Containerization technology Furthermore, the FATAL event sends the Netdata process & thread name, along with the source code function, source code filename and source code line number of the fatal error. - + To see exactly what and how is collected, you can review the script template `daemon/anonymous-statistics.sh.in`. The template is converted to a bash script called `anonymous-statistics.sh`, installed under the Netdata `plugins directory`, which is usually `/usr/libexec/netdata/plugins.d`. ## Opt-Out To opt-out from sending anonymous statistics, you can create a file called `.opt-out-from-anonymous-statistics` under the user configuration directory (usually `/etc/netdata`). The effect of creating the file is the following: - - The daemon will never execute the anonymous statistics script - - The anonymous statistics script will exit immediately if called via any other way (e.g. shell) - - The Google Tag Manager Javascript snippet will remain in the page, but the linked tag will not be fired. The effect is that no data will ever be sent to GA. + +- The daemon will never execute the anonymous statistics script +- The anonymous statistics script will exit immediately if called via any other way (e.g. shell) +- The Google Tag Manager Javascript snippet will remain in the page, but the linked tag will not be fired. The effect is that no data will ever be sent to GA. You can also disable telemetry by passing the option `--disable-telemetry` to any of the installers. diff --git a/docs/configuration-guide.md b/docs/configuration-guide.md index 1c79e0276..c13347749 100644 --- a/docs/configuration-guide.md +++ b/docs/configuration-guide.md @@ -7,27 +7,26 @@ Depending on your installation method, Netdata will have been installed either d Under that directory you will see the following: -- `netdata.conf` is [the main configuration file](../daemon/config/#daemon-configuration) -- `edit-config` is an sh script that you can use to easily and safely edit the configuration. Just run it to see its usage. -- Other directories, initially empty, where your custom configurations for alarms and collector plugins/modules will be copied from the stock configuration, if and when you customize them using `edit-config`. -- `orig` is a symbolic link to the directory `/usr/lib/netdata/conf.d`, which contains the stock configurations for everything not included in `netdata.conf`: - - `health_alarm_notify.conf` is where you configure how and to who Netdata will send [alarm notifications](../health/notifications/#netdata-alarm-notifications). - - `health.d` is the directory that contains the alarm triggers for [health monitoring](../health/#health-monitoring). It contains one .conf file per collector. - - The [modular plugin orchestrators](../collectors/plugins.d/#external-plugins-overview) have: - - One config file each, mainly to turn their modules on and off: `python.d.conf` for [python](../collectors/python.d.plugin/#pythondplugin), `node.d.conf` for [nodejs](../collectors/node.d.plugin/#nodedplugin) and `charts.d.conf` for [bash](../collectors/charts.d.plugin/#chartsdplugin) modules. - - One directory each, where the module-specific configuration files can be found. - - `stream.conf` is where you configure [streaming and replication](../streaming/#streaming-and-replication) - - `stats.d` is a directory under which you can add .conf files to add [synthetic charts](../collectors/statsd.plugin/#synthetic-statsd-charts). - - Individual collector plugin config files, such as `fping.conf` for the [fping plugin](../collectors/fping.plugin/) and `apps_groups.conf` for the [apps plugin](../collectors/apps.plugin/) +- `netdata.conf` is [the main configuration file](../daemon/config/#daemon-configuration) +- `edit-config` is an sh script that you can use to easily and safely edit the configuration. Just run it to see its usage. +- Other directories, initially empty, where your custom configurations for alarms and collector plugins/modules will be copied from the stock configuration, if and when you customize them using `edit-config`. +- `orig` is a symbolic link to the directory `/usr/lib/netdata/conf.d`, which contains the stock configurations for everything not included in `netdata.conf`: + - `health_alarm_notify.conf` is where you configure how and to who Netdata will send [alarm notifications](../health/notifications/#netdata-alarm-notifications). + - `health.d` is the directory that contains the alarm triggers for [health monitoring](../health/#health-monitoring). It contains one .conf file per collector. + - The [modular plugin orchestrators](../collectors/plugins.d/#external-plugins-overview) have: + - One config file each, mainly to turn their modules on and off: `python.d.conf` for [python](../collectors/python.d.plugin/#pythondplugin), `node.d.conf` for [nodejs](../collectors/node.d.plugin/#nodedplugin) and `charts.d.conf` for [bash](../collectors/charts.d.plugin/#chartsdplugin) modules. + - One directory each, where the module-specific configuration files can be found. + - `stream.conf` is where you configure [streaming and replication](../streaming/#streaming-and-replication) + - `stats.d` is a directory under which you can add .conf files to add [synthetic charts](../collectors/statsd.plugin/#synthetic-statsd-charts). + - Individual collector plugin config files, such as `fping.conf` for the [fping plugin](../collectors/fping.plugin/) and `apps_groups.conf` for the [apps plugin](../collectors/apps.plugin/) So there are many configuration files to control every aspect of Netdata's behavior. It can be overwhelming at first, but you won't have to deal with any of them, unless you have specific things you need to change. The following HOWTO will guide you on how to customize your Netdata, based on what you want to do. - ## How to ### Persist my configuration -In http://localhost:19999/netdata.conf, you will see the following two parameters: +In <http://localhost:19999/netdata.conf>, you will see the following two parameters: ```bash # config directory = /etc/netdata @@ -40,26 +39,27 @@ To persist your configurations, don't edit the files under the `stock config dir ##### Increase the metrics retention period -Increase `history` in [netdata.conf [global]](../daemon/config/#global-section-options). Just ensure you understand [how much memory will be required](../database/) +Increase `history` in [netdata.conf \[global\]](../daemon/config/#global-section-options). Just ensure you understand [how much memory will be required](../database/) ##### Reduce the data collection frequency -Increase `update every` in [netdata.conf [global]](../daemon/config/#global-section-options). This is another way to increase your metrics retention period, but at a lower resolution than the default 1s. +Increase `update every` in [netdata.conf \[global\]](../daemon/config/#global-section-options). This is another way to increase your metrics retention period, but at a lower resolution than the default 1s. ##### Modify how a chart is displayed -In `netdata.conf` under `# Per chart configuration` you will find several [[CHART_NAME] sections](../daemon/config/#per-chart-configuration), where you can control all aspects of a specific chart. +In `netdata.conf` under `# Per chart configuration` you will find several [\[CHART_NAME\] sections](../daemon/config/#per-chart-configuration), where you can control all aspects of a specific chart. ##### Disable a collector -Entire plugins can be turned off from the [netdata.conf [plugins]](../daemon/config/#plugins-section-options) section. To disable specific modules of a plugin orchestrator, you need to edit one of the following: -- `python.d.conf` for [python](../collectors/python.d.plugin/#pythondplugin) -- `node.d.conf` for [nodejs](../collectors/node.d.plugin/#nodedplugin) -- `charts.d.conf` for [bash](../collectors/charts.d.plugin/#chartsdplugin) +Entire plugins can be turned off from the [netdata.conf \[plugins\]](../daemon/config/#plugins-section-options) section. To disable specific modules of a plugin orchestrator, you need to edit one of the following: + +- `python.d.conf` for [python](../collectors/python.d.plugin/#pythondplugin) +- `node.d.conf` for [nodejs](../collectors/node.d.plugin/#nodedplugin) +- `charts.d.conf` for [bash](../collectors/charts.d.plugin/#chartsdplugin) ##### Show charts with zero metrics -By default, Netdata will enable monitoring metrics for disks, memory, and network only when they are not zero. If they are constantly zero they are ignored. Metrics that will start having values, after netdata is started, will be detected and charts will be automatically added to the dashboard (a refresh of the dashboard is needed for them to appear though). Use `yes` instead of `auto` in plugin configuration sections to enable these charts permanently. You can also set the `enable zero metrics` option to `yes` in the `[global]` section which enables charts with zero metrics for all internal Netdata plugins. +By default, Netdata will enable monitoring metrics for disks, memory, and network only when they are not zero. If they are constantly zero they are ignored. Metrics that will start having values, after Netdata is started, will be detected and charts will be automatically added to the dashboard (a refresh of the dashboard is needed for them to appear though). Use `yes` instead of `auto` in plugin configuration sections to enable these charts permanently. You can also set the `enable zero metrics` option to `yes` in the `[global]` section which enables charts with zero metrics for all internal Netdata plugins. ### Modify alarms and notifications @@ -69,7 +69,7 @@ You can add a new alarm definition either by editing an existing stock alarm con ##### Turn off all alarms and notifications -Just set `enabled = no` in the [netdata.conf [health]](../daemon/config/#health-section-options) section +Just set `enabled = no` in the [netdata.conf \[health\]](../daemon/config/#health-section-options) section ##### Modify or disable a specific alarm @@ -88,15 +88,15 @@ You only need to configure `health_alarm_notify.conf`. To learn how to do it, re ##### Change the Netdata web server access lists -You have several options under the [netdata.conf [web]](../web/server/#access-lists) section. +You have several options under the [netdata.conf \[web\]](../web/server/#access-lists) section. ##### Stop sending info to registry.my-netdata.io -You will need to configure the [registry] section in netdata.conf. First read the [registry documentation](../registry/). In it, are instructions on how to [run your own registry](../registry/#run-your-own-registry). +You will need to configure the [registry] section in `netdata.conf`. First read the [registry documentation](../registry/). In it, are instructions on how to [run your own registry](../registry/#run-your-own-registry). ##### Change the IP address/port Netdata listens to -The settings are under netdata.conf [web]. Look at the [web server documentation](../web/server/#binding-netdata-to-multiple-ports) for more info. +The settings are under `netdata.conf` [web]. Look at the [web server documentation](../web/server/#binding-netdata-to-multiple-ports) for more info. ### System resource usage @@ -106,18 +106,17 @@ The page on [Netdata performance](Performance.md) has an excellent guide on how ##### Change when Netdata saves metrics to disk -[netdata.conf [global]](../daemon/config/#global-section-options) : `memory mode`</details> +[netdata.conf \[global\]](../daemon/config/#global-section-options) : `memory mode`</details> ##### Prevent Netdata from getting immediately killed when my server runs out of memory -You can change the Netdata [OOM score](../daemon/#oom-score) in netdata.conf [global]. +You can change the Netdata [OOM score](../daemon/#oom-score) in `netdata.conf` [global]. ### Other ##### Move Netdata directories -The various directory paths are in [netdata.conf [global]](../daemon/config/#global-section-options). - +The various directory paths are in [netdata.conf \[global\]](../daemon/config/#global-section-options). ## How Netdata configuration works @@ -135,4 +134,4 @@ Unix prefers regular expressions. But they are just too hard, too cryptic to use So, Netdata supports [simple patterns](../libnetdata/simple_pattern/). -[]() +[](<>) diff --git a/docs/contributing/contributing-documentation.md b/docs/contributing/contributing-documentation.md new file mode 100644 index 000000000..7cf0d820f --- /dev/null +++ b/docs/contributing/contributing-documentation.md @@ -0,0 +1,137 @@ +# Contributing to documentation + +We welcome contributions to Netdata's already extensive documentation, which we host at [docs.netdata.cloud](https://docs.netdata.cloud/) and store inside of the [main repository](https://github.com/netdata/netdata) on GitHub. + +Like all contributing to all other aspects of Netdata, we ask that anyone who wants to help with documentation read and abide by the [Contributor Convenant Code of Conduct](https://docs.netdata.cloud/code_of_conduct/) and follow the instructions outlined in our [Contributing document](../../CONTRIBUTING.md). + +We also ask you to read our [documentation style guide](style-guide.md), which, while not complete, will give you some guidance on how we write and organize our documentation. + +All our documentation uses the Markdown syntax. If you're not familiar with how it works, please read the [Markdown introduction post](https://daringfireball.net/projects/markdown/) by its creator, followed by [Mastering Markdown](https://guides.github.com/features/mastering-markdown/) guide from GitHub. + +## How contributing to the documentation works + +There are two ways to contribute to Netdata's documentation: + +1. Edit documentation [directly in GitHub](#edit-documentation-directly-on-gitHub). +2. Download the repository and [edit documentation locally](#edit-documentation-locally). + +Editing in GitHub is a simpler process and is perfect for quick edits to a single document, such as fixing a typo or clarifying a confusing sentence. + +Editing locally is more complex, as you need to download the Netdata repository and build the documentation using `mkdocs`, but allows you to better organize complex projects. By building documentation locally, you can preview your work using a local web server before you submit your PR. + +In both cases, you'll finish by submitting a pull request (PR). Once you submit your PR, GitHub will initiate a number of jobs, including a Netlify preview. You can use this preview to view the documentation site with your changes applied, which might help you catch any lingering issues. + +To continue, follow one of the paths below: + +- [Edit documentation directly in GitHub](#edit-documentation-directly-on-github) +- [Edit documentation locally](#edit-documentation-locally) + +## Edit documentation directly on GitHub + +Start editing documentation on GitHub by clicking the small pencil icon on any page on Netdata's [documentation site](https://docs.netdata.cloud/). You can find them at the top of every page. + +Clicking on this icon will take you to the associated page in the `netdata/netdata` repository. Then click the small pencil icon on any documentation file (those ending in the `.md` [Markdown] extension) in the `netdata/netdata` repository. + + + +If you know where a file resides in the Netdata repository already, you can skip the step of beginning on the documentation site and go directly to GitHub. + +Once you've clicked the pencil icon on GitHub, you'll see a full Markdown version of the file. Make changes as you see fit. You can use the `Preview changes` button to ensure your Markdown syntax is working properly. + +Under the `Propose file change` header, write in a descriptive title for your requested change. Beneath that, add a concise descrition of what you've changed and why you think it's important. Then, click the `Propose file change` button. + +After you've hit that button, jump down to our instructions on [pull requests and cleanup](#pull-requests-and-final-steps) for your next steps. + +!!! note + This process will create a branch directly on the `netdata/netdata` repository, which then requires manual cleanup. If you're going to make significant documentation contributions, or contribute often, we recommend the local editing process just below. + +## Edit documentation locally + +Editing documentation locally is the preferred method for complex changes, PRs that span across multiple documents, or those that change the styling or underlying functionality of the documentation. + +Here is the workflow for editing documentation locally. First, create a fork of the Netdata repository, if you don't have one already. Visit the [Netdata repository](https://github.com/netdata/netdata) and click on the `Fork` button in the upper-right corner of the window. + + + +GitHub will ask you where you want to clone the repository, and once finished you'll end up at the index of your forked Netdata repository. Clone your fork to your local machine: + +```bash +$ git clone https://github.com/YOUR-GITHUB-USERNAME/netdata.git +``` + +You can now jump into the directory and explore Netdata's structure for yourself. + +### Understanding the structure of Netdata's documentation + +All of Netdata's documentation is stored within the repository itself, as close as possible to the code it corresponds to. Many sub-folders contain a `README.md` file, which is then used to populate the documentation about that feature/component of Netdata. + +For example, the file at `packaging/installer/README.md` becomes `https://docs.netdata.cloud/packaging/installer/` and is our installation documentation. By co-locating it with quick-start installtion code, we ensure documentation is always tightly knit with the functions it describes. + +You might find other `.md` files within these directories. The `packaging/installer/` folder also contains `UPDATE.md` and `UNINSTALL.md`, which become `https://docs.netdata.cloud/packaging/installer/update/` and `https://docs.netdata.cloud/packaging/installer/uninstall/`, respectively. + +If the documentation you're working on has a direct correlation to some component of Netdata, place it into the correct folder and either name it `README.md` for generic documentation, or with another name for very specific instructions. + +#### The `docs` folder + +At the root of the Netdata repository is a `docs/` folder. Inside this folder we place documentation that does not have a direct relationship to a specific component of Netdata. It's where we house our [getting started guide](../GettingStarted.md), guides on [running Netdata behind Nginx](../Running-behind-nginx.md), and more. + +If the documentation you're working on doesn't have a direct relaionship to a component of Netdata, it can be placed in this `docs/` folder. + +### Make your edits + +Now that you're set up and understand where to find or create your `.md` file, you can now begin to make your edits. Just use your favorite editor and keep in mind our [style guide](style-guide.md) as you work. + +If you add a new file to the documentation, you may need to modify the `buildyaml.sh` file to ensure it's added to the site's navigation. This is true for any file added to the `docs/` folder. + +Be sure to periodically add/commit your edits so that you don't lose your work! We use version control software for a reason. + +### Build the documentation + +Building the documentation periodically gives you a glimpse into the final product, and is generally required if you're making changes to the table of contents. + +!!! attention "" + We have only tested the build process on Linux. Initial tests on OS X have been unsuccessful. Windows is fully untested at this point, but we would love to know if it works there as well! + +To build the documentation, you need `python`/`pip`, `mkdocs`, and `mkdocs-material` installed on your machine. + +Follow the [Python installation instructions](https://www.python.org/downloads/) for your machine. + +Use `pip`, which was installed alongside Python, to install `mkdocs` and `mkdocs-material`. Your operating system might force you to use `pip2` or `pip3` instead, dependin on which version of Python you have installed. + +```bash +$ pip install mkdocs mkdocs-material +``` + +??? note "Troubleshooting" + If you're having trouble with the installation of Python, `mkdocs`, or `mkdocs-material`, try looking into the `mkdocs` [installation instructions](https://squidfunk.github.io/mkdocs-material/getting-started/#installation). + +When `pip` is finished installing, navigate to the root directory of the Netdata repository and run the documentation generator script. + +```bash +$ sh docs/generator/buildhtml.sh +``` + +This process will take some time. Once finished, the built documentation site will be located at `docs/generator/build/`. + +### Run a local web server to test documentation + +The best way to view the documentation site you just built is to run a simple web server from the `docs/generator/build/` directory. So, navigate there and run a Python-based web server: + +``` +$ cd docs/generator/build/ +$ python3 -m http.server 20000 +``` + +Feel free to replace the port number you want this web server to listen on (port `20000` in this case [only one higher than the agent!]). + +Open your web browser and navigate to `http://localhost:20000`. If you replaced the port earlier, change it here as well. You can now navigate through the documentation as you would on the live site! + +## Pull requests and final steps + +When you're finished with your changes, add and commit them to your fork of the Netdata repository. Head over to GitHub to create your pull request (PR). + +Once we receive your pull request (PR), we'll take time to read through it and assess it for correctness, conciseness, and overall quality. We may point to specific sections and ask for additional information or other fixes. + +## What's next + +- Read up on the Netdata documentation [style guide](style-guide.md). diff --git a/docs/contributing/style-guide.md b/docs/contributing/style-guide.md new file mode 100644 index 000000000..42c981017 --- /dev/null +++ b/docs/contributing/style-guide.md @@ -0,0 +1,317 @@ +# Netdata style guide + +This in-progress style guide establishes editorial guidelines for anyone who wants to write documentation for Netdata products. + +## Table of contents + +- [Welcome!](#welcome) +- [Goals of the Netdata style guide](#goals-of-the-Netdata-style-guide) +- [General principles](#general-principles) +- [Tone and content](#tone-and-content) +- [Language and grammar](#language-and-grammar) +- [Markdown syntax](#markdown-syntax) +- [Accessibility](#accessibility) + +## Welcome + +Proper documentation is essential to the success of any open-source project. Netdata is no different. The health of our monitoring agent, and the community it's created, depends on this effort. + +We’re here to make developers, sysadmins, and DevOps engineers better at their jobs, after all! + +We welcome contributions to Netdata's documentation. Begin with the [contributing to documentation guide](contributing-documentation.md), followed by this style guide. + +## Goals of the Netdata style guide + +An editorial style guide establishes standards for writing and maintaining documentation. At Netdata, we focus on the following principles: + +- Consistency +- High-quality writing +- Conciseness +- Accessibility + +These principles will make documentation better for everyone who wants to use Netdata, whether they're a beginner or an expert. + +### Breaking the rules + +None of the rules described in this style guide are absolute. **We welcome rule-breaking if it creates better, more accessible documentation.** + +But be aware that Netdata staff or community members may ask you to justify your rule-breaking during the PR review process. + +## General principles + +Yes, this style guide is pretty overwhelming! Establishing standards for a global community is never easy. + +Here's a few key points to start with. Where relevant, they link to more in-depth information about a given rule. + +**[Tone and content](#tone-and-content)**: + +- Be [conversational and friendly](#conversational-and-friendly-tone). +- Write [concisely](#write-concisely). +- Don't use words like **here** when [creating hyperlinks](#use-informational-hyperlinks). +- Don't mention [future releases or features](#mentioning-future-releases-or-features) in documentation. + +**[Language and grammar](#language-and-grammar)**: + +- [Capitalize words](#capitalization) at the beginning of sentences, for proper nouns, and at the beginning of document titles and section headers. +- Use [second person](#second-person)—"you" rather than "we"—when giving instructions. +- Use [active voice](#active-voice) to make clear who or what is performing an action. +- Always employ an [Oxford comma](#oxford-comma) on lists. + +**[Markdown syntax](#markdown-syntax)**: + +- [Reference UI elements](#references-to-ui-elements) with bold text. +- Use our [built-in syntax highlighter](#language-specific-syntax-highlighting-in-code-blocks) to improve the readability and usefulness of code blocks. + +**[Accessibility](#accessibility)**: + +- Include [alt tags on images](#images). + +--- + +## Tone and content + +Netdata's documentation should be conversational, concise, and informational, without feeling formal. This isn't a textbook. It's a repository of information that should (on occasion!) encourage and excite its readers. + +By following a few principles on tone and content we'll ensure more readers from every background and skill level will learn as much as possible about Netdata's capabilities. + +### Conversational and friendly tone + +Netdata's documentation should be conversational and friendly. To borrow from Google's fantastic [developer style guide](https://developers.google.com/style/tone): + +> Try to sound like a knowledgeable friend who understands what the developer wants to do. + +Feel free to let some of your personality show! Documentation can be highly professional without being dry, formal, or overly instructive. + +### Write concisely + +You should always try to use as few words as possible to explain a particular feature, configuration, or process. Conciseness leads to more accurate and understandable writing. + +### Use informational hyperlinks + +Hyperlinks should clearly state its destination. Don't use words like "here" to describe where a link will take your reader. + +``` +# Not recommended +To install Netdata, click [here](https://docs.netdata.cloud/packaging/installer/). + +# Recommended +To install Netdata, read our [installation instructions](https://docs.netdata.cloud/packaging/installer/). +``` + +In general, guides should include fewer hyperlinks to keep the reader focused on the task at hand. Documentation should include as many hyperlinks as necessary to provide meaningful context. + +### Avoid words like "easy" or "simple" + +Never assume readers of Netdata documentation are experts in Netdata's inner workings or health monitoring/performance troubleshooting in general. + +If you claim that a task is easy and the reader struggles to complete it, they'll get discouraged. + +If you perceive one option to be easier than another, be specific about how and why. For example, don't write, "Netdata's one-line installer is the easiest way to install Netdata." Instead, you might want to say, "Netdata's one-line installer requires fewer steps than manually installing from source." + +### Avoid slang, metaphors, and jargon + +A particular word, phrase, or metaphor you're familiar with might not translate well to the other cultures featured among Netdata's global community. It's recommended you avoid slang or colloquialisms in your writing. + +If you must use industry jargon, such as "white-box monitoring," in a document, be sure to define the term as clearly and concisely as you can. + +> White-box monitoring: Monitoring of a system or application based on the metrics it directly exposes, such as logs. + +Avoid emojis whenever possible for the same reasons—they can be difficult to understand immediately and don't translate well. + +### Mentioning future releases or features + +Documentation is meant to describe the product as-is, not as it will be or could be in the future. Netdata documentation generally avoids talking about future features or products, even if we know they are inevitable. + +An exception can be made for documenting beta features that are subject to change with further development. + +## Language and grammar + +Netdata's documentation should be consistent in the way it uses certain words, phrases, and grammar. The following sections will outline the preferred usage for capitalization, point of view, active voice, and more. + +### Capitalization + +In text, follow the general [English standards](https://owl.purdue.edu/owl/general_writing/mechanics/help_with_capitals.html) for capitalization. In summary: + +- Capitalize the first word of every new sentence. +- Don't use uppercase for emphasis. (Netdata is the BEST!) +- Capitalize the names of brands, software, products, and companies according to their official guidelines. (Netdata, Docker, Apache, Nginx) +- Avoid camel case (NetData) or all caps (NETDATA). + +#### Capitalization of 'Netdata' and 'netdata' + +Whenever you refer to the company Netdata, Inc., or the open-source monitoring agent the company develops, capitalize **Netdata**. + +However, if you are referring to a process, user, or group on a Linux system, you should not capitalize, as by default those are typically lowercased. In this case, you should also fence these terms in an inline code block: `` `netdata` ``. + +``` +# Not recommended +The netdata agent, which spawns the netdata process, is actively maintained by netdata, inc. + +# Recommended +The Netdata agent, which spawns the `netdata` process, is actively maintained by Netdata, Inc. +``` + +#### Capitalization of document titles and page headings + +Document titles and page headings should use sentence case. That means you should only capitalize the first word. + +If you need to use the name of a brand, software, product, and company, capitalize it according to their official guidelines. + +Also, don't put a period (`.`) or colon (`:`) at the end of a title or header. + +**Document titles**: + +| Capitalization | Not recommended | Recommended +| --- | --- | --- +| Document titles | Getting Started Guide | Getting started guide +| Page headings | Service Discovery and Auto-Detection: | Service discovery and auto-detection +| Proper nouns | Install netdata with docker | Install Netdata with Docker + +### Second person + +When writing documentation, you should use the second person ("you") to give instructions. When using the second person, you give the impression that you're personally leading your reader through the steps or tips in question. + +See how that works? It's a core part of making Netdata's documentation feel welcoming to all. + +Avoid using "we," "I," "let's," and "us" in documentation whenever possible. + +The "you" pronoun can also be implied, depending on your sentence structure. + +``` +# Not recommended +To install Netdata, we should try the one-line installer... + +# Recommended +To install Netdata, you should try the one-line installer... + +# Recommended, implied "you" +To install Netdata, try the one-line installer... +``` + +### Active voice + +Use active voice instead of passive voice, because active voice is more concise and easier to understand. + +When using voice, the subject of the sentence is performing the action. In passive voice, the subject is being acted upon. A famous example of passive voice is the phrase "mistakes were made." + +``` +# Not recommended (passive) +When an alarm is triggered by a metric, a notification is sent by Netdata... + +# Recommended (active) +When a metric triggers an alarm, Netdata sends a notification... +``` + +### Standard American spelling + +While the Netdata team is mostly *not* American, we still aspire to use American spelling whenever possible, as it is more commonly used within the monitoring industry. + +### Clause order + +If you want to instruct your reader to take some action in a particular circumstance, such as optional steps, the beginning of the sentence should indicate that circumstance. + +``` +# Not recommended +Read the reference guide if you'd like to learn more about custom dashboards. + +# Recommended +If you'd like to learn more about custom dashboards, read the reference guide. +``` + +By placing the circumstance at the beginning of the sentence, those who don't want to follow can stop reading and move on. Those who *do* want to read it are less likely to skip over the sentence. + +### Oxford comma + +The Oxford comma is the comma used after the second-to-last item in a list of three or more items. It appears just before "and" or "or." + +``` +# Not recommended +Netdata can monitor RAM, disk I/O, MySQL queries per second and lm-sensors. + +# Recommended +Netdata can monitor RAM, disk I/O, MySQL queries per second, and lm-sensors. +``` + +## Markdown syntax + +The Netdata documentation uses the Markdown syntax for styling and formatting. If you're not familiar with how it works, please read the [Markdown introduction post](https://daringfireball.net/projects/markdown/) by its creator, followed by [Mastering Markdown](https://guides.github.com/features/mastering-markdown/) guide from GitHub. + +We also leverage the power of the [Material theme for MkDocs](https://squidfunk.github.io/mkdocs-material/), which features several [extensions](https://squidfunk.github.io/mkdocs-material/extensions/admonition/), such as the ability to create notes, warnings, and collapsible blocks. + +You can follow the syntax specified in the above resources for the majority of documents, but the following sections specify a few particular use cases. + +### References to UI elements + +If you need to instruct your reader to click a user interface (UI) element inside of a Netdata interface, you should reference the label text of the link/button with Markdown's (`**bold text**`) tag. + +```markdown +Click on the **Sign in** button. +``` + +!!! note + Whenever possible, avoid using directional language to orient readers, because not every reader can use instructions like "look at the top-left corner" to find their way around an interface. + +``` +If you feel that you must use directional language, perhaps use an [image](#images) (with proper alt text) instead. + +We're also working to establish standards for how we refer to certain elements of the Netdata's web interface. We'll include that in this style guide as soon as it's complete. +``` + +### Language-specific syntax highlighting in code blocks + +Our documentation uses the [Highlight extension](https://facelessuser.github.io/pymdown-extensions/extensions/highlight/) for syntax highlighting. Highlight is fully compatible with [Pygments](http://pygments.org/), allowing you to highlight the syntax within code blocks in a number of interesting ways. + +For a full list of languages, see [Pygment's supported languages](http://pygments.org/languages/). Netdata documentation will use the following for the most part: `c`, `python`, `js`, `shell`, `markdown`, `bash`, `css`, `html`, and `go`. If no language is specified, the Highlight extension doesn't apply syntax highlighting. + +Include the language directly after the three backticks (```` ``` ````) that start the code block. For highlighting C code, for example: + +```` +```c +inline char *health_stock_config_dir(void) { + char buffer[FILENAME_MAX + 1]; + snprintfz(buffer, FILENAME_MAX, "%s/health.d", netdata_configured_stock_config_dir); + return config_get(CONFIG_SECTION_HEALTH, "stock health configuration directory", buffer); +} +``` +```` + +And the prettified result: + +```c +inline char *health_stock_config_dir(void) { + char buffer[FILENAME_MAX + 1]; + snprintfz(buffer, FILENAME_MAX, "%s/health.d", netdata_configured_stock_config_dir); + return config_get(CONFIG_SECTION_HEALTH, "stock health configuration directory", buffer); +} +``` + +You can also use the Highlight and [SuperFences](https://facelessuser.github.io/pymdown-extensions/extensions/superfences/) extensions together to show line numbers or highlight specific lines. + +Display line numbers by appending `linenums="1"` after the language declaration, replacing `1` with the starting line number of your choice. Highlight lines by appending `hl_lines="2"`, replacing `2` with the line you'd like to highlight. Or, multiple lines: `hl_lines="1 2 4 12`. + +!!! note + Line numbers and highlights are not compatible with GitHub's Markdown parser, and thus will only be viewable on our [documentation site](https://docs.netdata.cloud/). They should be used sparingly and only when necessary. + +## Accessibility + +Netdata's documentation should be as accessible as possible to as many people as possible. While the rules about [tone and content](#tone-and-content) and [language and grammar](#language-and-grammar) are helpful to an extent, we also need some additional rules to improve the reading experience for all readers. + +### Images + +Images are an important component to documentation, which is why we have a few rules around their usage. + +Perhaps most importantly, don't use only images to convey instructions. Each image should be accompanied by alt text and text-based instructions to ensure that every reader can access the information in the best way for them. + +#### Alt text + +Provide alt text for every image you include in Netdata's documentation. It should summarize the intent and content of the image. + +In Markdown, use the standard image syntax, `![]()`, and place the alt text between the brackets `[]`. Here's an example using our logo: + +``` + +``` + +#### Images of text + +Don't use images of text, code samples, or terminal output. Instead, put that text content in a code block so that all devices can render it clearly and screen readers can parse it. diff --git a/docs/generator/buildyaml.sh b/docs/generator/buildyaml.sh index f887c695d..95e11c5a5 100755 --- a/docs/generator/buildyaml.sh +++ b/docs/generator/buildyaml.sh @@ -104,7 +104,8 @@ markdown_extensions: - pymdownx.details - pymdownx.highlight: pygments_style: manni - noclasses: true + css_class: "highlight codehilite" + linenums_style: pymdownx-inline - pymdownx.inlinehilite - pymdownx.magiclink - pymdownx.mark @@ -135,7 +136,6 @@ echo -ne " - 'docs/what-is-netdata.md' - 'docs/a-github-star-is-important.md' - REDISTRIBUTED.md - CHANGELOG.md - - CONTRIBUTING.md - SECURITY.md - Why Netdata: - 'docs/why-netdata/README.md' @@ -175,6 +175,13 @@ echo -ne " - 'docs/Performance.md' - 'docs/high-performance-netdata.md' " +navpart 1 . netdata-cloud "Netdata Cloud" +echo -ne " + - 'docs/netdata-cloud/README.md' + - 'docs/netdata-cloud/signing-in.md' + - 'docs/netdata-cloud/nodes-view.md' +" + navpart 1 collectors "" "Data collection" 1 echo -ne " - 'docs/Add-more-charts-to-netdata.md' - Internal plugins: @@ -264,13 +271,19 @@ navpart 2 web/api/badges "" "" 2 navpart 2 web/api/health "" "" 2 navpart 2 web/api/queries "" "Queries" 2 -echo -ne "- Additional Info: +echo -ne "- Contributing to Netdata: + - CONTRIBUTING.md + - 'docs/contributing/contributing-documentation.md' + - 'docs/contributing/style-guide.md' - CODE_OF_CONDUCT.md - CONTRIBUTORS.md - packaging/maintainers/README.md " + +echo -ne "- Additional information: +" navpart 2 packaging/makeself "" "" 4 navpart 2 libnetdata "" "libnetdata" 4 navpart 2 contrib navpart 2 tests "" "" 2 -navpart 2 diagrams/data_structures +navpart 2 diagrams/data_structures
\ No newline at end of file diff --git a/docs/generator/checklinks.sh b/docs/generator/checklinks.sh index 5012ad17d..6521ca9ad 100755 --- a/docs/generator/checklinks.sh +++ b/docs/generator/checklinks.sh @@ -227,7 +227,7 @@ checklinks () { while read -r l ; do for word in $l ; do if [[ $word =~ .*\]\(([^\(\) ]*)\).* ]] ; then - lnk="${BASH_REMATCH[1]}" + lnk=$(echo "${BASH_REMATCH[1]}" | tr -d '<>') if [ -z "$lnk" ] ; then continue ; fi dbg "-$lnk" case "$lnk" in diff --git a/docs/generator/custom/css/netdata.css b/docs/generator/custom/css/netdata.css index 27f1b08cc..7b1934db4 100644 --- a/docs/generator/custom/css/netdata.css +++ b/docs/generator/custom/css/netdata.css @@ -14,7 +14,6 @@ /* Custom styling for the new documentation homepage. In particular, the three buttons for install/getting started/configuration. */ - .homepage-nav { display: flex; margin-top: 1.4rem; @@ -64,11 +63,33 @@ margin-bottom: 6rem; } -/* Make sure inline code in tables doesn't break. */ +/* Make sure inline code in tables don't break. */ .md-typeset__table code { word-break: normal; } +/* Give code blocks a little more line height */ +.md-typeset pre { + line-height: 1.6; +} + +/* Show line numbers. */ +[data-linenos]:before { + border-right: .0625rem solid #ddd; + color: #999; + content: attr(data-linenos); + display: inline-block; + margin-left: -1.2rem; + margin-right: .7rem; + padding-left: 1.2rem; +} + +.md-typeset .highlight .hll { + display: inline; + margin: 0; + padding: 0; +} + /* Bold the first item on the docs sidebar: Netdata Documentation */ .md-nav--primary > .md-nav__list > .md-nav__item:first-of-type { font-weight: 700; diff --git a/docs/high-performance-netdata.md b/docs/high-performance-netdata.md index 553ad6da0..3611fee38 100644 --- a/docs/high-performance-netdata.md +++ b/docs/high-performance-netdata.md @@ -10,13 +10,13 @@ If you plan to have your Netdata public on the internet, this strategy wastes re In the following nginx configuration we do the following: -- allow nginx to maintain up to 1024 idle connections to Netdata (so Netdata will have up to 1024 threads waiting for requests) +- allow nginx to maintain up to 1024 idle connections to Netdata (so Netdata will have up to 1024 threads waiting for requests) -- allow nginx to compress the responses of Netdata (later we will disable gzip compression at Netdata) +- allow nginx to compress the responses of Netdata (later we will disable gzip compression at Netdata) -- we disable wordpress pingback attacks and allow only GET, HEAD and OPTIONS requests. +- we disable wordpress pingback attacks and allow only GET, HEAD and OPTIONS requests. -``` +```conf upstream backend { server 127.0.0.1:19999; keepalive 1024; @@ -65,25 +65,25 @@ Then edit `/etc/netdata/netdata.conf` and set these config options: These options: -- `[global].bind socket to IP = 127.0.0.1` makes Netdata listen only for requests from localhost (nginx). -- `[global].access log = none` disables the access.log of Netdata. It is not needed since Netdata only listens for requests on 127.0.0.1 and thus only nginx can access it. nginx has its own access.log for your record. -- `[global].disconnect idle web clients after seconds = 3600` will kill inactive web threads after an hour of inactivity. -- `[global].enable web responses gzip compression = no` disables gzip compression at Netdata (nginx will compress the responses). +- `[global].bind socket to IP = 127.0.0.1` makes Netdata listen only for requests from localhost (nginx). +- `[global].access log = none` disables the access.log of Netdata. It is not needed since Netdata only listens for requests on 127.0.0.1 and thus only nginx can access it. nginx has its own access.log for your record. +- `[global].disconnect idle web clients after seconds = 3600` will kill inactive web threads after an hour of inactivity. +- `[global].enable web responses gzip compression = no` disables gzip compression at Netdata (nginx will compress the responses). ## 2. increase open files limit (non-systemd) By default Linux limits open file descriptors per process to 1024. This means that less than half of this number of client connections can be accepted by both nginx and Netdata. To increase them, create 2 new files: -1. `/etc/security/limits.d/nginx.conf`, with these contents: +1. `/etc/security/limits.d/nginx.conf`, with these contents: - ``` +``` nginx soft nofile 10000 nginx hard nofile 30000 ``` -2. `/etc/security/limits.d/netdata.conf`, with these contents: +2. `/etc/security/limits.d/netdata.conf`, with these contents: - ``` +``` netdata soft nofile 10000 netdata hard nofile 30000 ``` @@ -98,25 +98,25 @@ sysctl -p Thanks to [@leleobhz](https://github.com/netdata/netdata/issues/655#issue-163932584), this is what you need to raise the limits using systemd: -This is based on https://ma.ttias.be/increase-open-files-limit-in-mariadb-on-centos-7-with-systemd/ and here worked as following: +This is based on <https://ma.ttias.be/increase-open-files-limit-in-mariadb-on-centos-7-with-systemd/> and here worked as following: -1. Create the folders in /etc: +1. Create the folders in /etc: - ``` +``` mkdir -p /etc/systemd/system/netdata.service.d mkdir -p /etc/systemd/system/nginx.service.d ``` -2. Create limits.conf in each folder as following: +2. Create limits.conf in each folder as following: - ``` +``` [Service] LimitNOFILE=30000 ``` -3. Reload systemd daemon list and restart services: +3. Reload systemd daemon list and restart services: - ```sh +```sh systemctl daemon-reload systemctl restart netdata.service systemctl restart nginx.service @@ -145,7 +145,6 @@ Max open files 30000 30000 files # cat /proc/$(ps aux | grep "netdata" | head -n1 | grep -v grep | awk '{print $2}')/limits | grep "Max open files" Max open files 30000 30000 files - ``` -[]() +[](<>) diff --git a/docs/netdata-cloud/README.md b/docs/netdata-cloud/README.md new file mode 100644 index 000000000..92084c3c0 --- /dev/null +++ b/docs/netdata-cloud/README.md @@ -0,0 +1,44 @@ +# Netdata Cloud + +Netdata Cloud is core to our ongoing mission to provide real-time, distributed health monitoring and performance troubleshooting. It's the foundation of an ecosystem of tools that will help you build more extraordinary infrastructures. + +Netdata Cloud is also the next iteration of our global Netdata registry. For technical information about how our registries work, what information they store, and how your web browser "talks" to both, visit our [registry documentation](../../registry). + +Learn more about the future of Netdata Cloud on our [announcement post](https://blog.netdata.cloud/posts/netdata-cloud-announcement/). + +## Registering for or signing in to Netdata Cloud + +**If you're ready to register for a new Netdata Cloud account, or sign in to your existing Netdata Cloud account, visit our [signing in guide](signing-in.md) for details.** + +!!! attention "Private registries and Netdata Cloud" + If you're running a private registry and are interested in trying out Netdata Cloud as a replacement for your private registry, read [our notice](signing-in.md#private-registries-and-netdata-cloud) about transitioning from a private registry to our Netdata Cloud registry. + +## Netdata Cloud features + +Netdata Cloud currently enables two features: the **My nodes** in the top-left corner of the Netdata dashboard, and the [**Nodes View**](nodes-view.md). + +We have an aggressive roadmap of new features, such as Workspaces for different parts of your infrastructure, Rooms to collaborate with colleagues, and the ability to receive alarms from any number of distributed Netdata agents in a single place. Read more about our proposed features [here](https://blog.netdata.cloud/posts/netdata-cloud-announcement/#what-features-will-netdata-cloud-offer). + +### Planned enterprise features (paid) + +Large enterprises have unique real-time monitoring needs. They have thousands of servers and applications running concurrently, and are willing to pay for the complex features that help them make smarter, faster decisions about their infrastructure. We expect to create a paid tier of Netdata Cloud with a recurring, per-user pricing model that will unlock enterprise-focused features. + +A few of these planned features include: + +- Long-term storage of Netdata UI snapshots +- Active Directory integration for single sign-on +- Private service status pages +- Extended retention of alarms timelines +- Incident response toolkits +- Additional enterprise plugins and integrations +- Extended retention of chat messages + +Again, we expect that the vast majority of Netdata's users won't need these features. Creating these two tiers will help us further fund the company's efforts to deploy Netdata's open-source agent on a massive scale and entirely for free. + +## Running Netdata without Netdata Cloud + +Netdata Cloud is entirely optional. The application will never force you to create a Netdata Cloud account or associate nodes with the public registries. But, if you choose not to use Netdata Cloud, you will be missing out on the [Nodes View](nodes-view.md) and other upcoming features. + +## Running Netdata Cloud on-premises or as a hosted instance + +We plan on making both on-premises and hosted instances of Netdata Cloud available to enterprises. Until then, we are creating a list of people and businesses interested in either of these options. To add yourself or your organization to this list, email us at [info@netdata.cloud](mailto:info@netdata.cloud). diff --git a/docs/netdata-cloud/nodes-view.md b/docs/netdata-cloud/nodes-view.md new file mode 100644 index 000000000..ec09821c4 --- /dev/null +++ b/docs/netdata-cloud/nodes-view.md @@ -0,0 +1,206 @@ +# Using the Nodes View + +## Introduction + +As of v1.15.0 of Netdata, and in conjunction with our announcement post about the [future of Netdata](https://blog.netdata.cloud/posts/netdata-cloud-announcement/), we have enabled an entirely new way to view your infrastructure using the open-source Netdata agent in conjunction with Netdata Cloud: the **Nodes View**. + +This view, powered by Netdata Cloud, provides an aggregated view of the Netdata agents that you have associated with your Netdata Cloud account. The main benefit of Nodes View is seeing the health of your infrastructure from a single interface, especially if you have many systems running Netdata. With Nodes View, you can monitor the health status of your nodes via active alarms and view a subset of real-time performance metrics the agent is collecting every second. + +!!! attention "Nodes View is beta software!" + The Nodes View is currently in beta, so all typical warnings about beta software apply. You may come across bugs or inconsistencies. + +``` +The current version of Nodes uses the API available on each Netdata agent to check for new alarms and the machine's overall health/availability. In the future, we will offer both polling via the API and real-time streaming of health status/metrics. +``` + +## The Nodes View + +To access the Nodes View, you must first be signed in to Netdata Cloud. To register for an account, or sign in to an existing account, visit our [signing in guide](signing-in.md) for details. + +Once you're signed in to Netdata Cloud, clicking on any of the **Nodes Beta** buttons in the node's web dashboard will lead you to the Nodes View. Find one (`1`) in the dropdown menu in the upper-right corner, a second (`2`) in the top navigation bar, and a third (`3`) in the dropdown menu in the top-left corner of the Netdata dashboard. + +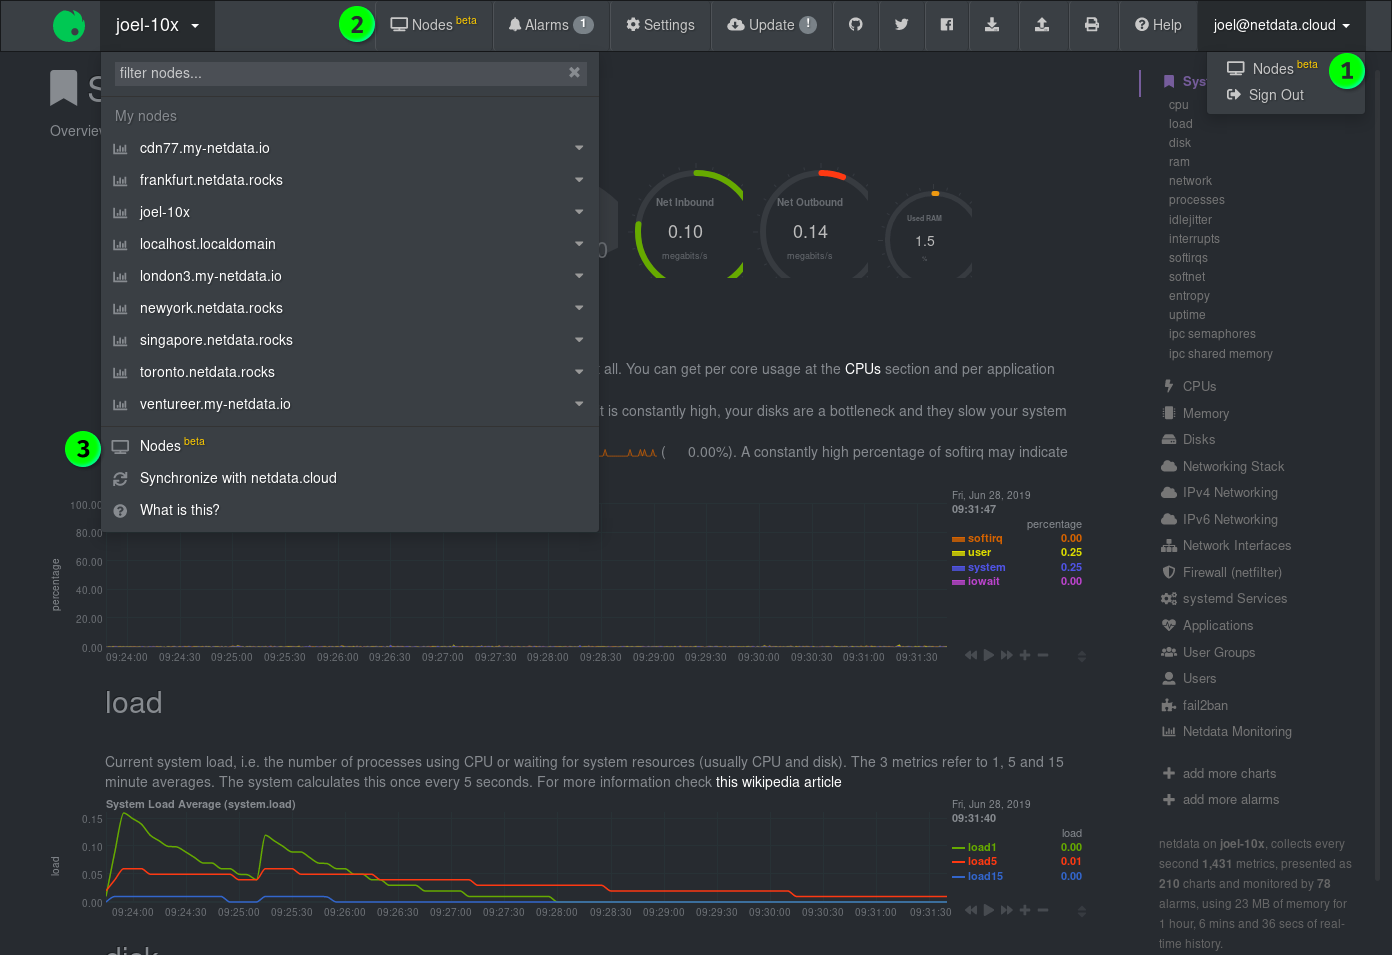 + +### Nodes + +The primary component of the Nodes View is a list of all the nodes with Netdata agents you have associated with your Netdata Cloud account via the Netdata Cloud registry. + +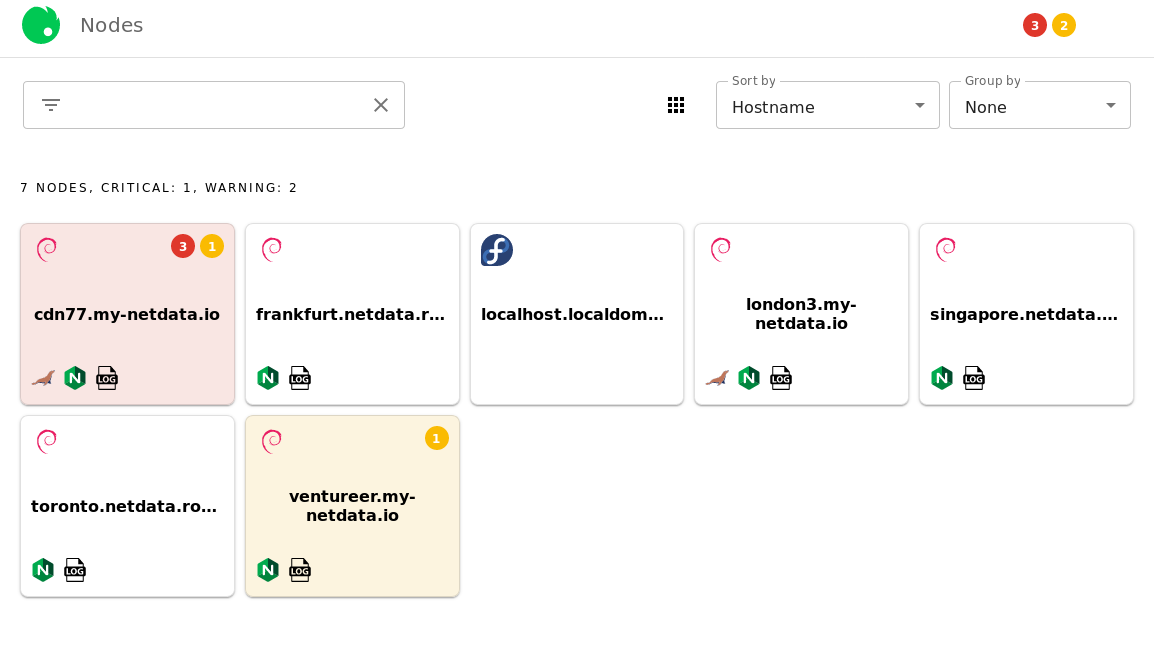 + +Depending on which [view mode](#view-modes) you're using, Nodes View will present you with information about that node, such as its hostname, operating system, warnings/critical alerts, and any [supported services](#Services-available-in-the-Nodes-View) that are running on that node. Here is an example of the **full** view mode: + +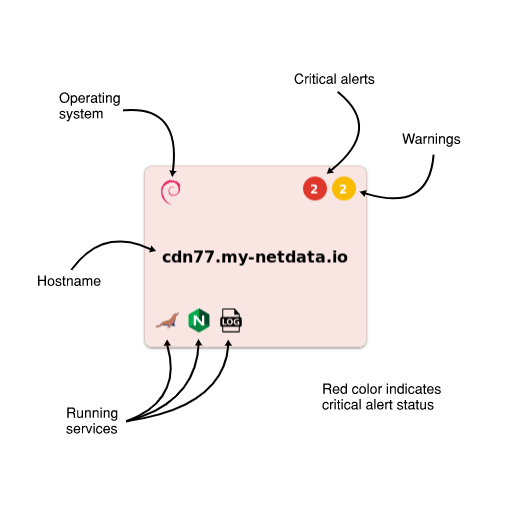 + +The background color of each Node entry is an indication of its health status: + +| Health status | Background color | +| ------------- | ------------------------------------------------------------------------------------------------- | +| **White** | Normal status, no alarms | +| **Yellow** | 1 or more active warnings | +| **Red** | 1 or more active critical alerts | +| **Grey** | Node is unreachable (server unreachable [due to network conditions], server down, or changed URL) | + +### Node overview + +When you click on any of the Nodes, an overview sidebar will appear on the right-hand side of the Nodes View. + +This overview contains the following: + +- An icon (`1`) representing the operating system installed on that machine +- The hostname (`2`) of the machine +- A link (`3`) to the URL at which the web dashboard is available +- Three tabs (`4`) for **System** metrics, **Services** metrics, and **Alarms** +- A number of selectors (`5`) to choose which metrics/alarms are shown in the overview + - **System** tab: _Overview_, _Disks_, and _Network_ selectors + - **Services** tab: _Databases_, _Web_, and _Messaging_ selectors + - **Alarms** tab: _Critical_ and _Warning_ selectors +- The visualizations and/or alarms (`6`) supported under the chosen tab and selector +- Any other available URLS (`7`) associated with that node under the **Node URLs** header. + +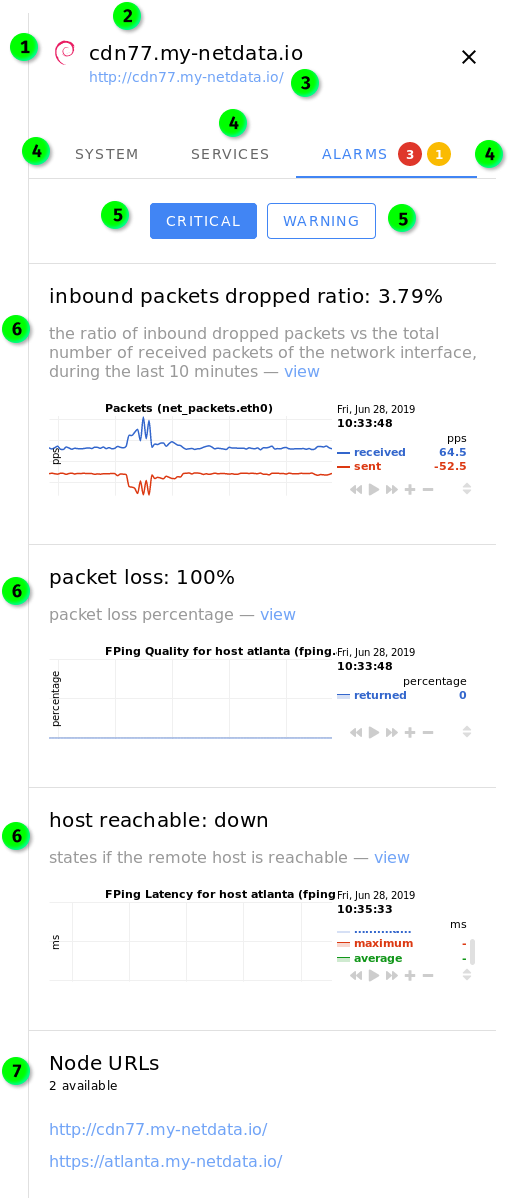 + +By default, clicking on a Node will display the sidebar with the **System** tab enabled. If there are warnings or alarms active for that Node, the **Alarms** tab will be displayed by default. + +**The visualizations in the overview sidebar are live!** As with all of Netdata's visualizations, you can scrub forward and backward in time, zoom, pause, and pinpoint anomalies down to the second. + +#### System tab + +The **System** tab has three sections: *Overview*, *Disks*, and *Network*. + +_Overview_ displays visualizations for `CPU`, `System Load Average` `Disk I/O`, `System RAM`, `System Swap`, `Physical Network Interfaces Aggregated Bandwidth`, and the URL of the node. + +_Disks_ displays visualizations for `Disk Utilization Time`, and `Disk Space Usage` for every available disk. + +_Network_ displays visualizations for `Bandwidth` for every available networking device. + +#### Services tab + +The **Services** tab will show visualizations for any [supported services](#Services-available-in-the-Nodes-View) that are running on that node. Three selectors are available: _Databases_, _Web_, and _Messaging_. If there are no services under any of these categories, the selector will not be clickable. + +#### Alarms tab + +The **Alarms** tab contains two selectors: _Critical_ and _Warning_. If there are no alarms under either of these categories, the selector will not be clickable. + +Both of these tabs will display alarms information when available, along with the relevant visualization with metrics from your Netdata agent. The `view` link redirects you to the web dashboard for the selected node and automatically shows the appropriate visualization and timeframe. + +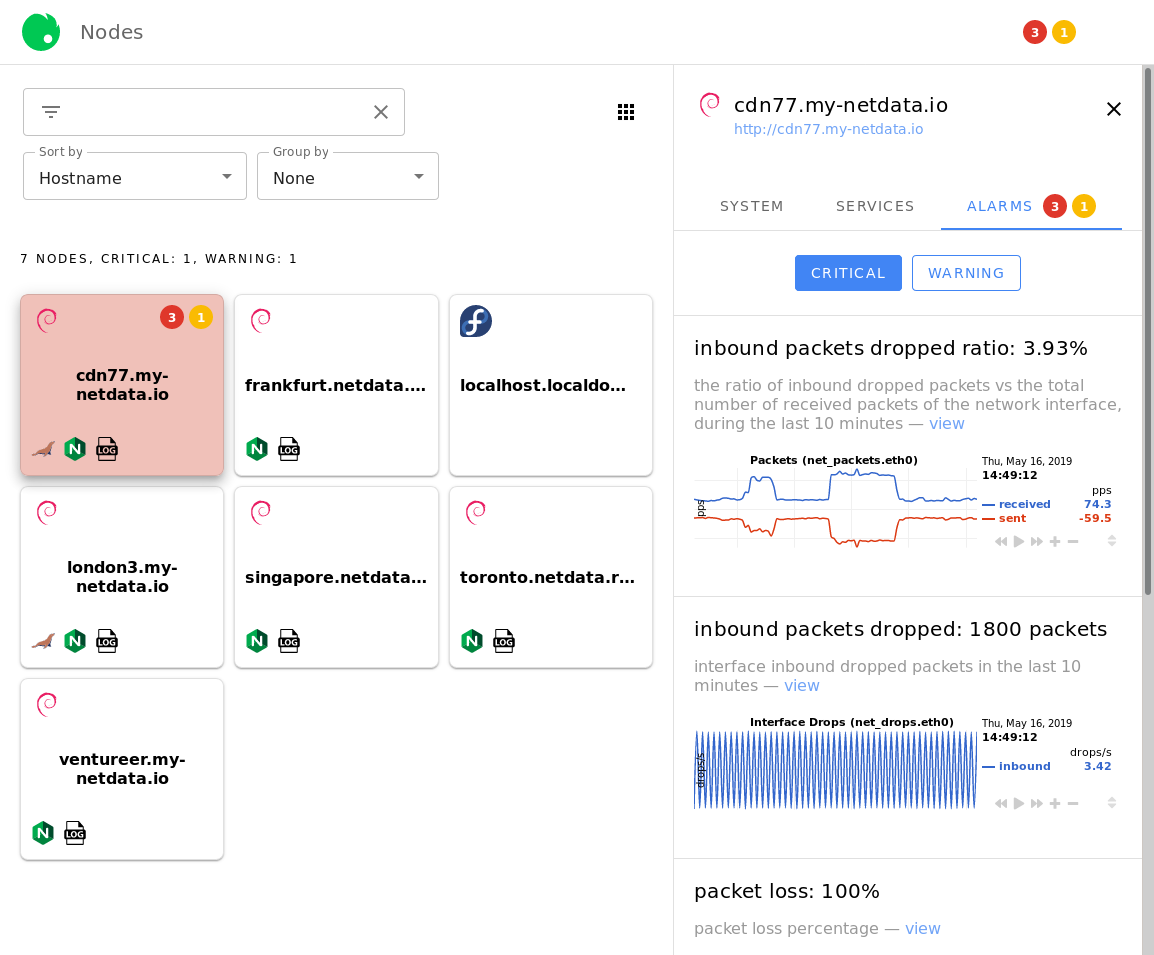 + +### Filtering field + +The search field will be useful for Netdata Cloud users with dozens or hundreds of Nodes. You can filter for the hostname of the Node you're interested in, the operating system it's running, or even for the services installed. + +The filtering field will offer you autocomplete suggestions. For example, the options available after typing `ng` into the filtering field: + +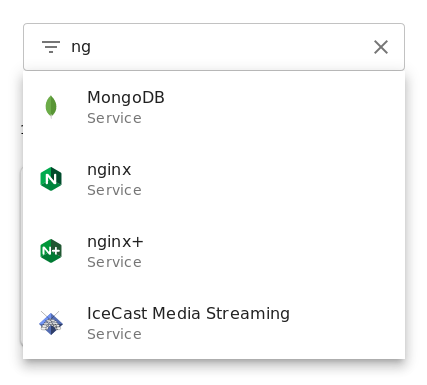 + +If you select multiple filters, results will display according to an `OR` operator. + +### View modes + +To the right of the filtering field is three functions that will help you organize your Visited Nodes according to your preferences. + + + +The view mode button lets you switch between three view modes: + +- **Full** mode, which displays the following information in a large squares for each connected Node: + - Operating system + - Critical/warning alerts in two separate indicators + - Hostname + - Icons for [supported services](#services-available-in-the-nodes-view) + +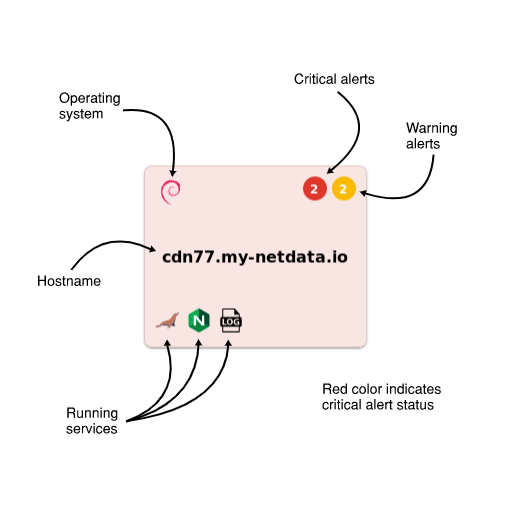 + +- **Compact** mode, which displays the following information in small squares for each connected Node: + - Operating system + +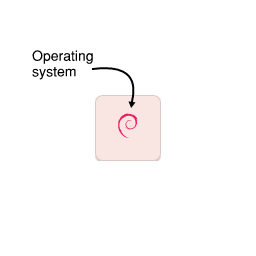 + +- **Detailed** mode, which displays the following information in large horizontal rectangles for each connected Node: + - Operating system + - Critical/warning alerts in two separate indicators + - Hostname + - Icons for [supported services](#services-available-in-the-nodes-view) + +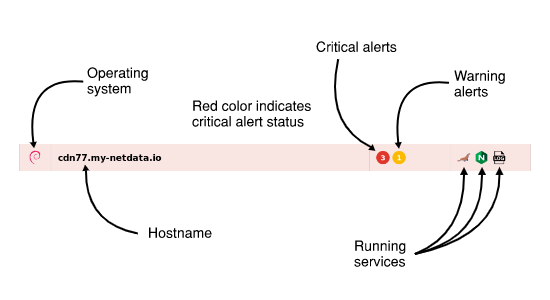 + +## Sorting, and grouping + +The **Sort by** dropdown allows you to choose between sorting _alphabetically by hostname_, most _recently-viewed_ nodes, and most _frequently-view_ nodes. + +The **Group by** dropdown lets you switch between _alarm status_, _running services_, or _online status_. + +For example, the following screenshot represents the Nodes list with the following options: _detailed list_, _frequently visited_, and _alarm status_. + +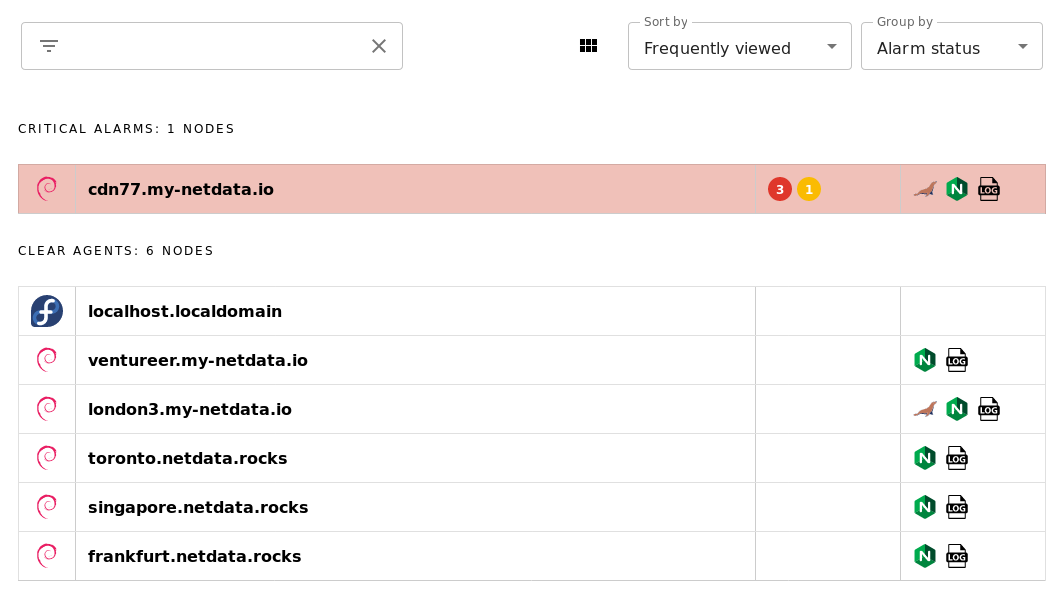 + +Play around with the options until you find a setup that works for you. + +## Adding more agents to the Nodes View + +There is currently only one way to associate additional Netdata nodes with your Netdata Cloud account. You must visit the web dashboard for each node and click the **Sign in** button and complete the [sign in process](signing-in.md#signing-in-to-your-netdata-cloud-account). + +!!! note "" + We are aware that the process of registering each node individually is cumbersome for those who want to implement Netdata Cloud's features across a large infrastructure. + +``` +Please view [this comment on issue #6318](https://github.com/netdata/netdata/issues/6318#issuecomment-504106329) for how we plan on improving the process for adding additional nodes to your Netdata Cloud account. +``` + +## Services available in the Nodes View + +The following tables elaborate on which services will appear in the Nodes View. Alerts from [other collectors](../../collectors/README.md), when entered an alarm status, will show up in the _Alarms_ tab despite not appearing + +### Databases + +These services will appear under the _Databases_ selector beneath the _Services_ tab. + +| Service | Collectors | Context #1 | Context #2 | Context #3 | +|--- |--- |--- |--- |--- | +| MySQL | `python.d.plugin:mysql`, `go.d.plugin:mysql` | `mysql.queries` | `mysql.net` | `mysql.connections` | +| MariaDB | `python.d.plugin:mysql`, `go.d.plugin:mysql` | `mysql.queries` | `mysql.net` | `mysql.connections` | +| Oracle Database | `python.d.plugin:oracledb` | `oracledb.session_count` | `oracledb.physical_disk_read_writes ` | `oracledb.tablespace_usage_in_percent` | +| PostgreSQL | `python.d.plugin:postgres` | `postgres.checkpointer` | `postgres.archive_wal` | `postgres.db_size` | +| MongoDB | `python.d.plugin:mongodb` | `mongodb.active_clients` | `mongodb.read_operations` | `mongodb.write_operations` | +| ElasticSearch | `python.d.plugin:elasticsearch` | `elastic.search_performance_total` | `elastic.index_performance_total` | `elastic.index_segments_memory` | +| CouchDB | `python.d.plugin:couchdb` | `couchdb.activity` | `couchdb.response_codes` | | +| Proxy SQL | `python.d.plugin:proxysql` | `proxysql.questions` | `proxysql.pool_status` | `proxysql.pool_overall_net` | +| Redis | `python.d.plugin:redis` | `redis.operations` | `redis.net` | `redis.connections` | +| MemCached | `python.d.plugin:memcached` | `memcached.cache` | `memcached.net` | `memcached.connections` | +| RethinkDB | `python.d.plugin:rethinkdbs` | `rethinkdb.cluster_queries` | `rethinkdb.cluster_clients_active` | `rethinkdb.cluster_connected_servers` | +| Solr | `go.d.plugin:solr` | `solr.search_requests` | `solr.update_requests` | | + +### Web services + +These services will appear under the _Web_ selector beneath the _Services_ tab. These also include proxies, load balancers (LB), and streaming services. + +| Service | Collectors | Context #1 | Context #2 | Context #3 | +|--- |--- |--- |--- |--- | +| Apache | `python.d.plugin:apache`, `go.d.plugin:apache` | `apache.requests` | `apache.connections` | `apache.net ` | +| nginx | `python.d.plugin:nginx`, `go.d.plugin:nginx` | `nginx.requests` | `nginx.connections` | | +| nginx+ | `python.d.plugin:nginx_plus` | `nginx_plus.requests_total` | `nginx_plus.connections_statistics` | | +| lighthttpd | `python.d.plugin:lighttpd`, `go.d.plugin:lighttpd` | `lighttpd.requests` | `lighttpd.net` | | +| lighthttpd2 | `go.d.plugin:lighttpd2` | `lighttpd2.requests` | `lighttpd2.traffic` | | +| LiteSpeed | `python.d.plugin:litespeed` | `litespeed.requests` | `litespeed.requests_processing` | | +| Tomcat | `python.d.plugin:tomcat` | `tomcat.accesses` | `tomcat.processing_time` | `tomcat.bandwidth` | +| PHP FPM | `python.d.plugin:phpfm` | `phpfpm.performance` | `phpfpm.requests` | `phpfpm.connections` | +| HAproxy | `python.d.plugin:haproxy` | `haproxy_f.scur` | `haproxy_f.bin` | `haproxy_f.bout` | +| Squid | `python.d.plugin:squid` | `squid.clients_requests` | `squid.clients_net` | | +| Traefik | `python.d.plugin:traefik` | `traefik.response_codes` | | | +| Varnish | `python.d.plugin:varnish` | `varnish.session_connection` | `varnish.client_requests` | | +| IPVS | `proc.plugin:/proc/net/ip_vs_stats` | `ipvs.sockets` | `ipvs.packets` | | +| Web Log | `python.d.plugin:web_log`, `go.d.plugin:web_log` | `web_log.response_codes` | `web_log.bandwidth` | | +| IPFS | `python.d.plugin:ipfs` | `ipfs.bandwidth` | `ipfs.peers` | | +| IceCast Media Streaming | `python.d.plugin:icecast` | `icecast.listeners` | | | +| RetroShare | `python.d.plugin:retroshare` | `retroshare.bandwidth` | `retroshare.peers` | | +| HTTP Check | `python.d.plugin:httpcheck`, `go.d.plugin:httpcheck` | `httpcheck.responsetime` | `httpcheck.status` | | +| x509 Check | `go.d.plugin:x509check` | `x509check.time_until_expiration` | | | + +### Messaging + +These services will appear under the _Messaging_ selector beneath the _Services_ tab. + +| Service | Collectors | Context #1 | Context #2 | Context #3 | +| --- | --- | --- | --- | --- | +| RabbitMQ | `python.d.plugin:rabbitmq`, `go.d.plugin:rabbitmq` | `rabbitmq.queued_messages` | `rabbitmq.erlang_run_queue` | +| Beanstalkd | `python.d.plugin:beanstalk` | `beanstalk.total_jobs_rate` | `beanstalk.connections_rate` | `beanstalk.current_tubes` | diff --git a/docs/netdata-cloud/signing-in.md b/docs/netdata-cloud/signing-in.md new file mode 100644 index 000000000..6e9e334a1 --- /dev/null +++ b/docs/netdata-cloud/signing-in.md @@ -0,0 +1,155 @@ +# Registration and signing in + +To use the features of [Netdata Cloud](README.md), you must first register an account with Netdata Cloud and associate your first Netdata node with the Netdata Cloud [registry](../../registry/README.md). **Netdata Cloud is entirely free for all Netdata users**, and does not store any metrics created by your machines. You keep your data—Netdata Cloud just connects it all together. + +!!! attention "Opting-in to Netdata Cloud" + By [signing in](signing-in.md) to Netdata Cloud, you opt-in to let Netdata Cloud receive and store the information described [here](../../registry/README.md#what-data-does-the-registry-store). We never store the metrics collected by Netdata agents, just machine GUIDs, person GUID, URLs, and account information. + +## Registering a Netdata Cloud account + +There is only one prerequisite to using Netdata Cloud: A working Netdata agent. If you don't have a running Netdata agent yet, check out the [installation guides](../../packaging/installer/) for more information. + +To begin, visit the web dashboard of your Netdata agent by navigating your browser of choice to `http://SERVER-IP:19999`. You’ll see a dashboard much like this: + +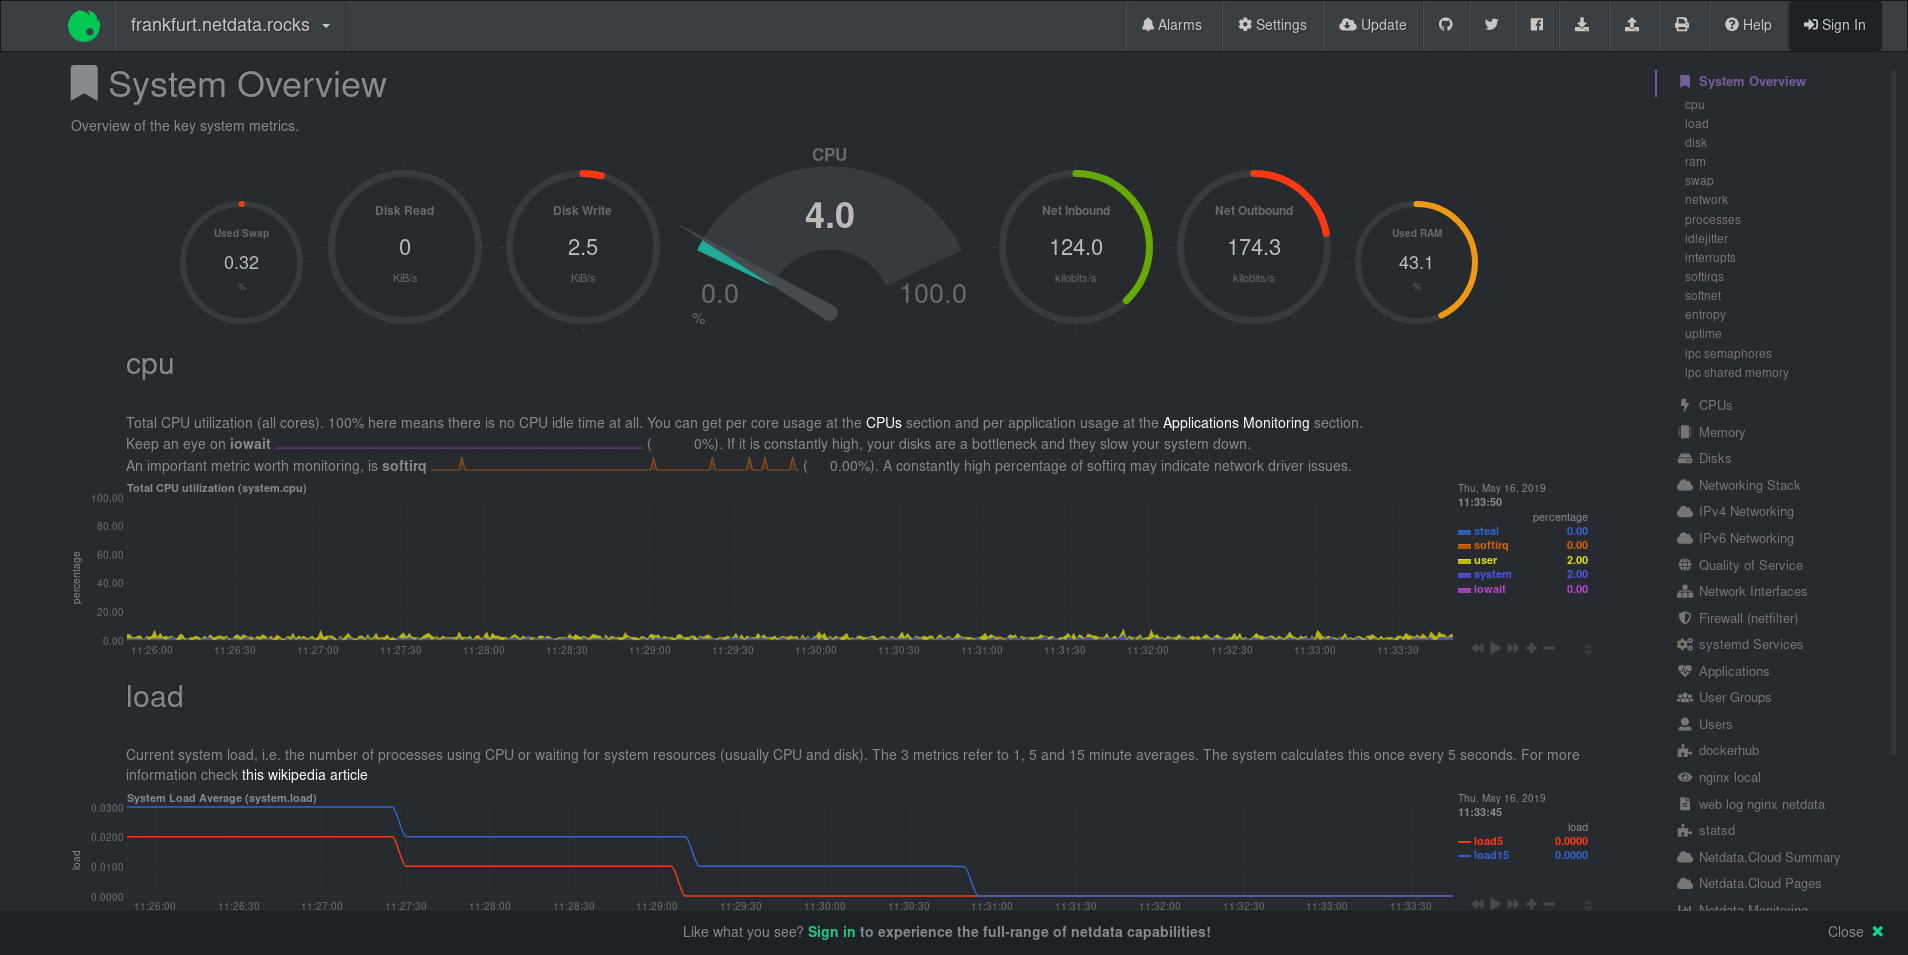 + +From here, you need to register for a Netdata Cloud account. Click on the **Sign in** button on the top-right corner of the dashboard's view. + +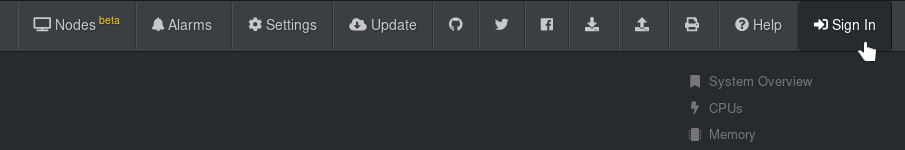 + +??? note "Alternative registration routes" + While we recommend the **Sign in** button, the Netdata dashboard has one other direct route registering for or signing in to a Netdata Cloud account. + +``` +The text **Please sign in to netdata.cloud to view your nodes!** contains a link to access Netdata Cloud. + +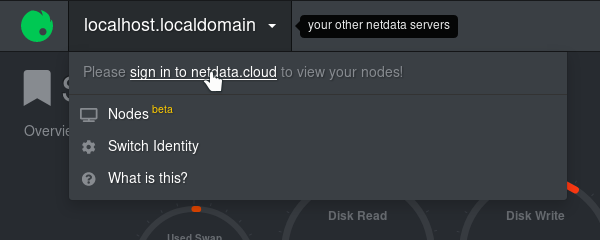 + +Two other routes exist, but they are more directly related to accessing the Nodes View. They will, however, require either registration or sign in and thus are valid routes to access Netdata Cloud. + +One route can be found in the **Nodes Beta** button the left side of the navigation menu: + +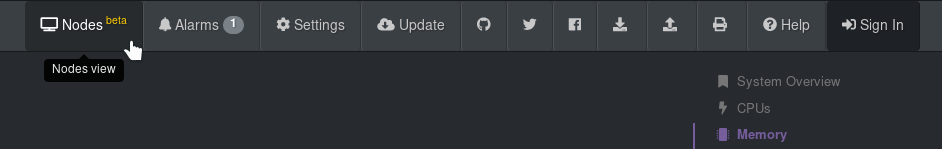 + +A second route can be found in the Nodes List—the drop-down menu in the top-left corner of the Netdata dashboard: + + 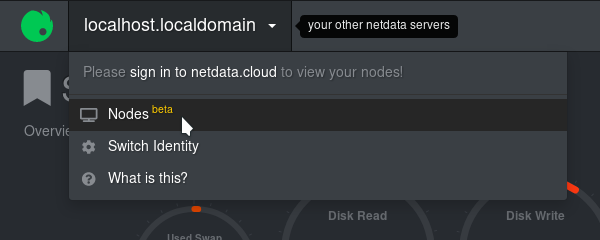 +``` + +??? note "Registration route when using a private registry" + If you're using a private registry, clicking the **Sign in** button will display a modal window warning you about the process of migrating away from your private registry and to Netdata Cloud's registry. + +``` +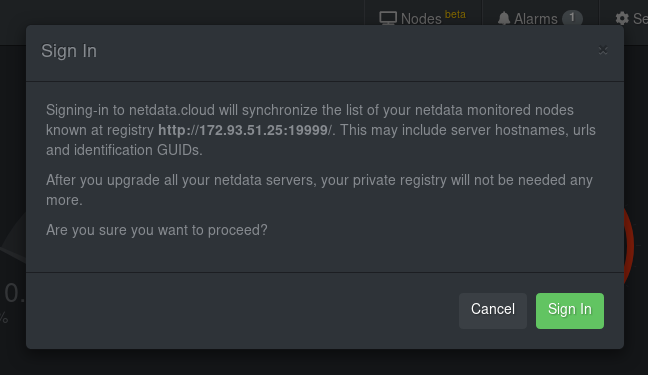 + +If you agree to use Netdata Cloud over your private registry, and opt-in to let Netdata Cloud receive and store the information described [here](../../registry/README.md#what-data-does-the-registry-store), you should click the **Sign in** button again. If not, click the **Cancel** button to continue using your private registry. +``` + +### Choosing your registration or sign in method + +After clicking the **Sign in** button, you'll be directed to the Netdata Cloud registration/sign in page. Choose to authorize with your Google account, GitHub account, or email. + +!!! attention + Be consistent with the sign in method you use, whether GitHub, Google, or email. If you sign in via different methods, the system will create multiple Netdata Cloud accounts, one for each sign-in method used. We plan to offer multiple authentication methods for the same account in the future. + +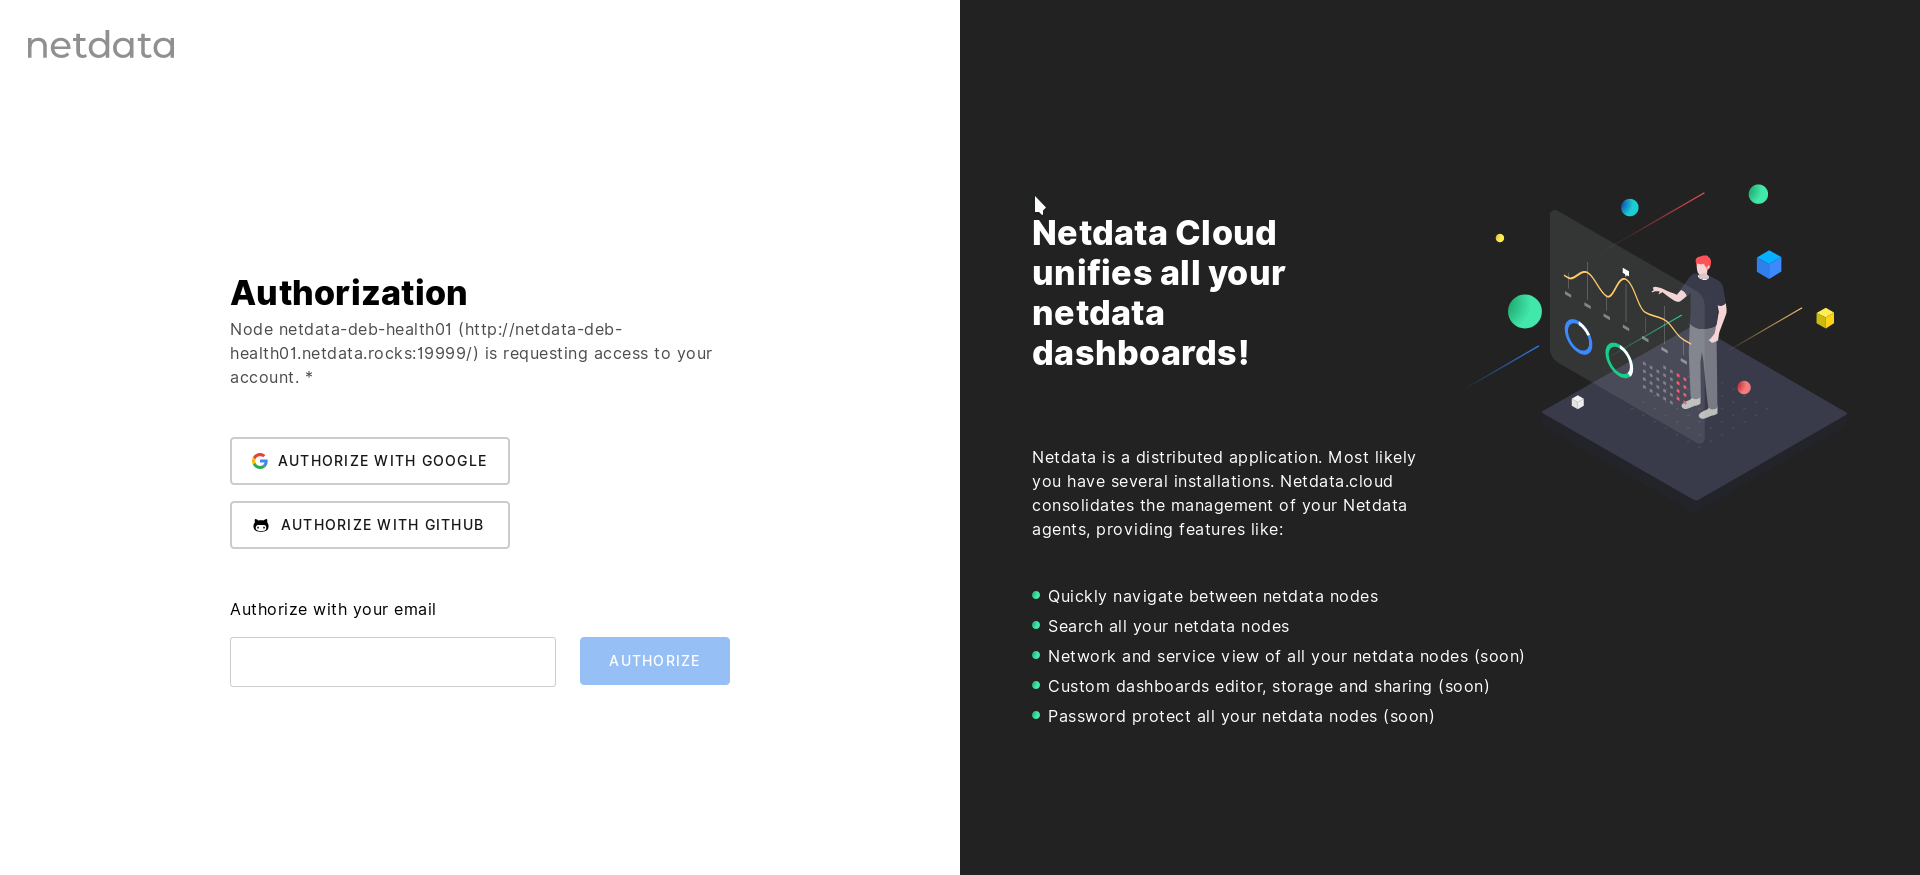 + +### Registration via Google + +Click the **Authorize with Google** button to begin registration. You will be redirected to a Google authentication form where you confirm you will "share your name, email address, language preference, and profile picture with netdata.cloud." + +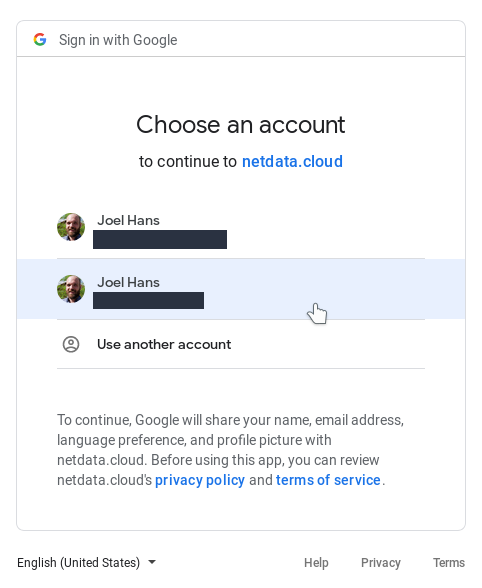 + +Click on the account you would like to connect to Netdata Cloud to continue and then skip down to [Visiting Netdata Cloud for the first time](#visiting-the-nodes-view-for-the-first-time) for further instructions. + +### Registration via GitHub + +Click the **Authorize with GitHub** button to begin registration. You will be redirected to a GitHub authentication form where you confirm to share your email address with Netdata Cloud to create your account. + +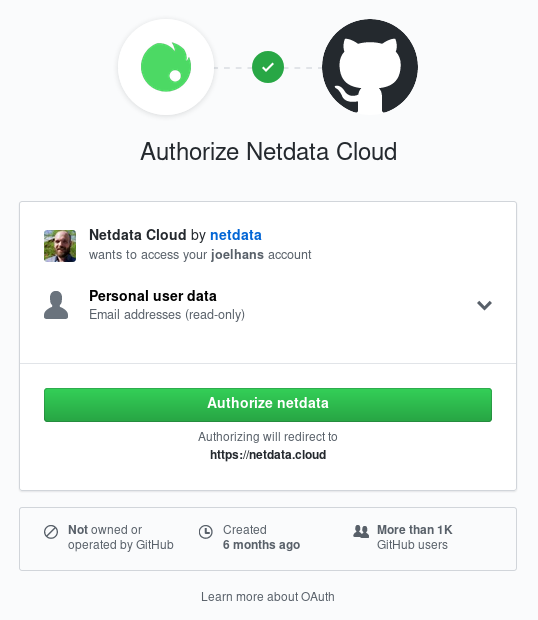 + +Click the **Authorize Netdata** button to continue and then skip down to [Visiting Netdata Cloud for the first time](#visiting-the-nodes-view-for-the-first-time) for further instructions. + +### Registration via email + +Enter your preferred email into the field and click the **Authorize** button. + +Open your email account and check for the verification email—it should arrive in less than a minute. If it doesn't show up, check your spam folder or click the **Resend email** button in the Netdata Cloud interface. + +When the email arrives, open it and click on the green **Sign in** button and then skip down to [Visiting Netdata Cloud for the first time](#visiting-the-nodes-view-for-the-first-time) for further instructions. + +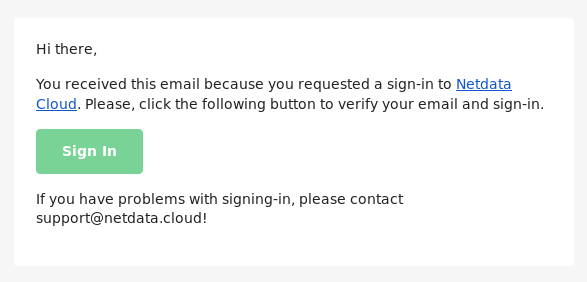 + +## Visiting the Nodes View for the first time + +Regardless of which sign in method you used, you'll now be redirected back to your Netdata agent's dashboard. This node has now been associated with your Netdata Cloud account. Netdata Cloud uses a list of nodes associated with your account to populate the Nodes List dropdown in the dashboard and the Nodes View feature of Netdata Cloud. + +**For more information on how to use the Nodes View, visit the [Nodes View guide](nodes-view.md).** + +## Signing in to your Netdata Cloud account + +The process of signing in to an existing Netdata Cloud account the same as [registering for a new account](#registering-a-netdata-cloud-account). The recommended method is to use the **Sign in** button at the top-right corner of a Netdata nodes's dashboard. Choose the method you used to register for your Netdata Cloud account and complete the process. + + + +## Adding additional nodes to your Netdata Cloud account + +There is currently only one way to associate additional Netdata nodes with your Netdata Cloud account: You must visit the web dashboard for each node and click the **Sign in** button and complete the [sign in process](#signing-in-to-your-netdata-cloud-account). + +!!! note "" + We are aware that the process of registering each node individually is cumbersome for those who want to implement Netdata Cloud's features across a large infrastructure. + +``` +Please view [this comment on issue #6318](https://github.com/netdata/netdata/issues/6318#issuecomment-504106329) for how we plan on improving the process for adding additional nodes to your Netdata Cloud account. +``` + +## Private registries and Netdata Cloud + +If you use a [private registry](../../registry/README.md#run-your-own-registry), and sign in to Netdata Cloud, you'll be using the Netdata Cloud registry in addition to your private registry. + +Clicking the **Sign in** button on the Netdata dashboard will display a modal window warning you about the synchronization of your private registry's entries to the Netdata Cloud's registry. + +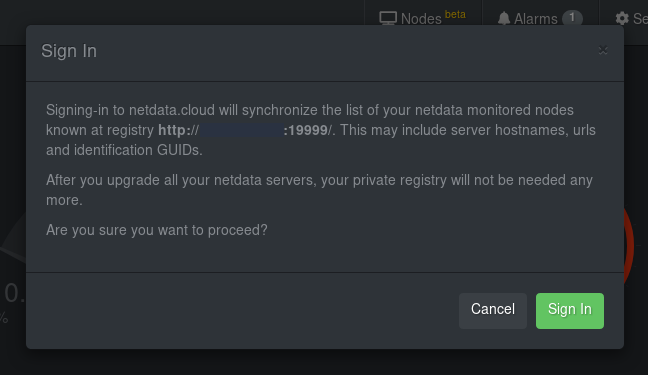 + +If your company's data policies don't allow storing information about your nodes on the Netdata Cloud registry, you should click the **Cancel** button and continue using your private registry. You'll be able to access the Nodes List in the top-left corner of a Netdata dashboard, but you won't be able to use the [Nodes View](nodes-view.md) feature within Netdata Cloud, or any of the [additional features](https://blog.netdata.cloud/posts/netdata-cloud-announcement/#what-features-will-netdata-cloud-offer) on our roadmap. You can also sign up for the waiting list for the [hosted and/or on-premises versions of Netdata Cloud](README.md#running-netdata-cloud-on-premises-or-as-a-hosted-instance) that we're working on. + +If you agree to use Netdata Cloud over your private registry, and opt-in to let Netdata Cloud receive and store the information described [here](../../registry/README.md#what-data-does-the-registry-store), you should click the **Sign in** button again to continue the registration/sign in process. + +### Returning to your private registry + +If you register for or sign in to Netdata Cloud from a node previously associated with a private registry, you can easily return to your private registry by signing out. + +You can sign out in two ways: + +1. **From a node's dashboard**: In the top-right corner you will find a dropdown menu with your email address. Click that and then click the **Sign Out** button. +2. **From Netdata Cloud**: Click on your profile picture in the top-right corner and then click on the **Sign Out** button. + +Signing out from Netdata Cloud and returning to your private registry *does not remove* the [information stored](../../registry/README.md#what-data-does-the-registry-store) about your nodes or account details. + +But, upon signout, your Nodes List on all dashboards will once more be populated by your private registry and not Netdata Cloud. + +<!-- ## The 'Synchronize with Netdata Cloud' button + +Once signed in to Netdata Cloud, the Nodes List dropdown will now show a button labeled `Synchronize with netdata.cloud`. + +The `Synchronize with Netdata Cloud` button is a migration (or import) tool for Netdata Cloud. If either the public or your private registry contains a list of nodes associated with your `person_guid`, it will import them into Netdata Cloud and associate them with the `accounts` information in the Netdata Cloud registry. + +When you click the `Synchronize with netdata.cloud` button, you will receive one of two popup messages based on whether you were using the public registry (at `registry.my-netdata.io`) or a private registry. + +**Public registry**: + +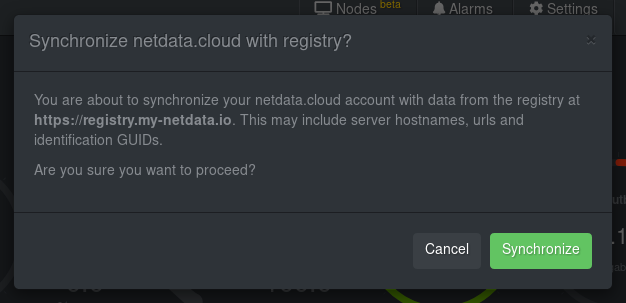 + +**Private registry**: + +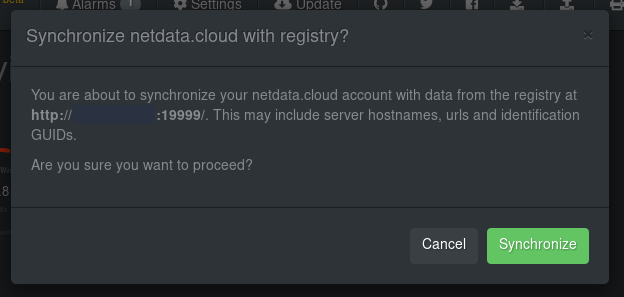 + +If you do not want to synchronize your registry of choice with Netdata Cloud, click `Cancel`. + +If you do, click `Synchronize`. This will push GUIDs, hostnames, and URLs to Netdata Cloud's registry. + +Now, when you visit the Nodes View, you will be able to see all the nodes that were once associated with the public/private registry you were using previously. --> + +## What's next? + +Learn how to use the [Nodes View](nodes-view.md) to monitor many nodes concurrently. diff --git a/docs/netdata-for-IoT.md b/docs/netdata-for-IoT.md index ca5385438..7a991c26d 100644 --- a/docs/netdata-for-IoT.md +++ b/docs/netdata-for-IoT.md @@ -2,10 +2,10 @@  -> New to Netdata? Check its demo: **[https://my-netdata.io/](https://my-netdata.io/)** +> New to Netdata? Check its demo: **<https://my-netdata.io/>** > > [](https://registry.my-netdata.io/#netdata_registry) [](https://registry.my-netdata.io/#netdata_registry) [](https://registry.my-netdata.io/#netdata_registry) -> +> > [](https://registry.my-netdata.io/#netdata_registry) [](https://registry.my-netdata.io/#netdata_registry) [](https://registry.my-netdata.io/#netdata_registry) --- @@ -38,4 +38,4 @@ Then restart Netdata. You will get this: 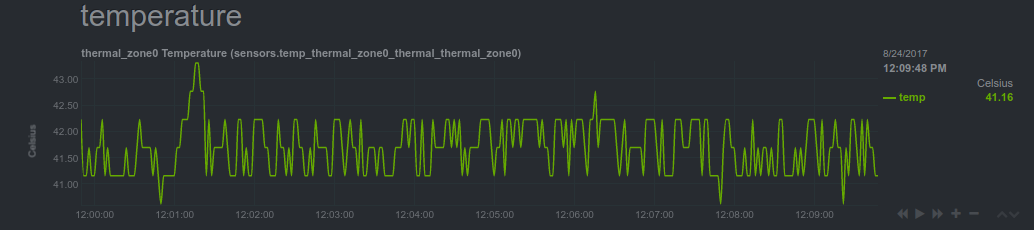 -[]() +[](<>) diff --git a/docs/netdata-security.md b/docs/netdata-security.md index a905717d9..e3ce6d56c 100644 --- a/docs/netdata-security.md +++ b/docs/netdata-security.md @@ -4,16 +4,16 @@ We have given special attention to all aspects of Netdata, ensuring that everyth **Table of Contents** -1. [Your data are safe with Netdata](#your-data-are-safe-with-netdata) -2. [Your systems are safe with Netdata](#your-systems-are-safe-with-netdata) -3. [Netdata is read-only](#netdata-is-read-only) -4. [Netdata viewers authentication](#netdata-viewers-authentication) - - [Why Netdata should be protected](#why-netdata-should-be-protected) - - [Protect Netdata from the internet](#protect-netdata-from-the-internet) - - [Expose Netdata only in a private LAN](#expose-netdata-only-in-a-private-lan) - - [Use an authenticating web server in proxy mode](#use-an-authenticating-web-server-in-proxy-mode) - - [Other methods](#other-methods) -5. [Registry or how to not send any information to a third party server](#registry-or-how-to-not-send-any-information-to-a-third-party-server) +1. [Your data are safe with Netdata](#your-data-are-safe-with-netdata) +2. [Your systems are safe with Netdata](#your-systems-are-safe-with-netdata) +3. [Netdata is read-only](#netdata-is-read-only) +4. [Netdata viewers authentication](#netdata-viewers-authentication) + - [Why Netdata should be protected](#why-netdata-should-be-protected) + - [Protect Netdata from the internet](#protect-netdata-from-the-internet) + \- [Expose Netdata only in a private LAN](#expose-netdata-only-in-a-private-lan) + \- [Use an authenticating web server in proxy mode](#use-an-authenticating-web-server-in-proxy-mode) + \- [Other methods](#other-methods) +5. [Registry or how to not send any information to a third party server](#registry-or-how-to-not-send-any-information-to-a-third-party-server) ## Your data are safe with Netdata @@ -86,7 +86,6 @@ In Netdata v1.9+ there is also access list support, like this: allow connections from = localhost 10.* 192.168.* ``` - #### Use an authenticating web server in proxy mode Use one web server to provide authentication in front of **all your Netdata servers**. So, you will be accessing all your Netdata with URLs like `http://{HOST}/netdata/{NETDATA_HOSTNAME}/` and authentication will be shared among all of them (you will sign-in once for all your servers). Instructions are provided on how to set the proxy configuration to have Netdata run behind [nginx](Running-behind-nginx.md), [Apache](Running-behind-apache.md), [lighthttpd](Running-behind-lighttpd.md#netdata-via-lighttpd-v14x) and [Caddy](Running-behind-caddy.md#netdata-via-caddy). @@ -97,7 +96,8 @@ To use this method, you should firewall protect all your Netdata servers, so tha PROXY_IP="1.2.3.4" iptables -t filter -I INPUT -p tcp --dport 19999 \! -s ${PROXY_IP} -m conntrack --ctstate NEW -j DROP ``` -_commands to allow direct access to Netdata from a web server proxy_ + +*commands to allow direct access to Netdata from a web server proxy* The above will prevent anyone except your web server to access a Netdata dashboard running on the host. @@ -132,9 +132,10 @@ iptables -t filter -A netdata -j DROP iptables -t filter -D INPUT -p tcp --dport ${NETDATA_PORT} -m conntrack --ctstate NEW -j netdata 2>/dev/null # add the input chain hook (again) -# to send all new netdata connections to our filtering chain +# to send all new Netdata connections to our filtering chain iptables -t filter -I INPUT -p tcp --dport ${NETDATA_PORT} -m conntrack --ctstate NEW -j netdata ``` + _script to allow access to Netdata only from a number of hosts_ You can run the above any number of times. Each time it runs it refreshes the list of allowed hosts. @@ -143,19 +144,20 @@ You can run the above any number of times. Each time it runs it refreshes the li Of course, there are many more methods you could use to protect Netdata: -- bind Netdata to localhost and use `ssh -L 19998:127.0.0.1:19999 remote.netdata.ip` to forward connections of local port 19998 to remote port 19999. This way you can ssh to a Netdata server and then use `http://127.0.0.1:19998/` on your computer to access the remote Netdata dashboard. +- bind Netdata to localhost and use `ssh -L 19998:127.0.0.1:19999 remote.netdata.ip` to forward connections of local port 19998 to remote port 19999. This way you can ssh to a Netdata server and then use `http://127.0.0.1:19998/` on your computer to access the remote Netdata dashboard. -- If you are always under a static IP, you can use the script given above to allow direct access to your Netdata servers without authentication, from all your static IPs. +- If you are always under a static IP, you can use the script given above to allow direct access to your Netdata servers without authentication, from all your static IPs. -- install all your Netdata in **headless data collector** mode, forwarding all metrics in real-time to a master Netdata server, which will be protected with authentication using an nginx server running locally at the master Netdata server. This requires more resources (you will need a bigger master Netdata server), but does not require any firewall changes, since all the slave Netdata servers will not be listening for incoming connections. +- install all your Netdata in **headless data collector** mode, forwarding all metrics in real-time to a master Netdata server, which will be protected with authentication using an nginx server running locally at the master Netdata server. This requires more resources (you will need a bigger master Netdata server), but does not require any firewall changes, since all the slave Netdata servers will not be listening for incoming connections. ## Anonymous Statistics ### Registry or how to not send any information to a third party server The default configuration uses a public registry under registry.my-netdata.io (more information about the registry here: [mynetdata-menu-item](../registry/) ). Please be aware that if you use that public registry, you submit the following information to a third party server: -- The url where you open the web-ui in the browser (via http request referer) -- The hostnames of the Netdata servers + +- The url where you open the web-ui in the browser (via http request referer) +- The hostnames of the Netdata servers If sending this information to the central Netdata registry violates your security policies, you can configure Netdat to [run your own registry](../registry/#run-your-own-registry). @@ -163,21 +165,21 @@ If sending this information to the central Netdata registry violates your securi Starting with v1.12 Netdata also collects [anonymous statistics](anonymous-statistics.md) on certain events for: -1. **Quality assurance**, to help us understand if Netdata behaves as expected and help us identify repeating issues for certain distributions or environments. +1. **Quality assurance**, to help us understand if Netdata behaves as expected and help us identify repeating issues for certain distributions or environments. -2. **Usage statistics**, to help us focus on the parts of Netdata that are used the most, or help us identify the extent our development decisions influence the community. +2. **Usage statistics**, to help us focus on the parts of Netdata that are used the most, or help us identify the extent our development decisions influence the community. To opt-out from sending anonymous statistics, you can create a file called `.opt-out-from-anonymous-statistics` under the user configuration directory (usually `/etc/netdata`). ## Netdata directories -path|owner|permissions| Netdata |comments| -:---|:----|:----------|:--------|:-------| -`/etc/netdata`|user `root`<br/>group `netdata`|dirs `0755`<br/>files `0640`|reads|**Netdata config files**<br/>may contain sensitive information, so group `netdata` is allowed to read them. -`/usr/libexec/netdata`|user `root`<br/>group `root`|executable by anyone<br/>dirs `0755`<br/>files `0644` or `0755`|executes|**Netdata plugins**<br/>permissions depend on the file - not all of them should have the executable flag.<br/>there are a few plugins that run with escalated privileges (Linux capabilities or `setuid`) - these plugins should be executable only by group `netdata`. -`/usr/share/netdata`|user `root`<br/>group `netdata`|readable by anyone<br/>dirs `0755`<br/>files `0644`|reads and sends over the network|**Netdata web static files**<br/>these files are sent over the network to anyone that has access to the Netdata web server. Netdata checks the ownership of these files (using settings at the `[web]` section of `netdata.conf`) and refuses to serve them if they are not properly owned. Symbolic links are not supported. Netdata also refuses to serve URLs with `..` in their name. -`/var/cache/netdata`|user `netdata`<br/>group `netdata`|dirs `0750`<br/>files `0660`|reads, writes, creates, deletes|**Netdata ephemeral database files**<br/>Netdata stores its ephemeral real-time database here. -`/var/lib/netdata`|user `netdata`<br/>group `netdata`|dirs `0750`<br/>files `0660`|reads, writes, creates, deletes|**Netdata permanent database files**<br/>Netdata stores here the registry data, health alarm log db, etc. -`/var/log/netdata`|user `netdata`<br/>group `root`|dirs `0755`<br/>files `0644`|writes, creates|**Netdata log files**<br/>all the Netdata applications, logs their errors or other informational messages to files in this directory. These files should be log rotated. +| path|owner|permissions|Netdata|comments| +|:---|:----|:----------|:------|:-------| +| `/etc/netdata`|user `root`<br/>group `netdata`|dirs `0755`<br/>files `0640`|reads|**Netdata config files**<br/>may contain sensitive information, so group `netdata` is allowed to read them.| +| `/usr/libexec/netdata`|user `root`<br/>group `root`|executable by anyone<br/>dirs `0755`<br/>files `0644` or `0755`|executes|**Netdata plugins**<br/>permissions depend on the file - not all of them should have the executable flag.<br/>there are a few plugins that run with escalated privileges (Linux capabilities or `setuid`) - these plugins should be executable only by group `netdata`.| +| `/usr/share/netdata`|user `root`<br/>group `netdata`|readable by anyone<br/>dirs `0755`<br/>files `0644`|reads and sends over the network|**Netdata web static files**<br/>these files are sent over the network to anyone that has access to the Netdata web server. Netdata checks the ownership of these files (using settings at the `[web]` section of `netdata.conf`) and refuses to serve them if they are not properly owned. Symbolic links are not supported. Netdata also refuses to serve URLs with `..` in their name.| +| `/var/cache/netdata`|user `netdata`<br/>group `netdata`|dirs `0750`<br/>files `0660`|reads, writes, creates, deletes|**Netdata ephemeral database files**<br/>Netdata stores its ephemeral real-time database here.| +| `/var/lib/netdata`|user `netdata`<br/>group `netdata`|dirs `0750`<br/>files `0660`|reads, writes, creates, deletes|**Netdata permanent database files**<br/>Netdata stores here the registry data, health alarm log db, etc.| +| `/var/log/netdata`|user `netdata`<br/>group `root`|dirs `0755`<br/>files `0644`|writes, creates|**Netdata log files**<br/>all the Netdata applications, logs their errors or other informational messages to files in this directory. These files should be log rotated.| -[]() +[](<>) diff --git a/docs/privacy-policy.md b/docs/privacy-policy.md index e46d783ed..4f1c74598 100644 --- a/docs/privacy-policy.md +++ b/docs/privacy-policy.md @@ -6,7 +6,7 @@ This Privacy Policy explains the collection, use, processing, transferring and d This Privacy Policy is incorporated into and made part of the Netdata Master Terms of Use (“Master Terms”) located [here](terms-of-use.md). -Unless otherwise noted on a particular website or service hosted by Netdata, this Privacy Policy applies to your use of all websites that Netdata operates. These include https://my-netdata.io and https://netdata.cloud, together with all other subdomains thereof, (collectively, the “Websites”). This Privacy Policy also applies to all products, information, and services provided through the Websites, including without limitation the ND agent, the ND registry, the ND hub and the ND cloud website (together with the Websites, the “Services”). +Unless otherwise noted on a particular website or service hosted by Netdata, this Privacy Policy applies to your use of all websites that Netdata operates. These include <https://my-netdata.io> and <https://netdata.cloud>, together with all other subdomains thereof, (collectively, the “Websites”). This Privacy Policy also applies to all products, information, and services provided through the Websites, including without limitation the ND agent, the ND registry, the ND hub and the ND cloud website (together with the Websites, the “Services”). In addition, supplemental Privacy Policy terms (“Supplemental Privacy Policy Terms”) may apply to a particular Service. All such Supplemental Privacy Policy Terms will be accessible for you to read either within, or through your use of, that particular Service. @@ -28,7 +28,7 @@ ND collects and uses personal information in the following ways: Website and Analytics: When you visit our Websites and use our Services, ND collects some information about your activities through tools such as Google Analytics. The type of information that we collect focuses on general information such as country or city where you are located, pages visited, time spent on pages, heat-map of visitors’ activity on the site, information about the browser you are using, etc. ND collects and uses this information pursuant to our legitimate interest in enhancing the security and utility of our Services. The information we gather and process is used in the aggregate to spot trends without deliberately identifying individuals. -Note that you can learn about Google’s practices in connection with its analytics services and how to opt out of it by downloading the Google Analytics opt-out browser add-on, available at https://tools.google.com/dlpage/gaoptout. +Note that you can learn about Google’s practices in connection with its analytics services and how to opt out of it by downloading the Google Analytics opt-out browser add-on, available at <https://tools.google.com/dlpage/gaoptout>. Information from Cookies: We and our service providers (for example, Google Analytics as described above) may collect information using cookies or similar technologies for the purposes described above and below. Cookies are pieces of information that are stored by your browser on the hard drive or memory of your computer or other Internet access device. Cookies may enable us to personalize your experience on the Services, maintain a persistent session, passively collect demographic information about your computer, and monitor advertisements and other activities. The Websites may use different kinds of cookies and other types of local storage (such as browser-based or plugin-based local storage). @@ -37,22 +37,22 @@ The menu lists the Netdata servers you have visited. For example, when you jump (like the currently viewed charts, the current zoom and pan operations on the charts, etc.) are propagated to the new server, so that the new dashboard will come with exactly the same view. The global registry keeps track of 4 entities: -1. **machines**: i.e. the netdata installations (a random GUID generated by each netdata the first time it starts; we call this **machine_guid**) +1. **machines**: i.e. the Netdata installations (a random GUID generated by each Netdata the first time it starts; we call this **machine_guid**) - For each netdata installation (each `machine_guid`) the registry keeps track of the different URLs it is accessed. + For each Netdata installation (each `machine_guid`) the registry keeps track of the different URLs it is accessed. -2. **persons**: i.e. the web browsers accessing the netdata installations (a random GUID generated by the registry the first time it sees a new web browser; we call this **person_guid**) +2. **persons**: i.e. the web browsers accessing the Netdata installations (a random GUID generated by the registry the first time it sees a new web browser; we call this **person_guid**) - For each person, the registry keeps track of the netdata installations it has accessed and their URLs. + For each person, the registry keeps track of the Netdata installations it has accessed and their URLs. -3. **URLs** of netdata installations (as seen by the web browsers) +3. **URLs** of Netdata installations (as seen by the web browsers) - For each URL, the registry keeps the URL and nothing more. Each URL is linked to *persons* and *machines*. The only way to find a URL is to know its **machine_guid** or have a **person_guid** it is linked to it. + For each URL, the registry keeps the URL and nothing more. Each URL is linked to _persons_ and _machines_. The only way to find a URL is to know its **machine_guid** or have a **person_guid** it is linked to it. -4. **accounts**: i.e. the information used to sign-in via one of the available sign-in methods. Depending on the method, this may include an email, an email and a profile picture. +4. **accounts**: i.e. the information used to sign-in via one of the available sign-in methods. Depending on the method, this may include an email, an email and a profile picture. -For *persons*/*accounts* and *machines*, the registry keeps links to *URLs*, each link with 2 timestamps (first time seen, last time seen) and a counter (number of times it has been seen). -*machines*, *persons*, and timestamps are stored in the netdata registry regardless of whether you sign in or not. +For _persons/accounts_ and _machines_, the registry keeps links to _URLs_, each link with 2 timestamps (first time seen, last time seen) and a counter (number of times it has been seen). +_machines_, _persons_, and timestamps are stored in the Netdata registry regardless of whether you sign in or not. If sending this information is against your policies, you can [run your own registry](../registry/#run-your-own-registry). Note that ND versions with the 'Sign in' feature of the ND Cloud do not use the global registry. @@ -60,18 +60,19 @@ Note that ND versions with the 'Sign in' feature of the ND Cloud do not use the ND Cloud: When you sign up to obtain a user account via the 'Sign in' link on the ND agent user interface, ND is granted access to personal information in the user profile of the authentication provider you choose (e.g. GitHub or Google). ND collects and uses this personal information pursuant to its legitimate interest in establishing and maintaining your account providing you with the features we provide Registered Users. We may use your email address to contact you regarding changes to this policy or other applicable policies. The login name or email address of your profile may be used to attribute you in connection with any content you submit to any Service. Anonymous Usage Statistics: From Netdata v1.12 and above, anonymous usage information is collected by default on certain events of the ND daemon and send to Google Analytics. Every time the daemon is started or stopped and every time a fatal condition is encountered, Netdata collects system information and sends it to GA via an http call. The information collected for all events is: - - Netdata version - - OS name, version, id, id_like - - Kernel name, version, architecture - - Virtualization technology - - Containerization technology -Furthermore, the FATAL event sends the Netdata process & thread info, along with the file, function and line of the fatal error. + +- Netdata version +- OS name, version, id, id_like +- Kernel name, version, architecture +- Virtualization technology +- Containerization technology + Furthermore, the FATAL event sends the Netdata process & thread info, along with the file, function and line of the fatal error. The statistics calculated from this information are used for: -1. **Quality assurance**, to help us understand if Netdata behaves as expected and help us identify repeating issues for certain distributions or environment. +1. **Quality assurance**, to help us understand if Netdata behaves as expected and help us identify repeating issues for certain distributions or environment. -2. **Usage statistics**, to help us focus on the parts of Netdata that are used the most, or help us identify the extend our development decisions influence the community. +2. **Usage statistics**, to help us focus on the parts of Netdata that are used the most, or help us identify the extend our development decisions influence the community. To opt-out from sending anonymous statistics, you can create reate a file called `.opt-out-from-anonymous-statistics` under the user configuration directory (usually `/etc/netdata`). @@ -125,4 +126,4 @@ We may occasionally update this Privacy Policy. When we do, we will provide you Effective Date: 8 January 2019. -[]() +[](<>) diff --git a/docs/terms-of-use.md b/docs/terms-of-use.md index 5565f6056..bf77fabbf 100644 --- a/docs/terms-of-use.md +++ b/docs/terms-of-use.md @@ -1,11 +1,11 @@ # Terms of Use Netdata Master Terms of Use -Effective as of 25 May 2018 +Effective as of 09 Aug 2019 ## 1. General Information Regarding These Terms of Use -Master terms: Welcome, and thank you for your interest in Netdata (“Netdata, Inc.” “ND,” “we,” “our,” or “us”). Unless otherwise noted on a particular site or service, these master terms of use (“Master Terms”) apply to your use of all of the websites that Netdata Corporation operates. These include https://my-netdata.io and https://netdata.cloud, together with all other subdomains thereof, (collectively, the “Websites”). The Master Terms also apply to all products, information, and services provided through the Websites, such as the NDID Login Service. +Master terms: Welcome, and thank you for your interest in Netdata (“Netdata, Inc.” “ND,” “we,” “our,” or “us”). Unless otherwise noted on a particular site or service, these master terms of use (“Master Terms”) apply to your use of all of the websites that Netdata Corporation operates. These include <https://my-netdata.io> and <https://netdata.cloud>, together with all other subdomains thereof, (collectively, the “Websites”). The Master Terms also apply to all products, information, and services provided through the Websites, such as the NDID Login Service. Additional terms: In addition to the Master Terms, your use of any Services may also be subject to specific terms applicable to a particular Service (“Additional Terms”). If there is any conflict between the Additional Terms and the Master Terms, then the Additional Terms apply in relation to the relevant Service. @@ -61,7 +61,7 @@ You agree not to engage in any of the following activities: ### 1. Violating laws and rights: -You may not (a) use any Service for any illegal purpose or in violation of any local, state, national, or international laws, (b) violate or encourage others to violate any right of or obligation to a third party, including by infringing, misappropriating, or violating intellectual property, confidentiality, or privacy rights. +You may not (a) use any Service for any illegal purpose or in violation of any local, state, national, or international laws, including without limitation U.S. export controls and economic sanctions regulations, or (b) violate or encourage others to violate any right of or obligation to a third party, including by infringing, misappropriating, or violating intellectual property, confidentiality, or privacy rights. ### 2. Solicitation: @@ -158,4 +158,4 @@ Integration: These Master Terms and any applicable Additional Terms constitute t Human-readable summary of Sec 15: If there is a lawsuit arising from these terms, it should be in Delaware and governed by Delaware law. We are glad you use our sites, but this agreement does not mean we are partners. -[]() +[](<>) diff --git a/docs/what-is-netdata.md b/docs/what-is-netdata.md index 6664897de..b134dc2ca 100644 --- a/docs/what-is-netdata.md +++ b/docs/what-is-netdata.md @@ -1,8 +1,8 @@ -# What is Netdata? +# What is Netdata? -[](https://travis-ci.com/netdata/netdata) [](https://bestpractices.coreinfrastructure.org/projects/2231) [](https://www.gnu.org/licenses/gpl-3.0) []() +[](https://travis-ci.com/netdata/netdata) [](https://bestpractices.coreinfrastructure.org/projects/2231) [](https://www.gnu.org/licenses/gpl-3.0) [](<>) -[](https://codeclimate.com/github/netdata/netdata) [](https://www.codacy.com/app/netdata/netdata?utm_source=github.com&utm_medium=referral&utm_content=netdata/netdata&utm_campaign=Badge_Grade) [](https://lgtm.com/projects/g/netdata/netdata/context:cpp) [](https://lgtm.com/projects/g/netdata/netdata/context:javascript) [](https://lgtm.com/projects/g/netdata/netdata/context:python) +[](https://codeclimate.com/github/netdata/netdata) [](https://www.codacy.com/app/netdata/netdata?utm_source=github.com&utm_medium=referral&utm_content=netdata/netdata&utm_campaign=Badge_Grade) [](https://lgtm.com/projects/g/netdata/netdata/context:cpp) [](https://lgtm.com/projects/g/netdata/netdata/context:javascript) [](https://lgtm.com/projects/g/netdata/netdata/context:python) --- @@ -22,9 +22,9 @@ The following animated image, shows the top part of a typical Netdata dashboard.  -*A typical Netdata dashboard, in 1:1 timing. Charts can be panned by dragging them, zoomed in/out with `SHIFT` + `mouse wheel`, an area can be selected for zoom-in with `SHIFT` + `mouse selection`. Netdata is highly interactive and **real-time**, optimized to get the work done!* +_A typical Netdata dashboard, in 1:1 timing. Charts can be panned by dragging them, zoomed in/out with `SHIFT` + `mouse wheel`, an area can be selected for zoom-in with `SHIFT` + `mouse selection`. Netdata is highly interactive and **real-time**, optimized to get the work done!_ -> *We have a few online demos to experience it live: [https://www.netdata.cloud](https://www.netdata.cloud/#live-demo)* +> _We have a few online demos to experience it live: [https://www.netdata.cloud](https://www.netdata.cloud/#live-demo)_ ## User base @@ -36,16 +36,18 @@ You will find people working for **Amazon**, **Atos**, **Baidu**, **Cisco System **Vimeo**, and many more! ### Docker pulls + We provide docker images for the most common architectures. These are statistics reported by docker hub: [](https://hub.docker.com/r/netdata/netdata/) [](https://hub.docker.com/r/firehol/netdata/) [](https://hub.docker.com/r/titpetric/netdata/) ### Registry + When you install multiple Netdata, they are integrated into **one distributed application**, via a [Netdata registry](../registry/#registry). This is a web browser feature and it allows us to count the number of unique users and unique Netdata servers installed. The following information comes from the global public Netdata registry we run: [](https://registry.my-netdata.io/#menu_netdata_submenu_registry) [](https://registry.my-netdata.io/#menu_netdata_submenu_registry) [](https://registry.my-netdata.io/#menu_netdata_submenu_registry) -*in the last 24 hours:*<br/> [](https://registry.my-netdata.io/#menu_netdata_submenu_registry) [](https://registry.my-netdata.io/#menu_netdata_submenu_registry) [](https://registry.my-netdata.io/#menu_netdata_submenu_registry) +_in the last 24 hours:_<br/> [](https://registry.my-netdata.io/#menu_netdata_submenu_registry) [](https://registry.my-netdata.io/#menu_netdata_submenu_registry) [](https://registry.my-netdata.io/#menu_netdata_submenu_registry) ## Why Netdata @@ -53,25 +55,25 @@ Netdata has a quite different approach to monitoring. Netdata is a monitoring agent you install on all your systems. It is: -- a **metrics collector** - for system and application metrics (including web servers, databases, containers, etc) -- a **time-series database** - all stored in memory (does not touch the disks while it runs) -- a **metrics visualizer** - super fast, interactive, modern, optimized for anomaly detection -- an **alarms notification engine** - an advanced watchdog for detecting performance and availability issues +- a **metrics collector** - for system and application metrics (including web servers, databases, containers, etc) +- a **time-series database** - all stored in memory (does not touch the disks while it runs) +- a **metrics visualizer** - super fast, interactive, modern, optimized for anomaly detection +- an **alarms notification engine** - an advanced watchdog for detecting performance and availability issues All the above, are packaged together in a very flexible, extremely modular, distributed application. This is how Netdata compares to other monitoring solutions: -Netdata|others (open-source and commercial) -:---:|:---: -**High resolution metrics** (1s granularity)|Low resolution metrics (10s granularity at best) -Monitors everything, **thousands of metrics per node**|Monitor just a few metrics -UI is super fast, optimized for **anomaly detection**|UI is good for just an abstract view -**Meaningful presentation**, to help you understand the metrics|You have to know the metrics before you start -Install and get results **immediately**|Long preparation is required to get any useful results -Use it for **troubleshooting** performance problems|Use them to get *statistics of past performance* -**Kills the console** for tracing performance issues|The console is always required for troubleshooting -Requires **zero dedicated resources**|Require large dedicated resources +| Netdata | others (open-source and commercial)| +|:-----:|:---------------------------------:| +| **High resolution metrics** (1s granularity)|Low resolution metrics (10s granularity at best)| +| Monitors everything, **thousands of metrics per node**|Monitor just a few metrics| +| UI is super fast, optimized for **anomaly detection**|UI is good for just an abstract view| +| **Meaningful presentation**, to help you understand the metrics|You have to know the metrics before you start| +| Install and get results **immediately**|Long preparation is required to get any useful results| +| Use it for **troubleshooting** performance problems|Use them to get *statistics of past performance*| +| **Kills the console** for tracing performance issues|The console is always required for troubleshooting| +| Requires **zero dedicated resources**|Require large dedicated resources| Netdata is **open-source**, **free**, super **fast**, very **easy**, completely **open**, extremely **efficient**, **flexible** and integrate-able. @@ -87,14 +89,14 @@ Netdata is a highly efficient, highly modular, metrics management engine. Its lo This is how it works: -Function|Description|Documentation -:---:|:---|:---: -**Collect**|Multiple independent data collection workers are collecting metrics from their sources using the optimal protocol for each application and push the metrics to the database. Each data collection worker has lockless write access to the metrics it collects.|[`collectors`](../collectors/#data-collection-plugins) -**Store**|Metrics are stored in RAM in a round robin database (ring buffer), using a custom made floating point number for minimal footprint.|[`database`](../database/#database) -**Check**|A lockless independent watchdog is evaluating **health checks** on the collected metrics, triggers alarms, maintains a health transaction log and dispatches alarm notifications.|[`health`](../health/#health-monitoring) -**Stream**|An lockless independent worker is streaming metrics, in full detail and in real-time, to remote Netdata servers, as soon as they are collected.|[`streaming`](../streaming/#streaming-and-replication) -**Archive**|A lockless independent worker is down-sampling the metrics and pushes them to **backend** time-series databases.|[`backends`](../backends/) -**Query**|Multiple independent workers are attached to the [internal web server](../web/server/#web-server), servicing API requests, including [data queries](../web/api/queries/#database-queries).|[`web/api`](../web/api/#api) +|Function|Description|Documentation| +|:------:|:----------|:-----------:| +|**Collect**|Multiple independent data collection workers are collecting metrics from their sources using the optimal protocol for each application and push the metrics to the database. Each data collection worker has lockless write access to the metrics it collects.|[`collectors`](../collectors/#data-collection-plugins)| +|**Store**|Metrics are stored in RAM in a round robin database (ring buffer), using a custom made floating point number for minimal footprint.|[`database`](../database/#database)| +|**Check**|A lockless independent watchdog is evaluating **health checks** on the collected metrics, triggers alarms, maintains a health transaction log and dispatches alarm notifications.|[`health`](../health/#health-monitoring)| +|**Stream**|An lockless independent worker is streaming metrics, in full detail and in real-time, to remote Netdata servers, as soon as they are collected.|[`streaming`](../streaming/#streaming-and-replication)| +|**Archive**|A lockless independent worker is down-sampling the metrics and pushes them to **backend** time-series databases.|[`backends`](../backends/)| +|**Query**|Multiple independent workers are attached to the [internal web server](../web/server/#web-server), servicing API requests, including [data queries](../web/api/queries/#database-queries).|[`web/api`](../web/api/#api)| The result is a highly efficient, low latency system, supporting multiple readers and one writer on each metric. @@ -105,7 +107,6 @@ Click it to to interact with it (it has direct links to documentation). [](https://my-netdata.io/infographic.html) - ## Features  @@ -113,31 +114,34 @@ Click it to to interact with it (it has direct links to documentation). This is what you should expect from Netdata: ### General -- **1s granularity** - the highest possible resolution for all metrics. -- **Unlimited metrics** - collects all the available metrics, the more the better. -- **1% CPU utilization of a single core** - it is super fast, unbelievably optimized. -- **A few MB of RAM** - by default it uses 25MB RAM. [You size it](../database). -- **Zero disk I/O** - while it runs, it does not load or save anything (except `error` and `access` logs). -- **Zero configuration** - auto-detects everything, it can collect up to 10000 metrics per server out of the box. -- **Zero maintenance** - You just run it, it does the rest. -- **Zero dependencies** - it is even its own web server, for its static web files and its web API (though its plugins may require additional libraries, depending on the applications monitored). -- **Scales to infinity** - you can install it on all your servers, containers, VMs and IoTs. Metrics are not centralized by default, so there is no limit. -- **Several operating modes** - Autonomous host monitoring (the default), headless data collector, forwarding proxy, store and forward proxy, central multi-host monitoring, in all possible configurations. Each node may have different metrics retention policy and run with or without health monitoring. + +- **1s granularity** - the highest possible resolution for all metrics. +- **Unlimited metrics** - collects all the available metrics, the more the better. +- **1% CPU utilization of a single core** - it is super fast, unbelievably optimized. +- **A few MB of RAM** - by default it uses 25MB RAM. [You size it](../database). +- **Zero disk I/O** - while it runs, it does not load or save anything (except `error` and `access` logs). +- **Zero configuration** - auto-detects everything, it can collect up to 10000 metrics per server out of the box. +- **Zero maintenance** - You just run it, it does the rest. +- **Zero dependencies** - it is even its own web server, for its static web files and its web API (though its plugins may require additional libraries, depending on the applications monitored). +- **Scales to infinity** - you can install it on all your servers, containers, VMs and IoTs. Metrics are not centralized by default, so there is no limit. +- **Several operating modes** - Autonomous host monitoring (the default), headless data collector, forwarding proxy, store and forward proxy, central multi-host monitoring, in all possible configurations. Each node may have different metrics retention policy and run with or without health monitoring. ### Health Monitoring & Alarms -- **Sophisticated alerting** - comes with hundreds of alarms, **out of the box**! Supports dynamic thresholds, hysteresis, alarm templates, multiple role-based notification methods. -- **Notifications**: [alerta.io](../health/notifications/alerta/), [amazon sns](../health/notifications/awssns/), [discordapp.com](../health/notifications/discord/), [email](../health/notifications/email/), [flock.com](../health/notifications/flock/), [irc](../health/notifications/irc/), [kavenegar.com](../health/notifications/kavenegar/), [messagebird.com](../health/notifications/messagebird/), [pagerduty.com](../health/notifications/pagerduty/), [prowl](../health/notifications/prowl/), [pushbullet.com](../health/notifications/pushbullet/), [pushover.net](../health/notifications/pushover/), [rocket.chat](../health/notifications/rocketchat/), [slack.com](../health/notifications/slack/), [smstools3](../health/notifications/smstools3/), [syslog](../health/notifications/syslog/), [telegram.org](../health/notifications/telegram/), [twilio.com](../health/notifications/twilio/), [web](../health/notifications/web/) and [custom notifications](../health/notifications/custom/). + +- **Sophisticated alerting** - comes with hundreds of alarms, **out of the box**! Supports dynamic thresholds, hysteresis, alarm templates, multiple role-based notification methods. +- **Notifications**: [alerta.io](../health/notifications/alerta/), [amazon sns](../health/notifications/awssns/), [discordapp.com](../health/notifications/discord/), [email](../health/notifications/email/), [flock.com](../health/notifications/flock/), [irc](../health/notifications/irc/), [kavenegar.com](../health/notifications/kavenegar/), [messagebird.com](../health/notifications/messagebird/), [pagerduty.com](../health/notifications/pagerduty/), [prowl](../health/notifications/prowl/), [pushbullet.com](../health/notifications/pushbullet/), [pushover.net](../health/notifications/pushover/), [rocket.chat](../health/notifications/rocketchat/), [slack.com](../health/notifications/slack/), [smstools3](../health/notifications/smstools3/), [syslog](../health/notifications/syslog/), [telegram.org](../health/notifications/telegram/), [twilio.com](../health/notifications/twilio/), [web](../health/notifications/web/) and [custom notifications](../health/notifications/custom/). ### Integrations -- **time-series dbs** - can archive its metrics to **Graphite**, **OpenTSDB**, **Prometheus**, **AWS Kinesis**, **JSON document DBs**, in the same or lower resolution (lower: to prevent it from congesting these servers due to the amount of data collected). Netdata also supports **Prometheus remote write API** which allows storing metrics to **Elasticsearch**, **Gnocchi**, **InfluxDB**, **Kafka**, **PostgreSQL/TimescaleDB**, **Splunk**, **VictoriaMetrics** and a lot of other [storage providers](https://prometheus.io/docs/operating/integrations/#remote-endpoints-and-storage). + +- **time-series dbs** - can archive its metrics to **Graphite**, **OpenTSDB**, **Prometheus**, **AWS Kinesis**, **JSON document DBs**, in the same or lower resolution (lower: to prevent it from congesting these servers due to the amount of data collected). Netdata also supports **Prometheus remote write API** which allows storing metrics to **Elasticsearch**, **Gnocchi**, **InfluxDB**, **Kafka**, **PostgreSQL/TimescaleDB**, **Splunk**, **VictoriaMetrics** and a lot of other [storage providers](https://prometheus.io/docs/operating/integrations/#remote-endpoints-and-storage). ## Visualization -- **Stunning interactive dashboards** - mouse, touchpad and touch-screen friendly in 2 themes: `slate` (dark) and `white`. -- **Amazingly fast visualization** - responds to all queries in less than 1 ms per metric, even on low-end hardware. -- **Visual anomaly detection** - the dashboards are optimized for detecting anomalies visually. -- **Embeddable** - its charts can be embedded on your web pages, wikis and blogs. You can even use [Atlassian's Confluence as a monitoring dashboard](../web/gui/confluence/). -- **Customizable** - custom dashboards can be built using simple HTML (no javascript necessary). +- **Stunning interactive dashboards** - mouse, touchpad and touch-screen friendly in 2 themes: `slate` (dark) and `white`. +- **Amazingly fast visualization** - responds to all queries in less than 1 ms per metric, even on low-end hardware. +- **Visual anomaly detection** - the dashboards are optimized for detecting anomalies visually. +- **Embeddable** - its charts can be embedded on your web pages, wikis and blogs. You can even use [Atlassian's Confluence as a monitoring dashboard](../web/gui/confluence/). +- **Customizable** - custom dashboards can be built using simple HTML (no javascript necessary). ### Positive and negative values @@ -161,7 +165,7 @@ Charts on Netdata dashboards are synchronized to each other. There is no master  -*Charts are panned by dragging them with the mouse. Charts can be zoomed in/out with`SHIFT` + `mouse wheel` while the mouse pointer is over a chart.* +_Charts are panned by dragging them with the mouse. Charts can be zoomed in/out with`SHIFT` + `mouse wheel` while the mouse pointer is over a chart._ > The visible time-frame (pan and zoom) is propagated from Netdata server to Netdata server, when navigating via the [node menu](../registry#registry). @@ -171,196 +175,225 @@ To improve visual anomaly detection across charts, the user can highlight a time  -*A highlighted time-frame can be given by pressing `ALT` + `mouse selection` on any chart. Netdata will highlight the same range on all charts.* +_A highlighted time-frame can be given by pressing `ALT` + `mouse selection` on any chart. Netdata will highlight the same range on all charts._ > Highlighted ranges are propagated from Netdata server to Netdata server, when navigating via the [node menu](../registry#registry). - ## What does it monitor Netdata data collection is **extensible** - you can monitor anything you can get a metric for. Its [Plugin API](../collectors/plugins.d/) supports all programing languages (anything can be a Netdata plugin, BASH, python, perl, node.js, java, Go, ruby, etc). -- For better performance, most system related plugins (cpu, memory, disks, filesystems, networking, etc) have been written in `C`. -- For faster development and easier contributions, most application related plugins (databases, web servers, etc) have been written in `python`. +- For better performance, most system related plugins (cpu, memory, disks, filesystems, networking, etc) have been written in `C`. +- For faster development and easier contributions, most application related plugins (databases, web servers, etc) have been written in `python`. #### APM (Application Performance Monitoring) -- **[statsd](../collectors/statsd.plugin/)** - Netdata is a fully featured statsd server. -- **[Go expvar](../collectors/python.d.plugin/go_expvar/)** - collects metrics exposed by applications written in the Go programming language using the expvar package. -- **[Spring Boot](../collectors/python.d.plugin/springboot/)** - monitors running Java Spring Boot applications that expose their metrics with the use of the Spring Boot Actuator included in Spring Boot library. -- **[uWSGI](../collectors/python.d.plugin/uwsgi/)** - collects performance metrics from uWSGI applications. + +- **[statsd](../collectors/statsd.plugin/)** - Netdata is a fully featured statsd server. +- **[Go expvar](../collectors/python.d.plugin/go_expvar/)** - collects metrics exposed by applications written in the Go programming language using the expvar package. +- **[Spring Boot](../collectors/python.d.plugin/springboot/)** - monitors running Java Spring Boot applications that expose their metrics with the use of the Spring Boot Actuator included in Spring Boot library. +- **[uWSGI](../collectors/python.d.plugin/uwsgi/)** - collects performance metrics from uWSGI applications. #### System Resources -- **[CPU Utilization](../collectors/proc.plugin/)** - total and per core CPU usage. -- **[Interrupts](../collectors/proc.plugin/)** - total and per core CPU interrupts. -- **[SoftIRQs](../collectors/proc.plugin/)** - total and per core SoftIRQs. -- **[SoftNet](../collectors/proc.plugin/)** - total and per core SoftIRQs related to network activity. -- **[CPU Throttling](../collectors/proc.plugin/)** - collects per core CPU throttling. -- **[CPU Frequency](../collectors/proc.plugin/)** - collects the current CPU frequency. -- **[CPU Idle](../collectors/proc.plugin/)** - collects the time spent per processor state. -- **[IdleJitter](../collectors/idlejitter.plugin/)** - measures CPU latency. -- **[Entropy](../collectors/proc.plugin/)** - random numbers pool, using in cryptography. -- **[Interprocess Communication - IPC](../collectors/proc.plugin/)** - such as semaphores and semaphores arrays. + +- **[CPU Utilization](../collectors/proc.plugin/)** - total and per core CPU usage. +- **[Interrupts](../collectors/proc.plugin/)** - total and per core CPU interrupts. +- **[SoftIRQs](../collectors/proc.plugin/)** - total and per core SoftIRQs. +- **[SoftNet](../collectors/proc.plugin/)** - total and per core SoftIRQs related to network activity. +- **[CPU Throttling](../collectors/proc.plugin/)** - collects per core CPU throttling. +- **[CPU Frequency](../collectors/proc.plugin/)** - collects the current CPU frequency. +- **[CPU Idle](../collectors/proc.plugin/)** - collects the time spent per processor state. +- **[IdleJitter](../collectors/idlejitter.plugin/)** - measures CPU latency. +- **[Entropy](../collectors/proc.plugin/)** - random numbers pool, using in cryptography. +- **[Interprocess Communication - IPC](../collectors/proc.plugin/)** - such as semaphores and semaphores arrays. #### Memory -- **[ram](../collectors/proc.plugin/)** - collects info about RAM usage. -- **[swap](../collectors/proc.plugin/)** - collects info about swap memory usage. -- **[available memory](../collectors/proc.plugin/)** - collects the amount of RAM available for userspace processes. -- **[committed memory](../collectors/proc.plugin/)** - collects the amount of RAM committed to userspace processes. -- **[Page Faults](../collectors/proc.plugin/)** - collects the system page faults (major and minor). -- **[writeback memory](../collectors/proc.plugin/)** - collects the system dirty memory and writeback activity. -- **[huge pages](../collectors/proc.plugin/)** - collects the amount of RAM used for huge pages. -- **[KSM](../collectors/proc.plugin/)** - collects info about Kernel Same Merging (memory dedupper). -- **[Numa](../collectors/proc.plugin/)** - collects Numa info on systems that support it. -- **[slab](../collectors/proc.plugin/)** - collects info about the Linux kernel memory usage. + +- **[ram](../collectors/proc.plugin/)** - collects info about RAM usage. +- **[swap](../collectors/proc.plugin/)** - collects info about swap memory usage. +- **[available memory](../collectors/proc.plugin/)** - collects the amount of RAM available for userspace processes. +- **[committed memory](../collectors/proc.plugin/)** - collects the amount of RAM committed to userspace processes. +- **[Page Faults](../collectors/proc.plugin/)** - collects the system page faults (major and minor). +- **[writeback memory](../collectors/proc.plugin/)** - collects the system dirty memory and writeback activity. +- **[huge pages](../collectors/proc.plugin/)** - collects the amount of RAM used for huge pages. +- **[KSM](../collectors/proc.plugin/)** - collects info about Kernel Same Merging (memory dedupper). +- **[Numa](../collectors/proc.plugin/)** - collects Numa info on systems that support it. +- **[slab](../collectors/proc.plugin/)** - collects info about the Linux kernel memory usage. #### Disks -- **[block devices](../collectors/proc.plugin/)** - per disk: I/O, operations, backlog, utilization, space, etc. -- **[BCACHE](../collectors/proc.plugin/)** - detailed performance of SSD caching devices. -- **[DiskSpace](../collectors/proc.plugin/)** - monitors disk space usage. -- **[mdstat](../collectors/proc.plugin/)** - software RAID. -- **[hddtemp](../collectors/python.d.plugin/hddtemp/)** - disk temperatures. -- **[smartd](../collectors/python.d.plugin/smartd_log/)** - disk S.M.A.R.T. values. -- **[device mapper](../collectors/proc.plugin/)** - naming disks. -- **[Veritas Volume Manager](../collectors/proc.plugin/)** - naming disks. -- **[megacli](../collectors/python.d.plugin/megacli/)** - adapter, physical drives and battery stats. -- **[adaptec_raid](../collectors/python.d.plugin/adaptec_raid/)** - logical and physical devices health metrics. -- **[ioping](../collectors/ioping.plugin/)** - to measure disk read/write latency. + +- **[block devices](../collectors/proc.plugin/)** - per disk: I/O, operations, backlog, utilization, space, etc. +- **[BCACHE](../collectors/proc.plugin/)** - detailed performance of SSD caching devices. +- **[DiskSpace](../collectors/proc.plugin/)** - monitors disk space usage. +- **[mdstat](../collectors/proc.plugin/)** - software RAID. +- **[hddtemp](../collectors/python.d.plugin/hddtemp/)** - disk temperatures. +- **[smartd](../collectors/python.d.plugin/smartd_log/)** - disk S.M.A.R.T. values. +- **[device mapper](../collectors/proc.plugin/)** - naming disks. +- **[Veritas Volume Manager](../collectors/proc.plugin/)** - naming disks. +- **[megacli](../collectors/python.d.plugin/megacli/)** - adapter, physical drives and battery stats. +- **[adaptec_raid](../collectors/python.d.plugin/adaptec_raid/)** - logical and physical devices health metrics. +- **[ioping](../collectors/ioping.plugin/)** - to measure disk read/write latency. #### Filesystems -- **[BTRFS](../collectors/proc.plugin/)** - detailed disk space allocation and usage. -- **[Ceph](../collectors/python.d.plugin/ceph/)** - OSD usage, Pool usage, number of objects, etc. -- **[NFS file servers and clients](../collectors/proc.plugin/)** - NFS v2, v3, v4: I/O, cache, read ahead, RPC calls -- **[Samba](../collectors/python.d.plugin/samba/)** - performance metrics of Samba SMB2 file sharing. -- **[ZFS](../collectors/proc.plugin/)** - detailed performance and resource usage. + +- **[BTRFS](../collectors/proc.plugin/)** - detailed disk space allocation and usage. +- **[Ceph](../collectors/python.d.plugin/ceph/)** - OSD usage, Pool usage, number of objects, etc. +- **[NFS file servers and clients](../collectors/proc.plugin/)** - NFS v2, v3, v4: I/O, cache, read ahead, RPC calls +- **[Samba](../collectors/python.d.plugin/samba/)** - performance metrics of Samba SMB2 file sharing. +- **[ZFS](../collectors/proc.plugin/)** - detailed performance and resource usage. #### Networking -- **[Network Stack](../collectors/proc.plugin/)** - everything about the networking stack (both IPv4 and IPv6 for all protocols: TCP, UDP, SCTP, UDPLite, ICMP, Multicast, Broadcast, etc), and all network interfaces (per interface: bandwidth, packets, errors, drops). -- **[Netfilter](../collectors/proc.plugin/)** - everything about the netfilter connection tracker. -- **[SynProxy](../collectors/proc.plugin/)** - collects performance data about the linux SYNPROXY (DDoS). -- **[NFacct](../collectors/nfacct.plugin/)** - collects accounting data from iptables. -- **[Network QoS](../collectors/tc.plugin/)** - the only tool that visualizes network `tc` classes in real-time -- **[FPing](../collectors/fping.plugin/)** - to measure latency and packet loss between any number of hosts. -- **[ISC dhcpd](../collectors/python.d.plugin/isc_dhcpd/)** - pools utilization, leases, etc. -- **[AP](../collectors/charts.d.plugin/ap/)** - collects Linux access point performance data (`hostapd`). -- **[SNMP](../collectors/node.d.plugin/snmp/)** - SNMP devices can be monitored too (although you will need to configure these). -- **[port_check](../collectors/python.d.plugin/portcheck/)** - checks TCP ports for availability and response time. + +- **[Network Stack](../collectors/proc.plugin/)** - everything about the networking stack (both IPv4 and IPv6 for all protocols: TCP, UDP, SCTP, UDPLite, ICMP, Multicast, Broadcast, etc), and all network interfaces (per interface: bandwidth, packets, errors, drops). +- **[Netfilter](../collectors/proc.plugin/)** - everything about the netfilter connection tracker. +- **[SynProxy](../collectors/proc.plugin/)** - collects performance data about the linux SYNPROXY (DDoS). +- **[NFacct](../collectors/nfacct.plugin/)** - collects accounting data from iptables. +- **[Network QoS](../collectors/tc.plugin/)** - the only tool that visualizes network `tc` classes in real-time +- **[FPing](../collectors/fping.plugin/)** - to measure latency and packet loss between any number of hosts. +- **[ISC dhcpd](../collectors/python.d.plugin/isc_dhcpd/)** - pools utilization, leases, etc. +- **[AP](../collectors/charts.d.plugin/ap/)** - collects Linux access point performance data (`hostapd`). +- **[SNMP](../collectors/node.d.plugin/snmp/)** - SNMP devices can be monitored too (although you will need to configure these). +- **[port_check](../collectors/python.d.plugin/portcheck/)** - checks TCP ports for availability and response time. #### Virtual Private Networks -- **[OpenVPN](../collectors/python.d.plugin/ovpn_status_log/)** - collects status per tunnel. -- **[LibreSwan](../collectors/charts.d.plugin/libreswan/)** - collects metrics per IPSEC tunnel. -- **[Tor](../collectors/python.d.plugin/tor/)** - collects Tor traffic statistics. + +- **[OpenVPN](../collectors/python.d.plugin/ovpn_status_log/)** - collects status per tunnel. +- **[LibreSwan](../collectors/charts.d.plugin/libreswan/)** - collects metrics per IPSEC tunnel. +- **[Tor](../collectors/python.d.plugin/tor/)** - collects Tor traffic statistics. #### Processes -- **[System Processes](../collectors/proc.plugin/)** - running, blocked, forks, active. -- **[Applications](../collectors/apps.plugin/)** - by grouping the process tree and reporting CPU, memory, disk reads, disk writes, swap, threads, pipes, sockets - per process group. -- **[systemd](../collectors/cgroups.plugin/)** - monitors systemd services using CGROUPS. + +- **[System Processes](../collectors/proc.plugin/)** - running, blocked, forks, active. +- **[Applications](../collectors/apps.plugin/)** - by grouping the process tree and reporting CPU, memory, disk reads, disk writes, swap, threads, pipes, sockets - per process group. +- **[systemd](../collectors/cgroups.plugin/)** - monitors systemd services using CGROUPS. #### Users -- **[Users and User Groups resource usage](../collectors/apps.plugin/)** - by summarizing the process tree per user and group, reporting: CPU, memory, disk reads, disk writes, swap, threads, pipes, sockets -- **[logind](../collectors/python.d.plugin/logind/)** - collects sessions, users and seats connected. + +- **[Users and User Groups resource usage](../collectors/apps.plugin/)** - by summarizing the process tree per user and group, reporting: CPU, memory, disk reads, disk writes, swap, threads, pipes, sockets +- **[logind](../collectors/python.d.plugin/logind/)** - collects sessions, users and seats connected. #### Containers and VMs -- **[Containers](../collectors/cgroups.plugin/)** - collects resource usage for all kinds of containers, using CGROUPS (systemd-nspawn, lxc, lxd, docker, kubernetes, etc). -- **[libvirt VMs](../collectors/cgroups.plugin/)** - collects resource usage for all kinds of VMs, using CGROUPS. -- **[dockerd](../collectors/python.d.plugin/dockerd/)** - collects docker health metrics. + +- **[Containers](../collectors/cgroups.plugin/)** - collects resource usage for all kinds of containers, using CGROUPS (systemd-nspawn, lxc, lxd, docker, kubernetes, etc). +- **[libvirt VMs](../collectors/cgroups.plugin/)** - collects resource usage for all kinds of VMs, using CGROUPS. +- **[dockerd](../collectors/python.d.plugin/dockerd/)** - collects docker health metrics. #### Web Servers -- **[Apache and lighttpd](../collectors/python.d.plugin/apache/)** - `mod-status` (v2.2, v2.4) and cache log statistics, for multiple servers. -- **[IPFS](../collectors/python.d.plugin/ipfs/)** - bandwidth, peers. -- **[LiteSpeed](../collectors/python.d.plugin/litespeed/)** - reads the litespeed rtreport files to collect metrics. -- **[Nginx](../collectors/python.d.plugin/nginx/)** - `stub-status`, for multiple servers. -- **[Nginx+](../collectors/python.d.plugin/nginx_plus/)** - connects to multiple nginx_plus servers (local or remote) to collect real-time performance metrics. -- **[PHP-FPM](../collectors/python.d.plugin/phpfpm/)** - multiple instances, each reporting connections, requests, performance, etc. -- **[Tomcat](../collectors/python.d.plugin/tomcat/)** - accesses, threads, free memory, volume, etc. -- **[web server `access.log` files](../collectors/python.d.plugin/web_log/)** - extracting in real-time, web server and proxy performance metrics and applying several health checks, etc. -- **[HTTP check](../collectors/python.d.plugin/httpcheck/)** - checks one or more web servers for HTTP status code and returned content. + +- **[Apache and lighttpd](../collectors/python.d.plugin/apache/)** - `mod-status` (v2.2, v2.4) and cache log statistics, for multiple servers. +- **[IPFS](../collectors/python.d.plugin/ipfs/)** - bandwidth, peers. +- **[LiteSpeed](../collectors/python.d.plugin/litespeed/)** - reads the litespeed rtreport files to collect metrics. +- **[Nginx](../collectors/python.d.plugin/nginx/)** - `stub-status`, for multiple servers. +- **[Nginx+](../collectors/python.d.plugin/nginx_plus/)** - connects to multiple nginx_plus servers (local or remote) to collect real-time performance metrics. +- **[PHP-FPM](../collectors/python.d.plugin/phpfpm/)** - multiple instances, each reporting connections, requests, performance, etc. +- **[Tomcat](../collectors/python.d.plugin/tomcat/)** - accesses, threads, free memory, volume, etc. +- **[web server `access.log` files](../collectors/python.d.plugin/web_log/)** - extracting in real-time, web server and proxy performance metrics and applying several health checks, etc. +- **[HTTP check](../collectors/python.d.plugin/httpcheck/)** - checks one or more web servers for HTTP status code and returned content. #### Proxies, Balancers, Accelerators -- **[HAproxy](../collectors/python.d.plugin/haproxy/)** - bandwidth, sessions, backends, etc. -- **[Squid](../collectors/python.d.plugin/squid/)** - multiple servers, each showing: clients bandwidth and requests, servers bandwidth and requests. -- **[Traefik](../collectors/python.d.plugin/traefik/)** - connects to multiple traefik instances (local or remote) to collect API metrics (response status code, response time, average response time and server uptime). -- **[Varnish](../collectors/python.d.plugin/varnish/)** - threads, sessions, hits, objects, backends, etc. -- **[IPVS](../collectors/proc.plugin/)** - collects metrics from the Linux IPVS load balancer. + +- **[HAproxy](../collectors/python.d.plugin/haproxy/)** - bandwidth, sessions, backends, etc. +- **[Squid](../collectors/python.d.plugin/squid/)** - multiple servers, each showing: clients bandwidth and requests, servers bandwidth and requests. +- **[Traefik](../collectors/python.d.plugin/traefik/)** - connects to multiple traefik instances (local or remote) to collect API metrics (response status code, response time, average response time and server uptime). +- **[Varnish](../collectors/python.d.plugin/varnish/)** - threads, sessions, hits, objects, backends, etc. +- **[IPVS](../collectors/proc.plugin/)** - collects metrics from the Linux IPVS load balancer. #### Database Servers -- **[CouchDB](../collectors/python.d.plugin/couchdb/)** - reads/writes, request methods, status codes, tasks, replication, per-db, etc. -- **[MemCached](../collectors/python.d.plugin/memcached/)** - multiple servers, each showing: bandwidth, connections, items, etc. -- **[MongoDB](../collectors/python.d.plugin/mongodb/)** - operations, clients, transactions, cursors, connections, asserts, locks, etc. -- **[MySQL and mariadb](../collectors/python.d.plugin/mysql/)** - multiple servers, each showing: bandwidth, queries/s, handlers, locks, issues, tmp operations, connections, binlog metrics, threads, innodb metrics, and more. -- **[PostgreSQL](../collectors/python.d.plugin/postgres/)** - multiple servers, each showing: per database statistics (connections, tuples read - written - returned, transactions, locks), backend processes, indexes, tables, write ahead, background writer and more. -- **[Proxy SQL](../collectors/python.d.plugin/proxysql/)** - collects Proxy SQL backend and frontend performance metrics. -- **[Redis](../collectors/python.d.plugin/redis/)** - multiple servers, each showing: operations, hit rate, memory, keys, clients, slaves. -- **[RethinkDB](../collectors/python.d.plugin/rethinkdbs/)** - connects to multiple rethinkdb servers (local or remote) to collect real-time metrics. + +- **[CouchDB](../collectors/python.d.plugin/couchdb/)** - reads/writes, request methods, status codes, tasks, replication, per-db, etc. +- **[MemCached](../collectors/python.d.plugin/memcached/)** - multiple servers, each showing: bandwidth, connections, items, etc. +- **[MongoDB](../collectors/python.d.plugin/mongodb/)** - operations, clients, transactions, cursors, connections, asserts, locks, etc. +- **[MySQL and mariadb](../collectors/python.d.plugin/mysql/)** - multiple servers, each showing: bandwidth, queries/s, handlers, locks, issues, tmp operations, connections, binlog metrics, threads, innodb metrics, and more. +- **[PostgreSQL](../collectors/python.d.plugin/postgres/)** - multiple servers, each showing: per database statistics (connections, tuples read - written - returned, transactions, locks), backend processes, indexes, tables, write ahead, background writer and more. +- **[Proxy SQL](../collectors/python.d.plugin/proxysql/)** - collects Proxy SQL backend and frontend performance metrics. +- **[Redis](../collectors/python.d.plugin/redis/)** - multiple servers, each showing: operations, hit rate, memory, keys, clients, slaves. +- **[RethinkDB](../collectors/python.d.plugin/rethinkdbs/)** - connects to multiple rethinkdb servers (local or remote) to collect real-time metrics. #### Message Brokers -- **[beanstalkd](../collectors/python.d.plugin/beanstalk/)** - global and per tube monitoring. -- **[RabbitMQ](../collectors/python.d.plugin/rabbitmq/)** - performance and health metrics. + +- **[beanstalkd](../collectors/python.d.plugin/beanstalk/)** - global and per tube monitoring. +- **[RabbitMQ](../collectors/python.d.plugin/rabbitmq/)** - performance and health metrics. #### Search and Indexing -- **[ElasticSearch](../collectors/python.d.plugin/elasticsearch/)** - search and index performance, latency, timings, cluster statistics, threads statistics, etc. + +- **[ElasticSearch](../collectors/python.d.plugin/elasticsearch/)** - search and index performance, latency, timings, cluster statistics, threads statistics, etc. #### DNS Servers -- **[bind_rndc](../collectors/python.d.plugin/bind_rndc/)** - parses `named.stats` dump file to collect real-time performance metrics. All versions of bind after 9.6 are supported. -- **[dnsdist](../collectors/python.d.plugin/dnsdist/)** - performance and health metrics. -- **[ISC Bind (named)](../collectors/node.d.plugin/named/)** - multiple servers, each showing: clients, requests, queries, updates, failures and several per view metrics. All versions of bind after 9.9.10 are supported. -- **[NSD](../collectors/python.d.plugin/nsd/)** - queries, zones, protocols, query types, transfers, etc. -- **[PowerDNS](../collectors/python.d.plugin/powerdns/)** - queries, answers, cache, latency, etc. -- **[unbound](../collectors/python.d.plugin/unbound/)** - performance and resource usage metrics. -- **[dns_query_time](../collectors/python.d.plugin/dns_query_time/)** - DNS query time statistics. + +- **[bind_rndc](../collectors/python.d.plugin/bind_rndc/)** - parses `named.stats` dump file to collect real-time performance metrics. All versions of bind after 9.6 are supported. +- **[dnsdist](../collectors/python.d.plugin/dnsdist/)** - performance and health metrics. +- **[ISC Bind (named)](../collectors/node.d.plugin/named/)** - multiple servers, each showing: clients, requests, queries, updates, failures and several per view metrics. All versions of bind after 9.9.10 are supported. +- **[NSD](../collectors/python.d.plugin/nsd/)** - queries, zones, protocols, query types, transfers, etc. +- **[PowerDNS](../collectors/python.d.plugin/powerdns/)** - queries, answers, cache, latency, etc. +- **[unbound](../collectors/python.d.plugin/unbound/)** - performance and resource usage metrics. +- **[dns_query_time](../collectors/python.d.plugin/dns_query_time/)** - DNS query time statistics. #### Time Servers -- **[chrony](../collectors/python.d.plugin/chrony/)** - uses the `chronyc` command to collect chrony statistics (Frequency, Last offset, RMS offset, Residual freq, Root delay, Root dispersion, Skew, System time). -- **[ntpd](../collectors/python.d.plugin/ntpd/)** - connects to multiple ntpd servers (local or remote) to provide statistics of system variables and optional also peer variables. + +- **[chrony](../collectors/python.d.plugin/chrony/)** - uses the `chronyc` command to collect chrony statistics (Frequency, Last offset, RMS offset, Residual freq, Root delay, Root dispersion, Skew, System time). +- **[ntpd](../collectors/python.d.plugin/ntpd/)** - connects to multiple ntpd servers (local or remote) to provide statistics of system variables and optional also peer variables. #### Mail Servers -- **[Dovecot](../collectors/python.d.plugin/dovecot/)** - POP3/IMAP servers. -- **[Exim](../collectors/python.d.plugin/exim/)** - message queue (emails queued). -- **[Postfix](../collectors/python.d.plugin/postfix/)** - message queue (entries, size). + +- **[Dovecot](../collectors/python.d.plugin/dovecot/)** - POP3/IMAP servers. +- **[Exim](../collectors/python.d.plugin/exim/)** - message queue (emails queued). +- **[Postfix](../collectors/python.d.plugin/postfix/)** - message queue (entries, size). #### Hardware Sensors -- **[IPMI](../collectors/freeipmi.plugin/)** - enterprise hardware sensors and events. -- **[lm-sensors](../collectors/python.d.plugin/sensors/)** - temperature, voltage, fans, power, humidity, etc. -- **[Nvidia](../collectors/python.d.plugin/nvidia_smi/)** - collects information for Nvidia GPUs. -- **[RPi](../collectors/charts.d.plugin/sensors/)** - Raspberry Pi temperature sensors. -- **[w1sensor](../collectors/python.d.plugin/w1sensor/)** - collects data from connected 1-Wire sensors. + +- **[IPMI](../collectors/freeipmi.plugin/)** - enterprise hardware sensors and events. +- **[lm-sensors](../collectors/python.d.plugin/sensors/)** - temperature, voltage, fans, power, humidity, etc. +- **[Nvidia](../collectors/python.d.plugin/nvidia_smi/)** - collects information for Nvidia GPUs. +- **[RPi](../collectors/charts.d.plugin/sensors/)** - Raspberry Pi temperature sensors. +- **[w1sensor](../collectors/python.d.plugin/w1sensor/)** - collects data from connected 1-Wire sensors. #### UPSes -- **[apcupsd](../collectors/charts.d.plugin/apcupsd/)** - load, charge, battery voltage, temperature, utility metrics, output metrics -- **[NUT](../collectors/charts.d.plugin/nut/)** - load, charge, battery voltage, temperature, utility metrics, output metrics -- **[Linux Power Supply](../collectors/proc.plugin/)** - collects metrics reported by power supply drivers on Linux. + +- **[apcupsd](../collectors/charts.d.plugin/apcupsd/)** - load, charge, battery voltage, temperature, utility metrics, output metrics +- **[NUT](../collectors/charts.d.plugin/nut/)** - load, charge, battery voltage, temperature, utility metrics, output metrics +- **[Linux Power Supply](../collectors/proc.plugin/)** - collects metrics reported by power supply drivers on Linux. #### Social Sharing Servers -- **[RetroShare](../collectors/python.d.plugin/retroshare/)** - connects to multiple retroshare servers (local or remote) to collect real-time performance metrics. + +- **[RetroShare](../collectors/python.d.plugin/retroshare/)** - connects to multiple retroshare servers (local or remote) to collect real-time performance metrics. #### Security -- **[Fail2Ban](../collectors/python.d.plugin/fail2ban/)** - monitors the fail2ban log file to check all bans for all active jails. + +- **[Fail2Ban](../collectors/python.d.plugin/fail2ban/)** - monitors the fail2ban log file to check all bans for all active jails. #### Authentication, Authorization, Accounting (AAA, RADIUS, LDAP) Servers -- **[FreeRadius](../collectors/python.d.plugin/freeradius/)** - uses the `radclient` command to provide freeradius statistics (authentication, accounting, proxy-authentication, proxy-accounting). + +- **[FreeRadius](../collectors/python.d.plugin/freeradius/)** - uses the `radclient` command to provide freeradius statistics (authentication, accounting, proxy-authentication, proxy-accounting). #### Telephony Servers -- **[opensips](../collectors/charts.d.plugin/opensips/)** - connects to an opensips server (localhost only) to collect real-time performance metrics. + +- **[opensips](../collectors/charts.d.plugin/opensips/)** - connects to an opensips server (localhost only) to collect real-time performance metrics. #### Household Appliances -- **[SMA webbox](../collectors/node.d.plugin/sma_webbox/)** - connects to multiple remote SMA webboxes to collect real-time performance metrics of the photovoltaic (solar) power generation. -- **[Fronius](../collectors/node.d.plugin/fronius/)** - connects to multiple remote Fronius Symo servers to collect real-time performance metrics of the photovoltaic (solar) power generation. -- **[StiebelEltron](../collectors/node.d.plugin/stiebeleltron/)** - collects the temperatures and other metrics from your Stiebel Eltron heating system using their Internet Service Gateway (ISG web). + +- **[SMA webbox](../collectors/node.d.plugin/sma_webbox/)** - connects to multiple remote SMA webboxes to collect real-time performance metrics of the photovoltaic (solar) power generation. +- **[Fronius](../collectors/node.d.plugin/fronius/)** - connects to multiple remote Fronius Symo servers to collect real-time performance metrics of the photovoltaic (solar) power generation. +- **[StiebelEltron](../collectors/node.d.plugin/stiebeleltron/)** - collects the temperatures and other metrics from your Stiebel Eltron heating system using their Internet Service Gateway (ISG web). #### Game Servers -- **[SpigotMC](../collectors/python.d.plugin/spigotmc/)** - monitors Spigot Minecraft server ticks per second and number of online players using the Minecraft remote console. + +- **[SpigotMC](../collectors/python.d.plugin/spigotmc/)** - monitors Spigot Minecraft server ticks per second and number of online players using the Minecraft remote console. #### Distributed Computing -- **[BOINC](../collectors/python.d.plugin/boinc/)** - monitors task states for local and remote BOINC client software using the remote GUI RPC interface. Also provides alarms for a handful of error conditions. + +- **[BOINC](../collectors/python.d.plugin/boinc/)** - monitors task states for local and remote BOINC client software using the remote GUI RPC interface. Also provides alarms for a handful of error conditions. #### Media Streaming Servers -- **[IceCast](../collectors/python.d.plugin/icecast/)** - collects the number of listeners for active sources. + +- **[IceCast](../collectors/python.d.plugin/icecast/)** - collects the number of listeners for active sources. ### Monitoring Systems -- **[Monit](../collectors/python.d.plugin/monit/)** - collects metrics about monit targets (filesystems, applications, networks). + +- **[Monit](../collectors/python.d.plugin/monit/)** - collects metrics about monit targets (filesystems, applications, networks). #### Provisioning Systems -- **[Puppet](../collectors/python.d.plugin/puppet/)** - connects to multiple Puppet Server and Puppet DB instances (local or remote) to collect real-time status metrics. + +- **[Puppet](../collectors/python.d.plugin/puppet/)** - connects to multiple Puppet Server and Puppet DB instances (local or remote) to collect real-time status metrics. You can easily extend Netdata, by writing plugins that collect data from any source, using any computer language. @@ -372,14 +405,14 @@ To report bugs, or get help, use [GitHub Issues](https://github.com/netdata/netd You can also find Netdata on: -- [Facebook](https://www.facebook.com/linuxnetdata/) -- [Twitter](https://twitter.com/linuxnetdata) -- [OpenHub](https://www.openhub.net/p/netdata) -- [Repology](https://repology.org/metapackage/netdata/versions) -- [StackShare](https://stackshare.io/netdata) +- [Facebook](https://www.facebook.com/linuxnetdata/) +- [Twitter](https://twitter.com/linuxnetdata) +- [OpenHub](https://www.openhub.net/p/netdata) +- [Repology](https://repology.org/metapackage/netdata/versions) +- [StackShare](https://stackshare.io/netdata) ## License Netdata is [GPLv3+](../LICENSE). -Netdata re-distributes other open-source tools and libraries. Please check the [third party licenses](../REDISTRIBUTED.md).
\ No newline at end of file +Netdata re-distributes other open-source tools and libraries. Please check the [third party licenses](../REDISTRIBUTED.md). diff --git a/docs/why-netdata/1s-granularity.md b/docs/why-netdata/1s-granularity.md index 0d12a2d41..195a0d8f0 100644 --- a/docs/why-netdata/1s-granularity.md +++ b/docs/why-netdata/1s-granularity.md @@ -4,9 +4,9 @@ High resolution metrics are required to effectively monitor and troubleshoot sys ## Why? -- The world is going real-time. Today, customer experience is significantly affected by response time, so SLAs are tighter than ever before. It is just not practical to monitor a 2-second SLA with 10-second metrics. +- The world is going real-time. Today, customer experience is significantly affected by response time, so SLAs are tighter than ever before. It is just not practical to monitor a 2-second SLA with 10-second metrics. -- IT goes virtual. Unlike real hardware, virtual environments are not linear, nor predictable. You cannot expect resources to be available when your applications need them. They will eventually be, but not exactly at the time they are needed. The latency of virtual environments is affected by many factors, most of which are outside our control, like: the maintenance policy of the hosting provider, the work load of third party virtual machines running on the same physical servers combined with the resource allocation and throttling policy among virtual machines, the provisioning system of the hosting provider, etc. +- IT goes virtual. Unlike real hardware, virtual environments are not linear, nor predictable. You cannot expect resources to be available when your applications need them. They will eventually be, but not exactly at the time they are needed. The latency of virtual environments is affected by many factors, most of which are outside our control, like: the maintenance policy of the hosting provider, the work load of third party virtual machines running on the same physical servers combined with the resource allocation and throttling policy among virtual machines, the provisioning system of the hosting provider, etc. ## What do others do? @@ -16,9 +16,9 @@ They want to, but they can't, at least not massively. The reasons lie in their design decisions: -1. Time-series databases (prometheus, graphite, opentsdb, influxdb, etc) centralize all the metrics. At scale, these databases can easily become the bottleneck of the whole infrastructure. +1. Time-series databases (prometheus, graphite, opentsdb, influxdb, etc) centralize all the metrics. At scale, these databases can easily become the bottleneck of the whole infrastructure. -2. SaaS providers base their business models on centralizing all the metrics. On top of the time-series database bottleneck they also have increased bandwidth costs. So, massively supporting high resolution metrics, destroys their business model. +2. SaaS providers base their business models on centralizing all the metrics. On top of the time-series database bottleneck they also have increased bandwidth costs. So, massively supporting high resolution metrics, destroys their business model. Of course, since a couple of decades the world has fixed this kind of scaling problems: instead of scaling up, scale out, horizontally. That is, instead of investing on bigger and bigger central components, decentralize the application so that it can scale by adding more smaller nodes to it. @@ -30,9 +30,9 @@ Finally, per second data collection is a lot harder. Busy virtual environments h So, the monitoring industry fails to massively provide high resolution metrics, mainly for 3 reasons: -1. Centralization of metrics makes monitoring cost inefficient at that rate. -2. Data collection needs optimization, otherwise it will significantly affect the monitored systems. -3. Data collection is a lot harder, especially on busy virtual environments. +1. Centralization of metrics makes monitoring cost inefficient at that rate. +2. Data collection needs optimization, otherwise it will significantly affect the monitored systems. +3. Data collection is a lot harder, especially on busy virtual environments. ## What does Netdata do differently? @@ -45,9 +45,10 @@ To eliminate the error introduced by data collection latencies on busy virtual e Finally, Netdata is really fast. Optimization is a core product feature. On modern hardware, Netdata can collect metrics with a rate of above 1M metrics per second per core (this includes everything, parsing data sources, interpolating data, storing data in the time series database, etc). So, for a few thousands metrics per second per node, Netdata needs negligible CPU resources (just 1-2% of a single core). Netdata has been designed to: -- Solve the centralization problem of monitoring -- Replace the console for performance troubleshooting. + +- Solve the centralization problem of monitoring +- Replace the console for performance troubleshooting. So, for Netdata 1s granularity is easy, the natural outcome... -[]() +[](<>) diff --git a/docs/why-netdata/README.md b/docs/why-netdata/README.md index df8c0d02b..1003b07a4 100644 --- a/docs/why-netdata/README.md +++ b/docs/why-netdata/README.md @@ -6,25 +6,25 @@ Netdata is built around 4 principles: -1. **[Per second data collection for all metrics.](1s-granularity.md)** +1. **[Per second data collection for all metrics.](1s-granularity.md)** - *It is impossible to monitor a 2 second SLA, with 10 second metrics.* + _It is impossible to monitor a 2 second SLA, with 10 second metrics._ -2. **[Collect and visualize all the metrics from all possible sources.](unlimited-metrics.md)** +2. **[Collect and visualize all the metrics from all possible sources.](unlimited-metrics.md)** - *To troubleshoot slowdowns, we need all the available metrics. The console should not provide more metrics.* + _To troubleshoot slowdowns, we need all the available metrics. The console should not provide more metrics._ -3. **[Meaningful presentation, optimized for visual anomaly detection.](meaningful-presentation.md)** +3. **[Meaningful presentation, optimized for visual anomaly detection.](meaningful-presentation.md)** - *Metrics are a lot more than name-value pairs over time. The monitoring tool should know all the metrics. Users should not!* + _Metrics are a lot more than name-value pairs over time. The monitoring tool should know all the metrics. Users should not!_ -4. **[Immediate results, just install and use.](immediate-results.md)** +4. **[Immediate results, just install and use.](immediate-results.md)** - *Most of our infrastructure is standardized. There is no point to configure everything metric by metric.* + _Most of our infrastructure is standardized. There is no point to configure everything metric by metric._ Unlike other monitoring solutions that focus on metrics visualization, Netdata's helps us troubleshoot slowdowns without touching the console. So, everything is a bit different. -[]() +[](<>) diff --git a/docs/why-netdata/immediate-results.md b/docs/why-netdata/immediate-results.md index 123336711..f1f452ca4 100644 --- a/docs/why-netdata/immediate-results.md +++ b/docs/why-netdata/immediate-results.md @@ -1,7 +1,7 @@ # Immediate results Most of our infrastructure is based on standardized systems and applications. - + It is a tremendous waste of time and effort, in a global scale, to require from all users to configure their infrastructure dashboards and alarms metric by metric. ## Why? @@ -22,20 +22,20 @@ Monitoring SaaS providers offer a very basic set of pre-configured metrics, dash ## What does Netdata do? -1. Metrics are auto-detected, so for 99% of the cases data collection works out of the box. -2. Metrics are converted to human readable units, right after data collection, before storing them into the database. -3. Metrics are structured, organized in charts, families and applications, so that they can be browsed. -4. Dashboards are automatically generated, so all metrics are available for exploration immediately after installation. -5. Dashboards are not just visualizing metrics; they are a tool, optimized for visual anomaly detection. -6. Hundreds of pre-configured alarm templates are automatically attached to collected metrics. +1. Metrics are auto-detected, so for 99% of the cases data collection works out of the box. +2. Metrics are converted to human readable units, right after data collection, before storing them into the database. +3. Metrics are structured, organized in charts, families and applications, so that they can be browsed. +4. Dashboards are automatically generated, so all metrics are available for exploration immediately after installation. +5. Dashboards are not just visualizing metrics; they are a tool, optimized for visual anomaly detection. +6. Hundreds of pre-configured alarm templates are automatically attached to collected metrics. The result is that Netdata can be used immediately after installation! Netdata: -- Helps engineers understand and learn what the metrics are. -- Does not require any configuration. Of course there are thousands of options to tweak, but the defaults are pretty good for most systems. -- Does not introduce any query languages or any other technology to be learned. Of course some familiarity with the tool is required, but nothing too complicated. -- Includes all the community expertise and experience for monitoring systems and applications. +- Helps engineers understand and learn what the metrics are. +- Does not require any configuration. Of course there are thousands of options to tweak, but the defaults are pretty good for most systems. +- Does not introduce any query languages or any other technology to be learned. Of course some familiarity with the tool is required, but nothing too complicated. +- Includes all the community expertise and experience for monitoring systems and applications. -[]() +[](<>) diff --git a/docs/why-netdata/meaningful-presentation.md b/docs/why-netdata/meaningful-presentation.md index f6fd07560..2623d152a 100644 --- a/docs/why-netdata/meaningful-presentation.md +++ b/docs/why-netdata/meaningful-presentation.md @@ -15,20 +15,20 @@ The result is that for most of the world, monitoring sucks. It is incomplete, in But even if all the metrics are collected, an even bigger challenge is revealed: What to do with them? How to use them? The existing monitoring solutions, assume the engineers will: - -- Design dashboards -- Configure alarms -- Use a query language to investigate issues + +- Design dashboards +- Configure alarms +- Use a query language to investigate issues However, all these have to be configured metric by metric. The monitoring industry believes there is this "IT Operations Hero", a person combining these abilities: -1. Has a deep understanding of IT architectures and is a skillful SysAdmin. -2. Is a superb Network Administrator (can even read and understand the Linux kernel networking stack). -3. Is a exceptional database administrator. -4. Is fluent in software engineering, capable of understanding the internal workings of applications. -5. Masters Data Science, statistical algorithms and is fluent in writing advanced mathematical queries to reveal the meaning of metrics. +1. Has a deep understanding of IT architectures and is a skillful SysAdmin. +2. Is a superb Network Administrator (can even read and understand the Linux kernel networking stack). +3. Is a exceptional database administrator. +4. Is fluent in software engineering, capable of understanding the internal workings of applications. +5. Masters Data Science, statistical algorithms and is fluent in writing advanced mathematical queries to reveal the meaning of metrics. Of course this person does not exist! @@ -46,11 +46,11 @@ So, they collect very limited metrics. Basic dashboards can be created with thes In Netdata, the meaning of metrics is incorporated into the database: -1. all metrics are converted and stored to human-friendly units. This is a data-collection process, not a visualization process. For example, cpu utilization in Netdata is stored as percentage, not as kernel ticks. +1. all metrics are converted and stored to human-friendly units. This is a data-collection process, not a visualization process. For example, cpu utilization in Netdata is stored as percentage, not as kernel ticks. -2. all metrics are organized into human-friendly charts, sharing the same context and units (similar to what other monitoring solutions call `cardinality`). So, when Netdata developer collect metrics, they configure the correlation of the metrics right in data collection, which is stored in the database too. +2. all metrics are organized into human-friendly charts, sharing the same context and units (similar to what other monitoring solutions call `cardinality`). So, when Netdata developer collect metrics, they configure the correlation of the metrics right in data collection, which is stored in the database too. -3. all charts are then organized in families, and chart families are organized in applications. These structures are responsible for providing the menu at the right side of Netdata dashboards for exploring the whole database. +3. all charts are then organized in families, and chart families are organized in applications. These structures are responsible for providing the menu at the right side of Netdata dashboards for exploring the whole database. The result is a system that can be browsed by humans, even if the database has 100,000 unique metrics. It is pretty natural for everyone to browse them, understand their meaning and their scope. @@ -60,4 +60,4 @@ But it simplifies everything else. Data collection, metrics database and visuali Netdata goes a step further, by enriching the dashboard with information that is useful for most people. So, to improve clarity and help users be more effective, Netdata includes right in the dashboard the community knowledge and expertise about the metrics. So, that Netdata users can focus on solving their infrastructure problem, not on the technicalities of data collection and visualization. -[]() +[](<>) diff --git a/docs/why-netdata/unlimited-metrics.md b/docs/why-netdata/unlimited-metrics.md index a4ecaf3f2..827138ff1 100644 --- a/docs/why-netdata/unlimited-metrics.md +++ b/docs/why-netdata/unlimited-metrics.md @@ -10,8 +10,8 @@ Unfortunately, this does not work! Filtering out most metrics is like reading a For many people, monitoring is about: -- Detecting outages -- Capacity planning +- Detecting outages +- Capacity planning However, **slowdowns are 10 times more common** compared to outages (check slide 14 of [Online Performance is Business Performance ](https://www.slideshare.net/KenGodskind/alertsitetrac) reported by Trac Research/AlertSite). Designing a monitoring system targeting only outages and capacity planning solves just a tiny part of the operational problems we face. Check also [Downtime vs. Slowtime: Which Hurts More?](https://dzone.com/articles/downtime-vs-slowtime-which-hurts-more). @@ -29,9 +29,9 @@ So, why do monitoring solutions and SaaS providers filter out metrics? They can't do otherwise! -1. Centralization of metrics depends on metrics filtering, to control monitoring costs. Time-series databases limit the number of metrics collected, because the number of metrics influences their performance significantly. They get congested at scale. -2. It is a lot easier to provide an illusion of monitoring by using a few basic metrics. -3. Troubleshooting slowdowns is the hardest IT problem to solve, so most solutions just avoid it. +1. Centralization of metrics depends on metrics filtering, to control monitoring costs. Time-series databases limit the number of metrics collected, because the number of metrics influences their performance significantly. They get congested at scale. +2. It is a lot easier to provide an illusion of monitoring by using a few basic metrics. +3. Troubleshooting slowdowns is the hardest IT problem to solve, so most solutions just avoid it. ## What does Netdata do? @@ -41,4 +41,4 @@ Due to Netdata's distributed nature, the number of metrics collected does not ha Of course, since Netdata is also about [meaningful presentation](meaningful-presentation.md), the number of metrics makes Netdata development slower. We, the Netdata developers, need to have a good understanding of the metrics before adding them into Netdata. We need to organize the metrics, add information related to them, configure alarms for them, so that you, the Netdata users, will have the best out-of-the-box experience and all the information required to kill the console for troubleshooting slowdowns. -[]() +[](<>) |