
diff options
| author | Daniel Baumann <daniel.baumann@progress-linux.org> | 2023-06-14 19:20:36 +0000 |
|---|---|---|
| committer | Daniel Baumann <daniel.baumann@progress-linux.org> | 2023-06-14 19:20:36 +0000 |
| commit | dd24e74edfbafc09eaeb2dde0fda7eb3e1e86d0b (patch) | |
| tree | 1e52f4dac2622ab377c7649f218fb49003b4cbb9 /docs | |
| parent | Releasing debian version 1.39.1-2. (diff) | |
| download | netdata-dd24e74edfbafc09eaeb2dde0fda7eb3e1e86d0b.tar.xz netdata-dd24e74edfbafc09eaeb2dde0fda7eb3e1e86d0b.zip | |
Merging upstream version 1.40.0.
Signed-off-by: Daniel Baumann <daniel.baumann@progress-linux.org>
Diffstat (limited to 'docs')
31 files changed, 993 insertions, 430 deletions
diff --git a/docs/Demo-Sites.md b/docs/Demo-Sites.md index 1fd0d419..177a37d1 100644 --- a/docs/Demo-Sites.md +++ b/docs/Demo-Sites.md @@ -11,10 +11,27 @@ sidebar_position: "90" # Live demos -See the live Netdata Cloud demo with rooms for specific use cases at **https://app.netdata.cloud/spaces/netdata-demo** +See the live Netdata Cloud demo with rooms (listed below) for specific use cases at **https://app.netdata.cloud/spaces/netdata-demo** -| Location | Netdata demo URL | 60 mins reqs | VM donated by | +| Location | Netdata Demo URL | 60 mins reqs | VM donated by | | :------------------ | :-------------------------------------------------------------------------------------------------------------------------------------------- | :------------------------------------------------------------------------------------------------------------------------------------------------------------------------------------------------------------------------------------------------------------| :------------------------------------------------- | +| Netdata Cloud | **[Netdata Demo - All nodes](https://app.netdata.cloud/spaces/netdata-demo/rooms/all-nodes/overview)** ||| +| Netdata Cloud | **[Netdata Demo - Active Directory](https://app.netdata.cloud/spaces/netdata-demo/rooms/active-directory/overview)** ||| +| Netdata Cloud | **[Netdata Demo - Apache](https://app.netdata.cloud/spaces/netdata-demo/rooms/apache/overview)** ||| +| Netdata Cloud | **[Netdata Demo - Cassandra](https://app.netdata.cloud/spaces/netdata-demo/rooms/cassandra/overview)** ||| +| Netdata Cloud | **[Netdata Demo - CoreDNS](https://app.netdata.cloud/spaces/netdata-demo/rooms/coredns/overview)** ||| +| Netdata Cloud | **[Netdata Demo - DNS Query](https://app.netdata.cloud/spaces/netdata-demo/rooms/dns-query/overview)** ||| +| Netdata Cloud | **[Netdata Demo - Docker](https://app.netdata.cloud/spaces/netdata-demo/rooms/docker/overview)** ||| +| Netdata Cloud | **[Netdata Demo - Host Reachability](https://app.netdata.cloud/spaces/netdata-demo/rooms/host-reachability/overview)** ||| +| Netdata Cloud | **[Netdata Demo - HTTP Endpoints](https://app.netdata.cloud/spaces/netdata-demo/rooms/http-endpoints/overview)** ||| +| Netdata Cloud | **[Netdata Demo - IIS](https://app.netdata.cloud/spaces/netdata-demo/rooms/iis/overview)** ||| +| Netdata Cloud | **[Netdata Demo - Kubernetes](https://app.netdata.cloud/spaces/netdata-demo/rooms/kubernetes/kubernetes)** ||| +| Netdata Cloud | **[Netdata Demo - Machine Learning](https://app.netdata.cloud/spaces/netdata-demo/rooms/machine-learning/overview)** ||| +| Netdata Cloud | **[Netdata Demo - MS Exchange](https://app.netdata.cloud/spaces/netdata-demo/rooms/ms-exchange/overview)** ||| +| Netdata Cloud | **[Netdata Demo - Nginx](https://app.netdata.cloud/spaces/netdata-demo/rooms/nginx/overview)** ||| +| Netdata Cloud | **[Netdata Demo - PostgreSQL](https://app.netdata.cloud/spaces/netdata-demo/rooms/postgresql/overview)** ||| +| Netdata Cloud | **[Netdata Demo - Redis](https://app.netdata.cloud/spaces/netdata-demo/rooms/redis/overview)** ||| +| Netdata Cloud | **[Netdata Demo - Windows](https://app.netdata.cloud/spaces/netdata-demo/rooms/windows/overview)** ||| | London (UK) | **[london3.my-netdata.io](https://london3.my-netdata.io)**<br/>(this is the global Netdata **registry** and has **named** and **mysql** charts) | [](https://london3.my-netdata.io) | [DigitalOcean.com](https://m.do.co/c/83dc9f941745) | | Atlanta (USA) | **[cdn77.my-netdata.io](https://cdn77.my-netdata.io)**<br/>(with **named** and **mysql** charts) | [](https://cdn77.my-netdata.io) | [CDN77.com](https://www.cdn77.com/) | | Bangalore (India) | **[bangalore.my-netdata.io](https://bangalore.my-netdata.io)** | [](https://bangalore.my-netdata.io) | [DigitalOcean.com](https://m.do.co/c/83dc9f941745) | @@ -25,5 +42,3 @@ See the live Netdata Cloud demo with rooms for specific use cases at **https://a | Toronto (Canada) | **[toronto.my-netdata.io](https://toronto.my-netdata.io)** | [](https://toronto.my-netdata.io) | [DigitalOcean.com](https://m.do.co/c/83dc9f941745) | Netdata dashboards are mobile- and touch-friendly. - - diff --git a/docs/anonymous-statistics.md b/docs/anonymous-statistics.md index 512cd02d..d8cc9968 100644 --- a/docs/anonymous-statistics.md +++ b/docs/anonymous-statistics.md @@ -8,8 +8,8 @@ learn_rel_path: "Configuration" # Anonymous telemetry events -By default, Netdata collects anonymous usage information from the open-source monitoring agent using the open-source -product analytics platform [PostHog](https://github.com/PostHog/posthog). We use their [cloud enterprise platform](https://posthog.com/product). +By default, Netdata collects anonymous usage information from the open-source monitoring agent. For agent events like start,stop,crash etc we use our own cloud function in GCP. For frontend telemetry (pageviews etc.) on the agent dashboard itself we use the open-source +product analytics platform [PostHog](https://github.com/PostHog/posthog). We are strongly committed to your [data privacy](https://netdata.cloud/privacy/). @@ -52,7 +52,7 @@ variable is controlled via the [opt-out mechanism](#opt-out). ## Agent Backend - Anonymous Statistics Script Every time the daemon is started or stopped and every time a fatal condition is encountered, Netdata uses the anonymous -statistics script to collect system information and send it to the Netdata PostHog via an http call. The information collected for all +statistics script to collect system information and send it to the Netdata telemetry cloud function via an http call. The information collected for all events is: - Netdata version diff --git a/docs/category-overview-pages/accessing-netdata-dashboards.md b/docs/category-overview-pages/accessing-netdata-dashboards.md new file mode 100644 index 00000000..46c0bcff --- /dev/null +++ b/docs/category-overview-pages/accessing-netdata-dashboards.md @@ -0,0 +1,3 @@ +# Accessing Netdata Dashboards + +This section contains documentation on how you can access the Netdata Agent's dashboards, and the Netdata Cloud's dashboards.
\ No newline at end of file diff --git a/docs/category-overview-pages/build-the-netdata-agent-yourself.md b/docs/category-overview-pages/build-the-netdata-agent-yourself.md new file mode 100644 index 00000000..99166ad9 --- /dev/null +++ b/docs/category-overview-pages/build-the-netdata-agent-yourself.md @@ -0,0 +1,3 @@ +# Build the Netdata Agent yourself + +This section contains documentation on all the ways that you can build the Netdata Agent.
\ No newline at end of file diff --git a/docs/category-overview-pages/install-netdata-on-embedded-systems.md b/docs/category-overview-pages/install-netdata-on-embedded-systems.md new file mode 100644 index 00000000..dfaa4482 --- /dev/null +++ b/docs/category-overview-pages/install-netdata-on-embedded-systems.md @@ -0,0 +1,3 @@ +# Install Netdata on Embedded Systems Overview + +This section contains documentation for installation methods when it comes to Embedded Systems.
\ No newline at end of file diff --git a/docs/category-overview-pages/install-with-a-cicd-provisioning-system.md b/docs/category-overview-pages/install-with-a-cicd-provisioning-system.md new file mode 100644 index 00000000..30a5a706 --- /dev/null +++ b/docs/category-overview-pages/install-with-a-cicd-provisioning-system.md @@ -0,0 +1,3 @@ +# Install with a CI/CD Provisioning System Overview + +This section contains documentation on all the installation methods through a CI/CD system.
\ No newline at end of file diff --git a/docs/category-overview-pages/machine-learning-and-assisted-troubleshooting.md b/docs/category-overview-pages/machine-learning-and-assisted-troubleshooting.md new file mode 100644 index 00000000..074051e3 --- /dev/null +++ b/docs/category-overview-pages/machine-learning-and-assisted-troubleshooting.md @@ -0,0 +1,3 @@ +# Machine Learning and Assisted Troubleshooting Overview + +This section contains documentation regarding Netdata's troubleshooting and machine learning features.
\ No newline at end of file diff --git a/docs/category-overview-pages/maintenance-operations-on-netdata-agents.md b/docs/category-overview-pages/maintenance-operations-on-netdata-agents.md new file mode 100644 index 00000000..207a0bd3 --- /dev/null +++ b/docs/category-overview-pages/maintenance-operations-on-netdata-agents.md @@ -0,0 +1,3 @@ +# Maintenance operations on Netdata Agents Overview + +This section provides information on various actions you can take when maintaining a Netdata Agent.
\ No newline at end of file diff --git a/docs/category-overview-pages/metrics-streaming-and-replication.md b/docs/category-overview-pages/metrics-streaming-and-replication.md new file mode 100644 index 00000000..37b040e9 --- /dev/null +++ b/docs/category-overview-pages/metrics-streaming-and-replication.md @@ -0,0 +1,3 @@ +# Metrics Streaming and Replication Overview + +This section contains documentation to help you understand and configure streaming and replication with Netdata.
\ No newline at end of file diff --git a/docs/category-overview-pages/misc-overview.md b/docs/category-overview-pages/misc-overview.md index e0c1cc0d..dbb11e9b 100644 --- a/docs/category-overview-pages/misc-overview.md +++ b/docs/category-overview-pages/misc-overview.md @@ -1,19 +1,3 @@ -<!-- -title: "Miscellaneous material" -sidebar_label: "Miscellaneous" -custom_edit_url: "https://github.com/netdata/netdata/edit/master/docs/category-overview-pages/misc-overview.md" -description: "Available integrations in Netdata" -learn_status: "Published" -learn_rel_path: "Miscellaneous" -sidebar_position: 110 ---> - # Miscellaneous material -This section contains temporary material that no longer belongs in our official documentation, and will -be moved to other locations. We keep it here to make it accessible while we create the new articles. - - - - - +This section contains material that will be moved to new locations as we see fit. We keep it here to make it accessible while we make these changes.
\ No newline at end of file diff --git a/docs/category-overview-pages/monitor-your-infrastructure.md b/docs/category-overview-pages/monitor-your-infrastructure.md new file mode 100644 index 00000000..3582e88a --- /dev/null +++ b/docs/category-overview-pages/monitor-your-infrastructure.md @@ -0,0 +1,3 @@ +# Monitor your Infrastructure Overview + +This section contains documentation on how you can use Netdata Cloud and it's features to monitor your entire infrastructure.
\ No newline at end of file diff --git a/docs/category-overview-pages/netdata-apis.md b/docs/category-overview-pages/netdata-apis.md new file mode 100644 index 00000000..82d1c175 --- /dev/null +++ b/docs/category-overview-pages/netdata-apis.md @@ -0,0 +1,5 @@ +# Netdata APIs Overview + +This section contains information about Netdata's APIs. + +You can access the Netdata Agent's API through swagger UI [here](/api).
\ No newline at end of file diff --git a/docs/category-overview-pages/netdata-architecture.md b/docs/category-overview-pages/netdata-architecture.md new file mode 100644 index 00000000..70f12659 --- /dev/null +++ b/docs/category-overview-pages/netdata-architecture.md @@ -0,0 +1,3 @@ +# Netdata Architecture Overview + +This section's purpose is to explain the architecture of Netdata, the role of the Agent and the Cloud, and more.
\ No newline at end of file diff --git a/docs/category-overview-pages/netdata-dashboards-and-visualizations.md b/docs/category-overview-pages/netdata-dashboards-and-visualizations.md new file mode 100644 index 00000000..cc930436 --- /dev/null +++ b/docs/category-overview-pages/netdata-dashboards-and-visualizations.md @@ -0,0 +1,3 @@ +# Netdata Dashboards and Visualizations Overview + +This section provides documentation about all the visualization operations, features and insights that Netdata provides.
\ No newline at end of file diff --git a/docs/category-overview-pages/optimizing-metrics-database.md b/docs/category-overview-pages/optimizing-metrics-database.md new file mode 100644 index 00000000..fdbd3b69 --- /dev/null +++ b/docs/category-overview-pages/optimizing-metrics-database.md @@ -0,0 +1,3 @@ +# Optimizing Metrics Database Overview + +This section contains documentation to help you understand how the metrics DB works, understand the key features and configure them to suit your needs.
\ No newline at end of file diff --git a/docs/cloud/alerts-notifications/add-discord-notification.md b/docs/cloud/alerts-notifications/add-discord-notification.md index d1769f0e..3edf5002 100644 --- a/docs/cloud/alerts-notifications/add-discord-notification.md +++ b/docs/cloud/alerts-notifications/add-discord-notification.md @@ -8,7 +8,7 @@ To enable Discord notifications you need: - A Netdata Cloud account - Access to the space as an **administrator** -- Have a Discord server able to receive webhook integrations. For mode details check [how to configure this on Discord](#settings-on-discord) +- Have a Discord server able to receive webhook integrations. For more details check [how to configure this on Discord](#settings-on-discord) ## Steps diff --git a/docs/cloud/alerts-notifications/add-mattermost-notification-configuration.md b/docs/cloud/alerts-notifications/add-mattermost-notification-configuration.md new file mode 100644 index 00000000..79bc9861 --- /dev/null +++ b/docs/cloud/alerts-notifications/add-mattermost-notification-configuration.md @@ -0,0 +1,51 @@ +# Add Mattermost notification configuration + +From the Cloud interface, you can manage your space's notification settings and from these you can add a specific configuration to get notifications delivered on Mattermost. + +## Prerequisites + +To add Mattermost notification configurations you need: + +- A Netdata Cloud account +- Access to the space as an **administrator** +- Space needs to be on **Business** plan or higher +- Have a Mattermost app on your workspace to receive the webhooks, for more details check [how to configure this on Mattermost](#settings-on-mattermost) + +## Steps + +1. Click on the **Space settings** cog (located above your profile icon) +1. Click on the **Notification** tab +1. Click on the **+ Add configuration** button (near the top-right corner of your screen) +1. On the **Mattermost** card click on **+ Add** +1. A modal will be presented to you to enter the required details to enable the configuration: + 1. **Notification settings** are Netdata specific settings + - Configuration name - you can optionally provide a name for your configuration you can easily refer to it + - Rooms - by specifying a list of Rooms you are select to which nodes or areas of your infrastructure you want to be notified using this configuration + - Notification - you specify which notifications you want to be notified using this configuration: All Alerts and unreachable, All Alerts, Critical only + 1. **Integration configuration** are the specific notification integration required settings, which vary by notification method. For Mattermost: + - Webhook URL - URL provided on Mattermost for the channel you want to receive your notifications. For more details check [how to configure this on Mattermost](#settings-on-mattermost) + +## Settings on Mattermost + +To enable the webhook integrations on Mattermost you need: +1. In Mattermost, go to Product menu > Integrations > Incoming Webhook. + +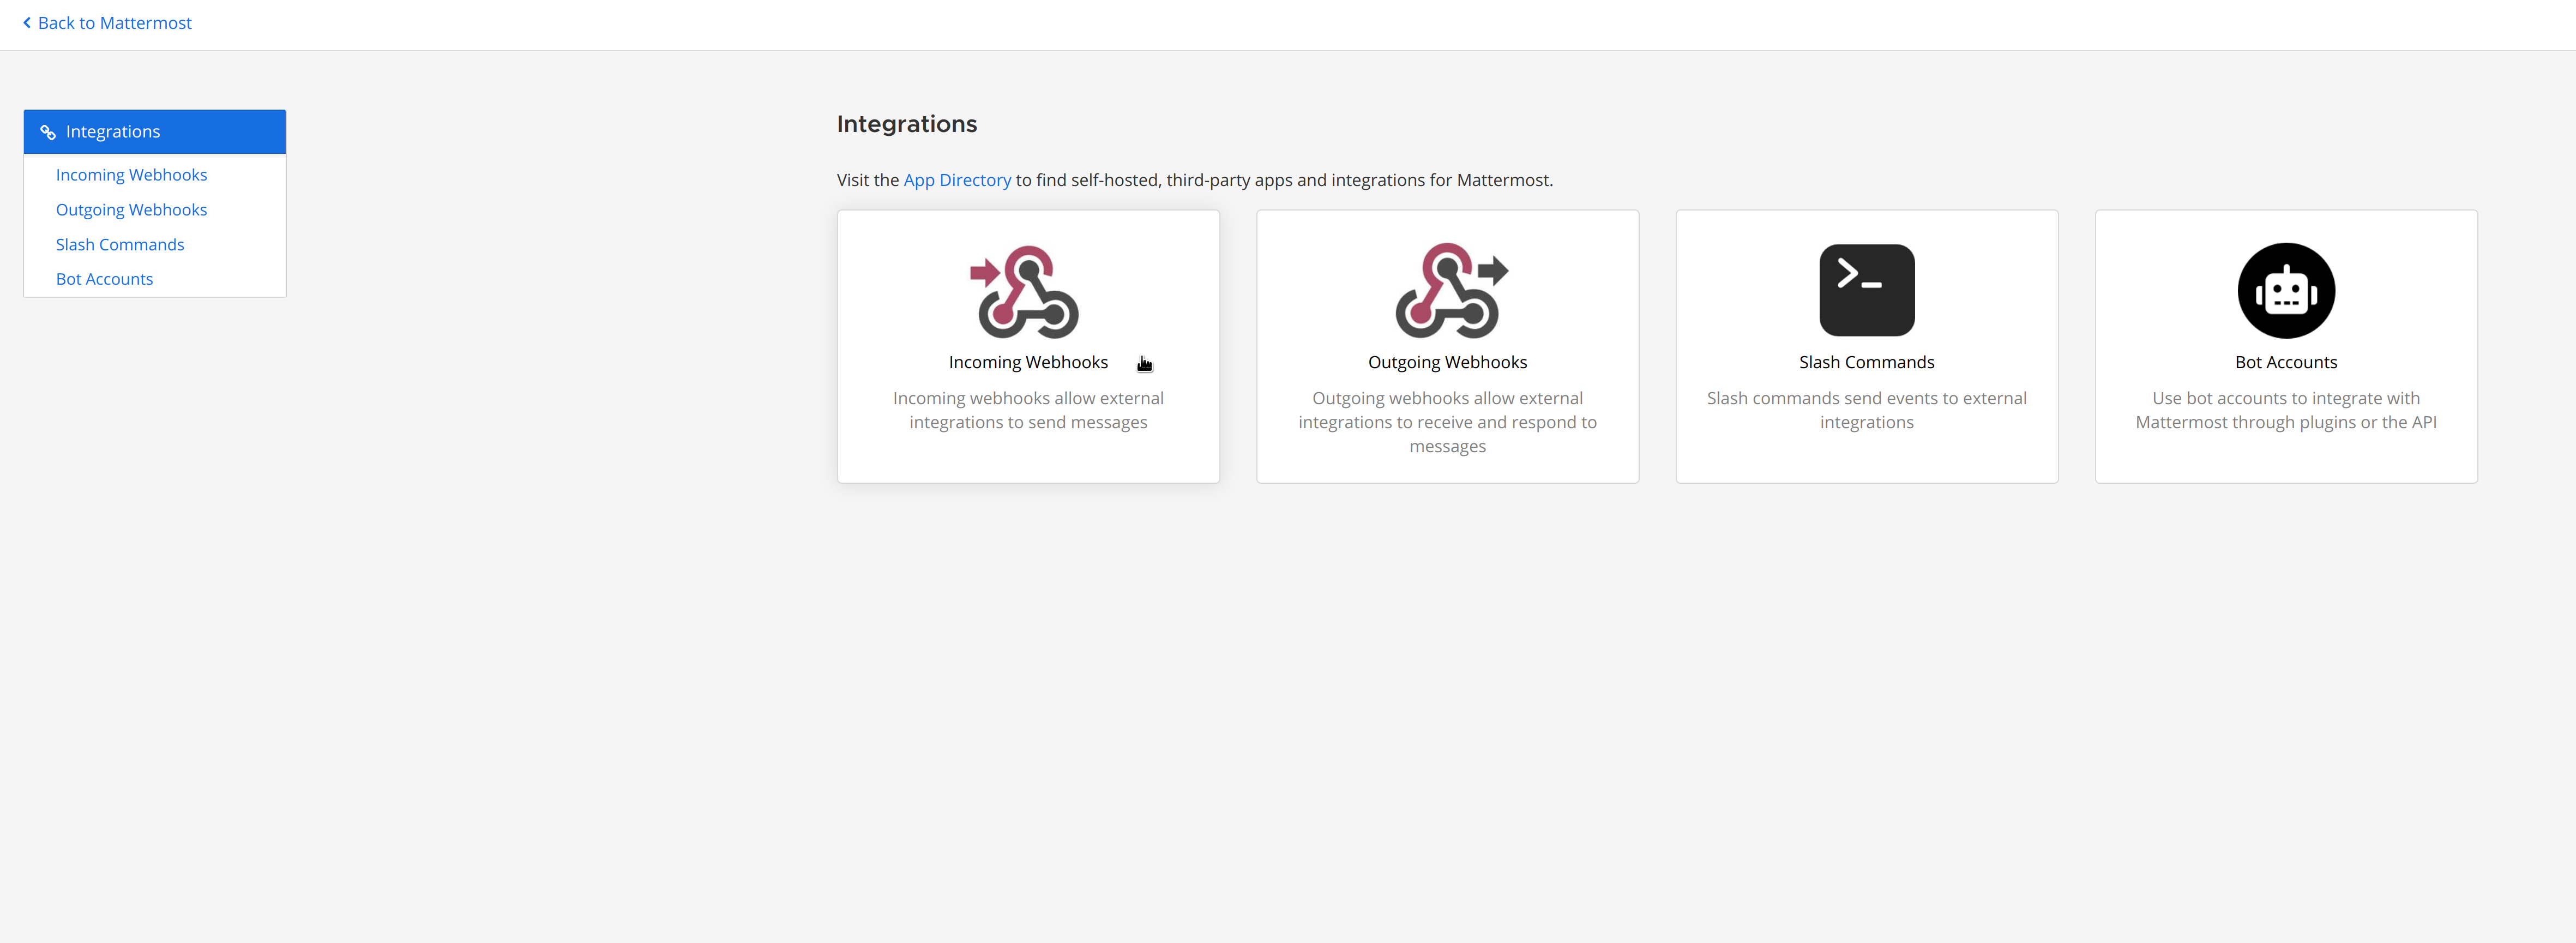 + + - If you don’t have the Integrations option, incoming webhooks may not be enabled on your Mattermost server or may be disabled for non-admins. They can be enabled by a System Admin from System Console > Integrations > Integration Management. Once incoming webhooks are enabled, continue with the steps below + +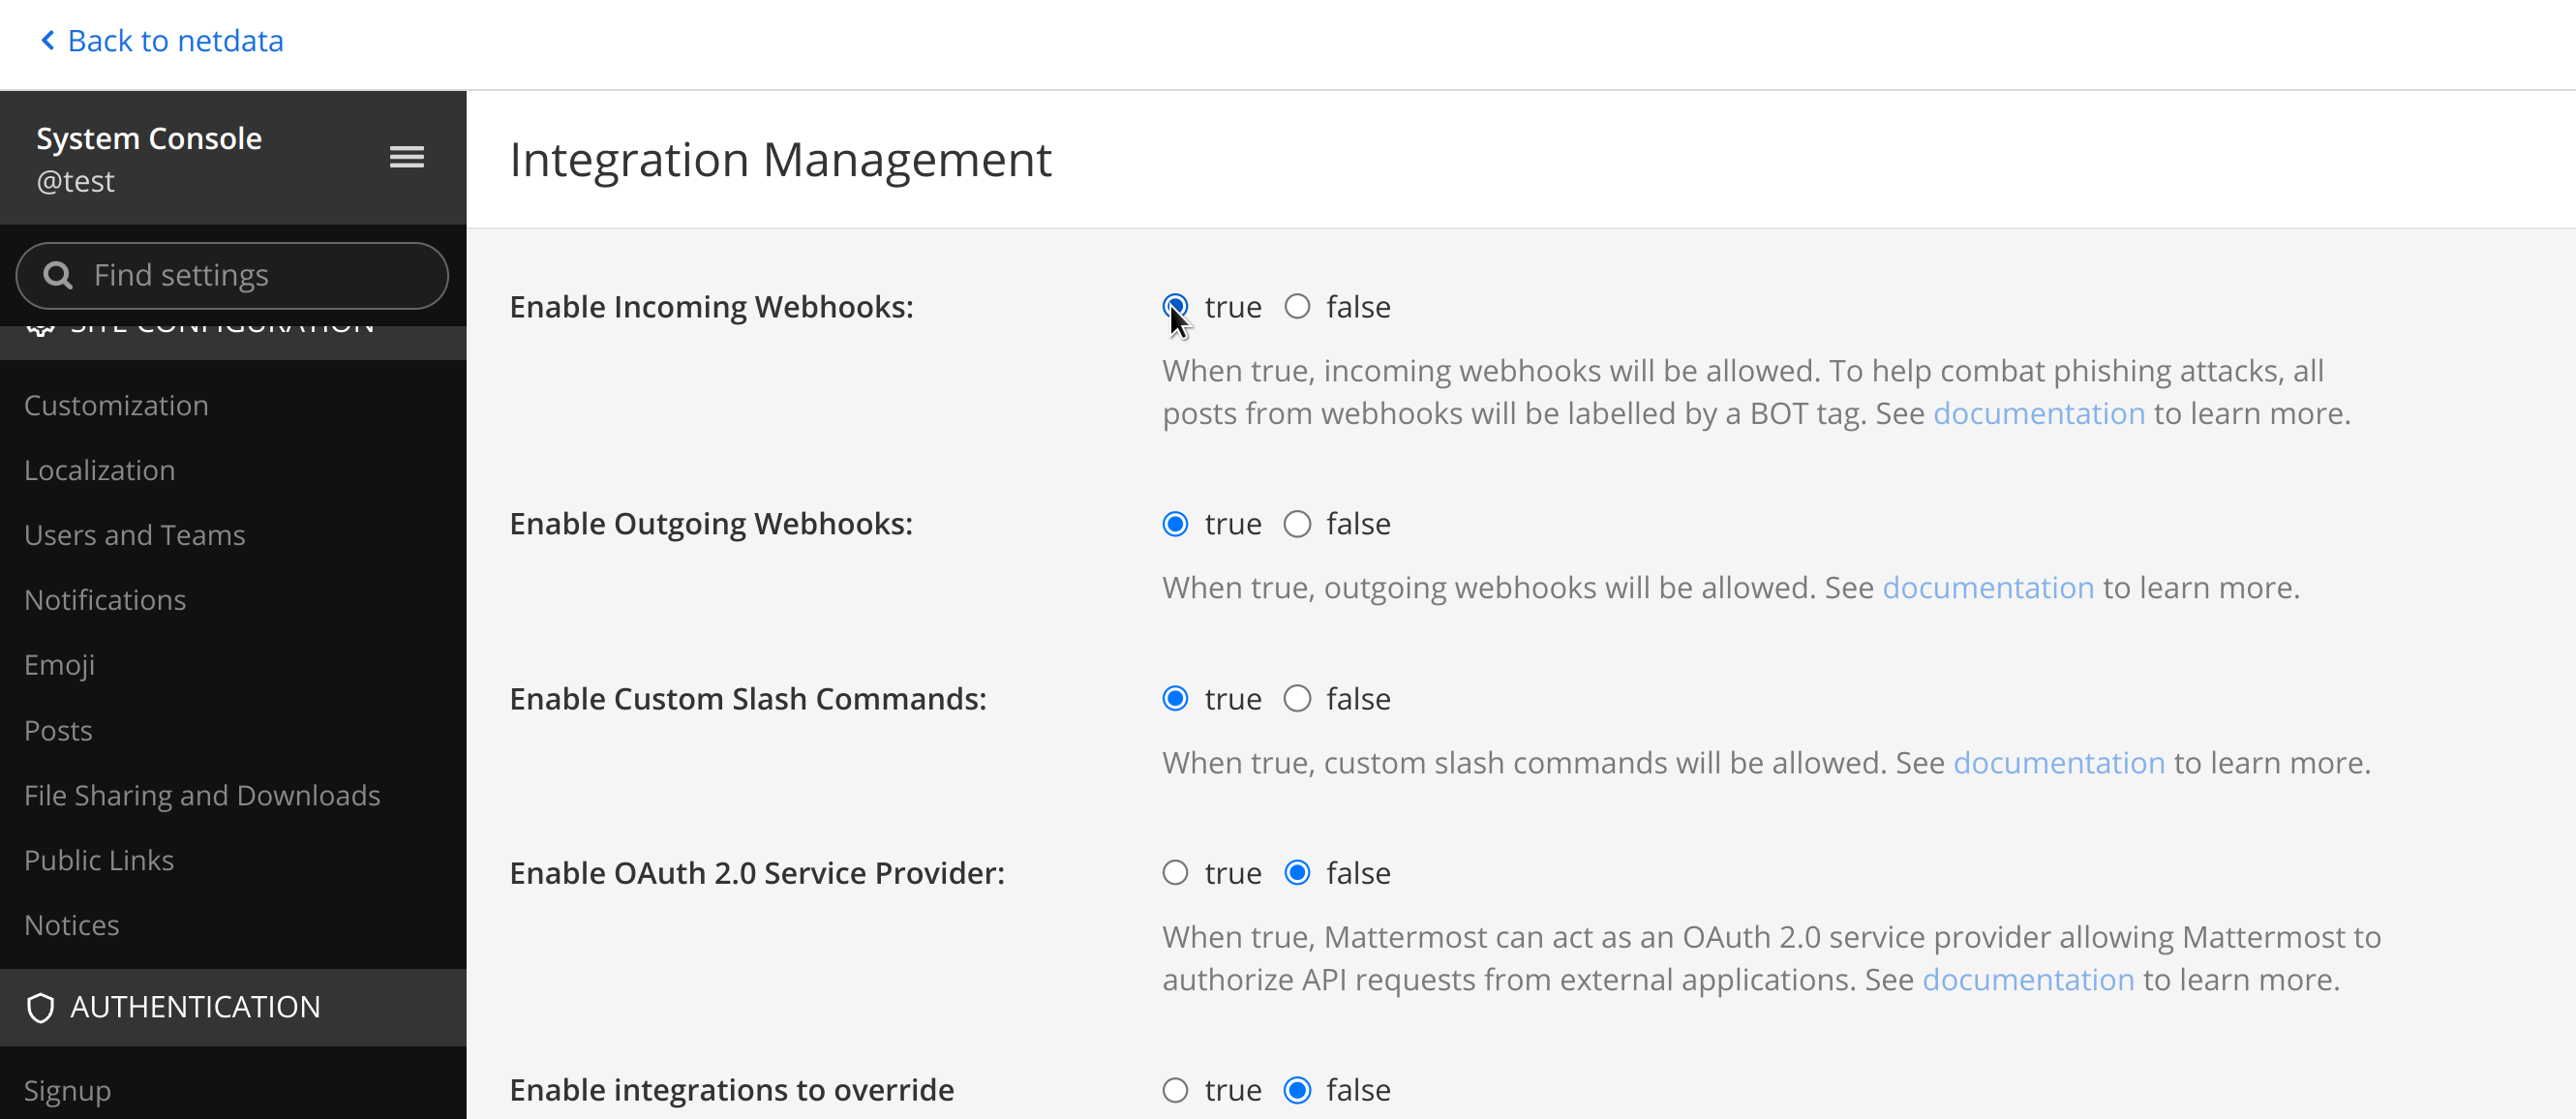 + +2. Select Add Incoming Webhook and add a name and description for the webhook. The description can be up to 500 characters + +3. Select the channel to receive webhook payloads, then select Add to create the webhook + +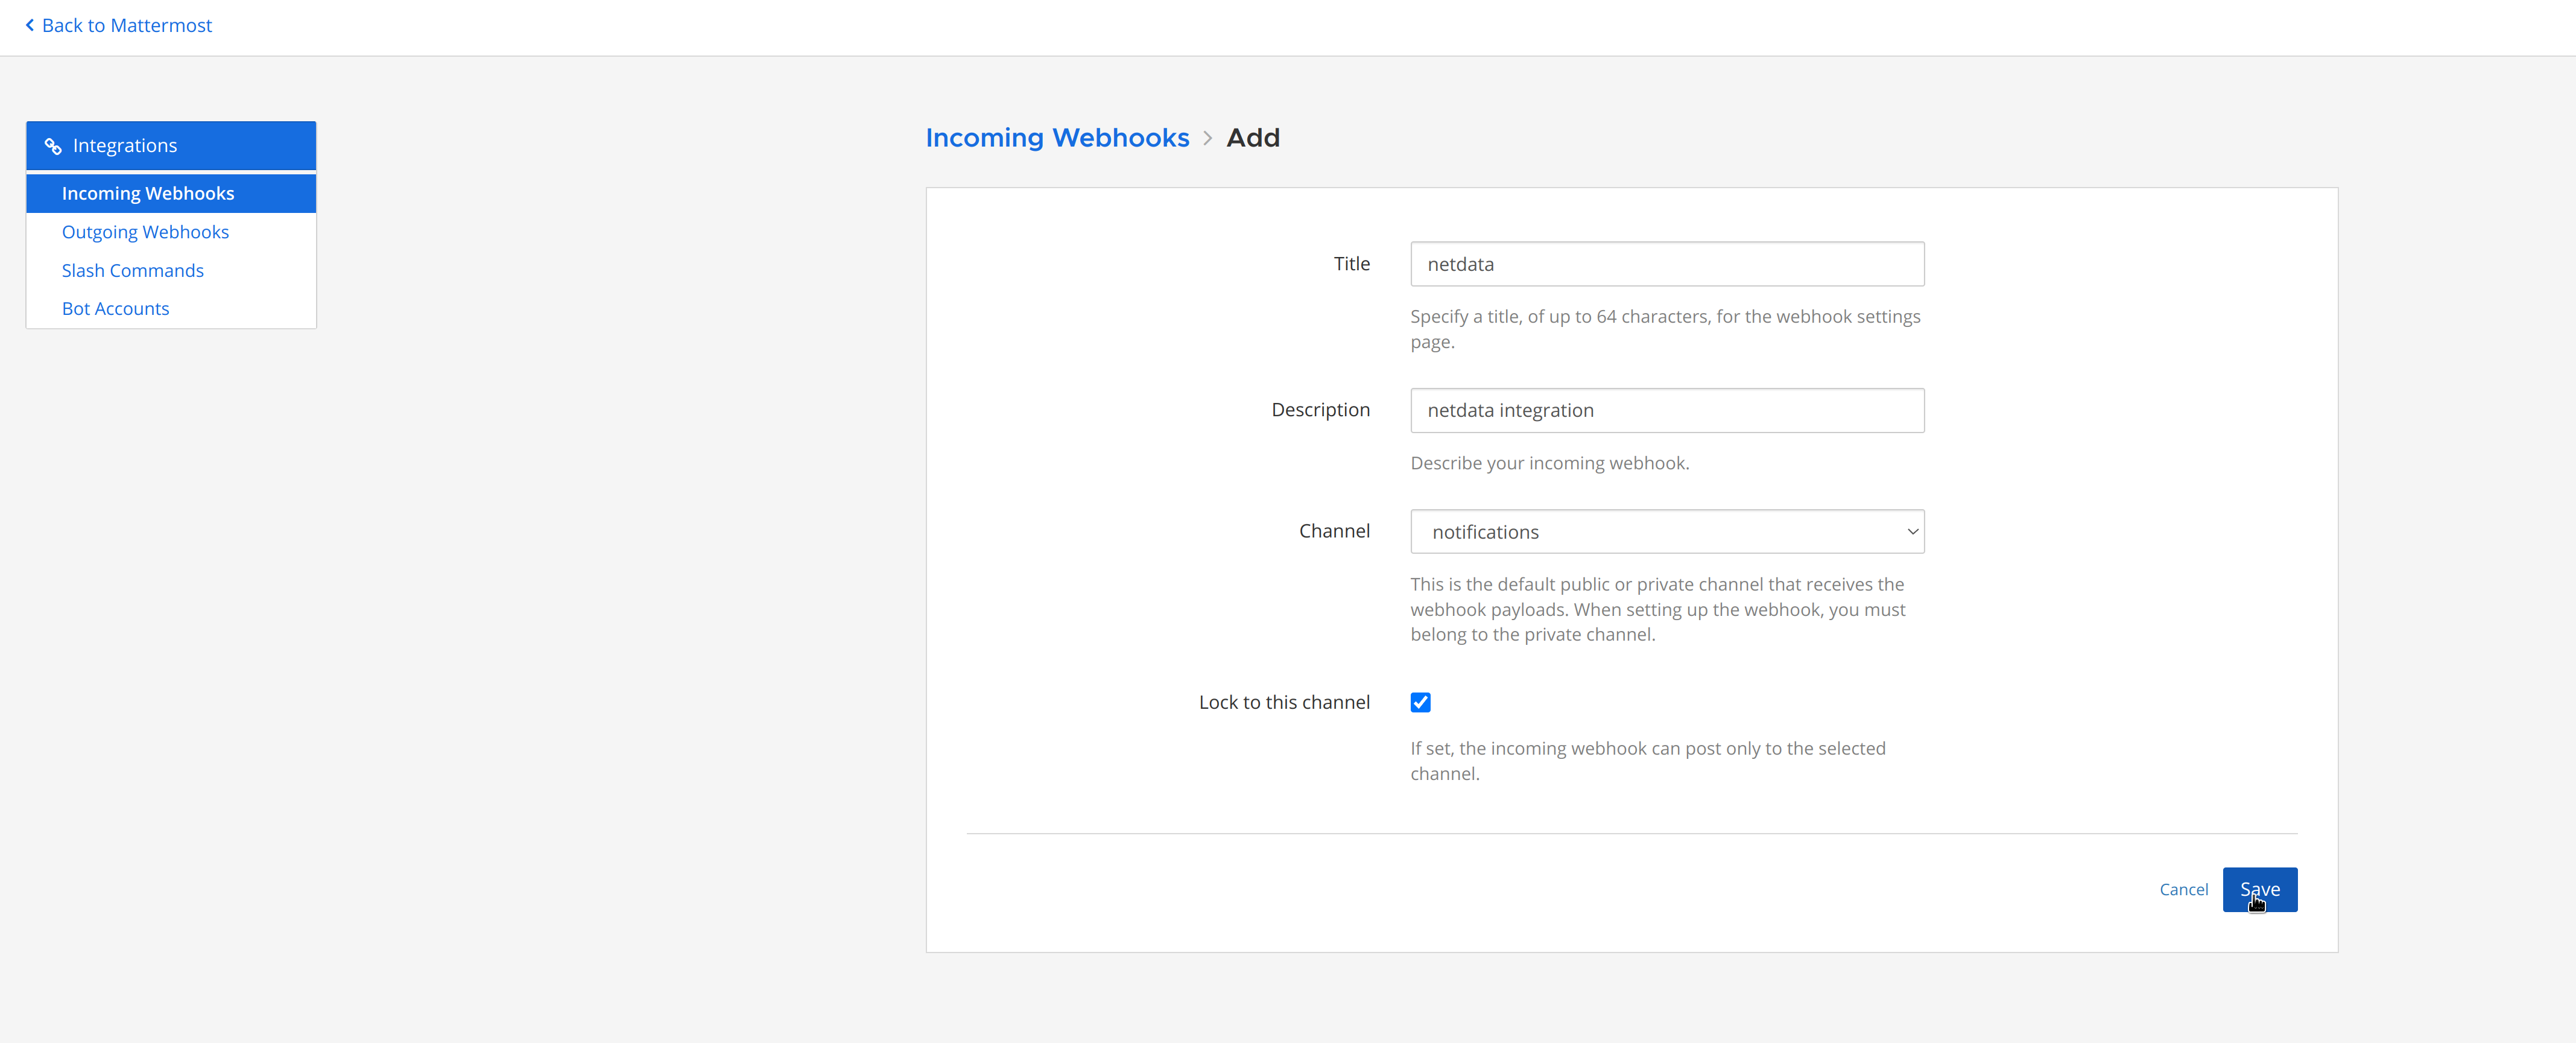 + +4. You will end up with a webhook endpoint that looks like so: +``` +https://your-mattermost-server.com/hooks/xxx-generatedkey-xxx +``` + - Treat this endpoint as a secret. Anyone who has it will be able to post messages to your Mattermost instance. + +For more details please check Mattermost's article [Incoming webhooks for Mattermost](https://developers.mattermost.com/integrate/webhooks/incoming/). diff --git a/docs/cloud/alerts-notifications/add-opsgenie-notification-configuration.md b/docs/cloud/alerts-notifications/add-opsgenie-notification-configuration.md index 28e526c9..0a80311e 100644 --- a/docs/cloud/alerts-notifications/add-opsgenie-notification-configuration.md +++ b/docs/cloud/alerts-notifications/add-opsgenie-notification-configuration.md @@ -4,7 +4,7 @@ From the Cloud interface, you can manage your space's notification settings and ## Prerequisites -To add Opsgenie notification configurations you need +To add Opsgenie notification configurations you need: - A Netdata Cloud account - Access to the space as an **administrator** @@ -34,4 +34,4 @@ To enable the Netdata integration on Opsgenie you need: 1. Pick **API** from available integrations. Copy your API Key and press **Save Integration**. -1. Paste copied API key into the corresponding field in **Integration configuration** section of Opsgenie modal window in Netdata.
\ No newline at end of file +1. Paste copied API key into the corresponding field in **Integration configuration** section of Opsgenie modal window in Netdata. diff --git a/docs/cloud/alerts-notifications/add-pagerduty-notification-configuration.md b/docs/cloud/alerts-notifications/add-pagerduty-notification-configuration.md index 64880ebe..eec4f94c 100644 --- a/docs/cloud/alerts-notifications/add-pagerduty-notification-configuration.md +++ b/docs/cloud/alerts-notifications/add-pagerduty-notification-configuration.md @@ -4,12 +4,12 @@ From the Cloud interface, you can manage your space's notification settings and ## Prerequisites -To add PagerDuty notification configurations you need +To add PagerDuty notification configurations you need: - A Cloud account - Access to the space as and **administrator** - Space needs to be on **Business** plan or higher -- Have a PagerDuty service to receive events, for mode details check [how to configure this on PagerDuty](#settings-on-pagerduty) +- Have a PagerDuty service to receive events, for more details check [how to configure this on PagerDuty](#settings-on-pagerduty) ## Steps diff --git a/docs/cloud/alerts-notifications/add-slack-notification-configuration.md b/docs/cloud/alerts-notifications/add-slack-notification-configuration.md index 99bb2d5b..ed845b4d 100644 --- a/docs/cloud/alerts-notifications/add-slack-notification-configuration.md +++ b/docs/cloud/alerts-notifications/add-slack-notification-configuration.md @@ -4,12 +4,12 @@ From the Cloud interface, you can manage your space's notification settings and ## Prerequisites -To add discord notification configurations you need +To add slack notification configurations you need: - A Netdata Cloud account - Access to the space as an **administrator** - Space needs to be on **Business** plan or higher -- Have a Slack app on your workspace to receive the webhooks, for mode details check [how to configure this on Slack](#settings-on-slack) +- Have a Slack app on your workspace to receive the webhooks, for more details check [how to configure this on Slack](#settings-on-slack) ## Steps @@ -34,7 +34,7 @@ To enable the webhook integrations on Slack you need: - On your app go to **Incoming Webhooks** and click on **activate incoming webhooks** 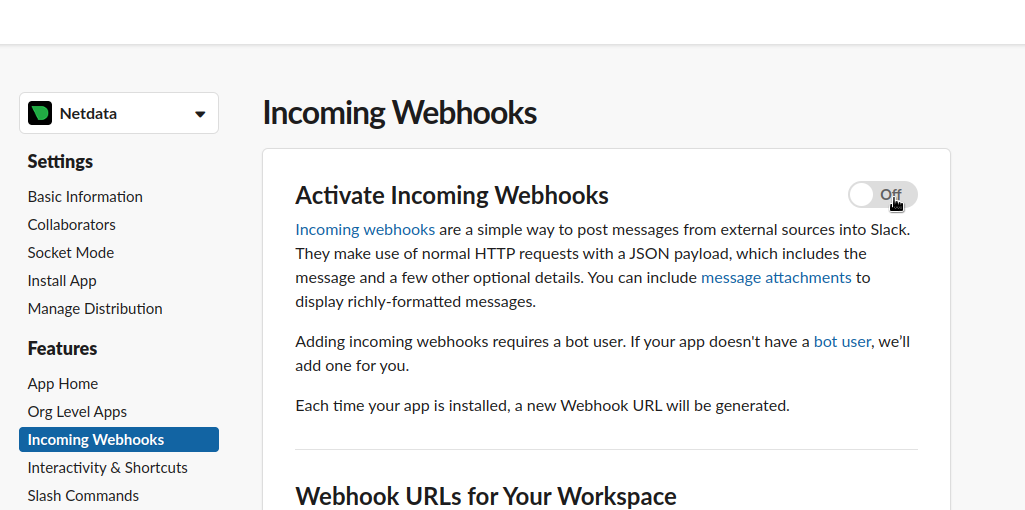 - + - At the bottom of **Webhook URLs for Your Workspace** section you have **Add New Webhook to Workspace** - After pressing that specify the channel where you want your notifications to be delivered diff --git a/docs/cloud/alerts-notifications/add-webhook-notification-configuration.md b/docs/cloud/alerts-notifications/add-webhook-notification-configuration.md index 0140c30f..21d1b6ed 100644 --- a/docs/cloud/alerts-notifications/add-webhook-notification-configuration.md +++ b/docs/cloud/alerts-notifications/add-webhook-notification-configuration.md @@ -4,12 +4,12 @@ From the Cloud interface, you can manage your space's notification settings and ## Prerequisites -To add discord notification configurations you need +To add webhook notification configurations you need: - A Netdata Cloud account - Access to the space as an **administrator** - Space needs to be on **Pro** plan or higher -- Have an app that allows you to receive webhooks following a predefined schema, for mode details check [how to create the webhook service](#webhook-service) +- Have an app that allows you to receive webhooks following a predefined schema, for more details check [how to create the webhook service](#webhook-service) ## Steps @@ -24,8 +24,8 @@ To add discord notification configurations you need - Notification - you specify which notifications you want to be notified using this configuration: All Alerts and unreachable, All Alerts, Critical only 1. **Integration configuration** are the specific notification integration required settings, which vary by notification method. For webhook: - Webhook URL - webhook URL is the url of the service that Netdata will send notifications to. In order to keep the communication secured, we only accept HTTPS urls. Check [how to create the webhook service](#webhook-service). - - Extra headers - these are optional key-value pairs that you can set to be included in the HTTP requests sent to the webhook URL. For mode details check [Extra headers](#extra-headers) - - Authentication Mechanism - Netdata webhook integration supports 3 different authentication mechanisms. For mode details check [Authentication mechanisms](#authentication-mechanisms): + - Extra headers - these are optional key-value pairs that you can set to be included in the HTTP requests sent to the webhook URL. For more details check [Extra headers](#extra-headers) + - Authentication Mechanism - Netdata webhook integration supports 3 different authentication mechanisms. For more details check [Authentication mechanisms](#authentication-mechanisms): - Mutual TLS (recommended) - default authentication mechanism used if no other method is selected. - Basic - the client sends a request with an Authorization header that includes a base64-encoded string in the format **username:password**. These will settings will be required inputs. - Bearer - the client sends a request with an Authorization header that includes a **bearer token**. This setting will be a required input. @@ -134,7 +134,7 @@ nsjoQAm6OwpTN5362vE9SYu1twz7KdzBlUkDhePEOgQkWfLHBJWwB+PvB1j/cUA3 ```bash server { listen 443 ssl default_server; - + # ... existing SSL configuration for server authentication ... ssl_verify_client on; ssl_client_certificate /path/to/Netdata_CA.pem; diff --git a/docs/cloud/alerts-notifications/manage-alert-notification-silencing-rules.md b/docs/cloud/alerts-notifications/manage-alert-notification-silencing-rules.md new file mode 100644 index 00000000..b9806c6f --- /dev/null +++ b/docs/cloud/alerts-notifications/manage-alert-notification-silencing-rules.md @@ -0,0 +1,58 @@ +# Manage alert notification silencing rules + +From the Cloud interface, you can manage your space's alert notification silencing rules settings as well as allow users to define their personal ones. + +## Prerequisites + +To manage **space's alert notification silencing rule settings**, you will need the following: + +- A Netdata Cloud account +- Access to the space as an **administrator** or **manager** (**troubleshooters** can only view space rules) + + +To manage your **personal alert notification silencing rule settings**, you will need the following: + +- A Netdata Cloud account +- Access to the space with any roles except **billing** + +### Steps + +1. Click on the **Space settings** cog (located above your profile icon) +1. Click on the **Alert & Notification** tab on the left hand-side +1. Click on the **Notification Silencing Rules** tab +1. You will be presented with a table of the configured alert notification silencing rules for: + * the space (if aren't an **observer**) + * yourself + + You will be able to: + 1. **Add a new** alert notification silencing rule configuration. + - Choose if it applies to **All users** or **Myself** (All users is only available for **administrators** and **managers**) + - You need to provide a name for the configuration so you can easily refer to it + - Define criteria for Nodes: To which Rooms will this apply? What Nodes? Does it apply to host labels key-value pairs? + - Define criteria for Alerts: Which alert name is being targeted? What alert context? Will it apply to a specific alert role? + - Define when it will be applied: + - Immediately, from now till until it is turned off or until a specific duration (start and end date automatically set) + - Scheduled, you specify the start and end time for when the rule becomes active and then inactive (time is set according to your browser local timezone) + Note: You are only able to add a rule if your space is on a [paid plan](https://github.com/netdata/netdata/edit/master/docs/cloud/manage/plans.md). + 1. **Edit an existing** alert notification silencing rule configurations. You will be able to change: + - The name provided for it + - Who it applies to + - Selection criteria for Nodes and Alert + - When it will be applied + 1. **Enable/Disable** a given alert notification silencing rule configuration. + - Use the toggle to enable or disable + 1. **Delete an existing** alert notification silencing rule. + - Use the trash icon to delete your configuration + +## Silencing rules examples + +| Rule name | War Rooms | Nodes | Host Label | Alert name | Alert context | Alert role | Description | +| :-- | :-- | :-- | :-- | :-- | :-- | :-- | :--| +| Space silencing | All Rooms | * | * | * | * | * | This rule silences the entire space, targets all nodes and for all users. E.g. infrastructure wide maintenance window. | +| DB Servers Rooms | PostgreSQL Servers | * | * | * | * | * | This rules silences the nodes in the room named PostgreSQL Servers, for example it doesn't silence the `All Nodes` room. E.g. My team with membership to this room doesn't want to receive notifications for these nodes. | +| Node child1 | All Rooms | `child1` | * | * | * | * | This rule silences all alert state transitions for node `child1` on all rooms and for all users. E.g. node could be going under maintenance. | +| Production nodes | All Rooms | * | `environment:production` | * | * | * | This rule silences all alert state transitions for nodes with the host label key-value pair `environment:production`. E.g. Maintenance window on nodes with specific host labels. | +| Third party maintenance | All Rooms | * | * | `httpcheck_posthog_netdata_cloud.request_status` | * | * | This rule silences this specific alert since third party partner will be undergoing maintenance. | +| Intended stress usage on CPU | All Rooms | * | * | * | `system.cpu` | * | This rule silences specific alerts across all nodes and their CPU cores. | +| Silence role webmaster | All Rooms | * | * | * | * | `webmaster` | This rule silences all alerts configured with the role `webmaster`. | +| Silence alert on node | All Rooms | `child1` | * | `httpcheck_posthog_netdata_cloud.request_status` | * | * | This rule silences the specific alert on the `child1` node. | diff --git a/docs/cloud/alerts-notifications/manage-notification-methods.md b/docs/cloud/alerts-notifications/manage-notification-methods.md index 17c7f879..f61b6bf6 100644 --- a/docs/cloud/alerts-notifications/manage-notification-methods.md +++ b/docs/cloud/alerts-notifications/manage-notification-methods.md @@ -27,7 +27,8 @@ Notes: ### Steps 1. Click on the **Space settings** cog (located above your profile icon) -1. Click on the **Notification** tab +1. Click on the **Alerts & Notification** tab on the left hand-side +1. Click on the **Notification Methods** tab 1. You will be presented with a table of the configured notification methods for the space. You will be able to: 1. **Add a new** notification method configuration. - Choose the service from the list of the available ones, you'll may see a list of unavailable options if your plan doesn't allow some of them (you will see on the @@ -42,7 +43,7 @@ Notes: - Service specific inputs 1. **Enable/Disable** a given notification method configuration. - Use the toggle to enable or disable the notification method configuration - 1. **Delete an existing** notification method configuartion. Netdata provided ones can't be deleted, e.g. Email + 1. **Delete an existing** notification method configuration. Netdata provided ones can't be deleted, e.g. Email - Use the trash icon to delete your configuration ## Manage user notification settings diff --git a/docs/cloud/alerts-notifications/notifications.md b/docs/cloud/alerts-notifications/notifications.md index 94cd2dc3..ad115d43 100644 --- a/docs/cloud/alerts-notifications/notifications.md +++ b/docs/cloud/alerts-notifications/notifications.md @@ -31,7 +31,7 @@ or add new alert that you see in Netdata Cloud, and receive via centralized aler </Callout> -### Alert notifications +## Alert notifications Netdata Cloud can send centralized alert notifications to your team whenever a node enters a warning, critical, or unreachable state. By enabling notifications, you ensure no alert, on any node in your infrastructure, goes unnoticed by you or your team. @@ -51,9 +51,9 @@ All users in a Space can personalize their notifications settings, for Personal > ⚠️ Netdata Cloud supports different notification methods and their availability will depend on the plan you are at. > For more details check [Service classification](#service-classification) or [netdata.cloud/pricing](https://www.netdata.cloud/pricing). -#### Service level +### Service level -##### Personal +#### Personal The notifications methods classified as **Personal** are what we consider generic, meaning that these can't have specific rules for them set by the administrators. @@ -63,7 +63,7 @@ manage what specific configurations they want for the Space / Room(s) and the de One example of such a notification method is the E-mail. -##### System +#### System For **System** notification methods, the destination of the channel will be a target that usually isn't specific to a single user, e.g. slack channel. @@ -72,23 +72,49 @@ different targets depending on Rooms or Notification level settings. Some examples of such notification methods are: Webhook, PagerDuty, Slack. -#### Service classification +### Service classification -##### Community +#### Community Notification methods classified as Community can be used by everyone independent on the plan your space is at. These are: Email and discord -##### Pro +#### Pro Notification methods classified as Pro are only available for **Pro** and **Business** plans These are: webhook -##### Business +#### Business Notification methods classified as Business are only available for **Business** plans These are: PagerDuty, Slack, Opsgenie +## Silencing Alert notifications + +Netdata Cloud provides you a Silencing Rule engine which allows you to mute alert notifications. This muting action is specific to alert state transition notifications, it doesn't include node unreachable state transitions. + +The Silencing Rule engine is flexible and allows you to enter silence rules for the two main entities involved on alert notifications and can be set using different attributes. The main entities you can enter are **Nodes** and **Alerts** which can be used in combination or isolation to target specific needs - see some examples [here](https://github.com/netdata/netdata/blob/master/docs/cloud/alerts-notifications/manage-alert-notification-silencing-rules.md#silencing-rules-examples). + +### Scope definition for Nodes +* **Space:** silencing the space, selecting `All Rooms`, silences all alert state transitions from any node claimed to the space. +* **War Room:** silencing a specific room will silence all alert state transitions from any node in that room. Please note if the node belongs to +another room which isn't silenced it can trigger alert notifications to the users with membership to that other room. +* **Node:** silencing a specific node can be done for the entire space, selecting `All Rooms`, or for specific war room(s). The main difference is +if the node should be silenced for the entire space or just for specific rooms (when specific rooms are selected only users with membership to that room won't receive notifications). + +### Scope definition for Alerts +* **Alert name:** silencing a specific alert name silences all alert state transitions for that specific alert. +* **Alert context:** silencing a specific alert context will silence all alert state transitions for alerts targeting that chart context, for more details check [alert configuration docs](https://github.com/netdata/netdata/blob/master/health/REFERENCE.md#alarm-line-on). +* **Alert role:** silencing a specific alert role will silence all the alert state transitions for alerts that are configured to be specific role recipients, for more details check [alert configuration docs](https://github.com/netdata/netdata/blob/master/health/REFERENCE.md#alarm-line-to). + +Beside the above two main entities there are another two important settings that you can define on a silencing rule: +* Who does the rule affect? **All user** in the space or **Myself** +* When does is to apply? **Immediately** or on a **Schedule** (when setting immediately you can set duration) + +For further help on setting alert notification silencing rules go to [Manage Alert Notification Silencing Rules](https://github.com/netdata/netdata/blob/master/docs/cloud/alerts-notifications/manage-alert-notification-silencing-rules.md). + +> ⚠️ This feature is only available for [Netdata paid plans](https://github.com/netdata/netdata/edit/master/docs/cloud/manage/plans.md). + ## Flood protection If a node has too many state changes like firing too many alerts or going from reachable to unreachable, Netdata Cloud diff --git a/docs/cloud/insights/events-feed.md b/docs/cloud/insights/events-feed.md index 0e297ba8..a56877ab 100644 --- a/docs/cloud/insights/events-feed.md +++ b/docs/cloud/insights/events-feed.md @@ -21,10 +21,30 @@ At a high-level view, these are the domains from which the Events feed will prov | **Domains of events** | **Community** | **Pro** | **Business** | | :-- | :-- | :-- | :-- | -| **Auditing events** - COMING SOON<br/>Events related to actions done on your Space, e.g. invite user, change user role or change plan.| 4 hours | 7 days | 90 days | +| **[Auditing events](#auditing-events)** - <br/>Events related to actions done on your Space, e.g. invite user, change user role or change plan.| 4 hours | 7 days | 90 days | | **[Topology events](#topology-events)**<br/>Node state transition events, e.g. live or offline.| 4 hours | 7 days | 14 days | | **[Alert events](#alert-events)**<br/>Alert state transition events, can be seen as an alert history log.| 4 hours | 7 days | 90 days | +### Auditing events + +| **Event name** | **Description** | **Example** | +| :-- | :-- | :-- | +| Space Created | The space was created.| Space `Acme Space` was **created** | +| Room Created | A room was created on the Space.| Room `DB Servers` was **created** by `John Doe` | +| Room Deleted | A room was deleted from the Space. | Room `DB servers` was **deleted** by `John Doe` | +| User Invited to Space | A user was invited to join the Space.| User `John Smith` was **invited** to this space by `Alan Doe` | +| User Uninvited from Space | An invitation for a user to join the space was revoked.| User `John Smith` was **uninvited** from this space | +| User Added to Space | A user was added to the Space from an invitation (user accepted the invitation).| User `John Smith` was **added** to this space by invite of `Alan Doe` | +| User Removed from Space | A user was added to the Space from an invitation. | User `John Smith` was **removed** from this space by `Alan Doe` | +| User Added to Room | A user was added to a room on the Space. | User `John Smith` was **added** to room `DB servers` | +| User Removed from Room | A user was removed from a room on the Space. | User `John Smith` was **removed** from room `DB Servers` by `Alan Doe` | +| User Space Properties Changed | The properties of a user on the Space have changed, e.g. change user role | User role for `John Smith` was **changed** to `troubleshooter` by `Alan Doe` | +| Node Added To Room | The node was added to a room on the Space. | Node `ip-xyz.ec2.internal` was **added** to room `DB Servers` by `John Doe` | +| Node Removed To Room | The node was removed from a room on the Space. | Node `ip-xyz.ec2.internal` was **removed** from room `DB Servers` by `John Doe` | +| Silencing Rule Created | A new alert notification silencing rule was created on the Space. | Silencing rule `DB Servers schedule silencing` on rooms `All nodes` and `DB Servers` was **created** by `John Smith` | +| Silencing Rule Changed | An existing alert notification silencing rule was modified on the Space. | Silencing rule `DB Servers schedule silencing` on rooms `All nodes` and `DB Servers` was **changed** by `John Doe` | +| Silencing Rule Deleted | An existing alert notifications silencing rule was removed from the Space. | Silencing rule `DB Servers schedule silencing` on rooms `All nodes` and `DB Servers` was **changed** by `Alan Smith` | + ### Topology events | **Event name** | **Description** | **Example** | diff --git a/docs/cloud/manage/plans.md b/docs/cloud/manage/plans.md index 9180ab5a..23077f89 100644 --- a/docs/cloud/manage/plans.md +++ b/docs/cloud/manage/plans.md @@ -19,7 +19,7 @@ The plan is an attribute that is directly attached to your space(s) and that dic Netdata Cloud plans, with the exception of Community, work as subscriptions and overall consist of two pricing components: -* A flat fee component, that is a price per space, and +* A flat fee component, that is applied on yearly subscriptions for the [comitted-nodes](#committed-nodes) charte (space subscription fee has been waived off) * An on-demand metered component, that is related to your usage of Netdata which directly links to the [number of nodes you have running](#running-nodes-and-billing) Netdata provides two billing frequency options: @@ -55,16 +55,13 @@ If, for a given month, your usage is over these committed nodes we will charge t It is ok to change your mind. We allow to change your plan, billing frequency or adjust the committed nodes, on yearly plans, at any time. -To achieve this you will need to: +To achieve this you can check the [Update plan](https://github.com/netdata/netdata/blob/master/docs/cloud/manage/view-plan-billing.md#update-plan) section. -* Move to the Community plan, where we will cancel the current subscription and: - * Issue a credit to you for the unused period, in case you are on a **yearly plan** - * Charge you only for the current used period and issue a credit for the unused period related to the flat fee, in case you are on a **monthly plan** -* Select the new subscription with the change that you want - -> ⚠️ On a move to Community (cancellation of an active subscription), please note that you will have all your notification methods configurations active **for a period of 24 hours**. +> ⚠️ On a downgrade (going to a new plan with less benefits) or cancellation of an active subscription, please note that you will have all your notification methods configurations active **for a period of 24 hours**. > After that, any notification methods unavailable in your new plan at that time will be automatically disabled. You can always re-enable them once you move to a paid plan that includes them. +> ⚠️ Downgrade or cancellation may affect users in your Space. Please check what roles are available on the [each plans](https://github.com/netdata/netdata/blob/master/docs/cloud/manage/plans.md#areas-impacted-by-plans). Users with unavailable roles on the new plan will immediately have restricted access to the Space. + > ⚠️ Any credit given to you will be available to use on future paid subscriptions with us. It will be available until the the **end of the following year**. ### Areas impacted by plans @@ -104,7 +101,13 @@ The plan on your space will determine what type of notifications methods will be * **Pro** - Email, Discord and webhook * **Business** - Unlimited, this includes Slack, PagerDuty, Opsgenie etc. -For mode details check the documentation under [Alert Notifications](https://github.com/netdata/netdata/blob/master/docs/cloud/alerts-notifications/notifications.md). +For more details check the documentation under [Alert Notifications](https://github.com/netdata/netdata/blob/master/docs/cloud/alerts-notifications/notifications.md#alert-notifications). + +##### Alert notification silencing rules + +The plan on your space will determine if you are able to add alert notification silencing rules since this feature will only be available for paid plans: **Pro** or **Business**. + +For more details check the documentation under [Alert Notifications](https://github.com/netdata/netdata/blob/master/docs/cloud/alerts-notifications/notifications.md#silencing-alert-notifications). ### Related Topics diff --git a/docs/cloud/manage/role-based-access.md b/docs/cloud/manage/role-based-access.md index 1696e096..a0b38774 100644 --- a/docs/cloud/manage/role-based-access.md +++ b/docs/cloud/manage/role-based-access.md @@ -84,6 +84,13 @@ In more detail, you can find on the following tables which functionalities are a | Edit configuration | :heavy_check_mark: | - | - | - | - | - | Some exceptions apply depending on [service level](https://github.com/netdata/netdata/blob/master/docs/cloud/alerts-notifications/manage-notification-methods.md#available-actions-per-notification-methods-based-on-service-level) | | Delete configuration | :heavy_check_mark: | - | - | - | - | - | | | Edit personal level notification settings | :heavy_check_mark: | :heavy_check_mark: | :heavy_check_mark: | :heavy_check_mark: | :heavy_check_mark: | :heavy_check_mark: | [Manage user notification settings](https://github.com/netdata/netdata/blob/master/docs/cloud/alerts-notifications/manage-notification-methods.md#manage-user-notification-settings) | +| See space alert notification silencing rules | :heavy_check_mark: | :heavy_check_mark: | :heavy_check_mark: | - | - | - | | +| Add new space alert notification silencing rule | :heavy_check_mark: | :heavy_check_mark: | - | - | - | - | | +| Enable/Disable space alert notification silencing rule | :heavy_check_mark: | :heavy_check_mark: | - | - | - | - | | +| Edit space alert notification silencing rule | :heavy_check_mark: | :heavy_check_mark: | - | - | - | - | | +| Delete space alert notification silencing rule | :heavy_check_mark: | :heavy_check_mark: | - | - | - | - | | +| See, add, edit or delete personal level alert notification silencing rule | :heavy_check_mark: | :heavy_check_mark: | :heavy_check_mark: | :heavy_check_mark: | - | - | | + Notes: * Enable, Edit and Add actions over specific notification methods will only be allowed if your plan has access to those ([service classification](https://github.com/netdata/netdata/blob/master/docs/cloud/alerts-notifications/notifications.md#service-classification)) diff --git a/docs/cloud/manage/view-plan-billing.md b/docs/cloud/manage/view-plan-billing.md index d29f93f9..5d381f95 100644 --- a/docs/cloud/manage/view-plan-billing.md +++ b/docs/cloud/manage/view-plan-billing.md @@ -13,11 +13,13 @@ To see your plan and billing setting you need: ## Steps +### View current plan and Billing options and Invoices + 1. Click on the **Space settings** cog (located above your profile icon) 1. Click on the **Plan & Billing** tab 1. On this page you will be presented with information on your current plan, billing settings, and usage information: 1. At the top of the page you will see: - - **Credit** amount which refers to any amount you have available to use on future invoices or subscription changes (<https://github.com/netdata/netdata/blob/master/docs/cloud/manage/plans.md#plan-changes-and-credit-balance>) - this is displayed once you have had an active paid subscription with us + - **Credit** amount which refers to any amount you have available to use on future invoices or subscription changes ([Plan changes and credit balance](https://github.com/netdata/netdata/blob/master/docs/cloud/manage/plans.md#plan-changes-and-credit-balance)) - this is displayed once you have had an active paid subscription with us - **Billing email** the email that was specified to be linked to tha plan subscription. This is where invoices, payment, and subscription-related notifications will be sent. - **Billing options and Invoices** is the link to our billing provider Customer Portal where you will be able to: - See the current subscription. There will always be 2 subscriptions active for the two pricing components mentioned on [Netdata Plans documentation page](https://github.com/netdata/netdata/blob/master/docs/cloud/manage/plans.md#plans) @@ -31,19 +33,51 @@ To see your plan and billing setting you need: - View your invoice history 1. At the middle, you'll see details on your current plan as well as means to: - Upgrade or cancel your plan - - View full plan details page + - View **All Plans** details page 1. At the bottom, you will find your Usage chart that displays: - Daily count - The weighted 90th percentile of the live node count during the day, taking time as the weight. If you have 30 live nodes throughout the day except for a two hour peak of 44 live nodes, the daily value is 31. - Period count: The 90th percentile of the daily counts for this period up to the date. The last value for the period is used as the number of nodes for the bill for that period. See more details in [running nodes and billing](https://github.com/netdata/netdata/blob/master/docs/cloud/manage/plans.md#running-nodes-and-billing) (only applicable if you are on a paid plan subscription) - Committed nodes: The number of nodes committed to in the yearly plan. In case the period count is higher than the number of committed nodes, the difference is billed as overage. -> ⚠️ At the moment, any changes to an active paid plan, upgrades, change billing frequency or committed nodes, will be a manual two-setup flow: -> -> 1. cancel your current subscription - move you to the Community plan -> 2. chose the plan with the intended changes -> -> This is a temporary process that we aim to sort out soon so that it will effortless for you to do any of these actions. + +### Update plan + +1. Click on the **Space settings** cog (located above your profile icon) +1. Click on the **Plan & Billing** tab +1. On this page you will be presented with information on your current plan, billing settings, and usage information + 1. Depending on your plan there could be shortcuts to immediately take you to change, for example, the billing frequency to **Yearly** + 1. Most actions will be available under the **Change plan** link that take you to the **All plans** details page where you can + 1. Downgrade or upgrade your plan + 1. Change the billing frequency + 1. Change committed nodes, in case you are on a Yearly plan + 1. Once you chose an action to update your plan a modal will pop-up on the right with + 1. Billing frequency displayed on the top right-corner + 1. Committed Nodes, when applicable + 1. Current billing information: + - Billing email + - Default payment method + - Business name and VAT number, when these are applicable + - Billing Address + Note: Any changes to these need to done through our billing provider Customer Portal prior to confirm the checkout. You can click on the link **Change billing info and payment method** to access it. + 1. Promotion code, so you can review any applied promotion or enter one you may have + 1. Detailed view on Node and Space charges + 1. Breakdown of: + - Subscription Total + - Discount from promotion codes, if applicable + - credit value for Unused time from current plan, if applicable + - Credit amount used from balance, if applicable + - Total Before Tax + - VAT rate and amount, if applicable + 1. Summary of: + - Total payable amount + - credit adjustment value for any Remaining Unused time from current plan, if applicable + - Final credit balance + +Notes: +* Since there is an active plan you won't be redirected to our billing provider, the checkout if performed as soon as you click on **Checkout** +* The change to your plan will be applied as soon as the checkout process is completed successfully +* Downgrade or cancellations may have impacts on some of notification method settings or user accesses to your space, for more details please check [Plan changes and credit balance](https://github.com/netdata/netdata/blob/master/docs/cloud/manage/plans.md#plan-changes-and-credit-balance) ## FAQ @@ -81,6 +115,8 @@ Every time you purchase or renew a Plan, two separate Invoices are generated: - One Invoice includes the recurring fees of the Plan you have chosen + We have waived off the space subscription free ($0.00), so the only recurring fee will be on annual plans for the committed nodes. + - The other Invoice includes your monthly “On Demand - Usage”. Right after the activation of your subscription, you will receive a zero value Invoice since you had no usage when you subscribed. @@ -90,3 +126,16 @@ Every time you purchase or renew a Plan, two separate Invoices are generated: You can find some further details on the [Netdata Plans page](https://github.com/netdata/netdata/blob/master/docs/cloud/manage/plans.md#plans). > ⚠️ We expect this to change to a single invoice in the future, but currently do not have a concrete timeline for when this change will happen. + +### 8. How is the **Total Before Tax** value calculated on plan changes? + +When you change your plan we will be calculating the residual before tax value you have from the _Unused time on your current plan_ in order to credit you with this value. + +After that, we will be performing the following calculations: + +1. Get the **Subscription total** (total amount to be paid for Nodes and Space) +2. Deduct any Discount applicable from promotion codes +3. If an amount remains, then we deduct the sum of the _Unused time on current plan_ then and the Credit amount from any existing credit balance. +4. The result, if positive, is the Total Before Tax, if applicable, any sales tax (VAT or other) will apply. + +If the calculation of step 3 returns a negative amount then this amount will be your new customer credit balance. diff --git a/docs/cloud/visualize/interact-new-charts.md b/docs/cloud/visualize/interact-new-charts.md index 4c6c2ebf..3707e945 100644 --- a/docs/cloud/visualize/interact-new-charts.md +++ b/docs/cloud/visualize/interact-new-charts.md @@ -8,129 +8,136 @@ To make sense of all the metrics, Netdata offers an enhanced version of charts t These charts provide a lot of useful information, so that you can: - Enjoy the high-resolution, granular metrics collected by Netdata -- Explore visualization with more options such as _line_, _stacked_ and _area_ types (other types like _bar_, _pie_ and - _gauges_ are to be added shortly) - Examine all the metrics by hovering over them with your cursor -- Use intuitive tooling and shortcuts to pan, zoom or highlight your charts -- On highlight, ease access - to [Metric Correlations](https://github.com/netdata/netdata/blob/master/docs/cloud/insights/metric-correlations.md) to - see other metrics with similar patterns +- Filter the metrics in any way you want using the [Definition bar](#definition-bar) +- View the combined anomaly rate of all underlying data with the [Anomaly Rate ribbon](#anomaly-rate-ribbon) +- Explore even more details about a chart's metrics through [hovering over certain elements of it](#hover-over-the-chart) +- Use intuitive tooling and shortcuts to pan, zoom or highlight areas of interest in your charts +- On highlight, get easy access to [Metric Correlations](https://github.com/netdata/netdata/blob/master/docs/cloud/insights/metric-correlations.md) to see other metrics with similar patterns - Have the dimensions sorted based on name or value - View information about the chart, its plugin, context, and type -- Get the chart status and possible errors. On top, reload functionality +- View individual metric collection status about a chart -These charts are available on Netdata Cloud's +These charts are available on Netdata Cloud's [Overview tab](https://github.com/netdata/netdata/blob/master/docs/cloud/visualize/overview.md), Single Node tab and on your [Custom Dashboards](https://github.com/netdata/netdata/blob/master/docs/cloud/visualize/dashboards.md). -Some of the features listed below are also available on the simpler charts that are available on each agent's user interface. - ## Overview -Have a look at the can see the overall look and feel of the charts for both with a composite chart from -the [Overview tab](https://github.com/netdata/netdata/blob/master/docs/cloud/visualize/overview.md) and a simple chart -from the Single Node tab: +A Netdata chart looks like this: -<img width="678" alt="image" src="https://user-images.githubusercontent.com/43294513/220913360-f3f2ac06-b715-4e99-a933-f3bcb776636f.png"/> +<img src="https://user-images.githubusercontent.com/70198089/236133212-353c102f-a6ed-45b7-9251-34e004c7a10a.png" width="900"/> With a quick glance you have immediate information available at your disposal: -- Chart title and units -- Definition bar -- Action bars -- Chart area -- Legend with dimensions +- [Chart title and units](#title-bar) +- [Anomaly Rate ribbon](#anomaly-rate-ribbon) +- [Definition bar](#definition-bar) +- [Tool bar](#tool-bar) +- [Chart area](#hover-over-the-chart) +- [Legend with dimensions](#dimensions-bar) -## Play, Pause and Reset +## Title bar -Your charts are controlled using the available -[Time controls](https://github.com/netdata/netdata/blob/master/docs/dashboard/visualization-date-and-time-controls.md#time-controls). -Besides these, when interacting with the chart you can also activate these controls by: +When you start interacting with a chart, you'll notice valuable information on the top bar: -- Hovering over any chart to temporarily pause it - this momentarily switches time control to Pause, so that you can - hover over a specific timeframe. When moving out of the chart time control will go back to Play (if it was it's - previous state) -- Clicking on the chart to lock it - this enables the Pause option on the time controls, to the current timeframe. This - is if you want to jump to a different chart to look for possible correlations. -- Double clicking to release a previously locked chart - move the time control back to Play +<img src="https://user-images.githubusercontent.com/70198089/236133832-fad45e65-5bd6-4fd1-8d68-33acf69fff5c.png" width="900"/> -| Interaction | Keyboard/mouse | Touchpad/touchscreen | Time control | -|:------------------|:---------------|:---------------------|:----------------------| -| **Pause** a chart | `hover` | `n/a` | Temporarily **Pause** | -| **Stop** a chart | `click` | `tap` | **Pause** | -| **Reset** a chart | `double click` | `n/a` | **Play** | +The elements that you can find on this top bar are: -Note: These interactions are available when the default "Pan" action is used. Other actions are accessible via -the [Exploration action bar](#exploration-action-bar). +- **Netdata icon**: this indicates that data is continuously being updated, this happens if [Time controls](https://github.com/netdata/netdata/blob/master/docs/dashboard/visualization-date-and-time-controls.md#time-controls) are in Play or Force Play mode. +- **Chart title**: on the chart title you can see the title together with the metric being displayed, as well as the unit of measurement. +- **Chart status icon**: possible values are: Loading, Timeout, Error or No data, otherwise this icon is not shown. -## Title and chart action bar +Along with viewing chart type, context and units, on this bar you have access to immediate actions over the chart: -When you start interacting with a chart, you'll notice valuable information on the top bar. You will see information -from the chart title to a chart action bar. +<img src="https://user-images.githubusercontent.com/70198089/236134195-ecb08f79-1355-4bce-8449-e829f4a6b1c0.png" width="200" /> -The elements that you can find on this top bar are: +- **Chart info**: get more information relevant to the chart you are interacting with. +- **Chart type**: change the chart type from **line**, **stacked**, **area**, **stacked bar** and **multi bar**. +- **Enter fullscreen mode**: expand the current chart to the full size of your screen. +- **Add chart to dashboard**: add the chart to an existing custom dashboard or directly create a new one that includes the chart. -- Netdata icon: this indicates that data is continuously being updated, this happens - if [Time controls](https://github.com/netdata/netdata/blob/master/docs/dashboard/visualization-date-and-time-controls.md#time-controls) - are in Play or Force Play mode -- Chart status icon: indicates the status of the chart. Possible values are: Loading, Timeout, Error or No data -- Chart title: on the chart title you can see the title together with the metric being displayed, as well as the unit of - measurement -- Chart action bar: here you'll have access to chart info, change chart types, enables fullscreen mode, and the ability - to add the chart to a custom dashboard +## Definition bar -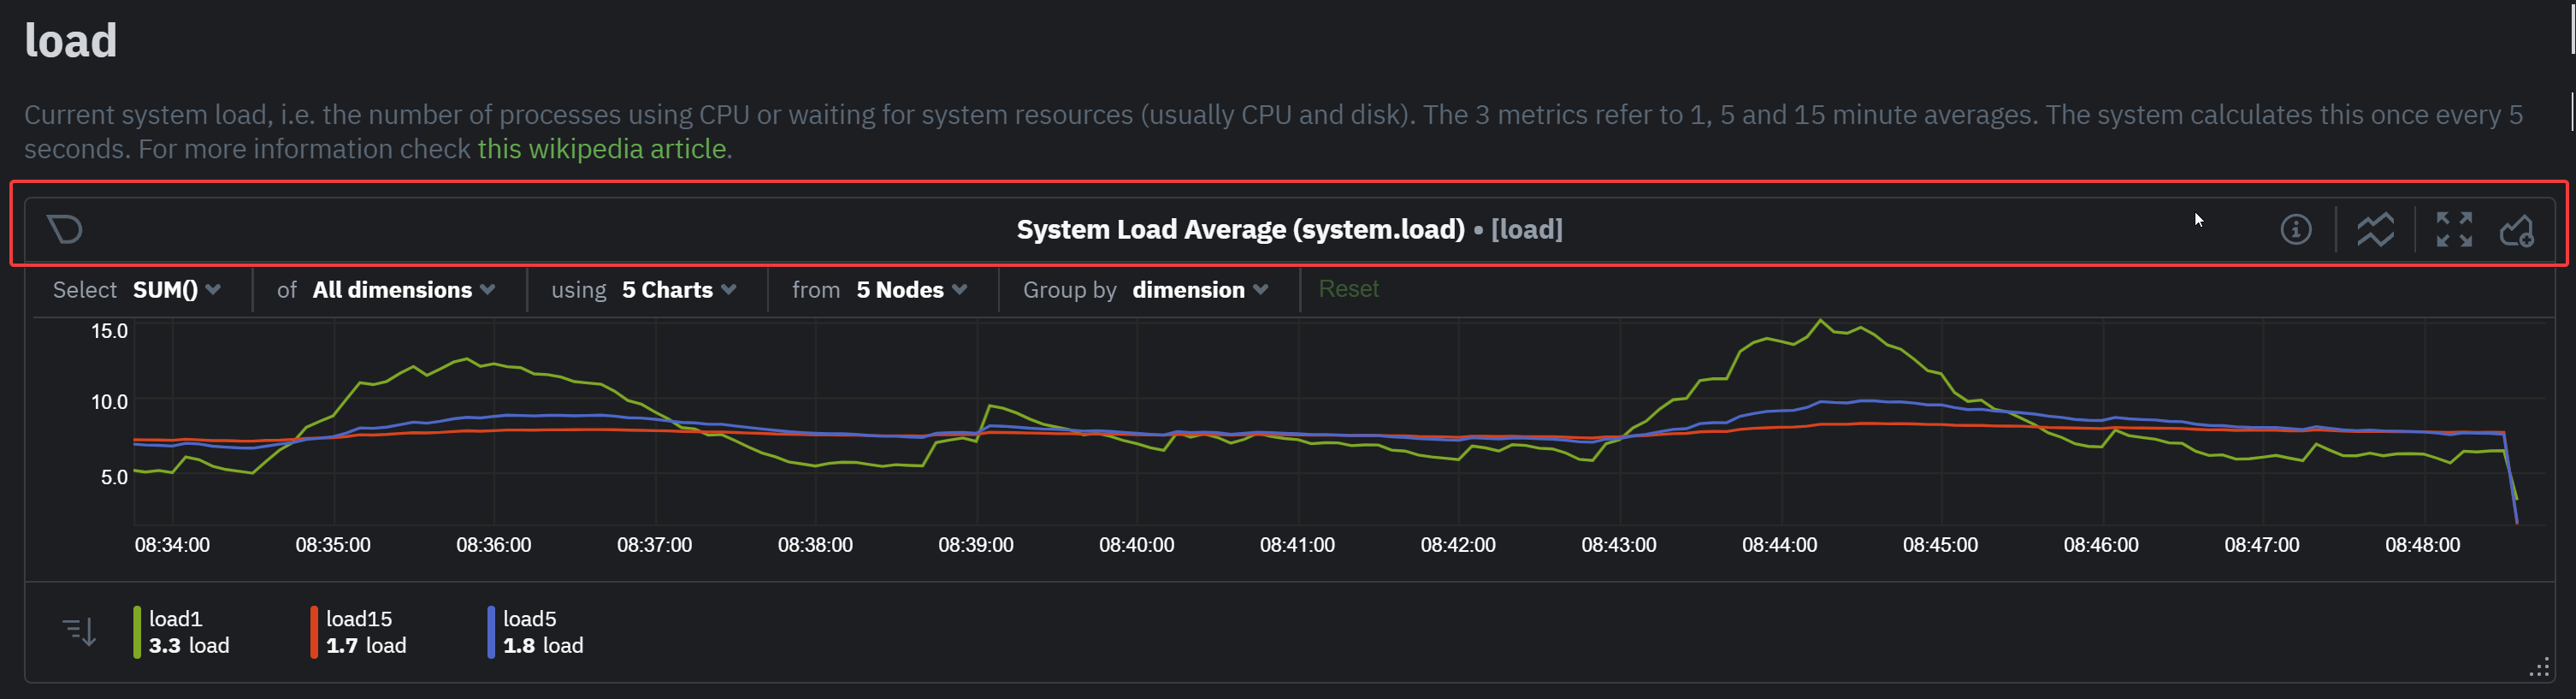 +Each composite chart has a definition bar to provide information and options about the following: +<img src="https://user-images.githubusercontent.com/70198089/236134615-e53a1d68-8a0f-466b-b2ef-1974085f0e8d.png" width="900"/> + +- Group by option +- Aggregate function to be applied in case multiple data sources exist +- Nodes filter +- Instances filter +- Dimensions filter +- Labels filter +- The aggregate function over time to be applied if one point in the chart consists of multiple data points aggregated +- Resetting the Definition bar + +### NIDL framework + +To help users instantly understand and validate the data they see on charts, we developed the NIDL (Nodes, Instances, Dimensions, Labels) framework. This information is visualized on all charts. + + +> You can explore the in-depth infographic, by clicking on this image and opening it in a new tab, +> allowing you to zoom in to the different parts of it. +> +> <a href="https://user-images.githubusercontent.com/2662304/235475061-44628011-3b1f-4c44-9528-34452018eb89.png" target="_blank"> +> <img src="https://user-images.githubusercontent.com/2662304/235475061-44628011-3b1f-4c44-9528-34452018eb89.png" width="400" border="0" align="center"/> +> </a> -## Definition bar -Each composite chart has a definition bar to provide information about the following: +You can rapidly access condensed information for collected metrics, grouped by node, monitored instances, dimension, or any key/value label pair. -* Grouping option -* Aggregate function to be applied in case multiple data sources exist -* Instances -* Nodes -* Dimensions, and -* Aggregate function over time to be applied if one point in the chart consists of multiple data points aggregated +At the Definition bar of each chart, there are a few dropdown menus: -### Group by dimension, node, or chart +<img src="https://user-images.githubusercontent.com/43294513/235470150-62a3b9ac-51ca-4c0d-81de-8804e3d733eb.png" width="900"/> -Click on the **dimension** dropdown to change how a composite chart groups metrics. +These dropdown menus have 2 functions: -The default option is by _dimension_, so that each line/area in the visualization is the aggregation of a single -dimension. -This provides a per dimension view of the data from all the nodes in the War Room, taking into account filtering -criteria if defined. +1. Provide additional information about the visualized chart, to help with understanding the data that is presented. +2. Provide filtering and grouping capabilities, altering the query on the fly, to help get different views of the dataset. -A composite chart grouped by _node_ visualizes a single metric across contributing nodes. If the composite chart has -five -contributing nodes, there will be five lines/areas. This is typically an absolute value of the sum of the dimensions -over each node but there -are some opinionated-but-valuable exceptions where a specific dimension is selected. -Grouping by nodes allows you to quickly understand which nodes in your infrastructure are experiencing anomalous -behavior. +The NIDL framework attaches metadata to every metric that is collected to provide for each of them the following consolidated data for the visible time frame: -A composite chart grouped by _instance_ visualizes each instance of one software or hardware on a node and displays -these as a separate dimension. By grouping the -`disk.io` chart by _instance_, you can visualize the activity of each disk on each node that contributes to the -composite -chart. +1. The volume contribution of each metric into the final query. So even if a query comes from 1000 nodes, the contribution of each node in the result can instantly be visualized. The same goes for instances, dimensions and labels. Especially for labels, Netdata also provides the volume contribution of each label `key:value` pair to the final query, so that you can immediately see how much every label value involved in the query affected the chart. +2. The anomaly rate of each of them for the time-frame of the query. This is used to quickly spot which of the nodes, instances, dimensions or labels have anomalies in the requested time-frame. +3. The minimum, average and maximum values of all the points used for the query. This is used to quickly spot which of the nodes, instances, dimensions or labels are responsible for a spike or a dive in the chart. -Another very pertinent example is composite charts over contexts related to cgroups (VMs and containers). You have the -means to change the default group by or apply filtering to -get a better view into what data your are trying to analyze. For example, if you change the group by to _instance_ you -get a view with the data of all the instances (cgroups) that -contribute to that chart. Then you can use further filtering tools to focus the data that is important to you and even -save the result to your own dashboards. +All of these dropdown menus can be used for instantly filtering the information shown, by including or excluding specific nodes, instances, dimensions or labels. Directly from the dropdown menu, without the need to edit a query string and without any additional knowledge of the underlying data. - +### Group by dropdown -### Aggregate functions over data sources +The "Group by" dropdown menu allows selecting 1 or more groupings to be applied at once on the same dataset. -Each chart uses an opinionated-but-valuable default aggregate function over the data sources. For example, -the `system.cpu` chart shows the -average for each dimension from every contributing chart, while the `net.net` chart shows the sum for each dimension -from every contributing chart, which can also come from multiple networking interfaces. +<img src="https://user-images.githubusercontent.com/43294513/235468819-3af5a1d3-8619-48fb-a8b7-8e8b4cf6a8ff.png" width="900"/> + +It supports: + +1. **Group by Node**, to summarize the data of each node, and provide one dimension on the chart for each of the nodes involved. Filtering nodes is supported at the same time, using the nodes dropdown menu. +2. **Group by Instance**, to summarize the data of each instance and provide one dimension on the chart for each of the instances involved. Filtering instances is supported at the same time, using the instances dropdown menu. +3. **Group by Dimension**, so that each metric in the visualization is the aggregation of a single dimension. This provides a per dimension view of the data from all the nodes in the War Room, taking into account filtering criteria if defined. +4. **Group by Label**, to summarize the data for each label value. Multiple label keys can be selected at the same time. + +Using this menu, you can slice and dice the data in any possible way, to quickly get different views of it, without the need to edit a query string and without any need to better understand the format of the underlying data. + +> ### Tip +> +> A very pertinent example is composite charts over contexts related to cgroups (VMs and containers). +> You have the means to change the default group by or apply filtering to get a better view into what data your are trying to analyze. +> For example, if you change the group by to _instance_ you get a view with the data of all the instances (cgroups) that contribute to that chart. +> Then you can use further filtering tools to focus the data that is important to you and even save the result to your own dashboards. + +> ### Tip +> +> Group by instance, dimension to see the time series of every individual collected metric participating in the chart. + +### Aggregate functions over data sources dropdown + +Each chart uses an opinionated-but-valuable default aggregate function over the data sources. + +<img src="https://user-images.githubusercontent.com/70198089/236136725-778670b4-7e81-44a8-8d3d-f38ded823c94.png" width="500"/> + +For example, the `system.cpu` chart shows the average for each dimension from every contributing chart, while the `net.net` chart shows the sum for each dimension from every contributing chart, which can also come from multiple networking interfaces. The following aggregate functions are available for each selected dimension: @@ -144,105 +151,148 @@ The following aggregate functions are available for each selected dimension: - **Max**: Displays a maximum value. For dimensions with positive values, the max is the value with the largest magnitude. For charts with negative values, the max is the value closet to zero. -### Dimensions - -Select which dimensions to display on the composite chart. You can choose **All dimensions**, a single dimension, or any -number of dimensions available on that context. +### Nodes dropdown -### Instances +In this dropdown, you can view or filter the nodes contributing time-series metrics to the chart. +This menu also provides the contribution of each node to the volume of the chart, and a break down of the anomaly rate of the queried data per node. -Click on **X Instances** to display a dropdown of instances and nodes contributing to that composite chart. Each line in -the dropdown displays an instance name and the associated node's hostname. - -### Nodes - -Click on **X Nodes** to display a dropdown of nodes contributing to that composite chart. Each line displays a hostname -to help you identify which nodes contribute to a chart. You can also use this component to filter nodes directly on the -chart. +<img src="https://user-images.githubusercontent.com/70198089/236137765-b57d5443-3d4b-42f4-9e3d-db1eb606626f.png" width="900"/> If one or more nodes can't contribute to a given chart, the definition bar shows a warning symbol plus the number of affected nodes, then lists them in the dropdown along with the associated error. Nodes might return errors because of networking issues, a stopped `netdata` service, or because that node does not have any metrics for that context. +### Instances dropdown + +In this dropdown, you can view or filter the instances contributing time-series metrics to the chart. +This menu also provides the contribution of each instance to the volume of the chart, and a break down of the anomaly rate of the queried data per instance. + +<img src="https://user-images.githubusercontent.com/70198089/236138302-4dd4072e-3a0d-43bb-a9d8-4dde79c65e92.png" width="900"/> + +### Dimensions dropdown + +In this dropdown, you can view or filter the original dimensions contributing time-series metrics to the chart. +This menu also presents the contribution of each original dimensions on the chart, and a break down of the anomaly rate of the data per dimension. + +<img src="https://user-images.githubusercontent.com/70198089/236138796-08dc6ac6-9a50-4913-a46d-d9bbcedd48f6.png" width="900"/> + + +### Labels dropdown + +In this dropdown, you can view or filter the contributing time-series labels of the chart. +This menu also presents the contribution of each label on the chart,and a break down of the anomaly rate of the data per label. + +<img src="https://user-images.githubusercontent.com/70198089/236139027-8a51a958-2074-4675-a41b-efff30d8f51a.png" width="900"/> + ### Aggregate functions over time When the granularity of the data collected is higher than the plotted points on the chart an aggregation function over -time -is applied. By default the aggregation applied is _average_ but the user can choose different options from the -following: - -* Min -* Max -* Average -* Sum -* Incremental sum (Delta) -* Standard deviation -* Median -* Single exponential smoothing -* Double exponential smoothing -* Coefficient variation -* Trimmed Median `*` -* Trimmed Mean `*` -* Percentile `**` - -> ### Info -> -> - `*` For **Trimmed Median and Mean** you can choose the percentage of data tha you want to focus on: 1%, 2%, 3%, 5%, 10%, 15%, 20% and 25%. -> - `**` For **Percentile** you can specify the percentile you want to focus on: 25th, 50th, 75th, 80th, 90th, 95th, 97th, 98th and 99th. +time is applied. + +<img src="https://user-images.githubusercontent.com/70198089/236411297-e123db06-0117-4e24-a5ac-955b980a8f55.png" width="400"/> + +By default the aggregation applied is _average_ but the user can choose different options from the following: -For more details on each, you can refer to our Agent's HTTP API details -on [Data Queries - Data Grouping](https://github.com/netdata/netdata/blob/master/web/api/queries/README.md#data-grouping). +- Min, Max, Average or Sum +- Percentile + - you can specify the percentile you want to focus on: 25th, 50th, 75th, 80th, 90th, 95th, 97th, 98th and 99th. + <img src="https://user-images.githubusercontent.com/70198089/236410299-de5f3367-f3b0-4beb-a73f-a49007c543d4.png" width="250"/> +- Trimmed Mean or Trimmed Median + - you can choose the percentage of data tha you want to focus on: 1%, 2%, 3%, 5%, 10%, 15%, 20% and 25%. + <img src="https://user-images.githubusercontent.com/70198089/236410858-74b46af9-280a-4ab2-ad26-5a6aa9403aa8.png" width="250"/> +- Median +- Standard deviation +- Coefficient of variation +- Delta +- Single or Double exponential smoothing + +For more details on each, you can refer to our Agent's HTTP API details on [Data Queries - Data Grouping](https://github.com/netdata/netdata/blob/master/web/api/queries/README.md#data-grouping). ### Reset to defaults -Click on the 3-dot icon (**⋮**) on any chart, then **Reset to Defaults**, to reset the definition bar to its initial -state. +Finally, you can reset everything to its defaults by clicking the green "Reset" prompt at the end of the definition bar. + +## Anomaly Rate ribbon + +Netdata's unsupervised machine learning algorithm creates a unique model for each metric collected by your agents, using exclusively the metric's past data. +It then uses these unique models during data collection to predict the value that should be collected and check if the collected value is within the range of acceptable values based on past patterns and behavior. + +If the value collected is an outlier, it is marked as anomalous. + +<img src="https://user-images.githubusercontent.com/70198089/236139886-79d63cf6-61ed-4aa7-842c-b5a1728c870d.png" width="900"/> + +This unmatched capability of real-time predictions as data is collected allows you to **detect anomalies for potentially millions of metrics across your entire infrastructure within a second of occurrence**. + +The Anomaly Rate ribbon on top of each chart visualizes the combined anomaly rate of all the underlying data, highlighting areas of interest that may not be easily visible to the naked eye. + +Hovering over the Anomaly Rate ribbon provides a histogram of the anomaly rates per presented dimension, for the specific point in time. + +Anomaly Rate visualization does not make Netdata slower. Anomaly rate is saved in the the Netdata database, together with metric values, and due to the smart design of Netdata, it does not even incur a disk footprint penalty. -## Jump to single-node dashboards +## Hover over the chart -Click on **X Charts**/**X Nodes** to display one of the two dropdowns that list the charts and nodes contributing to a -given composite chart. For example, the nodes dropdown. +Hovering over any point in the chart will reveal a more informative overlay. +It includes a bar indicating the volume percentage of each time series compared to the total, the anomaly rate, and a notification on if there are data collection issues. -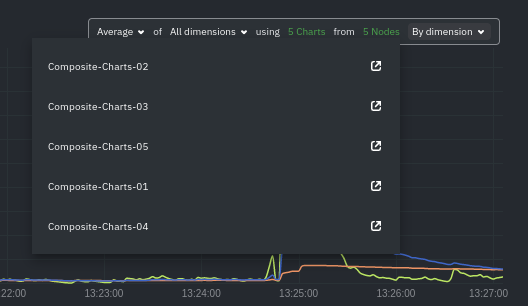 +This overlay sorts all dimensions by value, makes bold the closest dimension to the mouse and presents a histogram based on the values of the dimensions. -To jump to a single-node dashboard, click on the link icon -<img class="img__inline img__inline--link" src="https://user-images.githubusercontent.com/1153921/95762109-1d219300-0c62-11eb-8daa-9ba509a8e71c.png" /> next to the -node you're interested in. +<img src="https://user-images.githubusercontent.com/70198089/236141460-bfa66b99-d63c-4a2c-84b1-2509ed94857f.png" width="500"/> -The single-node dashboard opens in a new tab. From there, you can continue to troubleshoot or run -[Metric Correlations](https://github.com/netdata/netdata/blob/master/docs/cloud/insights/metric-correlations.md) for faster root -cause analysis. +When hovering the anomaly ribbon, the overlay sorts all dimensions by anomaly rate, and presents a histogram of these anomaly rates. -## Add composite charts to a dashboard +#### Info column -Click on the 3-dot icon (**⋮**) on any chart, then click on **Add to Dashboard**. Click the **+** button for any -dashboard you'd like to add this composite chart to, or create a new dashboard an initiate it with your chosen chart by -entering the name and clicking **New Dashboard**. +Additionally, when hovering over the chart, the overlay may display an indication in the "Info" column. -## Chart action bar +Currently, this column is used to inform users of any data collection issues that might affect the chart. +Below each chart, there is an information ribbon. This ribbon currently shows 3 states related to the points presented in the chart: -On this bar you have access to immediate actions over the chart, the available actions are: +1. **[P]: Partial Data** + At least one of the dimensions in the chart has partial data, meaning that not all instances available contributed data to this point. This can happen when a container is stopped, or when a node is restarted. This indicator helps to gain confidence of the dataset, in situations when unusual spikes or dives appear due to infrastructure maintenance, or due to failures to part of the infrastructure. -- Chart info: you will be able to get more information relevant to the chart you are interacting with -- Chart type: change the chart type from _line_, _stacked_ or _area_ -- Enter fullscreen mode: allows you expand the current chart to the full size of your screen -- Add chart to dashboard: This allows you to add the chart to an existing custom dashboard or directly create a new one - that includes the chart. +2. **[O]: Overflown** + At least one of the data sources included in the chart has a counter that has overflowed at this point. -<img src="https://user-images.githubusercontent.com/70198089/222689501-4116f5fe-e447-4359-83b5-62dadb33f4ef.png" width="40%" height="40%" /> +3. **[E]: Empty Data** + At least one of the dimensions included in the chart has no data at all for the given points. +All these indicators are also visualized per dimension, in the pop-over that appears when hovering the chart. -## Exploration action bar +<img src="https://user-images.githubusercontent.com/70198089/236145768-8ffadd02-93a4-4e9e-b4ae-c1367f614a7e.png" width="700"/> -When exploring the chart you will see a second action bar. This action bar is there to support you on this task. The -available actions that you can see are: +## Play, Pause and Reset + +Your charts are controlled using the available [Time controls](https://github.com/netdata/netdata/blob/master/docs/dashboard/visualization-date-and-time-controls.md#time-controls). +Besides these, when interacting with the chart you can also activate these controls by: + +- Hovering over any chart to temporarily pause it - this momentarily switches time control to Pause, so that you can + hover over a specific timeframe. When moving out of the chart time control will go back to Play (if it was it's + previous state) +- Clicking on the chart to lock it - this enables the Pause option on the time controls, to the current timeframe. This + is if you want to jump to a different chart to look for possible correlations. +- Double clicking to release a previously locked chart - move the time control back to Play + +| Interaction | Keyboard/mouse | Touchpad/touchscreen | Time control | +|:------------------|:---------------|:---------------------|:----------------------| +| **Pause** a chart | `hover` | `n/a` | Temporarily **Pause** | +| **Stop** a chart | `click` | `tap` | **Pause** | +| **Reset** a chart | `double click` | `n/a` | **Play** | + +Note: These interactions are available when the default "Pan" action is used from the [Tool Bar](#tool-bar). + +## Tool bar + +While exploring the chart, a tool bar will appear. This tool bar is there to support you on this task. +The available manipulation tools you can select are: + +<img src="https://user-images.githubusercontent.com/70198089/236143292-c1d75528-263d-4ddd-9db8-b8d6a31cb83e.png" width="400" /> - Pan - Highlight -- Horizontal and Vertical zooms -- In-context zoom in and out +- Select and zoom +- Chart zoom +- Reset zoom -<img src="https://user-images.githubusercontent.com/70198089/222689556-58ad77bc-924f-4c3f-b38b-fc63de2f5773.png" width="40%" height="40%" /> ### Pan @@ -258,47 +308,45 @@ it like pushing the current timeframe off the screen to see what came before or Selecting timeframes is useful when you see an interesting spike or change in a chart and want to investigate further by: - Looking at the same period of time on other charts/sections -- Running [metric correlations](https://github.com/netdata/netdata/blob/master/docs/cloud/insights/metric-correlations.md) - to filter metrics that also show something different in the selected period, vs the previous one - -<img alt="image" src="https://user-images.githubusercontent.com/43294513/221365853-1142944a-ace5-484a-a108-a205d050c594.png" /> +- Running [metric correlations](https://github.com/netdata/netdata/blob/master/docs/cloud/insights/metric-correlations.md) to filter metrics that also show something different in the selected period, vs the previous one | Interaction | Keyboard/mouse | Touchpad/touchscreen | |:-----------------------------------|:---------------------------------------------------------|:---------------------| | **Highlight** a specific timeframe | `Alt + mouse selection` or `⌘ + mouse selection` (macOS) | `n/a` | -### Zoom +### Select and zoom -Zooming in helps you see metrics with maximum granularity, which is useful when you're trying to diagnose the root cause -of an anomaly or outage. Zooming out lets you see metrics within the larger context, such as the last hour, day, or -week, which is useful in understanding what "normal" looks like, or to identify long-term trends, like a slow creep in -memory usage. +You can zoom to a specific timeframe, either horizontally of vertically, by selecting a timeframe. -The actions above are _normal_ vertical zoom actions. We also provide an horizontal zoom action that helps you focus on -a specific Y-axis area to further investigate a spike or dive on your charts. +| Interaction | Keyboard/mouse | Touchpad/touchscreen | +|:-------------------------------------------|:-------------------------------------|:-----------------------------------------------------| +| **Zoom** to a specific timeframe | `Shift + mouse vertical selection` | `n/a` | +| **Horizontal Zoom** a specific Y-axis area | `Shift + mouse horizontal selection` | `n/a` | - +### Chart zoom +Zooming in helps you see metrics with maximum granularity, which is useful when you're trying to diagnose the root cause +of an anomaly or outage. +Zooming out lets you see metrics within the larger context, such as the last hour, day, or week, which is useful in understanding what "normal" looks like, or to identify long-term trends, like a slow creep in memory usage. | Interaction | Keyboard/mouse | Touchpad/touchscreen | |:-------------------------------------------|:-------------------------------------|:-----------------------------------------------------| | **Zoom** in or out | `Shift + mouse scrollwheel` | `two-finger pinch` <br />`Shift + two-finger scroll` | -| **Zoom** to a specific timeframe | `Shift + mouse vertical selection` | `n/a` | -| **Horizontal Zoom** a specific Y-axis area | `Shift + mouse horizontal selection` | `n/a` | - -You also have two direct action buttons on the exploration action bar for in-context `Zoom in` and `Zoom out`. -## Other interactions +## Dimensions bar ### Order dimensions legend -The bottom legend of the chart where you can see the dimensions of the chart can now be ordered by: +The bottom legend where you can see the dimensions of the chart can be ordered by: + + +<img src="https://user-images.githubusercontent.com/70198089/236144658-6c3d0e31-9bcb-45f3-bb95-4eafdcbb0a58.png" width="300" /> + - Dimension name (Ascending or Descending) - Dimension value (Ascending or Descending) - -<img src="https://user-images.githubusercontent.com/70198089/222689791-48c77890-1093-4beb-84c2-7598353ca049.png" width="50%" height="50%" /> +- Dimension Anomaly Rate (Ascending or Descending) ### Show and hide dimensions @@ -310,10 +358,6 @@ behaving strangely. | **Show one** dimension and hide others | `click` | `tap` | | **Toggle (show/hide)** one dimension | `Shift + click` | `n/a` | -### Resize - -To resize the chart, click-and-drag the icon on the bottom-right corner of any chart. To restore the chart to its -original height, -double-click the same icon. +## Resize a chart - +To resize the chart, click-and-drag the icon on the bottom-right corner of any chart. To restore the chart to its original height, double-click the same icon. diff --git a/docs/guides/troubleshoot/troubleshooting-agent-with-cloud-connection.md b/docs/guides/troubleshoot/troubleshooting-agent-with-cloud-connection.md index a0e8973f..ad747cb7 100644 --- a/docs/guides/troubleshoot/troubleshooting-agent-with-cloud-connection.md +++ b/docs/guides/troubleshoot/troubleshooting-agent-with-cloud-connection.md @@ -1,31 +1,71 @@ # Troubleshoot Agent-Cloud connectivity issues -Learn how to troubleshoot the Netdata Agent showing as offline after claiming, so you can connect the Agent to Netdata Cloud. +Learn how to troubleshoot connectivity issues leading to agents not appearing at all in Netdata Cloud, or +appearing with a status other than `live`. -When you are claiming a node, you might not be able to immediately see it online in Netdata Cloud. -This could be due to an error in the claiming process or a temporary outage of some services. +After installing an agent with the claiming token provided by Netdata Cloud, you should see charts from that node on +Netdata Cloud within seconds. If you don't see charts, check if the node appears in the list of nodes +(Nodes tab, top right Node filter, or Manage Nodes screen). If your node does not appear in the list, or it does appear with a status other than "Live", this guide will help you troubleshoot what's happening. -We identified some scenarios that might cause this delay and possible actions you could take to overcome each situation. + The most common explanation for connectivity issues usually falls into one of the following three categories: -The most common explanation for the delay usually falls into one of the following three categories: +- If the node does not appear at all in Netdata Cloud, [the claiming process was unsuccessful](#the-claiming-process-was-unsuccessful). +- If the node appears as in Netdata Cloud, but is in the "Unseen" state, [the Agent was claimed but can not connect](#the-agent-was-claimed-but-can-not-connect). +- If the node appears as in Netdata Cloud as "Offline" or "Stale", it is a [previously connected agent that can no longer connect](#previously-connected-agent-that-can-no-longer-connect). -- [Troubleshoot Agent-Cloud connectivity issues](#troubleshoot-agent-cloud-connectivity-issues) - - [The claiming process of the kickstart script was unsuccessful](#the-claiming-process-of-the-kickstart-script-was-unsuccessful) - - [The kickstart script auto-claimed the Agent but there was no error message displayed](#the-kickstart-script-auto-claimed-the-agent-but-there-was-no-error-message-displayed) - - [Claiming on an older, deprecated version of the Agent](#claiming-on-an-older-deprecated-version-of-the-agent) - - [Network issues while connecting to the Cloud](#network-issues-while-connecting-to-the-cloud) - - [Verify that your IP is whitelisted from Netdata Cloud](#verify-that-your-ip-is-whitelisted-from-netdata-cloud) - - [Make sure that your node has internet connectivity and can resolve network domains](#make-sure-that-your-node-has-internet-connectivity-and-can-resolve-network-domains) +## The claiming process was unsuccessful -## The claiming process of the kickstart script was unsuccessful +If the claiming process fails, the node will not appear at all in Netdata Cloud. -Here, we will try to define some edge cases you might encounter when claiming a node. +First ensure that you: +- Use the newest possible stable or nightly version of the agent (at least v1.32). +- Your node can successfully issue an HTTPS request to https://api.netdata.cloud -### The kickstart script auto-claimed the Agent but there was no error message displayed +Other possible causes differ between kickstart installations and Docker installations. -The kickstart script will install/update your Agent and then try to claim the node to the Cloud (if tokens are provided). To -complete the second part, the Agent must be running. In some platforms, the Netdata service cannot be enabled by default -and you must do it manually, using the following steps: +### Verify your node can access Netdata Cloud + +If you run either `curl` or `wget` to do an HTTPS request to https://api.netdata.cloud, you should get +back a 404 response. If you do not, check your network connectivity, domain resolution, +and firewall settings for outbound connections. + +If your firewall is configured to completely prevent outbound connections, you need to whitelist `api.netdata.cloud` and `mqtt.netdata.cloud`. If you can't whitelist domains in your firewall, you can whitelist the IPs that the hostnames resolve to, but keep in mind that they can change without any notice. + +If you use an outbound proxy, you need to [take some extra steps]( https://github.com/netdata/netdata/blob/master/claim/README.md#connect-through-a-proxy). + +### Troubleshoot claiming with kickstart.sh + +Claiming is done by executing `netdata-claim.sh`, a script that is usually located under `${INSTALL_PREFIX}/netdata/usr/sbin/netdata-claim.sh`. Possible error conditions we have identified are: +- No script found at all in any of our search paths. +- The path where the claiming script should be does not exist. +- The path exists, but is not a file. +- The path is a file, but is not executable. +Check the output of the kickstart script for any reported errors claiming and verify that the claiming script exists +and can be executed. + +### Troubleshoot claiming with Docker + +First verify that the NETDATA_CLAIM_TOKEN parameter is correctly configured and then check for any errors during +initialization of the container. + +The most common issue we have seen claiming nodes in Docker is [running on older hosts with seccomp enabled](https://github.com/netdata/netdata/blob/master/claim/README.md#known-issues-on-older-hosts-with-seccomp-enabled). + +## The Agent was claimed but can not connect + +Agents that appear on the cloud with state "Unseen" have successfully been claimed, but have never +been able to successfully establish an ACLK connection. + +Agents that appear with state "Offline" or "Stale" were able to connect at some point, but are currently not +connected. The difference between the two is that "Stale" nodes had some of their data replicated to a +parent node that is still connected. + +### Verify that the agent is running + +#### Troubleshoot connection establishment with kickstart.sh + +The kickstart script will install/update your Agent and then try to claim the node to the Cloud +(if tokens are provided). To complete the second part, the Agent must be running. In some platforms, +the Netdata service cannot be enabled by default and you must do it manually, using the following steps: 1. Check if the Agent is running: @@ -53,17 +93,39 @@ and you must do it manually, using the following steps: > In some cases a simple restart of the Agent can fix the issue. > Read more about [Starting, Stopping and Restarting the Agent](https://github.com/netdata/netdata/blob/master/docs/configure/start-stop-restart.md). -## Claiming on an older, deprecated version of the Agent +#### Troubleshoot connection establishment with Docker + +If a Netdata container exits or is killed before it properly starts, it may be able to complete the claiming +process, but not have enough time to establish the ACLK connection. + +### Verify that your firewall allows websockets + +The agent initiates an SSL connection to `api.netdata.cloud` and then upgrades that connection to use secure +websockets. Some firewalls completely prevent the use of websockets, even for outbound connections. + +## Previously connected agent that can no longer connect -Make sure that you are using the latest version of Netdata if you are using the [Claiming script](https://github.com/netdata/netdata/blob/master/claim/README.md#claiming-script). +The states "Offline" and "Stale" suggest that the agent was able to connect at some point in the past, but +that it is currently not connected. -With the introduction of our new architecture, Agents running versions lower than `v1.32.0` can face claiming problems, so we recommend you [update the Netdata Agent](https://github.com/netdata/netdata/blob/master/packaging/installer/UPDATE.md) to the latest stable version. +### Verify that network connectivity is still possible -## Network issues while connecting to the Cloud +Verify that you can still issue HTTPS requests to api.netdata.cloud and that no firewall or proxy changes were made. -### Verify that your IP is whitelisted from Netdata Cloud +### Verify that the claiming info is persisted -Most of the nodes change IPs dynamically. It is possible that your current IP has been restricted from accessing `api.netdata.cloud` due to security concerns. +If you use Docker, verify that the contents of `/var/lib/netdata` are preserved across container restarts, using a persistent volume. + +### Verify that the claiming info is not cloned + +A relatively common case we have seen especially with VMs is two or more nodes sharing the same credentials. +This happens if you claim a node in a VM and then create an image based on that node. Netdata can't properly +work this way, as we have unique node identification information under `/var/lib/netdata`. + +### Verify that your IP is not blocked by Netdata Cloud + +Most of the nodes change IPs dynamically. It is possible that your current IP has been restricted from accessing `api.netdata.cloud` due to security concerns, usually because it was spamming Netdata Coud with too many +failed requests (old versions of the agent). To verify this: @@ -83,31 +145,3 @@ To verify this: - Contact our team to whitelist your IP by submitting a ticket in the [Netdata forum](https://community.netdata.cloud/) - Change your node's IP - -### Make sure that your node has internet connectivity and can resolve network domains - -1. Try to reach a well known host: - - ```bash - ping 8.8.8.8 - ``` - -2. If you can reach external IPs, then check your domain resolution. - - ```bash - host api.netdata.cloud - ``` - - The expected output should be something like this: - - ```bash - api.netdata.cloud is an alias for main-ingress-545609a41fcaf5d6.elb.us-east-1.amazonaws.com. - main-ingress-545609a41fcaf5d6.elb.us-east-1.amazonaws.com has address 54.198.178.11 - main-ingress-545609a41fcaf5d6.elb.us-east-1.amazonaws.com has address 44.207.131.212 - main-ingress-545609a41fcaf5d6.elb.us-east-1.amazonaws.com has address 44.196.50.41 - ``` - - > ### Info - > - > There will be cases in which the firewall restricts network access. In those cases, you need to whitelist `api.netdata.cloud` and `mqtt.netdata.cloud` domains to be able to see your nodes in Netdata Cloud. - > If you can't whitelist domains in your firewall, you can whitelist the IPs that the above command will produce, but keep in mind that they can change without any notice. diff --git a/docs/netdata-security.md b/docs/netdata-security.md index 6cd33c06..2716e08e 100644 --- a/docs/netdata-security.md +++ b/docs/netdata-security.md @@ -1,196 +1,429 @@ # Security and privacy design -This document serves as the relevant Annex to the [Terms of Service](https://www.netdata.cloud/service-terms/), the [Privacy Policy](https://www.netdata.cloud/privacy/) and -the Data Processing Addendum, when applicable. It provides more information regarding Netdata’s technical and organizational security and privacy measures. +This document serves as the relevant Annex to the [Terms of Service](https://www.netdata.cloud/service-terms/), +the [Privacy Policy](https://www.netdata.cloud/privacy/) and +the Data Processing Addendum, when applicable. It provides more information regarding Netdata’s technical and +organizational security and privacy measures. -We have given special attention to all aspects of Netdata, ensuring that everything throughout its operation is as secure as possible. Netdata has been designed with security in mind. +We have given special attention to all aspects of Netdata, ensuring that everything throughout its operation is as +secure as possible. Netdata has been designed with security in mind. -> When running Netdata in environments requiring Payment Card Industry Data Security Standard (**PCI DSS**), Systems and Organization Controls (**SOC 2**), -or Health Insurance Portability and Accountability Act (**HIPAA**) compliance, please keep in mind that -**even when the user uses Netdata Cloud, all collected data is always stored inside their infrastructure**. +## Netdata's Security Principles -Dashboard data a user views and alert notifications do travel -over Netdata Cloud, as they also travel over third party networks, to reach the user's web browser or the notification integrations the user has configured, -but Netdata Cloud does not store metric data. It only transforms them as they pass through it, aggregating them from multiple Agents and Parents, -to appear as one data source on the user's browser. +### Security by Design -## Cloud design +Netdata, an open-source software widely installed across the globe, prioritizes security by design, showcasing our +commitment to safeguarding user data. The entire structure and internal architecture of the software is built to ensure +maximum security. We aim to provide a secure environment from the ground up, rather than as an afterthought. -### User identification and authorization +### Compliance with Open Source Security Foundation Best Practices -Netdata ensures that only an email address is stored to create an account and use the Service. -User identification and authorization is done -either via third parties (Google, GitHub accounts), or short-lived access tokens, sent to the user’s email account. +Netdata is committed to adhering to the best practices laid out by the Open Source Security Foundation (OSSF). +Currently, the Netdata Agent follows the OSSF best practices at the passing level. Feel free to audit our approach to +the [OSSF guidelines](https://bestpractices.coreinfrastructure.org/en/projects/2231) -### Personal Data stored +Netdata Cloud boasts of comprehensive end-to-end automated testing, encompassing the UI, back-end, and agents, where +involved. In addition, the Netdata Agent uses an array of third-party services for static code analysis, static code +security analysis, and CI/CD integrations to ensure code quality on a per pull request basis. Tools like Github's +CodeQL, Github's Dependabot, our own unit tests, various types of linters, +and [Coverity](https://scan.coverity.com/projects/netdata-netdata?tab=overview) are utilized to this end. -Netdata ensures that only an email address is stored to create an account and use the Service. The same email -address is used for Netdata product and marketing communications (via Hubspot and Sendgrid). +Moreover, each PR requires two code reviews from our senior engineers before being merged. We also maintain two +high-performance environments (a production-like kubernetes cluster and a highly demanding stress lab) for +stress-testing our entire solution. This robust pipeline ensures the delivery of high-quality software consistently. -Email addresses are stored in our production database on AWS and copied to Google BigQuery, our data lake, -for analytics purposes. These analytics are crucial for our product development process. +### Regular Third-Party Testing and Isolation -If the user accepts the use of analytical cookies, the email address is also stored in the systems we use to track the -usage of the application (Posthog and Gainsight PX) +While Netdata doesn't have a dedicated internal security team, the open-source Netdata Agent undergoes regular testing +by third parties. Any security reports received are addressed immediately. In contrast, Netdata Cloud operates in a +fully automated and isolated environment with Infrastructure as Code (IaC), ensuring no direct access to production +applications. Monitoring and reporting is also fully automated. -The IP address used to access Netdata Cloud is stored in web proxy access logs. If the user accepts the use of analytical -cookies, the IP is also stored in the systems we use to track the usage of the application (Posthog and Gainsight PX). +### Security Vulnerability Response -### Infrastructure data stored +Netdata has a transparent and structured process for handling security vulnerabilities. We appreciate and value the +contributions of security researchers and users who report vulnerabilities to us. All reports are thoroughly +investigated, and any identified vulnerabilities trigger a Security Release Process. -The metric data that a user sees in the web browser when using Netdata Cloud is streamed directly from the Netdata Agent -to the Netdata Cloud dashboard, via the Agent-Cloud link (see [data transfer](#data-transfer)). The data passes through our systems, but it isn’t stored. +We aim to fully disclose any bugs as soon as a user mitigation is available, typically within a week of the report. In +case of security fixes, we promptly release a new version of the software. Users can subscribe to our releases on GitHub +to stay updated about all security incidents. More details about our vulnerability response process can be +found [here](https://github.com/netdata/netdata/security/policy). -The metadata we do store for each node connected to the user's Spaces in Netdata Cloud is: - - Hostname (as it appears in Netdata Cloud) - - Information shown in `/api/v1/info`. For example: [https://frankfurt.my-netdata.io/api/v1/info](https://frankfurt.my-netdata.io/api/v1/info). - - Metric metadata information shown in `/api/v1/contexts`. For example: [https://frankfurt.my-netdata.io/api/v1/contexts](https://frankfurt.my-netdata.io/api/v1/contexts). - - Alarm configurations shown in `/api/v1/alarms?all`. For example: [https://frankfurt.my-netdata.io/api/v1/alarms?all](https://frankfurt.my-netdata.io/api/v1/alarms?all). - - Active alarms shown in `/api/v1/alarms`. For example: [https://frankfurt.my-netdata.io/api/v1/alarms](https://frankfurt.my-netdata.io/api/v1/alarms). +### Adherence to Open Source Security Foundation Best Practices -The infrastructure data is stored in our production database on AWS and copied to Google BigQuery, our data lake, for - analytics purposes. +In line with our commitment to security, we uphold the best practices as outlined by the Open Source Security +Foundation. This commitment reflects in every aspect of our operations, from the design phase to the release process, +ensuring the delivery of a secure and reliable product to our users. For more information +check [here](https://bestpractices.coreinfrastructure.org/en/projects/2231). -### Data transfer +## Netdata Agent Security -All infrastructure data visible on Netdata Cloud has to pass through the Agent-Cloud link (ACLK) mechanism, which -securely connects a Netdata Agent to Netdata Cloud. The Netdata agent initiates and establishes an outgoing secure -WebSocket (WSS) connection to Netdata Cloud. The ACLK is encrypted, safe, and is only established if the user connects their node. +### Security by Design -Data is encrypted when in transit between a user and Netdata Cloud using TLS. +Netdata Agent is designed with a security-first approach. Its structure ensures data safety by only exposing chart +metadata and metric values, not the raw data collected. This design principle allows Netdata to be used in environments +requiring the highest level of data isolation, such as PCI Level 1. Even though Netdata plugins connect to a user's +database server or read application log files to collect raw data, only the processed metrics are stored in Netdata +databases, sent to upstream Netdata servers, or archived to external time-series databases. -### Data retention +### User Data Protection -Netdata may maintain backups of Netdata Cloud Customer Content, which would remain in place for approximately ninety -(90) days following a deletion in Netdata Cloud. +The Netdata Agent is programmed to safeguard user data. When collecting data, the raw data does not leave the host. All +plugins, even those running with escalated capabilities or privileges, perform a hard-coded data collection job. They do +not accept commands from Netdata, and the original application data collected do not leave the process they are +collected in, are not saved, and are not transferred to the Netdata daemon. For the “Functions” feature, the data +collection plugins offer Functions, and the user interface merely calls them back as defined by the data collector. The +Netdata Agent main process does not require any escalated capabilities or privileges from the operating system, and +neither do most of the data collecting plugins. -### Data portability and erasure +### Communication and Data Encryption -Netdata will, as necessary to enable the Customer to meet its obligations under Data Protection Law, provide the Customer -via the availability of Netdata Cloud with the ability to access, retrieve, correct and delete the Personal Data stored in -Netdata Cloud. The Customer acknowledges that such ability may from time to time be limited due to temporary service outages -for maintenance or other updates to Netdata Cloud, or technically not feasible. +Data collection plugins communicate with the main Netdata process via ephemeral, in-memory, pipes that are inaccessible +to any other process. -To the extent that the Customer, in its fulfillment of its Data Protection Law obligations, is unable to access, retrieve, -correct or delete Customer Personal Data in Netdata Cloud due to prolonged unavailability of Netdata Cloud due to an issue -within Netdata’s control, Netdata will where possible use reasonable efforts to provide, correct or delete such Customer Personal Data. +Streaming of metrics between Netdata agents requires an API key and can also be encrypted with TLS if the user +configures it. -If a Customer is unable to delete Personal Data via the self-services functionality, then Netdata deletes Personal Data upon -the Customer’s written request, within the timeframe specified in the DPA and in accordance with applicable data protection law. +The Netdata agent's web API can also use TLS if configured. -#### Delete all personal data +When Netdata agents are claimed to Netdata Cloud, the communication happens via MQTT over Web Sockets over TLS, and +public/private keys are used for authorizing access. These keys are exchanged during the claiming process (usually +during the provisioning of each agent). -To remove all personal info we have about a user (email and activities) they need to delete their cloud account by logging into https://app.netdata.cloud and accessing their profile, at the bottom left of the screen. +### Authentication +Direct user access to the agent is not authenticated, considering that users should either use Netdata Cloud, or they +are already on the same LAN, or they have configured proper firewall policies. However, Netdata agents can be hidden +behind an authenticating web proxy if required. -## Agent design +For other Netdata agents streaming metrics to an agent, authentication via API keys is required and TLS can be used if +configured. -### User data is safe with Netdata +For Netdata Cloud accessing Netdata agents, public/private key cryptography is used and TLS is mandatory. -Netdata collects raw data from many sources. For each source, Netdata uses a plugin that connects to the source (or reads the -relative files produced by the source), receives raw data and processes them to calculate the metrics shown on Netdata dashboards. +### Security Vulnerability Response -Even if Netdata plugins connect to the user's database server, or read user's application log file to collect raw data, the product of -this data collection process is always a number of **chart metadata and metric values** (summarized data for dashboard visualization). -All Netdata plugins (internal to the Netdata daemon, and external ones written in any computer language), convert raw data collected -into metrics, and only these metrics are stored in Netdata databases, sent to upstream Netdata servers, or archived to external -time-series databases. +If a security vulnerability is found in the Netdata Agent, the Netdata team acknowledges and analyzes each report within +three working days, kicking off a Security Release Process. Any vulnerability information shared with the Netdata team +stays within the Netdata project and is not disseminated to other projects unless necessary for fixing the issue. The +reporter is kept updated as the security issue moves from triage to identified fix, to release planning. More +information can be found [here](https://github.com/netdata/netdata/security/policy). -The **raw data** collected by Netdata does not leave the host when collected. **The only data Netdata exposes are chart metadata and metric values.** +### Protection Against Common Security Threats -This means that Netdata can safely be used in environments that require the highest level of data isolation (like PCI Level 1). +The Netdata agent is resilient against common security threats such as DDoS attacks and SQL injections. For DDoS, +Netdata agent uses a fixed number of threads for processing requests, providing a cap on the resources that can be +consumed. It also automatically manages its memory to prevent overutilization. SQL injections are prevented as nothing +from the UI is passed back to the data collection plugins accessing databases. -### User systems are safe with Netdata +Additionally, the Netdata agent is running as a normal, unprivileged, operating system user (a few data collections +require escalated privileges, but these privileges are isolated to just them), every netdata process runs by default +with a nice priority to protect production applications in case the system is starving for CPU resources, and Netdata +agents are configured by default to be the first processes to be killed by the operating system in case the operating +system starves for memory resources (OS-OOM - Operating System Out Of Memory events). -We are very proud that **the Netdata daemon runs as a normal system user, without any special privileges**. This is quite an -achievement for a monitoring system that collects all kinds of system and application metrics. +### User Customizable Security Settings -There are a few cases, however, that raw source data are only exposed to processes with escalated privileges. To support these -cases, Netdata attempts to minimize and completely isolate the code that runs with escalated privileges. +Netdata provides users with the flexibility to customize agent security settings. Users can configure TLS across the +system, and the agent provides extensive access control lists on all its interfaces to limit access to its endpoints +based on IP. Additionally, users can configure the CPU and Memory priority of Netdata agents. -So, Netdata **plugins**, even those running with escalated capabilities or privileges, perform a **hard coded data collection job**. -They do not accept commands from Netdata. The communication is **unidirectional** from the plugin towards the Netdata daemon, except -for Functions (see below). The original application data collected by each plugin do not leave the process they are collected, are -not saved and are not transferred to the Netdata daemon. The communication from the plugins to the Netdata daemon includes only chart -metadata and processed metric values. +## Netdata Cloud Security -Child nodes use the same protocol when streaming metrics to their parent nodes. The raw data collected by the plugins of -child Netdata servers are **never leaving the host they are collected**. The only data appearing on the wire are chart -metadata and metric values. This communication is also **unidirectional**: child nodes never accept commands from -parent Netdata servers (except for Functions). +Netdata Cloud is designed with a security-first approach to ensure the highest level of protection for user data. When +using Netdata Cloud in environments that require compliance with standards like PCI DSS, SOC 2, or HIPAA, users can be +confident that all collected data is stored within their infrastructure. Data viewed on dashboards and alert +notifications travel over Netdata Cloud, but are not stored—instead, they're transformed in transit, aggregated from +multiple agents and parents (centralization points), to appear as one data source in the user's browser. -[Functions](https://github.com/netdata/netdata/blob/master/docs/cloud/netdata-functions.md) is currently -the only feature that routes requests back to origin Netdata Agents via Netdata Parents. The feature allows Netdata Cloud to send -a request to the Netdata Agent data collection plugin running at the -edge, to provide additional information, such as the process tree of a server, or the long queries of a DB. +### User Identification and Authorization -<!-- The user has full control over the available functions. For more information see “Controlling Access to Functions” and “Disabling Functions”. --> +Netdata Cloud requires only an email address to create an account and use the service. User identification and +authorization are conducted either via third-party integrations (Google, GitHub accounts) or through short-lived access +tokens sent to the user’s email account. Email addresses are stored securely in our production database on AWS and are +also used for product and marketing communications. Netdata Cloud does not store user credentials. -### Netdata is read-only +### Data Storage and Transfer -Netdata **dashboards are read-only**. Dashboard users can view and examine metrics collected by Netdata, but cannot -instruct Netdata to do something other than present the already collected metrics. +Although Netdata Cloud does not store metric data, it does keep some metadata for each node connected to user spaces. +This metadata includes the hostname, information from the `/api/v1/info` endpoint, metric metadata +from `/api/v1/contexts`, and alerts configurations from `/api/v1/alarms`. This data is securely stored in our production +database on AWS and copied to Google BigQuery for analytics purposes. -Netdata dashboards do not expose sensitive information. Business data of any kind, the kernel version, O/S version, -application versions, host IPs, etc. are not stored and are not exposed by Netdata on its dashboards. +All data visible on Netdata Cloud is transferred through the Agent-Cloud link (ACLK) mechanism, which securely connects +a Netdata Agent to Netdata Cloud. The ACLK is encrypted and safe, and is only established if the user connects/claims +their node. Data in transit between a user and Netdata Cloud is encrypted using TLS. -### Protect Netdata from the internet +### Data Retention and Erasure -Users are responsible to take all appropriate measures to secure their Netdata agent installations and especially the Netdata web user interface and API against unauthorized access. Netdata comes with a wide range of options to -[secure user nodes](https://github.com/netdata/netdata/blob/master/docs/category-overview-pages/secure-nodes.md) in -compliance with the user organization's security policy. +Netdata Cloud maintains backups of customer content for approximately 90 days following a deletion. Users have the +ability to access, retrieve, correct, and delete personal data stored in Netdata Cloud. In case a user is unable to +delete personal data via self-services functionality, Netdata will delete personal data upon the customer's written +request, in accordance with applicable data protection law. -### Anonymous statistics +### Infrastructure and Authentication -#### Netdata registry +Netdata Cloud operates on an Infrastructure as Code (IaC) model. Its microservices environment is completely isolated, +and all changes occur through Terraform. At the edge of Netdata Cloud, there is a TLS termination and an Identity and +Access Management (IAM) service that validates JWT tokens included in request cookies. -The default configuration uses a public [registry](https://github.com/netdata/netdata/blob/master/registry/README.md) under registry.my-netdata.io. -If the user uses that public registry, they submit the following information to a third party server: - - The URL of the agent's web user interface (via http request referrer) - - The hostnames of the user's Netdata servers +Netdata Cloud does not store user credentials. -If sending this information to the central Netdata registry violates user's security policies, they can configure Netdata to -[run their own registry](https://github.com/netdata/netdata/blob/master/registry/README.md#run-your-own-registry). +### Security Features and Response -#### Anonymous telemetry events +Netdata Cloud offers a variety of security features, including infrastructure-level dashboards, centralized alerts +notifications, auditing logs, and role-based access to different segments of the infrastructure. The cloud service +employs several protection mechanisms against DDoS attacks, such as rate-limiting and automated blacklisting. It also +uses static code analysers to prevent other types of attacks. -Starting with v1.30, Netdata collects anonymous usage information by default and sends it to a self hosted PostHog instance within the Netdata infrastructure. Read -about the information collected and learn how to opt-out, on our -[anonymous telemetry events](https://github.com/netdata/netdata/blob/master/docs/anonymous-statistics.md) page. +In the event of potential security vulnerabilities or incidents, Netdata Cloud follows the same process as the Netdata +agent. Every report is acknowledged and analyzed by the Netdata team within three working days, and the team keeps the +reporter updated throughout the process. -### Netdata directories +### User Customization -The agent stores data in 6 different directories on the user's system. - -| path|owner|permissions|Netdata|comments| -|:---|:----|:----------|:------|:-------| -| `/etc/netdata`|user `root`<br/>group `netdata`|dirs `0755`<br/>files `0640`|reads|**Netdata config files**<br/>may contain sensitive information, so group `netdata` is allowed to read them.| -| `/usr/libexec/netdata`|user `root`<br/>group `root`|executable by anyone<br/>dirs `0755`<br/>files `0644` or `0755`|executes|**Netdata plugins**<br/>permissions depend on the file - not all of them should have the executable flag.<br/>there are a few plugins that run with escalated privileges (Linux capabilities or `setuid`) - these plugins should be executable only by group `netdata`.| -| `/usr/share/netdata`|user `root`<br/>group `netdata`|readable by anyone<br/>dirs `0755`<br/>files `0644`|reads and sends over the network|**Netdata web static files**<br/>these files are sent over the network to anyone that has access to the Netdata web server. Netdata checks the ownership of these files (using settings at the `[web]` section of `netdata.conf`) and refuses to serve them if they are not properly owned. Symbolic links are not supported. Netdata also refuses to serve URLs with `..` in their name.| -| `/var/cache/netdata`|user `netdata`<br/>group `netdata`|dirs `0750`<br/>files `0660`|reads, writes, creates, deletes|**Netdata ephemeral database files**<br/>Netdata stores its ephemeral real-time database here.| -| `/var/lib/netdata`|user `netdata`<br/>group `netdata`|dirs `0750`<br/>files `0660`|reads, writes, creates, deletes|**Netdata permanent database files**<br/>Netdata stores here the registry data, health alarm log db, etc.| -| `/var/log/netdata`|user `netdata`<br/>group `root`|dirs `0755`<br/>files `0644`|writes, creates|**Netdata log files**<br/>all the Netdata applications, logs their errors or other informational messages to files in this directory. These files should be log rotated.| +Netdata Cloud uses the highest level of security. There is no user customization available out of the box. Its security +settings are designed to provide maximum protection for all users. We are offering customization (like custom SSO +integrations, custom data retention policies, advanced user access controls, tailored audit logs, integration with other +security tools, etc.) on a per contract basis. -## Organization processes +### Deleting Personal Data -### Employee identification and authorization +Users who wish to remove all personal data (including email and activities) can delete their cloud account by logging +into Netdata Cloud and accessing their profile. -Netdata operates technical and organizational measures for employee identification and authentication, such as logs, policies, -assigning distinct usernames for each employee and utilizing password complexity requirements for access to all platforms. +## User Privacy and Data Protection -The COO or HR are the primary system owners for all platforms and may designate additional system owners, as needed. Additional -user access is also established on a role basis, requires the system owner’s approval, and is tracked by HR. User access to each -platform is subject to periodic review and testing. When an employee changes roles, HR updates the employee’s access to all systems. -Netdata uses on-boarding and off-boarding processes to regulate access by Netdata Personnel. +Netdata Cloud is built with an unwavering commitment to user privacy and data protection. We understand that our users' +data is both sensitive and valuable, and we have implemented stringent measures to ensure its safety. -Second-layer authentication is employed where available, by way of multi-factor authentication. +### Data Collection -Netdata’s IT control environment is based upon industry-accepted concepts, such as multiple layers of preventive and detective -controls, working in concert to provide for the overall protection of Netdata’s computing environment and data assets. +Netdata Cloud collects minimal personal information from its users. The only personal data required to create an account +and use the service is an email address. This email address is used for product and marketing communications. +Additionally, the IP address used to access Netdata Cloud is stored in web proxy access logs. -### Systems security +### Data Usage + +The collected email addresses are stored in our production database on Amazon Web Services (AWS) and copied to Google +BigQuery, our data lake, for analytics purposes. These analytics are crucial for our product development process. If a +user accepts the use of analytical cookies, their email address and IP are stored in the systems we use to track +application usage (Google Analytics, Posthog, and Gainsight PX). Subscriptions and Payments data are handled by Stripe. + +### Data Sharing + +Netdata Cloud does not share any personal data with third parties, ensuring the privacy of our users' data, but Netdata +Cloud does use third parties for its services, including, but not limited to, Google Cloud and Amazon Web Services for +its infrastructure, Stripe for payment processing, Google Analytics, Posthog and Gainsight PX for analytics. + +### Data Protection + +We use state-of-the-art security measures to protect user data from unauthorized access, use, or disclosure. All +infrastructure data visible on Netdata Cloud passes through the Agent-Cloud Link (ACLK) mechanism, which securely +connects a Netdata Agent to Netdata Cloud. The ACLK is encrypted, safe, and is only established if the user connects +their node. All data in transit between a user and Netdata Cloud is encrypted using TLS. + +### User Control over Data + +Netdata provides its users with the ability to access, retrieve, correct, and delete their personal data stored in +Netdata Cloud. This ability may occasionally be limited due to temporary service outages for maintenance or other +updates to Netdata Cloud, or when it is technically not feasible. If a customer is unable to delete personal data via +the self-services functionality, Netdata deletes the data upon the customer's written request, within the timeframe +specified in the Data Protection Agreement (DPA), and in accordance with applicable data protection laws. + +### Compliance with Data Protection Laws + +Netdata Cloud is fully compliant with data protection laws like the General Data Protection Regulation (GDPR) and the +California Consumer Privacy Act (CCPA). + +### Data Transfer + +Data transfer within Netdata Cloud is secure and respects the privacy of the user data. The Netdata Agent establishes an +outgoing secure WebSocket (WSS) connection to Netdata Cloud, ensuring that the data is encrypted when in transit. + +### Use of Tracking Technologies + +Netdata Cloud uses analytical cookies if a user consents to their use. These cookies are used to track the usage of the +application and are stored in systems like Google Analytics, Posthog and Gainsight PX. + +### Data Breach Notification Process + +In the event of a data breach, Netdata has a well-defined process in place for notifying users. The details of this +process align with the standard procedures and timelines defined in the Data Protection Agreement (DPA). + +We continually review and update our privacy and data protection practices to ensure the highest level of data safety +and privacy for our users. + +## Compliance with Regulations + +Netdata is committed to ensuring the security, privacy, and integrity of user data. It complies with both the General +Data Protection Regulation (GDPR), a regulation in EU law on data protection and privacy, and the California Consumer +Privacy Act (CCPA), a state statute intended to enhance privacy rights and consumer protection for residents of +California. + +### Compliance with GDPR and CCPA + +Compliance with GDPR and CCPA are self-assessment processes, and Netdata has undertaken thorough internal audits and +controls to ensure it meets all requirements. + +As per request basis, any customer may enter with Netdata into a data processing addendum (DPA) governing customer’s +ability to load and permit Netdata to process any personal data or information regulated under applicable data +protection laws, including the GDPR and CCPA. + +### Data Transfers + +While Netdata Agent itself does not engage in any cross-border data transfers, certain personal and infrastructure data +is transferred to Netdata Cloud for the purpose of providing its services. The metric data collected and processed by +Netdata Agents, however, stays strictly within the user's infrastructure, eliminating any concerns about cross-border +data transfer issues. + +When users utilize Netdata Cloud, the metric data is streamed directly from the Netdata Agent to the users’ web browsers +via Netdata Cloud, without being stored on Netdata Cloud's servers. However, user identification data (such as email +addresses) and infrastructure metadata necessary for Netdata Cloud's operation are stored in data centers in the United +States, using compliant infrastructure providers such as Google Cloud and Amazon Web Services. These transfers and +storage are carried out in full compliance with applicable data protection laws, including GDPR and CCPA. + +### Privacy Rights + +Netdata ensures user privacy rights as mandated by the GDPR and CCPA. This includes the right to access, correct, and +delete personal data. These functions are all available online via the Netdata Cloud User Interface (UI). In case a user +wants to remove all personal information (email and activities), they can delete their cloud account by logging +into https://app.netdata.cloud and accessing their profile, at the bottom left of the screen. + +### Regular Review and Updates + +Netdata is dedicated to keeping its practices up-to-date with the latest developments in data protection regulations. +Therefore, as soon as updates or changes are made to these regulations, Netdata reviews and updates its policies and +practices accordingly to ensure continual compliance. + +While Netdata is confident in its compliance with GDPR and CCPA, users are encouraged to review Netdata's privacy policy +and reach out with any questions or concerns they may have about data protection and privacy. + +## Anonymous Statistics + +The anonymous statistics collected by the Netdata Agent are related to the installations and not to individual users. +This data includes community size, types of plugins used, possible crashes, operating systems installed, and the use of +the registry feature. No IP addresses are collected, but each Netdata installation has a unique ID. + +Netdata also collects anonymous telemetry events, which provide information on the usage of various features, errors, +and performance metrics. This data is used to understand how the software is being used and to identify areas for +improvement. + +The purpose of collecting these statistics and telemetry data is to guide the development of the open-source agent, +focusing on areas that are most beneficial to users. + +Users have the option to opt out of this data collection during the installation of the agent, or at any time by +removing a specific file from their system. + +Netdata retains this data indefinitely in order to track changes and trends within the community over time. + +Netdata does not share these anonymous statistics or telemetry data with any third parties. + +By collecting this data, Netdata is able to continuously improve their service and identify any issues or areas for +improvement, while respecting user privacy and maintaining transparency. + +## Internal Security Measures + +Internal Security Measures at Netdata are designed with an emphasis on data privacy and protection. The measures +include: + +1. **Infrastructure as Code (IaC)** : + Netdata Cloud follows the IaC model, which means it is a microservices environment that is completely isolated. All + changes are managed through Terraform, an open-source IaC software tool that provides a consistent CLI workflow for + managing cloud services. +2. **TLS Termination and IAM Service** : + At the edge of Netdata Cloud, there is a TLS termination, which provides the decryption point for incoming TLS + connections. Additionally, an Identity Access Management (IAM) service validates JWT tokens included in request + cookies or denies access to them. +3. **Session Identification** : + Once inside the microservices environment, all requests are associated with session IDs that identify the user making + the request. This approach provides additional layers of security and traceability. +4. **Data Storage** : + Data is stored in various NoSQL and SQL databases and message brokers. The entire environment is fully isolated, + providing a secure space for data management. +5. **Authentication** : + Netdata Cloud does not store credentials. It offers three types of authentication: GitHub Single Sign-On (SSO), + Google SSO, and email validation. +6. **DDoS Protection** : + Netdata Cloud has multiple protection mechanisms against Distributed Denial of Service (DDoS) attacks, including + rate-limiting and automated blacklisting. +7. **Security-Focused Development Process** : + To ensure a secure environment, Netdata employs a security-focused development process. This includes the use of + static code analysers to identify potential security vulnerabilities in the codebase. +8. **High Security Standards** : + Netdata Cloud maintains high security standards and can provide additional customization on a per contract basis. +9. **Employee Security Practices** : + Netdata ensures its employees follow security best practices, including role-based access, periodic access review, + and multi-factor authentication. This helps to minimize the risk of unauthorized access to sensitive data. +10. **Experienced Developers** : + Netdata hires senior developers with vast experience in security-related matters. It enforces two code reviews for + every Pull Request (PR), ensuring that any potential issues are identified and addressed promptly. +11. **DevOps Methodologies** : + Netdata's DevOps methodologies use the highest standards in access control in all places, utilizing the best + practices available. +12. **Risk-Based Security Program** : + Netdata has a risk-based security program that continually assesses and mitigates risks associated with data + security. This program helps maintain a secure environment for user data. + +These security measures ensure that Netdata Cloud is a secure environment for users to monitor and troubleshoot their +systems. The company remains committed to continuously improving its security practices to safeguard user data +effectively. + +## PCI DSS + +PCI DSS (Payment Card Industry Data Security Standard) is a set of security standards designed to ensure that all +companies that accept, process, store or transmit credit card information maintain a secure environment. + +Netdata is committed to providing secure and privacy-respecting services, and it aligns its practices with many of the +key principles of the PCI DSS. However, it's important to clarify that Netdata is not officially certified as PCI +DSS-compliant. While Netdata follows practices that align with PCI DSS's key principles, the company itself has not +undergone the formal certification process for PCI DSS compliance. + +PCI DSS compliance is not just about the technical controls but also involves a range of administrative and procedural +safeguards that go beyond the scope of Netdata's services. These include, among other things, maintaining a secure +network, implementing strong access control measures, regularly monitoring and testing networks, and maintaining an +information security policy. + +Therefore, while Netdata can support entities with their data security needs in relation to PCI DSS, it is ultimately +the responsibility of the entity to ensure full PCI DSS compliance across all of their operations. Entities should +always consult with a legal expert or a PCI DSS compliance consultant to ensure that their use of any product, including +Netdata, aligns with PCI DSS regulations. + +## HIPAA + +HIPAA stands for the Health Insurance Portability and Accountability Act, which is a United States federal law enacted +in 1996. HIPAA is primarily focused on protecting the privacy and security of individuals' health information. + +Netdata is committed to providing secure and privacy-respecting services, and it aligns its practices with many key +principles of HIPAA. However, it's important to clarify that Netdata is not officially certified as HIPAA-compliant. +While Netdata follows practices that align with HIPAA's key principles, the company itself has not undergone the formal +certification process for HIPAA compliance. + +HIPAA compliance is not just about technical controls but also involves a range of administrative and procedural +safeguards that go beyond the scope of Netdata's services. These include, among other things, employee training, +physical security, and contingency planning. + +Therefore, while Netdata can support HIPAA-regulated entities with their data security needs and is prepared to sign a +Business Associate Agreement (BAA), it is ultimately the responsibility of the healthcare entity to ensure full HIPAA +compliance across all of their operations. Entities should always consult with a legal expert or a HIPAA compliance +consultant to ensure that their use of any product, including Netdata, aligns with HIPAA regulations. + +## Conclusion + +In conclusion, Netdata Cloud's commitment to data security and user privacy is paramount. From the careful design of the +infrastructure and stringent internal security measures to compliance with international regulations and standards like +GDPR and CCPA, Netdata Cloud ensures a secure environment for users to monitor and troubleshoot their systems. + +The use of advanced encryption techniques, role-based access control, and robust authentication methods further +strengthen the security of user data. Netdata Cloud also maintains transparency in its data handling practices, giving +users control over their data and the ability to easily access, retrieve, correct, and delete their personal data. + +Netdata's approach to anonymous statistics collection respects user privacy while enabling the company to improve its +product based on real-world usage data. Even in such cases, users have the choice to opt-out, underlining Netdata's +respect for user autonomy. + +In summary, Netdata Cloud offers a highly secure, user-centric environment for system monitoring and troubleshooting. +The company's emphasis on continuous security improvement and commitment to user privacy make it a trusted choice in the +data monitoring landscape. -Netdata maintains a risk-based assessment security program. The framework for Netdata’s security program includes administrative, -organizational, technical, and physical safeguards reasonably designed to protect the services and confidentiality, integrity, -and availability of user data. The program is intended to be appropriate to the nature of the services and the size and complexity -of Netdata’s business operations. |