
diff options
| author | Daniel Baumann <daniel.baumann@progress-linux.org> | 2023-05-08 16:27:08 +0000 |
|---|---|---|
| committer | Daniel Baumann <daniel.baumann@progress-linux.org> | 2023-05-08 16:27:08 +0000 |
| commit | 81581f9719bc56f01d5aa08952671d65fda9867a (patch) | |
| tree | 0f5c6b6138bf169c23c9d24b1fc0a3521385cb18 /exporting | |
| parent | Releasing debian version 1.38.1-1. (diff) | |
| download | netdata-81581f9719bc56f01d5aa08952671d65fda9867a.tar.xz netdata-81581f9719bc56f01d5aa08952671d65fda9867a.zip | |
Merging upstream version 1.39.0.
Signed-off-by: Daniel Baumann <daniel.baumann@progress-linux.org>
Diffstat (limited to 'exporting')
| -rw-r--r-- | exporting/README.md | 7 | ||||
| -rw-r--r-- | exporting/TIMESCALE.md | 4 | ||||
| -rw-r--r-- | exporting/WALKTHROUGH.md | 10 | ||||
| -rw-r--r-- | exporting/aws_kinesis/README.md | 4 | ||||
| -rw-r--r-- | exporting/check_filters.c | 2 | ||||
| -rw-r--r-- | exporting/graphite/README.md | 119 | ||||
| -rw-r--r-- | exporting/json/README.md | 3 | ||||
| -rw-r--r-- | exporting/mongodb/README.md | 4 | ||||
| -rw-r--r-- | exporting/opentsdb/README.md | 4 | ||||
| -rw-r--r-- | exporting/process_data.c | 10 | ||||
| -rw-r--r-- | exporting/prometheus/README.md | 323 | ||||
| -rw-r--r-- | exporting/prometheus/prometheus.c | 6 | ||||
| -rw-r--r-- | exporting/prometheus/remote_write/README.md | 5 | ||||
| -rw-r--r-- | exporting/pubsub/README.md | 4 | ||||
| -rw-r--r-- | exporting/read_config.c | 14 |
15 files changed, 238 insertions, 281 deletions
diff --git a/exporting/README.md b/exporting/README.md index bc3ca1c7..c6ce32b6 100644 --- a/exporting/README.md +++ b/exporting/README.md @@ -1,11 +1,10 @@ <!-- title: "Exporting reference" description: "With the exporting engine, you can archive your Netdata metrics to multiple external databases for long-term storage or further analysis." -sidebar_label: "Exporting reference" +sidebar_label: "Export" custom_edit_url: "https://github.com/netdata/netdata/edit/master/exporting/README.md" learn_status: "Published" -learn_topic_type: "References" -learn_rel_path: "References/Configuration" +learn_rel_path: "Integrations/Export" learn_doc_purpose: "Explain the exporting engine options and all of our the exporting connectors options" --> @@ -45,7 +44,7 @@ connector to enable and configure for your database of choice. - [**Graphite**](https://github.com/netdata/netdata/blob/master/exporting/graphite/README.md): A plaintext interface. Metrics are sent to the database server as `prefix.hostname.chart.dimension`. `prefix` is configured below, `hostname` is the hostname of the machine (can also be configured). Learn more in our guide to [export and visualize Netdata metrics in - Graphite](https://github.com/netdata/netdata/blob/master/docs/guides/export/export-netdata-metrics-graphite.md). + Graphite](https://github.com/netdata/netdata/blob/master/exporting/graphite/README.md). - [**JSON** document databases](https://github.com/netdata/netdata/blob/master/exporting/json/README.md) - [**OpenTSDB**](https://github.com/netdata/netdata/blob/master/exporting/opentsdb/README.md): Use a plaintext or HTTP interfaces. Metrics are sent to OpenTSDB as `prefix.chart.dimension` with tag `host=hostname`. diff --git a/exporting/TIMESCALE.md b/exporting/TIMESCALE.md index 2bd6db8c..8ca61b75 100644 --- a/exporting/TIMESCALE.md +++ b/exporting/TIMESCALE.md @@ -4,9 +4,7 @@ description: "Send Netdata metrics to TimescaleDB for long-term archiving and fu custom_edit_url: "https://github.com/netdata/netdata/edit/master/exporting/TIMESCALE.md" sidebar_label: "Writing metrics to TimescaleDB" learn_status: "Published" -learn_topic_type: "Tasks" -learn_rel_path: "Setup/Exporting connectors" -learn_autogeneration_metadata: "{'part_of_cloud': False, 'part_of_agent': True}" +learn_rel_path: "Integrations/Export" --> # Writing metrics to TimescaleDB diff --git a/exporting/WALKTHROUGH.md b/exporting/WALKTHROUGH.md index 5afd2604..49cf6587 100644 --- a/exporting/WALKTHROUGH.md +++ b/exporting/WALKTHROUGH.md @@ -1,13 +1,3 @@ -<!-- -title: "Exporting to Netdata, Prometheus, Grafana stack" -description: "Using Netdata in conjunction with Prometheus and Grafana." -custom_edit_url: "https://github.com/netdata/netdata/edit/master/exporting/WALKTHROUGH.md" -sidebar_label: "Netdata, Prometheus, Grafana stack" -learn_status: "Published" -learn_topic_type: "Tasks" -learn_rel_path: "Setup/Exporting connectors" ---> - # Netdata, Prometheus, Grafana stack ## Intro diff --git a/exporting/aws_kinesis/README.md b/exporting/aws_kinesis/README.md index 7921a265..29b191b8 100644 --- a/exporting/aws_kinesis/README.md +++ b/exporting/aws_kinesis/README.md @@ -4,9 +4,7 @@ description: "Archive your Agent's metrics to AWS Kinesis Data Streams for long- custom_edit_url: "https://github.com/netdata/netdata/edit/master/exporting/aws_kinesis/README.md" sidebar_label: "AWS Kinesis Data Streams" learn_status: "Published" -learn_topic_type: "Tasks" -learn_rel_path: "Setup/Exporting connectors" -learn_autogeneration_metadata: "{'part_of_cloud': False, 'part_of_agent': True}" +learn_rel_path: "Integrations/Export" --> # Export metrics to AWS Kinesis Data Streams diff --git a/exporting/check_filters.c b/exporting/check_filters.c index 009a010b..9b573f02 100644 --- a/exporting/check_filters.c +++ b/exporting/check_filters.c @@ -65,7 +65,7 @@ int rrdset_is_exportable(struct instance *instance, RRDSET *st) if(unlikely(!(*flags & RRDSET_FLAG_EXPORTING_SEND))) { // we have not checked this chart - if(simple_pattern_matches(instance->config.charts_pattern, rrdset_id(st)) || simple_pattern_matches(instance->config.charts_pattern, rrdset_name(st))) + if(simple_pattern_matches_string(instance->config.charts_pattern, st->id) || simple_pattern_matches_string(instance->config.charts_pattern, st->name)) *flags |= RRDSET_FLAG_EXPORTING_SEND; else { *flags |= RRDSET_FLAG_EXPORTING_IGNORE; diff --git a/exporting/graphite/README.md b/exporting/graphite/README.md index afcdf798..2ef436cf 100644 --- a/exporting/graphite/README.md +++ b/exporting/graphite/README.md @@ -1,29 +1,39 @@ -<!-- -title: "Export metrics to Graphite providers" -description: "Archive your Agent's metrics to a any Graphite database provider for long-term storage, further analysis, or correlation with data from other sources." -custom_edit_url: "https://github.com/netdata/netdata/edit/master/exporting/graphite/README.md" -sidebar_label: "Graphite" -learn_status: "Published" -learn_topic_type: "Tasks" -learn_rel_path: "Setup/Exporting connectors" -learn_autogeneration_metadata: "{'part_of_cloud': False, 'part_of_agent': True}" ---> - # Export metrics to Graphite providers You can use the Graphite connector for the [exporting engine](https://github.com/netdata/netdata/blob/master/exporting/README.md) to archive your agent's metrics to Graphite providers for long-term storage, further analysis, or correlation with data from other sources. +## Prerequisites + +You have already [installed Netdata](https://github.com/netdata/netdata/edit/master/packaging/installer/README.md) and +Graphite. + ## Configuration -To enable data exporting to a Graphite database, run `./edit-config exporting.conf` in the Netdata configuration -directory and set the following options: +Begin by using `edit-config` to open the `exporting.conf` file. + +```bash +cd /etc/netdata # Replace this path with your Netdata config directory +sudo ./edit-config exporting.conf +``` + +Enable the exporting engine by setting `enabled` to `yes` in the `[exporting:global]` section. ```conf -[graphite:my_graphite_instance] +[exporting:global] + enabled = yes +``` + +Next, configure the connector. Find the `[graphite:my_graphite_instance]` example section and uncomment the line. +Set the `destination` setting to `localhost:2003`. By default, the Docker image for Graphite listens on port `2003` for +incoming metrics. If you installed Graphite a different way, you may need to change the port accordingly. + +```conf +[graphite:netdata] enabled = yes destination = localhost:2003 + ... ``` Add `:http` or `:https` modifiers to the connector type if you need to use other than a plaintext protocol. For @@ -35,7 +45,84 @@ example: `graphite:http:my_graphite_instance`, password = my_password ``` -The Graphite connector is further configurable using additional settings. See -the [exporting reference doc](https://github.com/netdata/netdata/blob/master/exporting/README.md#options) for details. +The final result for a remote, secured host should be the following: + +```conf +[graphite:https:netdata] + enabled = yes + username = my_username + password = my_password + destination = remote_host_url:2003 + # data source = average + # prefix = netdata + # hostname = my_hostname + # update every = 10 + # buffer on failures = 10 + # timeout ms = 20000 + # send names instead of ids = yes + # send charts matching = * + # send hosts matching = localhost * +``` + +We'll not worry about the [rest of the settings](https://github.com/netdata/netdata/blob/master/exporting/README.md#options) + for now. Restart the Agent using `sudo systemctl restart netdata`, or the +[appropriate method](https://github.com/netdata/netdata/blob/master/docs/configure/start-stop-restart.md) for your +system, to spin up the exporting engine. + +## See and organize Netdata metrics in Graphite + +Head back to the Graphite interface again, then click on the **Dashboard** link to get started with Netdata's exported +metrics. You can also navigate directly to `http://NODE/dashboard`. + +Let's switch the interface to help you understand which metrics Netdata is exporting to Graphite. Click on **Dashboard** +and **Configure UI**, then choose the **Tree** option. Refresh your browser to change the UI. + +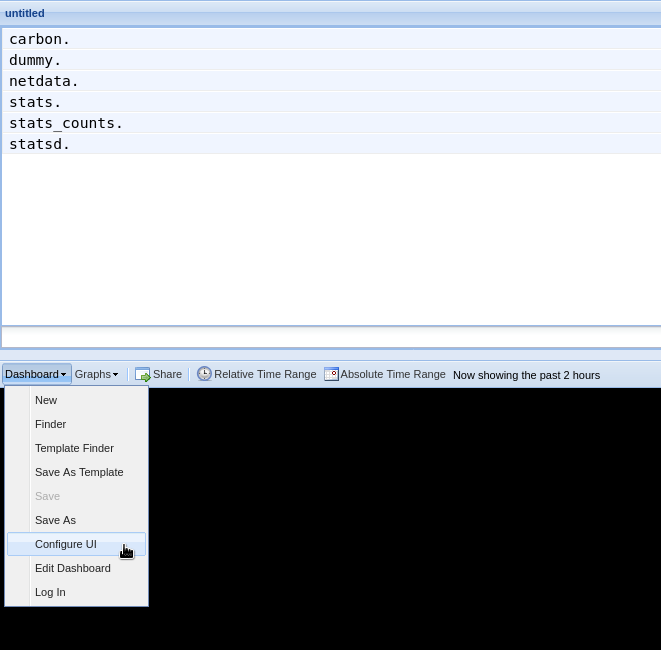 + +You should now see a tree of available contexts, including one that matches the hostname of the Agent exporting metrics. +In this example, the Agent's hostname is `arcturus`. + +Let's add some system CPU charts so you can monitor the long-term health of your system. Click through the tree to find +**hostname → system → cpu** metrics, then click on the **user** context. A chart with metrics from that context appears +in the dashboard. Add a few other system CPU charts to flesh things out. + +Next, let's combine one or two of these charts. Click and drag one chart onto the other, and wait until the green **Drop +to merge** dialog appears. Release to merge the charts. + +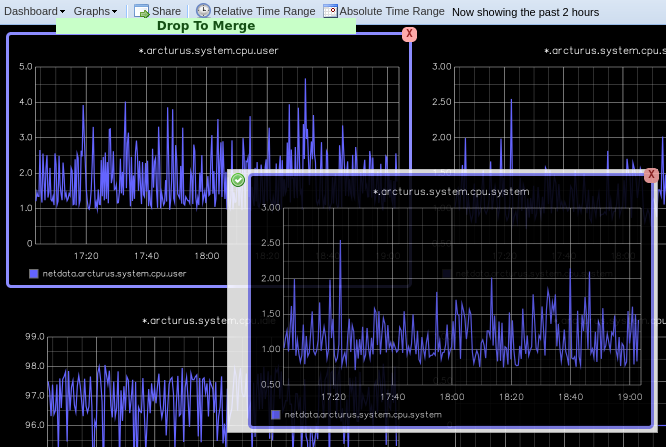 + +Finally, save your dashboard. Click **Dashboard**, then **Save As**, then choose a name. Your dashboard is now saved. + +Of course, this is just the beginning of the customization you can do with Graphite. You can change the time range, +share your dashboard with others, or use the composer to customize the size and appearance of specific charts. Learn +more about adding, modifying, and combining graphs in +the [Graphite docs](https://graphite.readthedocs.io/en/latest/dashboard.html). + +## Monitor the exporting engine + +As soon as the exporting engine begins, Netdata begins reporting metrics about the system's health and performance. + +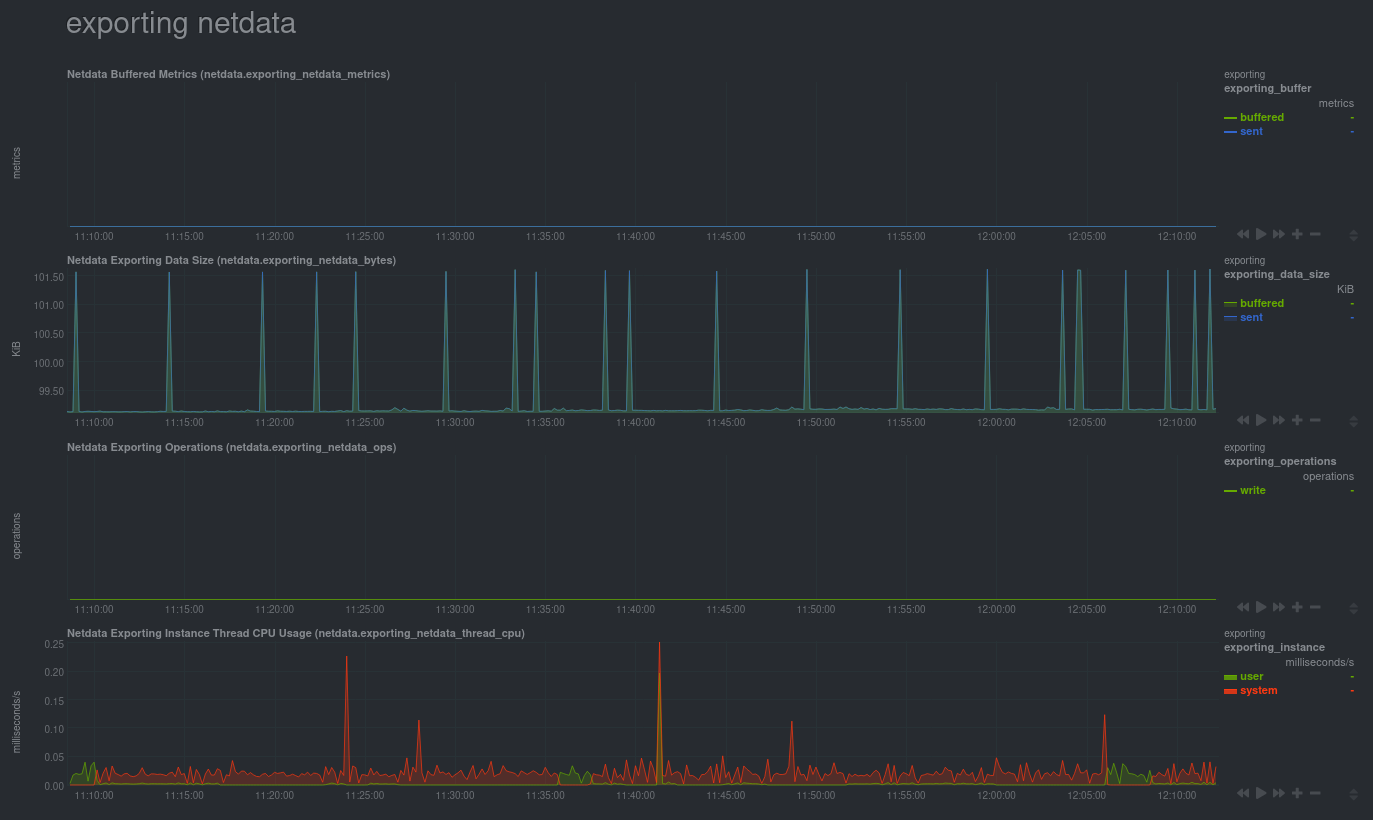 + +You can use these charts to verify that Netdata is properly exporting metrics to Graphite. You can even add these +exporting charts to your Graphite dashboard! + +### Add exporting charts to Netdata Cloud + +You can also show these exporting engine metrics on Netdata Cloud. If you don't have an account already, +go [sign in](https://app.netdata.cloud) and get started for free. + +Add more metrics to a War Room's Nodes tab by clicking on the **Add metric** button, then typing `exporting` into the +context field. Choose the exporting contexts you want to add, then click **Add**. You'll see these charts alongside any +others you've customized in Netdata Cloud. + +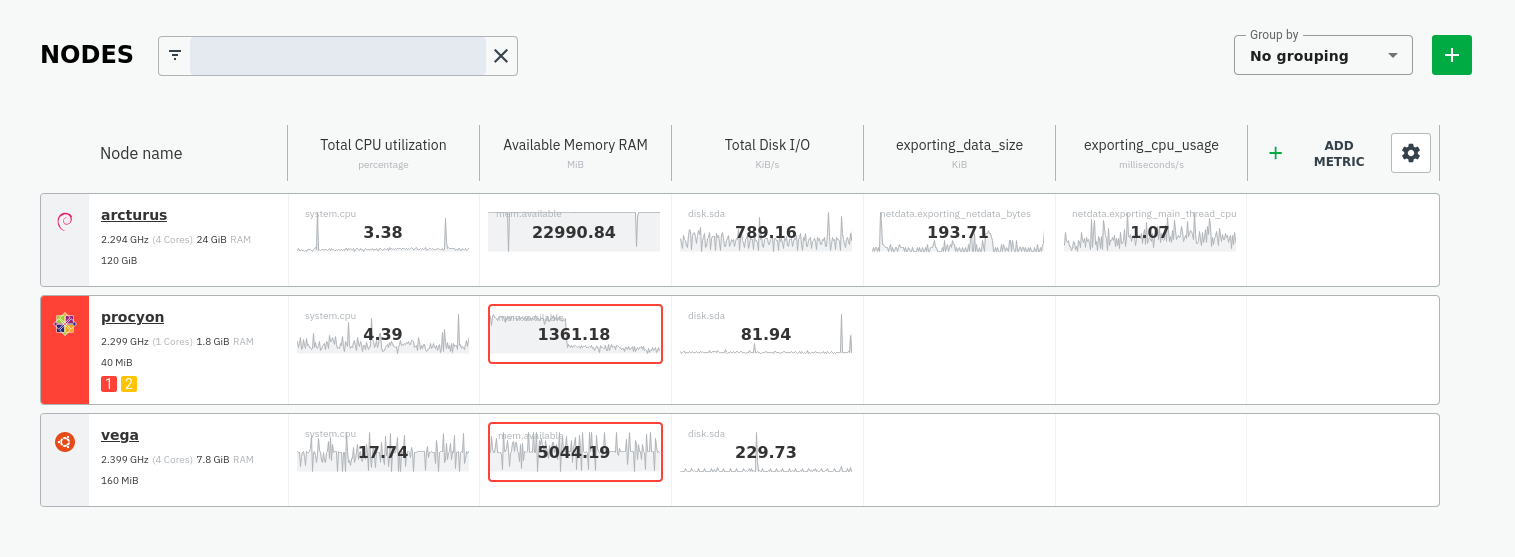 + +## What's next +What you do with your exported metrics is entirely up to you, but as you might have seen in the Graphite connector +configuration block, there are many other ways to tweak and customize which metrics you export to Graphite and how +often. +For full details about each configuration option and what it does, see +the [exporting reference guide](https://github.com/netdata/netdata/blob/master/exporting/README.md). diff --git a/exporting/json/README.md b/exporting/json/README.md index 23ff555c..4e830fb7 100644 --- a/exporting/json/README.md +++ b/exporting/json/README.md @@ -5,8 +5,7 @@ custom_edit_url: "https://github.com/netdata/netdata/edit/master/exporting/json/ sidebar_label: "JSON Document Databases" learn_status: "Published" learn_topic_type: "Tasks" -learn_rel_path: "Setup/Exporting connectors" -learn_autogeneration_metadata: "{'part_of_cloud': False, 'part_of_agent': True}" +learn_rel_path: "Integrations/Export" --> # Export metrics to JSON document databases diff --git a/exporting/mongodb/README.md b/exporting/mongodb/README.md index 0cbe8f05..aeca34c5 100644 --- a/exporting/mongodb/README.md +++ b/exporting/mongodb/README.md @@ -4,9 +4,7 @@ description: "Archive your Agent's metrics to a MongoDB database for long-term s custom_edit_url: "https://github.com/netdata/netdata/edit/master/exporting/mongodb/README.md" sidebar_label: "MongoDB" learn_status: "Published" -learn_topic_type: "Tasks" -learn_rel_path: "Setup/Exporting connectors" -learn_autogeneration_metadata: "{'part_of_cloud': False, 'part_of_agent': True}" +learn_rel_path: "Integrations/Export" --> # Export metrics to MongoDB diff --git a/exporting/opentsdb/README.md b/exporting/opentsdb/README.md index c6069f37..e1f12b2b 100644 --- a/exporting/opentsdb/README.md +++ b/exporting/opentsdb/README.md @@ -4,9 +4,7 @@ description: "Archive your Agent's metrics to an OpenTSDB database for long-term custom_edit_url: "https://github.com/netdata/netdata/edit/master/exporting/opentsdb/README.md" sidebar_label: "OpenTSDB" learn_status: "Published" -learn_topic_type: "Tasks" -learn_rel_path: "Setup/Exporting connectors" -learn_autogeneration_metadata: "{'part_of_cloud': False, 'part_of_agent': True}" +learn_rel_path: "Integrations/Export" --> # Export metrics to OpenTSDB diff --git a/exporting/process_data.c b/exporting/process_data.c index eb492535..22129cff 100644 --- a/exporting/process_data.c +++ b/exporting/process_data.c @@ -77,8 +77,8 @@ NETDATA_DOUBLE exporting_calculate_value_from_stored_data( time_t before = instance->before; // find the edges of the rrd database for this chart - time_t first_t = rd->tiers[0].query_ops->oldest_time_s(rd->tiers[0].db_metric_handle); - time_t last_t = rd->tiers[0].query_ops->latest_time_s(rd->tiers[0].db_metric_handle); + time_t first_t = storage_engine_oldest_time_s(rd->tiers[0].backend, rd->tiers[0].db_metric_handle); + time_t last_t = storage_engine_latest_time_s(rd->tiers[0].backend, rd->tiers[0].db_metric_handle); time_t update_every = st->update_every; struct storage_engine_query_handle handle; @@ -126,8 +126,8 @@ NETDATA_DOUBLE exporting_calculate_value_from_stored_data( size_t counter = 0; NETDATA_DOUBLE sum = 0; - for (rd->tiers[0].query_ops->init(rd->tiers[0].db_metric_handle, &handle, after, before, STORAGE_PRIORITY_LOW); !rd->tiers[0].query_ops->is_finished(&handle);) { - STORAGE_POINT sp = rd->tiers[0].query_ops->next_metric(&handle); + for (storage_engine_query_init(rd->tiers[0].backend, rd->tiers[0].db_metric_handle, &handle, after, before, STORAGE_PRIORITY_LOW); !storage_engine_query_is_finished(&handle);) { + STORAGE_POINT sp = storage_engine_query_next_metric(&handle); points_read++; if (unlikely(storage_point_is_gap(sp))) { @@ -138,7 +138,7 @@ NETDATA_DOUBLE exporting_calculate_value_from_stored_data( sum += sp.sum; counter += sp.count; } - rd->tiers[0].query_ops->finalize(&handle); + storage_engine_query_finalize(&handle); global_statistics_exporters_query_completed(points_read); if (unlikely(!counter)) { diff --git a/exporting/prometheus/README.md b/exporting/prometheus/README.md index 97e9c632..d3b37f12 100644 --- a/exporting/prometheus/README.md +++ b/exporting/prometheus/README.md @@ -1,227 +1,21 @@ -<!-- -title: "Export metrics to Prometheus" -description: "Export Netdata metrics to Prometheus for archiving and further analysis." -custom_edit_url: "https://github.com/netdata/netdata/edit/master/exporting/prometheus/README.md" -sidebar_label: "Using Netdata with Prometheus" -learn_status: "Published" -learn_topic_type: "Tasks" -learn_rel_path: "Setup/Exporting connectors" -learn_autogeneration_metadata: "{'part_of_cloud': False, 'part_of_agent': True}" ---> - -import { OneLineInstallWget, OneLineInstallCurl } from '@site/src/components/OneLineInstall/' - # Using Netdata with Prometheus -Prometheus is a distributed monitoring system which offers a very simple setup along with a robust data model. Recently -Netdata added support for Prometheus. I'm going to quickly show you how to install both Netdata and Prometheus on the -same server. We can then use Grafana pointed at Prometheus to obtain long term metrics Netdata offers. I'm assuming we -are starting at a fresh ubuntu shell (whether you'd like to follow along in a VM or a cloud instance is up to you). - -## Installing Netdata and Prometheus - -### Installing Netdata - -There are number of ways to install Netdata according to -[Installation](https://github.com/netdata/netdata/blob/master/packaging/installer/README.md). The suggested way -of installing the latest Netdata and keep it upgrade automatically. - -<!-- candidate for reuse --> - -To install Netdata, run the following as your normal user: - -<OneLineInstallWget/> - -Or, if you have cURL but not wget (such as on macOS): - -<OneLineInstallCurl/> - -At this point we should have Netdata listening on port 19999. Attempt to take your browser here: - -```sh -http://your.netdata.ip:19999 -``` - -_(replace `your.netdata.ip` with the IP or hostname of the server running Netdata)_ - -### Installing Prometheus - -In order to install Prometheus we are going to introduce our own systemd startup script along with an example of -prometheus.yaml configuration. Prometheus needs to be pointed to your server at a specific target url for it to scrape -Netdata's api. Prometheus is always a pull model meaning Netdata is the passive client within this architecture. -Prometheus always initiates the connection with Netdata. - -#### Download Prometheus - -```sh -cd /tmp && curl -s https://api.github.com/repos/prometheus/prometheus/releases/latest \ -| grep "browser_download_url.*linux-amd64.tar.gz" \ -| cut -d '"' -f 4 \ -| wget -qi - -``` - -#### Create prometheus system user - -```sh -sudo useradd -r prometheus -``` - -#### Create prometheus directory - -```sh -sudo mkdir /opt/prometheus -sudo chown prometheus:prometheus /opt/prometheus -``` - -#### Untar prometheus directory - -```sh -sudo tar -xvf /tmp/prometheus-*linux-amd64.tar.gz -C /opt/prometheus --strip=1 -``` - -#### Install prometheus.yml - -We will use the following `prometheus.yml` file. Save it at `/opt/prometheus/prometheus.yml`. - -Make sure to replace `your.netdata.ip` with the IP or hostname of the host running Netdata. - -```yaml -# my global config -global: - scrape_interval: 5s # Set the scrape interval to every 5 seconds. Default is every 1 minute. - evaluation_interval: 5s # Evaluate rules every 5 seconds. The default is every 1 minute. - # scrape_timeout is set to the global default (10s). - - # Attach these labels to any time series or alerts when communicating with - # external systems (federation, remote storage, Alertmanager). - external_labels: - monitor: 'codelab-monitor' - -# Load rules once and periodically evaluate them according to the global 'evaluation_interval'. -rule_files: -# - "first.rules" -# - "second.rules" - -# A scrape configuration containing exactly one endpoint to scrape: -# Here it's Prometheus itself. -scrape_configs: - # The job name is added as a label `job=<job_name>` to any timeseries scraped from this config. - - job_name: 'prometheus' - - # metrics_path defaults to '/metrics' - # scheme defaults to 'http'. - - static_configs: - - targets: [ '0.0.0.0:9090' ] - - - job_name: 'netdata-scrape' - - metrics_path: '/api/v1/allmetrics' - params: - # format: prometheus | prometheus_all_hosts - # You can use `prometheus_all_hosts` if you want Prometheus to set the `instance` to your hostname instead of IP - format: [ prometheus ] - # - # sources: as-collected | raw | average | sum | volume - # default is: average - #source: [as-collected] - # - # server name for this prometheus - the default is the client IP - # for Netdata to uniquely identify it - #server: ['prometheus1'] - honor_labels: true - - static_configs: - - targets: [ '{your.netdata.ip}:19999' ] -``` - -#### Install nodes.yml - -The following is completely optional, it will enable Prometheus to generate alerts from some Netdata sources. Tweak the -values to your own needs. We will use the following `nodes.yml` file below. Save it at `/opt/prometheus/nodes.yml`, and -add a _- "nodes.yml"_ entry under the _rule_files:_ section in the example prometheus.yml file above. - -```yaml -groups: - - name: nodes - - rules: - - alert: node_high_cpu_usage_70 - expr: sum(sum_over_time(netdata_system_cpu_percentage_average{dimension=~"(user|system|softirq|irq|guest)"}[10m])) by (job) / sum(count_over_time(netdata_system_cpu_percentage_average{dimension="idle"}[10m])) by (job) > 70 - for: 1m - annotations: - description: '{{ $labels.job }} on ''{{ $labels.job }}'' CPU usage is at {{ humanize $value }}%.' - summary: CPU alert for container node '{{ $labels.job }}' - - - alert: node_high_memory_usage_70 - expr: 100 / sum(netdata_system_ram_MB_average) by (job) - * sum(netdata_system_ram_MB_average{dimension=~"free|cached"}) by (job) < 30 - for: 1m - annotations: - description: '{{ $labels.job }} memory usage is {{ humanize $value}}%.' - summary: Memory alert for container node '{{ $labels.job }}' - - - alert: node_low_root_filesystem_space_20 - expr: 100 / sum(netdata_disk_space_GB_average{family="/"}) by (job) - * sum(netdata_disk_space_GB_average{family="/",dimension=~"avail|cached"}) by (job) < 20 - for: 1m - annotations: - description: '{{ $labels.job }} root filesystem space is {{ humanize $value}}%.' - summary: Root filesystem alert for container node '{{ $labels.job }}' - - - alert: node_root_filesystem_fill_rate_6h - expr: predict_linear(netdata_disk_space_GB_average{family="/",dimension=~"avail|cached"}[1h], 6 * 3600) < 0 - for: 1h - labels: - severity: critical - annotations: - description: Container node {{ $labels.job }} root filesystem is going to fill up in 6h. - summary: Disk fill alert for Swarm node '{{ $labels.job }}' -``` +Netdata supports exporting metrics to Prometheus in two ways: -#### Install prometheus.service + - You can [configure Prometheus to scrape Netdata metrics](#configure-prometheus-to-scrape-netdata-metrics). -Save this service file as `/etc/systemd/system/prometheus.service`: - -```sh -[Unit] -Description=Prometheus Server -AssertPathExists=/opt/prometheus - -[Service] -Type=simple -WorkingDirectory=/opt/prometheus -User=prometheus -Group=prometheus -ExecStart=/opt/prometheus/prometheus --config.file=/opt/prometheus/prometheus.yml --log.level=info -ExecReload=/bin/kill -SIGHUP $MAINPID -ExecStop=/bin/kill -SIGINT $MAINPID - -[Install] -WantedBy=multi-user.target -``` - -##### Start Prometheus - -```sh -sudo systemctl start prometheus -sudo systemctl enable prometheus -``` - -Prometheus should now start and listen on port 9090. Attempt to head there with your browser. - -If everything is working correctly when you fetch `http://your.prometheus.ip:9090` you will see a 'Status' tab. Click -this and click on 'targets' We should see the Netdata host as a scraped target. - ---- + - You can [configure Netdata to push metrics to Prometheus](https://github.com/netdata/netdata/blob/master/exporting/prometheus/remote_write/README.md) + , using the Prometheus remote write API. ## Netdata support for Prometheus -Before explaining the changes, we have to understand the key differences between Netdata and Prometheus. +Regardless of the methodology, you first need to understand how Netdata structures the metrics it exports to Prometheus +and the capabilities it provides. The examples provided in this document assume that you will be using Netdata as +a metrics endpoint, but the concepts apply as well to the remote write API method. -### understanding Netdata metrics +### Understanding Netdata metrics -#### charts +#### Charts Each chart in Netdata has several properties (common to all its metrics): @@ -236,7 +30,7 @@ Each chart in Netdata has several properties (common to all its metrics): - `units` is the units for all the metrics attached to the chart. -#### dimensions +#### Dimensions Then each Netdata chart contains metrics called `dimensions`. All the dimensions of a chart have the same units of measurement, and are contextually in the same category (ie. the metrics for disk bandwidth are `read` and `write` and @@ -467,4 +261,101 @@ through a web proxy, or when multiple Prometheus servers are NATed to a single I `&server=NAME` to the URL. This `NAME` is used by Netdata to uniquely identify each Prometheus server and keep track of its last access time. +## Configure Prometheus to scrape Netdata metrics + +The following `prometheus.yml` file will scrape all netdata metrics "as collected". + +Make sure to replace `your.netdata.ip` with the IP or hostname of the host running Netdata. + +```yaml +# my global config +global: + scrape_interval: 5s # Set the scrape interval to every 5 seconds. Default is every 1 minute. + evaluation_interval: 5s # Evaluate rules every 5 seconds. The default is every 1 minute. + # scrape_timeout is set to the global default (10s). + + # Attach these labels to any time series or alerts when communicating with + # external systems (federation, remote storage, Alertmanager). + external_labels: + monitor: 'codelab-monitor' + +# Load rules once and periodically evaluate them according to the global 'evaluation_interval'. +rule_files: +# - "first.rules" +# - "second.rules" + +# A scrape configuration containing exactly one endpoint to scrape: +# Here it's Prometheus itself. +scrape_configs: + # The job name is added as a label `job=<job_name>` to any timeseries scraped from this config. + - job_name: 'prometheus' + + # metrics_path defaults to '/metrics' + # scheme defaults to 'http'. + + static_configs: + - targets: [ '0.0.0.0:9090' ] + + - job_name: 'netdata-scrape' + + metrics_path: '/api/v1/allmetrics' + params: + # format: prometheus | prometheus_all_hosts + # You can use `prometheus_all_hosts` if you want Prometheus to set the `instance` to your hostname instead of IP + format: [ prometheus ] + # + # sources: as-collected | raw | average | sum | volume + # default is: average + #source: [as-collected] + # + # server name for this prometheus - the default is the client IP + # for Netdata to uniquely identify it + #server: ['prometheus1'] + honor_labels: true + static_configs: + - targets: [ '{your.netdata.ip}:19999' ] +``` + +### Prometheus alerts for Netdata metrics + +The following is an example of a `nodes.yml` file that will allow Prometheus to generate alerts from some Netdata sources. +Save it at `/opt/prometheus/nodes.yml`, and add a _- "nodes.yml"_ entry under the _rule_files:_ section in the example prometheus.yml file above. + +```yaml +groups: + - name: nodes + + rules: + - alert: node_high_cpu_usage_70 + expr: sum(sum_over_time(netdata_system_cpu_percentage_average{dimension=~"(user|system|softirq|irq|guest)"}[10m])) by (job) / sum(count_over_time(netdata_system_cpu_percentage_average{dimension="idle"}[10m])) by (job) > 70 + for: 1m + annotations: + description: '{{ $labels.job }} on ''{{ $labels.job }}'' CPU usage is at {{ humanize $value }}%.' + summary: CPU alert for container node '{{ $labels.job }}' + + - alert: node_high_memory_usage_70 + expr: 100 / sum(netdata_system_ram_MB_average) by (job) + * sum(netdata_system_ram_MB_average{dimension=~"free|cached"}) by (job) < 30 + for: 1m + annotations: + description: '{{ $labels.job }} memory usage is {{ humanize $value}}%.' + summary: Memory alert for container node '{{ $labels.job }}' + + - alert: node_low_root_filesystem_space_20 + expr: 100 / sum(netdata_disk_space_GB_average{family="/"}) by (job) + * sum(netdata_disk_space_GB_average{family="/",dimension=~"avail|cached"}) by (job) < 20 + for: 1m + annotations: + description: '{{ $labels.job }} root filesystem space is {{ humanize $value}}%.' + summary: Root filesystem alert for container node '{{ $labels.job }}' + + - alert: node_root_filesystem_fill_rate_6h + expr: predict_linear(netdata_disk_space_GB_average{family="/",dimension=~"avail|cached"}[1h], 6 * 3600) < 0 + for: 1h + labels: + severity: critical + annotations: + description: Container node {{ $labels.job }} root filesystem is going to fill up in 6h. + summary: Disk fill alert for Swarm node '{{ $labels.job }}' +``` diff --git a/exporting/prometheus/prometheus.c b/exporting/prometheus/prometheus.c index dc675dd3..24bd215f 100644 --- a/exporting/prometheus/prometheus.c +++ b/exporting/prometheus/prometheus.c @@ -9,9 +9,9 @@ static int is_matches_rrdset(struct instance *instance, RRDSET *st, SIMPLE_PATTERN *filter) { if (instance->config.options & EXPORTING_OPTION_SEND_NAMES) { - return simple_pattern_matches(filter, rrdset_name(st)); + return simple_pattern_matches_string(filter, st->name); } - return simple_pattern_matches(filter, rrdset_id(st)); + return simple_pattern_matches_string(filter, st->id); } /** @@ -514,7 +514,7 @@ static void rrd_stats_api_v1_charts_allmetrics_prometheus( int allhosts, PROMETHEUS_OUTPUT_OPTIONS output_options) { - SIMPLE_PATTERN *filter = simple_pattern_create(filter_string, NULL, SIMPLE_PATTERN_EXACT); + SIMPLE_PATTERN *filter = simple_pattern_create(filter_string, NULL, SIMPLE_PATTERN_EXACT, true); char hostname[PROMETHEUS_ELEMENT_MAX + 1]; prometheus_label_copy(hostname, rrdhost_hostname(host), PROMETHEUS_ELEMENT_MAX); diff --git a/exporting/prometheus/remote_write/README.md b/exporting/prometheus/remote_write/README.md index 9bda02d4..c2ad22a6 100644 --- a/exporting/prometheus/remote_write/README.md +++ b/exporting/prometheus/remote_write/README.md @@ -4,11 +4,10 @@ description: "Send Netdata metrics to your choice of more than 20 external stora custom_edit_url: "https://github.com/netdata/netdata/edit/master/exporting/prometheus/remote_write/README.md" sidebar_label: "Prometheus remote write" learn_status: "Published" -learn_topic_type: "Tasks" -learn_rel_path: "Setup/Exporting connectors" +learn_rel_path: "Integrations/Export" --> -# Prometheus remote write exporting connector +# Export metrics to Prometheus remote write providers The Prometheus remote write exporting connector uses the exporting engine to send Netdata metrics to your choice of more than 20 external storage providers for long-term archiving and further analysis. diff --git a/exporting/pubsub/README.md b/exporting/pubsub/README.md index 10252f16..c4d4ed78 100644 --- a/exporting/pubsub/README.md +++ b/exporting/pubsub/README.md @@ -4,9 +4,7 @@ description: "Export Netdata metrics to the Google Cloud Pub/Sub Service for lon custom_edit_url: "https://github.com/netdata/netdata/edit/master/exporting/pubsub/README.md" sidebar_label: "Google Cloud Pub/Sub Service" learn_status: "Published" -learn_topic_type: "Tasks" -learn_rel_path: "Setup/Exporting connectors" -learn_autogeneration_metadata: "{'part_of_cloud': False, 'part_of_agent': True}" +learn_rel_path: "Integrations/Export" --> # Export metrics to Google Cloud Pub/Sub Service diff --git a/exporting/read_config.c b/exporting/read_config.c index 1cba1682..eab2cdfc 100644 --- a/exporting/read_config.c +++ b/exporting/read_config.c @@ -264,11 +264,11 @@ struct engine *read_exporting_config() prometheus_exporter_instance->config.options &= ~EXPORTING_OPTION_SEND_AUTOMATIC_LABELS; prometheus_exporter_instance->config.charts_pattern = simple_pattern_create( - prometheus_config_get("send charts matching", "*"), - NULL, - SIMPLE_PATTERN_EXACT); + prometheus_config_get("send charts matching", "*"), + NULL, + SIMPLE_PATTERN_EXACT, true); prometheus_exporter_instance->config.hosts_pattern = simple_pattern_create( - prometheus_config_get("send hosts matching", "localhost *"), NULL, SIMPLE_PATTERN_EXACT); + prometheus_config_get("send hosts matching", "localhost *"), NULL, SIMPLE_PATTERN_EXACT, true); prometheus_exporter_instance->config.prefix = prometheus_config_get("prefix", global_exporting_prefix); @@ -369,10 +369,12 @@ struct engine *read_exporting_config() tmp_instance->config.timeoutms = exporter_get_number(instance_name, "timeout ms", 10000); tmp_instance->config.charts_pattern = - simple_pattern_create(exporter_get(instance_name, "send charts matching", "*"), NULL, SIMPLE_PATTERN_EXACT); + simple_pattern_create(exporter_get(instance_name, "send charts matching", "*"), NULL, + SIMPLE_PATTERN_EXACT, + true); tmp_instance->config.hosts_pattern = simple_pattern_create( - exporter_get(instance_name, "send hosts matching", "localhost *"), NULL, SIMPLE_PATTERN_EXACT); + exporter_get(instance_name, "send hosts matching", "localhost *"), NULL, SIMPLE_PATTERN_EXACT, true); char *data_source = exporter_get(instance_name, "data source", "average"); |