
diff options
| author | Daniel Baumann <daniel.baumann@progress-linux.org> | 2021-05-19 12:33:38 +0000 |
|---|---|---|
| committer | Daniel Baumann <daniel.baumann@progress-linux.org> | 2021-05-19 12:33:59 +0000 |
| commit | 1ee0c09c5742557e037df5421ca62abddb90ae22 (patch) | |
| tree | 71c0fa48bb6d31d036c9badd7e038527f90d1a73 /health | |
| parent | Releasing debian version 1.30.1-1. (diff) | |
| download | netdata-1ee0c09c5742557e037df5421ca62abddb90ae22.tar.xz netdata-1ee0c09c5742557e037df5421ca62abddb90ae22.zip | |
Merging upstream version 1.31.0.
Signed-off-by: Daniel Baumann <daniel.baumann@progress-linux.org>
Diffstat (limited to 'health')
94 files changed, 4531 insertions, 3117 deletions
diff --git a/health/Makefile.am b/health/Makefile.am index 0802dc75..b963ea0c 100644 --- a/health/Makefile.am +++ b/health/Makefile.am @@ -88,7 +88,9 @@ dist_healthconfig_DATA = \ health.d/softnet.conf \ health.d/squid.conf \ health.d/stiebeleltron.conf \ + health.d/synchronization.conf \ health.d/swap.conf \ + health.d/systemdunits.conf \ health.d/tcp_conn.conf \ health.d/tcp_listen.conf \ health.d/tcp_mem.conf \ diff --git a/health/REFERENCE.md b/health/REFERENCE.md index bc5f40cc..5ea6b7c5 100644 --- a/health/REFERENCE.md +++ b/health/REFERENCE.md @@ -47,9 +47,10 @@ to the same chart, Netdata will use the alarm. Netdata parses the following lines. Beneath the table is an in-depth explanation of each line's purpose and syntax. -- The `on` and `lookup` lines are **always required**. -- Each entity **must** have one of the following lines: `calc`, `warn`, or `crit`. - The `alarm` or `template` line must be the first line of any entity. +- The `on` line is **always required**. +- The `every` line is **required** if not using `lookup`. +- Each entity **must** have at least one of the following lines: `lookup`, `calc`, `warn`, or `crit`. - A few lines use space-separated lists to define how the entity behaves. You can use `*` as a wildcard or prefix with `!` for a negative match. Order is important, too! See our [simple patterns docs](../libnetdata/simple_pattern/) for more examples. @@ -58,10 +59,14 @@ Netdata parses the following lines. Beneath the table is an in-depth explanation | --------------------------------------------------- | --------------- | ------------------------------------------------------------------------------------- | | [`alarm`/`template`](#alarm-line-alarm-or-template) | yes | Name of the alarm/template. | | [`on`](#alarm-line-on) | yes | The chart this alarm should attach to. | +| [`class`](#alarm-line-class) | no | The general classification of the alarm. | +| [`component`](#alarm-line-component) | no | Specify the component of the class of the alarm. | +| [`type`](#alarm-line-type) | no | The type of error the alarm monitors. | | [`os`](#alarm-line-os) | no | Which operating systems to run this chart. | | [`hosts`](#alarm-line-hosts) | no | Which hostnames will run this alarm. | | [`plugin`](#alarm-line-plugin) | no | Restrict an alarm or template to only a certain plugin. | | [`module`](#alarm-line-module) | no | Restrict an alarm or template to only a certain module. | +| [`charts`](#alarm-line-charts) | no | Restrict an alarm or template to only certain charts. | | [`families`](#alarm-line-families) | no | Restrict a template to only certain families. | | [`lookup`](#alarm-line-lookup) | yes | The database lookup to find and process metrics for the chart specified through `on`. | | [`calc`](#alarm-line-calc) | yes (see above) | A calculation to apply to the value found via `lookup` or another variable. | @@ -72,7 +77,7 @@ Netdata parses the following lines. Beneath the table is an in-depth explanation | [`exec`](#alarm-line-exec) | no | The script to execute when the alarm changes status. | | [`delay`](#alarm-line-delay) | no | Optional hysteresis settings to prevent floods of notifications. | | [`repeat`](#alarm-line-repeat) | no | The interval for sending notifications when an alarm is in WARNING or CRITICAL mode. | -| [`option`](#alarm-line-option) | no | Add an option to not clear alarms. | +| [`options`](#alarm-line-options) | no | Add an option to not clear alarms. | | [`host labels`](#alarm-line-host-labels) | no | List of labels present on a host. | The `alarm` or `template` line must be the first line of any entity. @@ -129,6 +134,67 @@ You're interested in what comes after the comma: `disk.io`. That's the name of t If you create a template using the `disk.io` context, it will apply an alarm to every disk available on your system. +#### Alarm line `class` + +Specify the classification of the alarm or template. + +Class can be used to indicate the broader area of the system that the alarm applies to. For example, under the general `Database` class, you can group together alarms that operate on various database systems, like `MySQL`, `CockroachDB`, `CouchDB` etc. Example: + +```yaml +class: Database +``` +<details> +<summary>Netdata's stock alarms use the following `class` attributes by default, but feel free to adjust for your own requirements.</summary> + +| Class | Description | +| ------------------------ | ------------------------------------------------------------------------------------------------ | +| Ad Filtering | Services related to Ad Filtering (like pi-hole) | +| Certificates | Certificates monitoring related | +| Cgroups | Alerts for cpu and memory usage of control groups | +| Computing | Alerts for shared computing applications (e.g. boinc) | +| Containers | Container related alerts (e.g. docker instances) | +| Database | Database systems (e.g. MySQL, Postgress, etc) | +| Data Sharing | Used to group together alerts for data sharing applications | +| DHCP | Alerts for dhcp related services | +| DNS | Alerts for dns related services | +| Kubernetes | Alerts for kubernetes nodes monitoring | +| KV Storage | Key-Value pairs services alerts (e.g. memcached) | +| Linux | Services specific to Linux (e.g. systemd) | +| Messaging | Alerts for message passing services (e.g. vernemq) | +| Netdata | Internal Netdata components monitoring | +| Other | Use as a general class of alerts | +| Power Supply | Alerts from power supply related services (e.g. apcupsd) | +| Search engine | Alerts for search services (e.g. elasticsearch) | +| Storage | Class for alerts dealing with storage services (storage devices typically live under `System`) | +| System | General system alarms (e.g. cpu, network, etc.) | +| Virtual Machine | Virtual Machine software | +| Web Proxy | Web proxy software (e.g. squid) | +| Web Server | Web server software (e.g. Apache, ngnix, etc.) | +| Windows | Alerts for monitor of wmi services | + +</details> + +If an alarm configuration is missing the `class` line, its value will default to `Unknown`. + +#### Alarm line `component` + +Component can be used to narrow down what the previous `class` value specifies for each alarm or template. Continuing from the previous example, `component` might include `MySQL`, `CockroachDB`, `MongoDB`, all under the same `Database` classification. Example: + +```yaml +component: MySQL +``` +As with the `class` line, if `component` is missing from the configuration, its value will default to `Unknown`. + +#### Alarm line `type` + +This indicates the type of error (or general problem area) that the alarm or template applies to. For example, `Latency` can be used for alarms that trigger on latency issues in network interfaces, web servers, or database systems. Example: + +```yaml +type: Latency +``` + +`type` will also (as with `class` and `component`) default to `Unknown` if the line is missing from the alarm configuration. + #### Alarm line `os` The alarm or template will be used only if the operating system of the host matches this list specified in `os`. The @@ -177,6 +243,19 @@ plugin: python.d.plugin module: isc_dhcpd ``` +#### Alarm line `charts` + +The `charts` line filters which chart this alarm should apply to. It is only available on entities using the +[`template`](#alarm-line-alarm-or-template) line. +The value is a space-separated list of [simple patterns](/libnetdata/simple_pattern/README.md). For +example, a template that applies to `disk.svctm` (Average Service Time) context, but excludes the disk `sdb` from alarms: + +```yaml +template: disk_svctm_alarm + on: disk.svctm + charts: !*sdb* * +``` + #### Alarm line `families` The `families` line, used only alongside templates, filters which families within the context this alarm should apply @@ -386,12 +465,12 @@ repeat: [off] [warning DURATION] [critical DURATION] - `critical DURATION`: Defines the interval when the alarm is in CRITICAL state. Use `0s` to turn off the repeating notification for CRITICAL mode. -#### Alarm line `option` +#### Alarm line `options` -The only possible value for the `option` line is +The only possible value for the `options` line is ```yaml -option: no-clear-notification +options: no-clear-notification ``` For some alarms we need compare two time-frames, to detect anomalies. For example, `health.d/httpcheck.conf` has an diff --git a/health/health.c b/health/health.c index 0793100a..85d2a245 100644 --- a/health/health.c +++ b/health/health.c @@ -523,7 +523,7 @@ static inline int rrdcalc_isrunnable(RRDCALC *rc, time_t now, time_t *next_run) return 1; } -static inline int check_if_resumed_from_suspention(void) { +static inline int check_if_resumed_from_suspension(void) { static usec_t last_realtime = 0, last_monotonic = 0; usec_t realtime = now_realtime_usec(), monotonic = now_monotonic_usec(); int ret = 0; @@ -649,7 +649,7 @@ void *health_main(void *ptr) { time_t next_run = now + min_run_every; RRDCALC *rc; - if (unlikely(check_if_resumed_from_suspention())) { + if (unlikely(check_if_resumed_from_suspension())) { apply_hibernation_delay = 1; info("Postponing alarm checks for %ld seconds, because it seems that the system was just resumed from suspension.", @@ -930,7 +930,7 @@ void *health_main(void *ptr) { if(likely(!rrdcalc_isrepeating(rc))) { ALARM_ENTRY *ae = health_create_alarm_entry( host, rc->id, rc->next_event_id++, now, rc->name, rc->rrdset->id, - rc->rrdset->family, rc->exec, rc->recipient, now - rc->last_status_change, + rc->rrdset->family, rc->classification, rc->component, rc->type, rc->exec, rc->recipient, now - rc->last_status_change, rc->old_value, rc->value, rc->status, status, rc->source, rc->units, rc->info, rc->delay_last, ( @@ -980,7 +980,7 @@ void *health_main(void *ptr) { rc->last_repeat = now; ALARM_ENTRY *ae = health_create_alarm_entry( host, rc->id, rc->next_event_id++, now, rc->name, rc->rrdset->id, - rc->rrdset->family, rc->exec, rc->recipient, now - rc->last_status_change, + rc->rrdset->family, rc->classification, rc->component, rc->type, rc->exec, rc->recipient, now - rc->last_status_change, rc->old_value, rc->value, rc->old_status, rc->status, rc->source, rc->units, rc->info, rc->delay_last, ( diff --git a/health/health.d/adaptec_raid.conf b/health/health.d/adaptec_raid.conf index 0753c6e5..b067e184 100644 --- a/health/health.d/adaptec_raid.conf +++ b/health/health.d/adaptec_raid.conf @@ -1,24 +1,30 @@ # logical device status check -template: adaptec_raid_ld_status - on: adaptec_raid.ld_status - lookup: max -10s foreach * - units: bool - every: 10s - crit: $this > 0 - delay: down 5m multiplier 1.5 max 1h - info: logical device status is failed or degraded - to: sysadmin + template: adaptec_raid_ld_status + on: adaptec_raid.ld_status + class: System +component: RAID + type: Errors + lookup: max -10s foreach * + units: bool + every: 10s + crit: $this > 0 + delay: down 5m multiplier 1.5 max 1h + info: logical device status is failed or degraded + to: sysadmin # physical device state check -template: adaptec_raid_pd_state - on: adaptec_raid.pd_state - lookup: max -10s foreach * - units: bool - every: 10s - crit: $this > 0 - delay: down 5m multiplier 1.5 max 1h - info: physical device state is not online - to: sysadmin + template: adaptec_raid_pd_state + on: adaptec_raid.pd_state + class: System +component: RAID + type: Errors + lookup: max -10s foreach * + units: bool + every: 10s + crit: $this > 0 + delay: down 5m multiplier 1.5 max 1h + info: physical device state is not online + to: sysadmin diff --git a/health/health.d/am2320.conf b/health/health.d/am2320.conf index ddf8b704..4bac98fb 100644 --- a/health/health.d/am2320.conf +++ b/health/health.d/am2320.conf @@ -1,12 +1,15 @@ # make sure am2320 is sending stats -template: am2320_last_collected_secs - on: am2320.temperature - calc: $now - $last_collected_t - units: seconds ago - every: 10s - warn: $this > (($status >= $WARNING) ? ($update_every) : ( 5 * $update_every)) - crit: $this > (($status == $CRITICAL) ? ($update_every) : (60 * $update_every)) - delay: down 5m multiplier 1.5 max 1h - info: number of seconds since the last successful data collection - to: webmaster
\ No newline at end of file + template: am2320_last_collected_secs + on: am2320.temperature + class: Other +component: Sensors + type: Latency + calc: $now - $last_collected_t + units: seconds ago + every: 10s + warn: $this > (($status >= $WARNING) ? ($update_every) : ( 5 * $update_every)) + crit: $this > (($status == $CRITICAL) ? ($update_every) : (60 * $update_every)) + delay: down 5m multiplier 1.5 max 1h + info: number of seconds since the last successful data collection + to: webmaster diff --git a/health/health.d/anomalies.conf b/health/health.d/anomalies.conf index c4c96eaf..f27e39fc 100644 --- a/health/health.d/anomalies.conf +++ b/health/health.d/anomalies.conf @@ -1,17 +1,23 @@ # raise a warning alarm if an anomaly probability is consistently above 50% -template: anomalies_anomaly_probabilities - on: anomalies.probability - lookup: average -2m foreach * - every: 1m - warn: $this > 50 - info: average anomaly probability over the last 2 minutes + template: anomalies_anomaly_probabilities + on: anomalies.probability + class: Netdata +component: ML + type: Errors + lookup: average -2m foreach * + every: 1m + warn: $this > 50 + info: average anomaly probability over the last 2 minutes # raise a warning alarm if an anomaly flag is consistently firing -template: anomalies_anomaly_flags - on: anomalies.anomaly - lookup: sum -2m foreach * - every: 1m - warn: $this > 10 - info: number of anomalies in the last 2 minutes + template: anomalies_anomaly_flags + on: anomalies.anomaly + class: Netdata +component: ML + type: Errors + lookup: sum -2m foreach * + every: 1m + warn: $this > 10 + info: number of anomalies in the last 2 minutes diff --git a/health/health.d/apache.conf b/health/health.d/apache.conf index 0c98b877..c623fb88 100644 --- a/health/health.d/apache.conf +++ b/health/health.d/apache.conf @@ -1,14 +1,17 @@ # make sure apache is running -template: apache_last_collected_secs - on: apache.requests - calc: $now - $last_collected_t - units: seconds ago - every: 10s - warn: $this > (($status >= $WARNING) ? ($update_every) : ( 5 * $update_every)) - crit: $this > (($status == $CRITICAL) ? ($update_every) : (60 * $update_every)) - delay: down 5m multiplier 1.5 max 1h - info: number of seconds since the last successful data collection - to: webmaster + template: apache_last_collected_secs + on: apache.requests + class: Web Server +component: Apache + type: Latency + calc: $now - $last_collected_t + units: seconds ago + every: 10s + warn: $this > (($status >= $WARNING) ? ($update_every) : ( 5 * $update_every)) + crit: $this > (($status == $CRITICAL) ? ($update_every) : (60 * $update_every)) + delay: down 5m multiplier 1.5 max 1h + info: number of seconds since the last successful data collection + to: webmaster diff --git a/health/health.d/apcupsd.conf b/health/health.d/apcupsd.conf index 12384fac..07b5c28c 100644 --- a/health/health.d/apcupsd.conf +++ b/health/health.d/apcupsd.conf @@ -1,40 +1,49 @@ # you can disable an alarm notification by setting the 'to' line to: silent -template: apcupsd_10min_ups_load - on: apcupsd.load - os: * - hosts: * - lookup: average -10m unaligned of percentage - units: % - every: 1m - warn: $this > (($status >= $WARNING) ? (70) : (80)) - crit: $this > (($status == $CRITICAL) ? (85) : (95)) - delay: down 10m multiplier 1.5 max 1h - info: average UPS load over the last 10 minutes - to: sitemgr + template: apcupsd_10min_ups_load + on: apcupsd.load + class: Power Supply +component: UPS + type: Utilization + os: * + hosts: * + lookup: average -10m unaligned of percentage + units: % + every: 1m + warn: $this > (($status >= $WARNING) ? (70) : (80)) + crit: $this > (($status == $CRITICAL) ? (85) : (95)) + delay: down 10m multiplier 1.5 max 1h + info: average UPS load over the last 10 minutes + to: sitemgr # Discussion in https://github.com/netdata/netdata/pull/3928: # Fire the alarm as soon as it's going on battery (99% charge) and clear only when full. -template: apcupsd_ups_charge - on: apcupsd.charge - os: * - hosts: * - lookup: average -60s unaligned of charge - units: % - every: 60s - warn: $this < 100 - crit: $this < (($status == $CRITICAL) ? (60) : (50)) - delay: down 10m multiplier 1.5 max 1h - info: average UPS charge over the last minute - to: sitemgr + template: apcupsd_ups_charge + on: apcupsd.charge + class: Power Supply +component: UPS + type: Errors + os: * + hosts: * + lookup: average -60s unaligned of charge + units: % + every: 60s + warn: $this < 100 + crit: $this < (($status == $CRITICAL) ? (60) : (50)) + delay: down 10m multiplier 1.5 max 1h + info: average UPS charge over the last minute + to: sitemgr -template: apcupsd_last_collected_secs - on: apcupsd.load - calc: $now - $last_collected_t - every: 10s - units: seconds ago - warn: $this > (($status >= $WARNING) ? ($update_every) : ( 5 * $update_every)) - crit: $this > (($status == $CRITICAL) ? ($update_every) : (60 * $update_every)) - delay: down 5m multiplier 1.5 max 1h - info: number of seconds since the last successful data collection - to: sitemgr + template: apcupsd_last_collected_secs + on: apcupsd.load + class: Power Supply +component: UPS device + type: Latency + calc: $now - $last_collected_t + every: 10s + units: seconds ago + warn: $this > (($status >= $WARNING) ? ($update_every) : ( 5 * $update_every)) + crit: $this > (($status == $CRITICAL) ? ($update_every) : (60 * $update_every)) + delay: down 5m multiplier 1.5 max 1h + info: number of seconds since the last successful data collection + to: sitemgr diff --git a/health/health.d/backend.conf b/health/health.d/backend.conf index 8089dc94..948ea551 100644 --- a/health/health.d/backend.conf +++ b/health/health.d/backend.conf @@ -1,33 +1,42 @@ # Alert that backends subsystem will be disabled soon - alarm: backend_metrics_eol - on: netdata.backend_metrics - units: boolean - calc: $now - $last_collected_t - every: 1m - warn: $this > 0 - delay: down 5m multiplier 1.5 max 1h - info: the backends subsystem is deprecated and will be removed soon. Migrate your configuration to exporting.conf. - to: sysadmin + alarm: backend_metrics_eol + on: netdata.backend_metrics + class: Netdata +component: Exporting engine + type: Errors + units: boolean + calc: $now - $last_collected_t + every: 1m + warn: $this > 0 + delay: down 5m multiplier 1.5 max 1h + info: the backends subsystem is deprecated and will be removed soon. Migrate your configuration to exporting.conf. + to: sysadmin # make sure we are sending data to backend - alarm: backend_last_buffering - on: netdata.backend_metrics - calc: $now - $last_collected_t - units: seconds ago - every: 10s - warn: $this > (($status >= $WARNING) ? ($update_every) : ( 5 * $update_every)) - crit: $this > (($status == $CRITICAL) ? ($update_every) : (60 * $update_every)) - delay: down 5m multiplier 1.5 max 1h - info: number of seconds since the last successful buffering of backend data - to: dba + alarm: backend_last_buffering + on: netdata.backend_metrics + class: Netdata +component: Exporting engine + type: Latency + calc: $now - $last_collected_t + units: seconds ago + every: 10s + warn: $this > (($status >= $WARNING) ? ($update_every) : ( 5 * $update_every)) + crit: $this > (($status == $CRITICAL) ? ($update_every) : (60 * $update_every)) + delay: down 5m multiplier 1.5 max 1h + info: number of seconds since the last successful buffering of backend data + to: dba - alarm: backend_metrics_sent - on: netdata.backend_metrics - units: % - calc: abs($sent) * 100 / abs($buffered) - every: 10s - warn: $this != 100 - delay: down 5m multiplier 1.5 max 1h - info: percentage of metrics sent to the backend server - to: dba + alarm: backend_metrics_sent + on: netdata.backend_metrics + class: Netdata +component: Exporting engine + type: Workload + units: % + calc: abs($sent) * 100 / abs($buffered) + every: 10s + warn: $this != 100 + delay: down 5m multiplier 1.5 max 1h + info: percentage of metrics sent to the backend server + to: dba diff --git a/health/health.d/bcache.conf b/health/health.d/bcache.conf index d5fccf4f..d75d8e19 100644 --- a/health/health.d/bcache.conf +++ b/health/health.d/bcache.conf @@ -1,24 +1,30 @@ -template: bcache_cache_errors - on: disk.bcache_cache_read_races - lookup: sum -1m unaligned absolute - units: errors - every: 1m - warn: $this > 0 - delay: up 2m down 1h multiplier 1.5 max 2h - info: number of times data was read from the cache, \ - the bucket was reused and invalidated in the last 10 minutes \ - (when this occurs the data is reread from the backing device) - to: sysadmin + template: bcache_cache_errors + on: disk.bcache_cache_read_races + class: System +component: Disk + type: Errors + lookup: sum -1m unaligned absolute + units: errors + every: 1m + warn: $this > 0 + delay: up 2m down 1h multiplier 1.5 max 2h + info: number of times data was read from the cache, \ + the bucket was reused and invalidated in the last 10 minutes \ + (when this occurs the data is reread from the backing device) + to: sysadmin -template: bcache_cache_dirty - on: disk.bcache_cache_alloc - calc: $dirty + $metadata + $undefined - units: % - every: 1m - warn: $this > ( ($status >= $WARNING ) ? ( 70 ) : ( 90 ) ) - crit: $this > ( ($status == $CRITICAL) ? ( 90 ) : ( 95 ) ) - delay: up 1m down 1h multiplier 1.5 max 2h - info: percentage of cache space used for dirty data and metadata \ - (this usually means your SSD cache is too small) - to: sysadmin + template: bcache_cache_dirty + on: disk.bcache_cache_alloc + class: System +component: Disk + type: Utilization + calc: $dirty + $metadata + $undefined + units: % + every: 1m + warn: $this > ( ($status >= $WARNING ) ? ( 70 ) : ( 90 ) ) + crit: $this > ( ($status == $CRITICAL) ? ( 90 ) : ( 95 ) ) + delay: up 1m down 1h multiplier 1.5 max 2h + info: percentage of cache space used for dirty data and metadata \ + (this usually means your SSD cache is too small) + to: sysadmin diff --git a/health/health.d/beanstalkd.conf b/health/health.d/beanstalkd.conf index 0c428ecb..99c75457 100644 --- a/health/health.d/beanstalkd.conf +++ b/health/health.d/beanstalkd.conf @@ -1,17 +1,20 @@ # get the number of buried jobs in all queues -template: beanstalk_server_buried_jobs - on: beanstalk.current_jobs - calc: $buried - units: jobs - every: 10s - warn: $this > 0 - crit: $this > 10 - delay: up 0 down 5m multiplier 1.2 max 1h - info: number of buried jobs across all tubes. \ - You need to manually kick them so they can be processed. \ - Presence of buried jobs in a tube does not affect new jobs. - to: sysadmin + template: beanstalk_server_buried_jobs + on: beanstalk.current_jobs + class: Messaging +component: Beanstalk + type: Workload + calc: $buried + units: jobs + every: 10s + warn: $this > 0 + crit: $this > 10 + delay: up 0 down 5m multiplier 1.2 max 1h + info: number of buried jobs across all tubes. \ + You need to manually kick them so they can be processed. \ + Presence of buried jobs in a tube does not affect new jobs. + to: sysadmin # get the number of buried jobs per queue diff --git a/health/health.d/bind_rndc.conf b/health/health.d/bind_rndc.conf index 5cc7a72f..e88f87a4 100644 --- a/health/health.d/bind_rndc.conf +++ b/health/health.d/bind_rndc.conf @@ -1,9 +1,12 @@ -template: bind_rndc_stats_file_size - on: bind_rndc.stats_size - units: megabytes - every: 60 - calc: $stats_size - warn: $this > 512 - crit: $this > 1024 - info: BIND statistics-file size - to: sysadmin + template: bind_rndc_stats_file_size + on: bind_rndc.stats_size + class: DNS +component: BIND + type: Utilization + units: megabytes + every: 60 + calc: $stats_size + warn: $this > 512 + crit: $this > 1024 + info: BIND statistics-file size + to: sysadmin diff --git a/health/health.d/boinc.conf b/health/health.d/boinc.conf index 25b7f199..8604abee 100644 --- a/health/health.d/boinc.conf +++ b/health/health.d/boinc.conf @@ -1,62 +1,74 @@ # Alarms for various BOINC issues. # Warn on any compute errors encountered. -template: boinc_compute_errors - on: boinc.states - os: * - hosts: * -families: * - lookup: average -10m unaligned of comperror - units: tasks - every: 1m - warn: $this > 0 - crit: $this > 1 - delay: up 1m down 5m multiplier 1.5 max 1h - info: average number of compute errors over the last 10 minutes - to: sysadmin + template: boinc_compute_errors + on: boinc.states + class: Computing +component: BOINC + type: Errors + os: * + hosts: * + families: * + lookup: average -10m unaligned of comperror + units: tasks + every: 1m + warn: $this > 0 + crit: $this > 1 + delay: up 1m down 5m multiplier 1.5 max 1h + info: average number of compute errors over the last 10 minutes + to: sysadmin # Warn on lots of upload errors -template: boinc_upload_errors - on: boinc.states - os: * - hosts: * -families: * - lookup: average -10m unaligned of upload_failed - units: tasks - every: 1m - warn: $this > 0 - crit: $this > 1 - delay: up 1m down 5m multiplier 1.5 max 1h - info: average number of failed uploads over the last 10 minutes - to: sysadmin + template: boinc_upload_errors + on: boinc.states + class: Computing +component: BOINC + type: Errors + os: * + hosts: * + families: * + lookup: average -10m unaligned of upload_failed + units: tasks + every: 1m + warn: $this > 0 + crit: $this > 1 + delay: up 1m down 5m multiplier 1.5 max 1h + info: average number of failed uploads over the last 10 minutes + to: sysadmin # Warn on the task queue being empty -template: boinc_total_tasks - on: boinc.tasks - os: * - hosts: * -families: * - lookup: average -10m unaligned of total - units: tasks - every: 1m - warn: $this < 1 - crit: $this < 0.1 - delay: up 5m down 10m multiplier 1.5 max 1h - info: average number of total tasks over the last 10 minutes - to: sysadmin + template: boinc_total_tasks + on: boinc.tasks + class: Computing +component: BOINC + type: Utilization + os: * + hosts: * + families: * + lookup: average -10m unaligned of total + units: tasks + every: 1m + warn: $this < 1 + crit: $this < 0.1 + delay: up 5m down 10m multiplier 1.5 max 1h + info: average number of total tasks over the last 10 minutes + to: sysadmin # Warn on no active tasks with a non-empty queue -template: boinc_active_tasks - on: boinc.tasks - os: * - hosts: * -families: * - lookup: average -10m unaligned of active - calc: ($boinc_total_tasks >= 1) ? ($this) : (inf) - units: tasks - every: 1m - warn: $this < 1 - crit: $this < 0.1 - delay: up 5m down 10m multiplier 1.5 max 1h - info: average number of active tasks over the last 10 minutes - to: sysadmin + template: boinc_active_tasks + on: boinc.tasks + class: Computing +component: BOINC + type: Utilization + os: * + hosts: * + families: * + lookup: average -10m unaligned of active + calc: ($boinc_total_tasks >= 1) ? ($this) : (inf) + units: tasks + every: 1m + warn: $this < 1 + crit: $this < 0.1 + delay: up 5m down 10m multiplier 1.5 max 1h + info: average number of active tasks over the last 10 minutes + to: sysadmin diff --git a/health/health.d/btrfs.conf b/health/health.d/btrfs.conf index 93ab8748..d3200a7e 100644 --- a/health/health.d/btrfs.conf +++ b/health/health.d/btrfs.conf @@ -1,56 +1,68 @@ -template: btrfs_allocated - on: btrfs.disk - os: * - hosts: * -families: * - calc: 100 - ($unallocated * 100 / ($unallocated + $data_used + $data_free + $meta_used + $meta_free + $sys_used + $sys_free)) - units: % - every: 10s - warn: $this > (($status >= $WARNING) ? (90) : (95)) - crit: $this > (($status == $CRITICAL) ? (95) : (98)) - delay: up 1m down 15m multiplier 1.5 max 1h - info: percentage of allocated BTRFS physical disk space - to: sysadmin + template: btrfs_allocated + on: btrfs.disk + class: System +component: File system + type: Utilization + os: * + hosts: * + families: * + calc: 100 - ($unallocated * 100 / ($unallocated + $data_used + $data_free + $meta_used + $meta_free + $sys_used + $sys_free)) + units: % + every: 10s + warn: $this > (($status >= $WARNING) ? (90) : (95)) + crit: $this > (($status == $CRITICAL) ? (95) : (98)) + delay: up 1m down 15m multiplier 1.5 max 1h + info: percentage of allocated BTRFS physical disk space + to: sysadmin -template: btrfs_data - on: btrfs.data - os: * - hosts: * -families: * - calc: $used * 100 / ($used + $free) - units: % - every: 10s - warn: $this > (($status >= $WARNING) ? (90) : (95)) && $btrfs_allocated > 98 - crit: $this > (($status == $CRITICAL) ? (95) : (98)) && $btrfs_allocated > 98 - delay: up 1m down 15m multiplier 1.5 max 1h - info: utilization of BTRFS data space - to: sysadmin + template: btrfs_data + on: btrfs.data + class: System +component: File system + type: Utilization + os: * + hosts: * + families: * + calc: $used * 100 / ($used + $free) + units: % + every: 10s + warn: $this > (($status >= $WARNING) ? (90) : (95)) && $btrfs_allocated > 98 + crit: $this > (($status == $CRITICAL) ? (95) : (98)) && $btrfs_allocated > 98 + delay: up 1m down 15m multiplier 1.5 max 1h + info: utilization of BTRFS data space + to: sysadmin -template: btrfs_metadata - on: btrfs.metadata - os: * - hosts: * -families: * - calc: ($used + $reserved) * 100 / ($used + $free + $reserved) - units: % - every: 10s - warn: $this > (($status >= $WARNING) ? (90) : (95)) && $btrfs_allocated > 98 - crit: $this > (($status == $CRITICAL) ? (95) : (98)) && $btrfs_allocated > 98 - delay: up 1m down 15m multiplier 1.5 max 1h - info: utilization of BTRFS metadata space - to: sysadmin + template: btrfs_metadata + on: btrfs.metadata + class: System +component: File system + type: Utilization + os: * + hosts: * + families: * + calc: ($used + $reserved) * 100 / ($used + $free + $reserved) + units: % + every: 10s + warn: $this > (($status >= $WARNING) ? (90) : (95)) && $btrfs_allocated > 98 + crit: $this > (($status == $CRITICAL) ? (95) : (98)) && $btrfs_allocated > 98 + delay: up 1m down 15m multiplier 1.5 max 1h + info: utilization of BTRFS metadata space + to: sysadmin -template: btrfs_system - on: btrfs.system - os: * - hosts: * -families: * - calc: $used * 100 / ($used + $free) - units: % - every: 10s - warn: $this > (($status >= $WARNING) ? (90) : (95)) && $btrfs_allocated > 98 - crit: $this > (($status == $CRITICAL) ? (95) : (98)) && $btrfs_allocated > 98 - delay: up 1m down 15m multiplier 1.5 max 1h - info: utilization of BTRFS system space - to: sysadmin + template: btrfs_system + on: btrfs.system + class: System +component: File system + type: Utilization + os: * + hosts: * + families: * + calc: $used * 100 / ($used + $free) + units: % + every: 10s + warn: $this > (($status >= $WARNING) ? (90) : (95)) && $btrfs_allocated > 98 + crit: $this > (($status == $CRITICAL) ? (95) : (98)) && $btrfs_allocated > 98 + delay: up 1m down 15m multiplier 1.5 max 1h + info: utilization of BTRFS system space + to: sysadmin diff --git a/health/health.d/ceph.conf b/health/health.d/ceph.conf index cdbab0f6..ed8f9b4b 100644 --- a/health/health.d/ceph.conf +++ b/health/health.d/ceph.conf @@ -1,12 +1,15 @@ # low ceph disk available -template: ceph_cluster_space_usage - on: ceph.general_usage - calc: $used * 100 / ($used + $avail) - units: % - every: 1m - warn: $this > (($status >= $WARNING ) ? (85) : (90)) - crit: $this > (($status == $CRITICAL) ? (90) : (98)) - delay: down 5m multiplier 1.2 max 1h - info: cluster disk space utilization - to: sysadmin + template: ceph_cluster_space_usage + on: ceph.general_usage + class: Storage +component: Ceph + type: Utilization + calc: $used * 100 / ($used + $avail) + units: % + every: 1m + warn: $this > (($status >= $WARNING ) ? (85) : (90)) + crit: $this > (($status == $CRITICAL) ? (90) : (98)) + delay: down 5m multiplier 1.2 max 1h + info: cluster disk space utilization + to: sysadmin diff --git a/health/health.d/cgroups.conf b/health/health.d/cgroups.conf index c0a16f15..068533f1 100644 --- a/health/health.d/cgroups.conf +++ b/health/health.d/cgroups.conf @@ -1,28 +1,34 @@ # you can disable an alarm notification by setting the 'to' line to: silent -template: cgroup_10min_cpu_usage - on: cgroup.cpu_limit - os: linux - hosts: * - lookup: average -10m unaligned - units: % - every: 1m - warn: $this > (($status >= $WARNING) ? (75) : (85)) - crit: $this > (($status == $CRITICAL) ? (85) : (95)) - delay: down 15m multiplier 1.5 max 1h - info: average cgroup CPU utilization over the last 10 minutes - to: sysadmin + template: cgroup_10min_cpu_usage + on: cgroup.cpu_limit + class: Cgroups +component: CPU + type: Utilization + os: linux + hosts: * + lookup: average -10m unaligned + units: % + every: 1m + warn: $this > (($status >= $WARNING) ? (75) : (85)) + crit: $this > (($status == $CRITICAL) ? (85) : (95)) + delay: down 15m multiplier 1.5 max 1h + info: average cgroup CPU utilization over the last 10 minutes + to: sysadmin -template: cgroup_ram_in_use - on: cgroup.mem_usage - os: linux - hosts: * - calc: ($ram) * 100 / $memory_limit - units: % - every: 10s - warn: $this > (($status >= $WARNING) ? (80) : (90)) - crit: $this > (($status == $CRITICAL) ? (90) : (98)) - delay: down 15m multiplier 1.5 max 1h - info: cgroup memory utilization - to: sysadmin + template: cgroup_ram_in_use + on: cgroup.mem_usage + class: Cgroups +component: Memory + type: Utilization + os: linux + hosts: * + calc: ($ram) * 100 / $memory_limit + units: % + every: 10s + warn: $this > (($status >= $WARNING) ? (80) : (90)) + crit: $this > (($status == $CRITICAL) ? (90) : (98)) + delay: down 15m multiplier 1.5 max 1h + info: cgroup memory utilization + to: sysadmin diff --git a/health/health.d/cockroachdb.conf b/health/health.d/cockroachdb.conf index 47773d04..dccd2b06 100644 --- a/health/health.d/cockroachdb.conf +++ b/health/health.d/cockroachdb.conf @@ -1,91 +1,115 @@ # Availability -template: cockroachdb_last_collected_secs - on: cockroachdb.live_nodes - calc: $now - $last_collected_t - units: seconds ago - every: 10s - warn: $this > (($status >= $WARNING) ? ($update_every) : ( 5 * $update_every)) - crit: $this > (($status == $CRITICAL) ? ($update_every) : (60 * $update_every)) - delay: down 5m multiplier 1.5 max 1h - info: number of seconds since the last successful data collection - to: dba + template: cockroachdb_last_collected_secs + on: cockroachdb.live_nodes + class: Database +component: CockroachDB + type: Latency + calc: $now - $last_collected_t + units: seconds ago + every: 10s + warn: $this > (($status >= $WARNING) ? ($update_every) : ( 5 * $update_every)) + crit: $this > (($status == $CRITICAL) ? ($update_every) : (60 * $update_every)) + delay: down 5m multiplier 1.5 max 1h + info: number of seconds since the last successful data collection + to: dba # Capacity -template: cockroachdb_used_storage_capacity - on: cockroachdb.storage_used_capacity_percentage - calc: $capacity_used_percent - units: % - every: 10s - warn: $this > (($status >= $WARNING) ? (80) : (85)) - crit: $this > (($status == $CRITICAL) ? (85) : (95)) - delay: down 15m multiplier 1.5 max 1h - info: storage capacity utilization - to: dba + template: cockroachdb_used_storage_capacity + on: cockroachdb.storage_used_capacity_percentage + class: Database +component: CockroachDB + type: Utilization + calc: $capacity_used_percent + units: % + every: 10s + warn: $this > (($status >= $WARNING) ? (80) : (85)) + crit: $this > (($status == $CRITICAL) ? (85) : (95)) + delay: down 15m multiplier 1.5 max 1h + info: storage capacity utilization + to: dba -template: cockroachdb_used_usable_storage_capacity - on: cockroachdb.storage_used_capacity_percentage - calc: $capacity_usable_used_percent - units: % - every: 10s - warn: $this > (($status >= $WARNING) ? (80) : (85)) - crit: $this > (($status == $CRITICAL) ? (85) : (95)) - delay: down 15m multiplier 1.5 max 1h - info: storage usable space utilization - to: dba + template: cockroachdb_used_usable_storage_capacity + on: cockroachdb.storage_used_capacity_percentage + class: Database +component: CockroachDB + type: Utilization + calc: $capacity_usable_used_percent + units: % + every: 10s + warn: $this > (($status >= $WARNING) ? (80) : (85)) + crit: $this > (($status == $CRITICAL) ? (85) : (95)) + delay: down 15m multiplier 1.5 max 1h + info: storage usable space utilization + to: dba # Replication -template: cockroachdb_unavailable_ranges - on: cockroachdb.ranges_replication_problem - calc: $ranges_unavailable - units: num - every: 10s - warn: $this > 0 - delay: down 15m multiplier 1.5 max 1h - info: number of ranges with fewer live replicas than the replication target - to: dba + template: cockroachdb_unavailable_ranges + on: cockroachdb.ranges_replication_problem + class: Database +component: CockroachDB + type: Utilization + calc: $ranges_unavailable + units: num + every: 10s + warn: $this > 0 + delay: down 15m multiplier 1.5 max 1h + info: number of ranges with fewer live replicas than the replication target + to: dba -template: cockroachdb_replicas_leaders_not_leaseholders - on: cockroachdb.replicas_leaders - calc: $replicas_leaders_not_leaseholders - units: num - every: 10s - warn: $this > 0 - delay: down 15m multiplier 1.5 max 1h - info: number of replicas that are Raft leaders whose range lease is held by another store - to: dba + template: cockroachdb_replicas_leaders_not_leaseholders + on: cockroachdb.replicas_leaders + class: Database +component: CockroachDB + type: Utilization + calc: $replicas_leaders_not_leaseholders + units: num + every: 10s + warn: $this > 0 + delay: down 15m multiplier 1.5 max 1h + info: number of replicas that are Raft leaders whose range lease is held by another store + to: dba # FD -template: cockroachdb_open_file_descriptors_limit - on: cockroachdb.process_file_descriptors - calc: $sys_fd_open/$sys_fd_softlimit * 100 - units: % - every: 10s - warn: $this > 80 - delay: down 15m multiplier 1.5 max 1h - info: open file descriptors utilization (against softlimit) - to: dba + template: cockroachdb_open_file_descriptors_limit + on: cockroachdb.process_file_descriptors + class: Database +component: CockroachDB + type: Utilization + calc: $sys_fd_open/$sys_fd_softlimit * 100 + units: % + every: 10s + warn: $this > 80 + delay: down 15m multiplier 1.5 max 1h + info: open file descriptors utilization (against softlimit) + to: dba # SQL -template: cockroachdb_sql_active_connections - on: cockroachdb.sql_connections - calc: $sql_conns - units: active connections - every: 10s - info: number of active SQL connections - to: dba + template: cockroachdb_sql_active_connections + on: cockroachdb.sql_connections + class: Database +component: CockroachDB + type: Utilization + calc: $sql_conns + units: active connections + every: 10s + info: number of active SQL connections + to: dba -template: cockroachdb_sql_executed_statements_total_last_5m - on: cockroachdb.sql_statements_total - lookup: sum -5m absolute of sql_query_count - units: statements - every: 10s - warn: $this == 0 AND $cockroachdb_sql_active_connections != 0 - delay: down 15m up 30s multiplier 1.5 max 1h - info: number of executed SQL statements in the last 5 minutes - to: dba + template: cockroachdb_sql_executed_statements_total_last_5m + on: cockroachdb.sql_statements_total + class: Database +component: CockroachDB + type: Workload + lookup: sum -5m absolute of sql_query_count + units: statements + every: 10s + warn: $this == 0 AND $cockroachdb_sql_active_connections != 0 + delay: down 15m up 30s multiplier 1.5 max 1h + info: number of executed SQL statements in the last 5 minutes + to: dba diff --git a/health/health.d/couchdb.conf b/health/health.d/couchdb.conf index 4a289528..c86c6b98 100644 --- a/health/health.d/couchdb.conf +++ b/health/health.d/couchdb.conf @@ -1,13 +1,16 @@ # make sure couchdb is running -template: couchdb_last_collected_secs - on: couchdb.request_methods - calc: $now - $last_collected_t - units: seconds ago - every: 10s - warn: $this > (($status >= $WARNING) ? ($update_every) : ( 5 * $update_every)) - crit: $this > (($status == $CRITICAL) ? ($update_every) : (60 * $update_every)) - delay: down 5m multiplier 1.5 max 1h - info: number of seconds since the last successful data collection - to: dba + template: couchdb_last_collected_secs + on: couchdb.request_methods + class: Database +component: CouchDB + type: Latency + calc: $now - $last_collected_t + units: seconds ago + every: 10s + warn: $this > (($status >= $WARNING) ? ($update_every) : ( 5 * $update_every)) + crit: $this > (($status == $CRITICAL) ? ($update_every) : (60 * $update_every)) + delay: down 5m multiplier 1.5 max 1h + info: number of seconds since the last successful data collection + to: dba diff --git a/health/health.d/cpu.conf b/health/health.d/cpu.conf index 32c69f8f..d1121576 100644 --- a/health/health.d/cpu.conf +++ b/health/health.d/cpu.conf @@ -1,55 +1,67 @@ # you can disable an alarm notification by setting the 'to' line to: silent -template: 10min_cpu_usage - on: system.cpu - os: linux - hosts: * - lookup: average -10m unaligned of user,system,softirq,irq,guest - units: % - every: 1m - warn: $this > (($status >= $WARNING) ? (75) : (85)) - crit: $this > (($status == $CRITICAL) ? (85) : (95)) - delay: down 15m multiplier 1.5 max 1h - info: average CPU utilization over the last 10 minutes (excluding iowait, nice and steal) - to: sysadmin + template: 10min_cpu_usage + on: system.cpu + class: System +component: CPU + type: Utilization + os: linux + hosts: * + lookup: average -10m unaligned of user,system,softirq,irq,guest + units: % + every: 1m + warn: $this > (($status >= $WARNING) ? (75) : (85)) + crit: $this > (($status == $CRITICAL) ? (85) : (95)) + delay: down 15m multiplier 1.5 max 1h + info: average CPU utilization over the last 10 minutes (excluding iowait, nice and steal) + to: sysadmin -template: 10min_cpu_iowait - on: system.cpu - os: linux - hosts: * - lookup: average -10m unaligned of iowait - units: % - every: 1m - warn: $this > (($status >= $WARNING) ? (20) : (40)) - crit: $this > (($status == $CRITICAL) ? (40) : (50)) - delay: down 15m multiplier 1.5 max 1h - info: average CPU iowait time over the last 10 minutes - to: sysadmin + template: 10min_cpu_iowait + on: system.cpu + class: System +component: CPU + type: Utilization + os: linux + hosts: * + lookup: average -10m unaligned of iowait + units: % + every: 1m + warn: $this > (($status >= $WARNING) ? (20) : (40)) + crit: $this > (($status == $CRITICAL) ? (40) : (50)) + delay: down 15m multiplier 1.5 max 1h + info: average CPU iowait time over the last 10 minutes + to: sysadmin -template: 20min_steal_cpu - on: system.cpu - os: linux - hosts: * - lookup: average -20m unaligned of steal - units: % - every: 5m - warn: $this > (($status >= $WARNING) ? (5) : (10)) - crit: $this > (($status == $CRITICAL) ? (20) : (30)) - delay: down 1h multiplier 1.5 max 2h - info: average CPU steal time over the last 20 minutes - to: sysadmin + template: 20min_steal_cpu + on: system.cpu + class: System +component: CPU + type: Latency + os: linux + hosts: * + lookup: average -20m unaligned of steal + units: % + every: 5m + warn: $this > (($status >= $WARNING) ? (5) : (10)) + crit: $this > (($status == $CRITICAL) ? (20) : (30)) + delay: down 1h multiplier 1.5 max 2h + info: average CPU steal time over the last 20 minutes + to: sysadmin ## FreeBSD -template: 10min_cpu_usage - on: system.cpu - os: freebsd - hosts: * - lookup: average -10m unaligned of user,system,interrupt - units: % - every: 1m - warn: $this > (($status >= $WARNING) ? (75) : (85)) - crit: $this > (($status == $CRITICAL) ? (85) : (95)) - delay: down 15m multiplier 1.5 max 1h - info: average CPU utilization over the last 10 minutes (excluding nice) - to: sysadmin + template: 10min_cpu_usage + on: system.cpu + class: System +component: CPU + type: Utilization + os: freebsd + hosts: * + lookup: average -10m unaligned of user,system,interrupt + units: % + every: 1m + warn: $this > (($status >= $WARNING) ? (75) : (85)) + crit: $this > (($status == $CRITICAL) ? (85) : (95)) + delay: down 15m multiplier 1.5 max 1h + info: average CPU utilization over the last 10 minutes (excluding nice) + to: sysadmin diff --git a/health/health.d/dbengine.conf b/health/health.d/dbengine.conf index 3e51d37e..79c156ab 100644 --- a/health/health.d/dbengine.conf +++ b/health/health.d/dbengine.conf @@ -1,52 +1,64 @@ # you can disable an alarm notification by setting the 'to' line to: silent - alarm: 10min_dbengine_global_fs_errors - on: netdata.dbengine_global_errors - os: linux freebsd macos - hosts: * -lookup: sum -10m unaligned of fs_errors - units: errors - every: 10s - crit: $this > 0 - delay: down 15m multiplier 1.5 max 1h - info: number of filesystem errors in the last 10 minutes (too many open files, wrong permissions, etc) - to: sysadmin + alarm: 10min_dbengine_global_fs_errors + on: netdata.dbengine_global_errors + class: Netdata +component: DB engine + type: Errors + os: linux freebsd macos + hosts: * + lookup: sum -10m unaligned of fs_errors + units: errors + every: 10s + crit: $this > 0 + delay: down 15m multiplier 1.5 max 1h + info: number of filesystem errors in the last 10 minutes (too many open files, wrong permissions, etc) + to: sysadmin - alarm: 10min_dbengine_global_io_errors - on: netdata.dbengine_global_errors - os: linux freebsd macos - hosts: * -lookup: sum -10m unaligned of io_errors - units: errors - every: 10s - crit: $this > 0 - delay: down 1h multiplier 1.5 max 3h - info: number of IO errors in the last 10 minutes (CRC errors, out of space, bad disk, etc) - to: sysadmin + alarm: 10min_dbengine_global_io_errors + on: netdata.dbengine_global_errors + class: Netdata +component: DB engine + type: Errors + os: linux freebsd macos + hosts: * + lookup: sum -10m unaligned of io_errors + units: errors + every: 10s + crit: $this > 0 + delay: down 1h multiplier 1.5 max 3h + info: number of IO errors in the last 10 minutes (CRC errors, out of space, bad disk, etc) + to: sysadmin - alarm: 10min_dbengine_global_flushing_warnings - on: netdata.dbengine_global_errors - os: linux freebsd macos - hosts: * -lookup: sum -10m unaligned of pg_cache_over_half_dirty_events - units: errors - every: 10s - warn: $this > 0 - delay: down 1h multiplier 1.5 max 3h - info: number of times when dbengine dirty pages were over 50% of the instance's page cache in the last 10 minutes. \ - Metric data are at risk of not being stored in the database. To remedy, reduce disk load or use faster disks. - to: sysadmin + alarm: 10min_dbengine_global_flushing_warnings + on: netdata.dbengine_global_errors + class: Netdata +component: DB engine + type: Errors + os: linux freebsd macos + hosts: * + lookup: sum -10m unaligned of pg_cache_over_half_dirty_events + units: errors + every: 10s + warn: $this > 0 + delay: down 1h multiplier 1.5 max 3h + info: number of times when dbengine dirty pages were over 50% of the instance's page cache in the last 10 minutes. \ + Metric data are at risk of not being stored in the database. To remedy, reduce disk load or use faster disks. + to: sysadmin - alarm: 10min_dbengine_global_flushing_errors - on: netdata.dbengine_long_term_page_stats - os: linux freebsd macos - hosts: * -lookup: sum -10m unaligned of flushing_pressure_deletions - units: pages - every: 10s - crit: $this != 0 - delay: down 1h multiplier 1.5 max 3h - info: number of pages deleted due to failure to flush data to disk in the last 10 minutes. \ - Metric data were lost to unblock data collection. To fix, reduce disk load or use faster disks. - to: sysadmin + alarm: 10min_dbengine_global_flushing_errors + on: netdata.dbengine_long_term_page_stats + class: Netdata +component: DB engine + type: Errors + os: linux freebsd macos + hosts: * + lookup: sum -10m unaligned of flushing_pressure_deletions + units: pages + every: 10s + crit: $this != 0 + delay: down 1h multiplier 1.5 max 3h + info: number of pages deleted due to failure to flush data to disk in the last 10 minutes. \ + Metric data were lost to unblock data collection. To fix, reduce disk load or use faster disks. + to: sysadmin diff --git a/health/health.d/disks.conf b/health/health.d/disks.conf index d0cd60cf..60f8faed 100644 --- a/health/health.d/disks.conf +++ b/health/health.d/disks.conf @@ -9,33 +9,39 @@ # raise an alarm if the disk is low on # available disk space -template: disk_space_usage - on: disk.space - os: linux freebsd - hosts: * -families: !/dev !/dev/* !/run !/run/* * - calc: $used * 100 / ($avail + $used) - units: % - every: 1m - warn: $this > (($status >= $WARNING ) ? (80) : (90)) - crit: $this > (($status == $CRITICAL) ? (90) : (98)) - delay: up 1m down 15m multiplier 1.5 max 1h - info: disk space utilization - to: sysadmin - -template: disk_inode_usage - on: disk.inodes - os: linux freebsd - hosts: * -families: !/dev !/dev/* !/run !/run/* * - calc: $used * 100 / ($avail + $used) - units: % - every: 1m - warn: $this > (($status >= $WARNING) ? (80) : (90)) - crit: $this > (($status == $CRITICAL) ? (90) : (98)) - delay: up 1m down 15m multiplier 1.5 max 1h - info: disk inode utilization - to: sysadmin + template: disk_space_usage + on: disk.space + class: System +component: Disk + type: Utilization + os: linux freebsd + hosts: * + families: !/dev !/dev/* !/run !/run/* * + calc: $used * 100 / ($avail + $used) + units: % + every: 1m + warn: $this > (($status >= $WARNING ) ? (80) : (90)) + crit: $this > (($status == $CRITICAL) ? (90) : (98)) + delay: up 1m down 15m multiplier 1.5 max 1h + info: disk $family space utilization + to: sysadmin + + template: disk_inode_usage + on: disk.inodes + class: System +component: Disk + type: Utilization + os: linux freebsd + hosts: * + families: !/dev !/dev/* !/run !/run/* * + calc: $used * 100 / ($avail + $used) + units: % + every: 1m + warn: $this > (($status >= $WARNING) ? (80) : (90)) + crit: $this > (($status == $CRITICAL) ? (90) : (98)) + delay: up 1m down 15m multiplier 1.5 max 1h + info: disk $family inode utilization + to: sysadmin # ----------------------------------------------------------------------------- @@ -128,21 +134,24 @@ families: !/dev !/dev/* !/run !/run/* * # by calculating the average disk utilization # for the last 10 minutes -template: 10min_disk_utilization - on: disk.util - os: linux freebsd - hosts: * -families: * - lookup: average -10m unaligned - units: % - every: 1m - green: 90 - red: 98 - warn: $this > $green * (($status >= $WARNING) ? (0.7) : (1)) - crit: $this > $red * (($status == $CRITICAL) ? (0.7) : (1)) - delay: down 15m multiplier 1.2 max 1h - info: average percentage of time the disk was busy over the last 10 minutes - to: silent + template: 10min_disk_utilization + on: disk.util + class: System +component: Disk + type: Utilization + os: linux freebsd + hosts: * + families: * + lookup: average -10m unaligned + units: % + every: 1m + green: 90 + red: 98 + warn: $this > $green * (($status >= $WARNING) ? (0.7) : (1)) + crit: $this > $red * (($status == $CRITICAL) ? (0.7) : (1)) + delay: down 15m multiplier 1.2 max 1h + info: average percentage of time $family disk was busy over the last 10 minutes + to: silent # raise an alarm if the disk backlog @@ -150,18 +159,21 @@ families: * # for 10 minutes # (i.e. the disk cannot catch up) -template: 10min_disk_backlog - on: disk.backlog - os: linux - hosts: * -families: * - lookup: average -10m unaligned - units: ms - every: 1m - green: 2000 - red: 5000 - warn: $this > $green * (($status >= $WARNING) ? (0.7) : (1)) - crit: $this > $red * (($status == $CRITICAL) ? (0.7) : (1)) - delay: down 15m multiplier 1.2 max 1h - info: average disk backlog size over the last 10 minutes - to: silent + template: 10min_disk_backlog + on: disk.backlog + class: System +component: Disk + type: Latency + os: linux + hosts: * + families: * + lookup: average -10m unaligned + units: ms + every: 1m + green: 2000 + red: 5000 + warn: $this > $green * (($status >= $WARNING) ? (0.7) : (1)) + crit: $this > $red * (($status == $CRITICAL) ? (0.7) : (1)) + delay: down 15m multiplier 1.2 max 1h + info: average backlog size of the $family disk over the last 10 minutes + to: silent diff --git a/health/health.d/dns_query.conf b/health/health.d/dns_query.conf index 64770b98..1fbb2c59 100644 --- a/health/health.d/dns_query.conf +++ b/health/health.d/dns_query.conf @@ -1,12 +1,15 @@ # detect dns query failure -template: dns_query_time_query_time - on: dns_query_time.query_time - lookup: average -10s unaligned foreach * - units: ms - every: 10s - warn: $this == nan - delay: up 20s down 5m multiplier 1.5 max 1h - info: average DNS query round trip time over the last 10 seconds - to: sysadmin + template: dns_query_time_query_time + on: dns_query_time.query_time + class: DNS +component: DNS + type: Latency + lookup: average -10s unaligned foreach * + units: ms + every: 10s + warn: $this == nan + delay: up 20s down 5m multiplier 1.5 max 1h + info: average DNS query round trip time over the last 10 seconds + to: sysadmin diff --git a/health/health.d/dnsmasq_dhcp.conf b/health/health.d/dnsmasq_dhcp.conf index dff1f07d..10d139f7 100644 --- a/health/health.d/dnsmasq_dhcp.conf +++ b/health/health.d/dnsmasq_dhcp.conf @@ -1,12 +1,15 @@ # dhcp-range utilization -template: dnsmasq_dhcp_dhcp_range_utilization - on: dnsmasq_dhcp.dhcp_range_utilization - every: 10s - units: % - calc: $used - warn: $this > ( ($status >= $WARNING ) ? ( 80 ) : ( 90 ) ) - crit: $this > ( ($status == $CRITICAL) ? ( 90 ) : ( 95 ) ) - delay: down 5m - info: DHCP range utilization - to: sysadmin + template: dnsmasq_dhcp_dhcp_range_utilization + on: dnsmasq_dhcp.dhcp_range_utilization + class: DHCP +component: Dnsmasq + type: Utilization + every: 10s + units: % + calc: $used + warn: $this > ( ($status >= $WARNING ) ? ( 80 ) : ( 90 ) ) + crit: $this > ( ($status == $CRITICAL) ? ( 90 ) : ( 95 ) ) + delay: down 5m + info: DHCP range utilization + to: sysadmin diff --git a/health/health.d/dockerd.conf b/health/health.d/dockerd.conf index 122d82b8..ba866f81 100644 --- a/health/health.d/dockerd.conf +++ b/health/health.d/dockerd.conf @@ -1,8 +1,11 @@ -template: docker_unhealthy_containers - on: docker.unhealthy_containers - units: unhealthy containers - every: 10s - lookup: average -10s - crit: $this > 0 - info: average number of unhealthy docker containers over the last 10 seconds - to: sysadmin + template: docker_unhealthy_containers + on: docker.unhealthy_containers + class: Containers +component: Docker + type: Errors + units: unhealthy containers + every: 10s + lookup: average -10s + crit: $this > 0 + info: average number of unhealthy docker containers over the last 10 seconds + to: sysadmin diff --git a/health/health.d/elasticsearch.conf b/health/health.d/elasticsearch.conf index f4423449..05d576c3 100644 --- a/health/health.d/elasticsearch.conf +++ b/health/health.d/elasticsearch.conf @@ -1,12 +1,15 @@ # make sure elasticsearch is running -template: elasticsearch_last_collected - on: elasticsearch.cluster_health_status - calc: $now - $last_collected_t - units: seconds ago - every: 10s - warn: $this > (($status >= $WARNING) ? ($update_every) : ( 5 * $update_every)) - crit: $this > (($status == $CRITICAL) ? ($update_every) : (60 * $update_every)) - info: number of seconds since the last successful data collection - to: sysadmin + template: elasticsearch_last_collected + on: elasticsearch.cluster_health_status + class: Search engine +component: Elasticsearch + type: Latency + calc: $now - $last_collected_t + units: seconds ago + every: 10s + warn: $this > (($status >= $WARNING) ? ($update_every) : ( 5 * $update_every)) + crit: $this > (($status == $CRITICAL) ? ($update_every) : (60 * $update_every)) + info: number of seconds since the last successful data collection + to: sysadmin diff --git a/health/health.d/entropy.conf b/health/health.d/entropy.conf index 0be9d45b..0478fa0b 100644 --- a/health/health.d/entropy.conf +++ b/health/health.d/entropy.conf @@ -3,14 +3,17 @@ # the alarm is checked every 1 minute # and examines the last hour of data - alarm: lowest_entropy - on: system.entropy - os: linux - hosts: * - lookup: min -5m unaligned - units: entries - every: 5m - warn: $this < (($status >= $WARNING) ? (200) : (100)) - delay: down 1h multiplier 1.5 max 2h - info: minimum number of entries in the random numbers pool in the last 5 minutes - to: silent + alarm: lowest_entropy + on: system.entropy + class: System +component: Cryptography + type: Utilization + os: linux + hosts: * + lookup: min -5m unaligned + units: entries + every: 5m + warn: $this < (($status >= $WARNING) ? (200) : (100)) + delay: down 1h multiplier 1.5 max 2h + info: minimum number of entries in the random numbers pool in the last 5 minutes + to: silent diff --git a/health/health.d/exporting.conf b/health/health.d/exporting.conf index 735fb5ae..4430f3fd 100644 --- a/health/health.d/exporting.conf +++ b/health/health.d/exporting.conf @@ -11,13 +11,16 @@ families: * info: number of seconds since the last successful buffering of exporting data to: dba -template: exporting_metrics_sent -families: * - on: exporting_data_size - units: % - calc: abs($sent) * 100 / abs($buffered) - every: 10s - warn: $this != 100 - delay: down 5m multiplier 1.5 max 1h - info: percentage of metrics sent to the external database server - to: dba + template: exporting_metrics_sent + families: * + on: exporting_data_size + class: Netdata +component: Exporting engine + type: Workload + units: % + calc: abs($sent) * 100 / abs($buffered) + every: 10s + warn: $this != 100 + delay: down 5m multiplier 1.5 max 1h + info: percentage of metrics sent to the external database server + to: dba diff --git a/health/health.d/fping.conf b/health/health.d/fping.conf index 92c1525b..120fe8f2 100644 --- a/health/health.d/fping.conf +++ b/health/health.d/fping.conf @@ -1,52 +1,64 @@ -template: fping_last_collected_secs -families: * - on: fping.latency - calc: $now - $last_collected_t - units: seconds ago - every: 10s - warn: $this > (($status >= $WARNING) ? ($update_every) : ( 5 * $update_every)) - crit: $this > (($status == $CRITICAL) ? ($update_every) : (60 * $update_every)) - delay: down 5m multiplier 1.5 max 1h - info: number of seconds since the last successful data collection - to: sysadmin + template: fping_last_collected_secs + families: * + on: fping.latency + class: Other +component: Network + type: Latency + calc: $now - $last_collected_t + units: seconds ago + every: 10s + warn: $this > (($status >= $WARNING) ? ($update_every) : ( 5 * $update_every)) + crit: $this > (($status == $CRITICAL) ? ($update_every) : (60 * $update_every)) + delay: down 5m multiplier 1.5 max 1h + info: number of seconds since the last successful data collection + to: sysadmin -template: fping_host_reachable -families: * - on: fping.latency - calc: $average != nan - units: up/down - every: 10s - crit: $this == 0 - delay: down 30m multiplier 1.5 max 2h - info: reachability status of the network host (0: unreachable, 1: reachable) - to: sysadmin + template: fping_host_reachable + families: * + on: fping.latency + class: Other +component: Network + type: Errors + calc: $average != nan + units: up/down + every: 10s + crit: $this == 0 + delay: down 30m multiplier 1.5 max 2h + info: reachability status of the network host (0: unreachable, 1: reachable) + to: sysadmin -template: fping_host_latency -families: * - on: fping.latency - lookup: average -10s unaligned of average - units: ms - every: 10s - green: 500 - red: 1000 - warn: $this > $green OR $max > $red - crit: $this > $red - delay: down 30m multiplier 1.5 max 2h - info: average latency to the network host over the last 10 seconds - to: sysadmin + template: fping_host_latency + families: * + on: fping.latency + class: Other +component: Network + type: Latency + lookup: average -10s unaligned of average + units: ms + every: 10s + green: 500 + red: 1000 + warn: $this > $green OR $max > $red + crit: $this > $red + delay: down 30m multiplier 1.5 max 2h + info: average latency to the network host over the last 10 seconds + to: sysadmin -template: fping_packet_loss -families: * - on: fping.quality - lookup: average -10m unaligned of returned - calc: 100 - $this - green: 1 - red: 10 - units: % - every: 10s - warn: $this > $green - crit: $this > $red - delay: down 30m multiplier 1.5 max 2h - info: packet loss ratio to the network host over the last 10 minutes - to: sysadmin + template: fping_packet_loss + families: * + on: fping.quality + class: System +component: Network + type: Errors + lookup: average -10m unaligned of returned + calc: 100 - $this + green: 1 + red: 10 + units: % + every: 10s + warn: $this > $green + crit: $this > $red + delay: down 30m multiplier 1.5 max 2h + info: packet loss ratio to the network host over the last 10 minutes + to: sysadmin diff --git a/health/health.d/fronius.conf b/health/health.d/fronius.conf index cdf6c8fc..81aafaa6 100644 --- a/health/health.d/fronius.conf +++ b/health/health.d/fronius.conf @@ -1,11 +1,14 @@ -template: fronius_last_collected_secs -families: * - on: fronius.power - calc: $now - $last_collected_t - every: 10s - units: seconds ago - warn: $this > (($status >= $WARNING) ? ($update_every) : ( 5 * $update_every)) - crit: $this > (($status == $CRITICAL) ? ($update_every) : (60 * $update_every)) - delay: down 5m multiplier 1.5 max 1h - info: number of seconds since the last successful data collection - to: sitemgr + template: fronius_last_collected_secs + families: * + on: fronius.power + class: Power Supply +component: Solar + type: Latency + calc: $now - $last_collected_t + every: 10s + units: seconds ago + warn: $this > (($status >= $WARNING) ? ($update_every) : ( 5 * $update_every)) + crit: $this > (($status == $CRITICAL) ? ($update_every) : (60 * $update_every)) + delay: down 5m multiplier 1.5 max 1h + info: number of seconds since the last successful data collection + to: sitemgr diff --git a/health/health.d/gearman.conf b/health/health.d/gearman.conf index d148f7b7..e2031bf2 100644 --- a/health/health.d/gearman.conf +++ b/health/health.d/gearman.conf @@ -1,22 +1,28 @@ # make sure Gearman is running -template: gearman_last_collected_secs - on: gearman.total_jobs - calc: $now - $last_collected_t - units: seconds ago - every: 10s - warn: $this > (($status >= $WARNING) ? ($update_every) : ( 5 * $update_every)) - crit: $this > (($status == $CRITICAL) ? ($update_every) : (60 * $update_every)) - delay: down 5m multiplier 1.5 max 1h - info: number of seconds since the last successful data collection - to: sysadmin + template: gearman_last_collected_secs + on: gearman.total_jobs + class: Computing +component: Gearman + type: Latency + calc: $now - $last_collected_t + units: seconds ago + every: 10s + warn: $this > (($status >= $WARNING) ? ($update_every) : ( 5 * $update_every)) + crit: $this > (($status == $CRITICAL) ? ($update_every) : (60 * $update_every)) + delay: down 5m multiplier 1.5 max 1h + info: number of seconds since the last successful data collection + to: sysadmin -template: gearman_workers_queued - on: gearman.single_job - lookup: average -10m unaligned match-names of Queued - units: workers - every: 10s - warn: $this > 30000 - crit: $this > 100000 - delay: down 5m multiplier 1.5 max 1h - info: average number of queued jobs over the last 10 minutes - to: sysadmin + template: gearman_workers_queued + on: gearman.single_job + class: Computing +component: Gearman + type: Latency + lookup: average -10m unaligned match-names of Queued + units: workers + every: 10s + warn: $this > 30000 + crit: $this > 100000 + delay: down 5m multiplier 1.5 max 1h + info: average number of queued jobs over the last 10 minutes + to: sysadmin diff --git a/health/health.d/haproxy.conf b/health/health.d/haproxy.conf index 9cd07066..9f6b1c57 100644 --- a/health/health.d/haproxy.conf +++ b/health/health.d/haproxy.conf @@ -1,27 +1,36 @@ -template: haproxy_backend_server_status - on: haproxy_hs.down - units: failed servers - every: 10s - lookup: average -10s - crit: $this > 0 - info: average number of failed haproxy backend servers over the last 10 seconds - to: sysadmin + template: haproxy_backend_server_status + on: haproxy_hs.down + class: Web Proxy +component: HAProxy + type: Errors + units: failed servers + every: 10s + lookup: average -10s + crit: $this > 0 + info: average number of failed haproxy backend servers over the last 10 seconds + to: sysadmin -template: haproxy_backend_status - on: haproxy_hb.down - units: failed backend - every: 10s - lookup: average -10s - crit: $this > 0 - info: average number of failed haproxy backends over the last 10 seconds - to: sysadmin + template: haproxy_backend_status + on: haproxy_hb.down + class: Web Proxy +component: HAProxy + type: Errors + units: failed backend + every: 10s + lookup: average -10s + crit: $this > 0 + info: average number of failed haproxy backends over the last 10 seconds + to: sysadmin -template: haproxy_last_collected - on: haproxy_hb.down - calc: $now - $last_collected_t - units: seconds ago - every: 10s - warn: $this > (($status >= $WARNING) ? ($update_every) : ( 5 * $update_every)) - crit: $this > (($status == $CRITICAL) ? ($update_every) : (60 * $update_every)) - info: number of seconds since the last successful data collection - to: sysadmin + template: haproxy_last_collected + on: haproxy_hb.down + class: Web Proxy +component: HAProxy + type: Latency + calc: $now - $last_collected_t + units: seconds ago + every: 10s + warn: $this > (($status >= $WARNING) ? ($update_every) : ( 5 * $update_every)) + crit: $this > (($status == $CRITICAL) ? ($update_every) : (60 * $update_every)) + info: number of seconds since the last successful data collection + to: sysadmin diff --git a/health/health.d/hdfs.conf b/health/health.d/hdfs.conf index 7345df4d..bd8308be 100644 --- a/health/health.d/hdfs.conf +++ b/health/health.d/hdfs.conf @@ -1,75 +1,93 @@ # make sure hdfs is running -template: hdfs_last_collected_secs - on: hdfs.heap_memory - calc: $now - $last_collected_t - units: seconds ago - every: 10s - warn: $this > (($status >= $WARNING) ? ($update_every) : ( 5 * $update_every)) - crit: $this > (($status == $CRITICAL) ? ($update_every) : (60 * $update_every)) - delay: down 5m multiplier 1.5 max 1h - info: number of seconds since the last successful data collection - to: webmaster + template: hdfs_last_collected_secs + on: hdfs.heap_memory + class: Storage +component: HDFS + type: Latency + calc: $now - $last_collected_t + units: seconds ago + every: 10s + warn: $this > (($status >= $WARNING) ? ($update_every) : ( 5 * $update_every)) + crit: $this > (($status == $CRITICAL) ? ($update_every) : (60 * $update_every)) + delay: down 5m multiplier 1.5 max 1h + info: number of seconds since the last successful data collection + to: webmaster # Common -template: hdfs_capacity_usage - on: hdfs.capacity - calc: ($used) * 100 / ($used + $remaining) - units: % - every: 10s - warn: $this > (($status >= $WARNING) ? (70) : (80)) - crit: $this > (($status == $CRITICAL) ? (80) : (98)) - delay: down 15m multiplier 1.5 max 1h - info: summary datanodes space capacity utilization - to: sysadmin + template: hdfs_capacity_usage + on: hdfs.capacity + class: Storage +component: HDFS + type: Utilization + calc: ($used) * 100 / ($used + $remaining) + units: % + every: 10s + warn: $this > (($status >= $WARNING) ? (70) : (80)) + crit: $this > (($status == $CRITICAL) ? (80) : (98)) + delay: down 15m multiplier 1.5 max 1h + info: summary datanodes space capacity utilization + to: sysadmin # NameNode -template: hdfs_missing_blocks - on: hdfs.blocks - calc: $missing - units: missing blocks - every: 10s - warn: $this > 0 - delay: down 15m multiplier 1.5 max 1h - info: number of missing blocks - to: sysadmin + template: hdfs_missing_blocks + on: hdfs.blocks + class: Storage +component: HDFS + type: Errors + calc: $missing + units: missing blocks + every: 10s + warn: $this > 0 + delay: down 15m multiplier 1.5 max 1h + info: number of missing blocks + to: sysadmin -template: hdfs_stale_nodes - on: hdfs.data_nodes - calc: $stale - units: dead nodes - every: 10s - warn: $this > 0 - delay: down 15m multiplier 1.5 max 1h - info: number of datanodes marked stale due to delayed heartbeat - to: sysadmin + template: hdfs_stale_nodes + on: hdfs.data_nodes + class: Storage +component: HDFS + type: Errors + calc: $stale + units: dead nodes + every: 10s + warn: $this > 0 + delay: down 15m multiplier 1.5 max 1h + info: number of datanodes marked stale due to delayed heartbeat + to: sysadmin -template: hdfs_dead_nodes - on: hdfs.data_nodes - calc: $dead - units: dead nodes - every: 10s - crit: $this > 0 - delay: down 15m multiplier 1.5 max 1h - info: number of datanodes which are currently dead - to: sysadmin + template: hdfs_dead_nodes + on: hdfs.data_nodes + class: Storage +component: HDFS + type: Errors + calc: $dead + units: dead nodes + every: 10s + crit: $this > 0 + delay: down 15m multiplier 1.5 max 1h + info: number of datanodes which are currently dead + to: sysadmin # DataNode -template: hdfs_num_failed_volumes - on: hdfs.num_failed_volumes - calc: $fsds_num_failed_volumes - units: failed volumes - every: 10s - warn: $this > 0 - delay: down 15m multiplier 1.5 max 1h - info: number of failed volumes - to: sysadmin + template: hdfs_num_failed_volumes + on: hdfs.num_failed_volumes + class: Storage +component: HDFS + type: Errors + calc: $fsds_num_failed_volumes + units: failed volumes + every: 10s + warn: $this > 0 + delay: down 15m multiplier 1.5 max 1h + info: number of failed volumes + to: sysadmin diff --git a/health/health.d/httpcheck.conf b/health/health.d/httpcheck.conf index 0158f63e..d4d6376a 100644 --- a/health/health.d/httpcheck.conf +++ b/health/health.d/httpcheck.conf @@ -1,99 +1,126 @@ -template: httpcheck_last_collected_secs -families: * - on: httpcheck.status - calc: $now - $last_collected_t - every: 10s - units: seconds ago - warn: $this > (($status >= $WARNING) ? ($update_every) : ( 5 * $update_every)) - crit: $this > (($status == $CRITICAL) ? ($update_every) : (60 * $update_every)) - delay: down 5m multiplier 1.5 max 1h - info: number of seconds since the last successful data collection - to: sysadmin + template: httpcheck_last_collected_secs + families: * + on: httpcheck.status + class: Other +component: HTTP endpoint + type: Latency + calc: $now - $last_collected_t + every: 10s + units: seconds ago + warn: $this > (($status >= $WARNING) ? ($update_every) : ( 5 * $update_every)) + crit: $this > (($status == $CRITICAL) ? ($update_every) : (60 * $update_every)) + delay: down 5m multiplier 1.5 max 1h + info: number of seconds since the last successful data collection + to: sysadmin # This is a fast-reacting no-notification alarm ideal for custom dashboards or badges -template: httpcheck_web_service_up -families: * - on: httpcheck.status - lookup: average -1m unaligned percentage of success - calc: ($this < 75) ? (0) : ($this) - every: 5s - units: up/down - info: average ratio of successful HTTP requests over the last minute (at least 75%) - to: silent + template: httpcheck_web_service_up + families: * + on: httpcheck.status + class: Web Server +component: HTTP endpoint + type: Utilization + lookup: average -1m unaligned percentage of success + calc: ($this < 75) ? (0) : ($this) + every: 5s + units: up/down + info: average ratio of successful HTTP requests over the last minute (at least 75%) + to: silent -template: httpcheck_web_service_bad_content -families: * - on: httpcheck.status - lookup: average -5m unaligned percentage of bad_content - every: 10s - units: % - warn: $this >= 10 AND $this < 40 - crit: $this >= 40 - delay: down 5m multiplier 1.5 max 1h - info: average ratio of HTTP responses with unexpected content over the last 5 minutes - options: no-clear-notification - to: webmaster + template: httpcheck_web_service_bad_content + families: * + on: httpcheck.status + class: Web Server +component: HTTP endpoint + type: Workload + lookup: average -5m unaligned percentage of bad_content + every: 10s + units: % + warn: $this >= 10 AND $this < 40 + crit: $this >= 40 + delay: down 5m multiplier 1.5 max 1h + info: average ratio of HTTP responses with unexpected content over the last 5 minutes + options: no-clear-notification + to: webmaster -template: httpcheck_web_service_bad_status -families: * - on: httpcheck.status - lookup: average -5m unaligned percentage of bad_status - every: 10s - units: % - warn: $this >= 10 AND $this < 40 - crit: $this >= 40 - delay: down 5m multiplier 1.5 max 1h - info: average ratio of HTTP responses with unexpected status over the last 5 minutes - options: no-clear-notification - to: webmaster + template: httpcheck_web_service_bad_status + families: * + on: httpcheck.status + class: Web Server +component: HTTP endpoint + type: Workload + lookup: average -5m unaligned percentage of bad_status + every: 10s + units: % + warn: $this >= 10 AND $this < 40 + crit: $this >= 40 + delay: down 5m multiplier 1.5 max 1h + info: average ratio of HTTP responses with unexpected status over the last 5 minutes + options: no-clear-notification + to: webmaster -template: httpcheck_web_service_timeouts -families: * - on: httpcheck.status - lookup: average -5m unaligned percentage of timeout - every: 10s - units: % - info: average ratio of HTTP request timeouts over the last 5 minutes + template: httpcheck_web_service_timeouts + families: * + on: httpcheck.status + class: Web Server +component: HTTP endpoint + type: Latency + lookup: average -5m unaligned percentage of timeout + every: 10s + units: % + info: average ratio of HTTP request timeouts over the last 5 minutes -template: httpcheck_no_web_service_connections -families: * - on: httpcheck.status - lookup: average -5m unaligned percentage of no_connection - every: 10s - units: % - info: average ratio of failed requests during the last 5 minutes + template: httpcheck_no_web_service_connections + families: * + on: httpcheck.status + class: Other +component: HTTP endpoint + type: Errors + lookup: average -5m unaligned percentage of no_connection + every: 10s + units: % + info: average ratio of failed requests during the last 5 minutes # combined timeout & no connection alarm -template: httpcheck_web_service_unreachable -families: * - on: httpcheck.status - calc: ($httpcheck_no_web_service_connections >= $httpcheck_web_service_timeouts) ? ($httpcheck_no_web_service_connections) : ($httpcheck_web_service_timeouts) - units: % - every: 10s - warn: ($httpcheck_no_web_service_connections >= 10 OR $httpcheck_web_service_timeouts >= 10) AND ($httpcheck_no_web_service_connections < 40 OR $httpcheck_web_service_timeouts < 40) - crit: $httpcheck_no_web_service_connections >= 40 OR $httpcheck_web_service_timeouts >= 40 - delay: down 5m multiplier 1.5 max 1h - info: ratio of failed requests either due to timeouts or no connection over the last 5 minutes - options: no-clear-notification - to: webmaster + template: httpcheck_web_service_unreachable + families: * + on: httpcheck.status + class: Web Server +component: HTTP endpoint + type: Errors + calc: ($httpcheck_no_web_service_connections >= $httpcheck_web_service_timeouts) ? ($httpcheck_no_web_service_connections) : ($httpcheck_web_service_timeouts) + units: % + every: 10s + warn: ($httpcheck_no_web_service_connections >= 10 OR $httpcheck_web_service_timeouts >= 10) AND ($httpcheck_no_web_service_connections < 40 OR $httpcheck_web_service_timeouts < 40) + crit: $httpcheck_no_web_service_connections >= 40 OR $httpcheck_web_service_timeouts >= 40 + delay: down 5m multiplier 1.5 max 1h + info: ratio of failed requests either due to timeouts or no connection over the last 5 minutes + options: no-clear-notification + to: webmaster -template: httpcheck_1h_web_service_response_time -families: * - on: httpcheck.responsetime - lookup: average -1h unaligned of time - every: 30s - units: ms - info: average HTTP response time over the last hour + template: httpcheck_1h_web_service_response_time + families: * + on: httpcheck.responsetime + class: Other +component: HTTP endpoint + type: Latency + lookup: average -1h unaligned of time + every: 30s + units: ms + info: average HTTP response time over the last hour -template: httpcheck_web_service_slow -families: * - on: httpcheck.responsetime - lookup: average -3m unaligned of time - units: ms - every: 10s - warn: ($this > ($httpcheck_1h_web_service_response_time * 2) ) - crit: ($this > ($httpcheck_1h_web_service_response_time * 3) ) - delay: down 5m multiplier 1.5 max 1h - info: average HTTP response time over the last 3 minutes, compared to the average over the last hour - options: no-clear-notification - to: webmaster + template: httpcheck_web_service_slow + families: * + on: httpcheck.responsetime + class: Web Server +component: HTTP endpoint + type: Latency + lookup: average -3m unaligned of time + units: ms + every: 10s + warn: ($this > ($httpcheck_1h_web_service_response_time * 2) ) + crit: ($this > ($httpcheck_1h_web_service_response_time * 3) ) + delay: down 5m multiplier 1.5 max 1h + info: average HTTP response time over the last 3 minutes, compared to the average over the last hour + options: no-clear-notification + to: webmaster diff --git a/health/health.d/ioping.conf b/health/health.d/ioping.conf index fa0196ef..57ce4e86 100644 --- a/health/health.d/ioping.conf +++ b/health/health.d/ioping.conf @@ -1,13 +1,16 @@ -template: ioping_disk_latency -families: * - on: ioping.latency - lookup: average -10s unaligned of average - units: ms - every: 10s - green: 500 - red: 1000 - warn: $this > $green OR $max > $red - crit: $this > $red - delay: down 30m multiplier 1.5 max 2h - info: average I/O latency over the last 10 seconds - to: sysadmin + template: ioping_disk_latency + families: * + on: ioping.latency + class: System +component: Disk + type: Latency + lookup: average -10s unaligned of average + units: ms + every: 10s + green: 500 + red: 1000 + warn: $this > $green OR $max > $red + crit: $this > $red + delay: down 30m multiplier 1.5 max 2h + info: average I/O latency over the last 10 seconds + to: sysadmin diff --git a/health/health.d/ipc.conf b/health/health.d/ipc.conf index f4a0f56d..6eaf7abe 100644 --- a/health/health.d/ipc.conf +++ b/health/health.d/ipc.conf @@ -1,28 +1,34 @@ # you can disable an alarm notification by setting the 'to' line to: silent - alarm: semaphores_used - on: system.ipc_semaphores - os: linux - hosts: * - calc: $semaphores * 100 / $ipc_semaphores_max - units: % - every: 10s - warn: $this > (($status >= $WARNING) ? (70) : (80)) - crit: $this > (($status == $CRITICAL) ? (70) : (90)) - delay: down 5m multiplier 1.5 max 1h - info: IPC semaphore utilization - to: sysadmin + alarm: semaphores_used + on: system.ipc_semaphores + class: System +component: IPC + type: Utilization + os: linux + hosts: * + calc: $semaphores * 100 / $ipc_semaphores_max + units: % + every: 10s + warn: $this > (($status >= $WARNING) ? (70) : (80)) + crit: $this > (($status == $CRITICAL) ? (70) : (90)) + delay: down 5m multiplier 1.5 max 1h + info: IPC semaphore utilization + to: sysadmin - alarm: semaphore_arrays_used - on: system.ipc_semaphore_arrays - os: linux - hosts: * - calc: $arrays * 100 / $ipc_semaphores_arrays_max - units: % - every: 10s - warn: $this > (($status >= $WARNING) ? (70) : (80)) - crit: $this > (($status == $CRITICAL) ? (70) : (90)) - delay: down 5m multiplier 1.5 max 1h - info: IPC semaphore arrays utilization - to: sysadmin + alarm: semaphore_arrays_used + on: system.ipc_semaphore_arrays + class: System +component: IPC + type: Utilization + os: linux + hosts: * + calc: $arrays * 100 / $ipc_semaphores_arrays_max + units: % + every: 10s + warn: $this > (($status >= $WARNING) ? (70) : (80)) + crit: $this > (($status == $CRITICAL) ? (70) : (90)) + delay: down 5m multiplier 1.5 max 1h + info: IPC semaphore arrays utilization + to: sysadmin diff --git a/health/health.d/ipfs.conf b/health/health.d/ipfs.conf index fd53c2c4..6268f409 100644 --- a/health/health.d/ipfs.conf +++ b/health/health.d/ipfs.conf @@ -1,11 +1,14 @@ -template: ipfs_datastore_usage - on: ipfs.repo_size - calc: $size * 100 / $avail - units: % - every: 10s - warn: $this > (($status >= $WARNING) ? (80) : (90)) - crit: $this > (($status == $CRITICAL) ? (90) : (98)) - delay: down 15m multiplier 1.5 max 1h - info: IPFS datastore utilization - to: sysadmin + template: ipfs_datastore_usage + on: ipfs.repo_size + class: Data Sharing +component: IPFS + type: Utilization + calc: $size * 100 / $avail + units: % + every: 10s + warn: $this > (($status >= $WARNING) ? (80) : (90)) + crit: $this > (($status == $CRITICAL) ? (90) : (98)) + delay: down 15m multiplier 1.5 max 1h + info: IPFS datastore utilization + to: sysadmin diff --git a/health/health.d/ipmi.conf b/health/health.d/ipmi.conf index 563d7a7e..d4fdc6c7 100644 --- a/health/health.d/ipmi.conf +++ b/health/health.d/ipmi.conf @@ -1,20 +1,26 @@ - alarm: ipmi_sensors_states - on: ipmi.sensors_states - calc: $warning + $critical - units: sensors - every: 10s - warn: $this > 0 - crit: $critical > 0 - delay: up 5m down 15m multiplier 1.5 max 1h - info: number of IPMI sensors in non-nominal state - to: sysadmin + alarm: ipmi_sensors_states + on: ipmi.sensors_states + class: System +component: IPMI + type: Errors + calc: $warning + $critical + units: sensors + every: 10s + warn: $this > 0 + crit: $critical > 0 + delay: up 5m down 15m multiplier 1.5 max 1h + info: number of IPMI sensors in non-nominal state + to: sysadmin - alarm: ipmi_events - on: ipmi.events - calc: $events - units: events - every: 10s - warn: $this > 0 - delay: up 5m down 15m multiplier 1.5 max 1h - info: number of events in the IPMI System Event Log (SEL) - to: sysadmin + alarm: ipmi_events + on: ipmi.events + class: System +component: IPMI + type: Utilization + calc: $events + units: events + every: 10s + warn: $this > 0 + delay: up 5m down 15m multiplier 1.5 max 1h + info: number of events in the IPMI System Event Log (SEL) + to: sysadmin diff --git a/health/health.d/kubelet.conf b/health/health.d/kubelet.conf index 5eda59b2..4d3c45f9 100644 --- a/health/health.d/kubelet.conf +++ b/health/health.d/kubelet.conf @@ -4,39 +4,48 @@ # True (1) if the node is experiencing a configuration-related error, false (0) otherwise. - template: kubelet_node_config_error - on: k8s_kubelet.kubelet_node_config_error - calc: $kubelet_node_config_error - units: bool - every: 10s - warn: $this == 1 - delay: down 1m multiplier 1.5 max 2h - info: the node is experiencing a configuration-related error (0: false, 1: true) - to: sysadmin + template: kubelet_node_config_error + on: k8s_kubelet.kubelet_node_config_error + class: Kubernetes +component: Kubelet + type: Errors + calc: $kubelet_node_config_error + units: bool + every: 10s + warn: $this == 1 + delay: down 1m multiplier 1.5 max 2h + info: the node is experiencing a configuration-related error (0: false, 1: true) + to: sysadmin # Failed Token() requests to the alternate token source - template: kubelet_token_requests - lookup: sum -10s of token_fail_count - on: k8s_kubelet.kubelet_token_requests - units: failed requests - every: 10s - warn: $this > 0 - delay: down 1m multiplier 1.5 max 2h - info: number of failed Token() requests to the alternate token source - to: sysadmin + template: kubelet_token_requests + lookup: sum -10s of token_fail_count + on: k8s_kubelet.kubelet_token_requests + class: Kubernetes +component: Kubelet + type: Errors + units: failed requests + every: 10s + warn: $this > 0 + delay: down 1m multiplier 1.5 max 2h + info: number of failed Token() requests to the alternate token source + to: sysadmin # Docker and runtime operation errors - template: kubelet_operations_error - lookup: sum -1m - on: k8s_kubelet.kubelet_operations_errors - units: errors - every: 10s - warn: $this > (($status >= $WARNING) ? (0) : (20)) - delay: up 30s down 1m multiplier 1.5 max 2h - info: number of Docker or runtime operation errors - to: sysadmin + template: kubelet_operations_error + lookup: sum -1m + on: k8s_kubelet.kubelet_operations_errors + class: Kubernetes +component: Kubelet + type: Errors + units: errors + every: 10s + warn: $this > (($status >= $WARNING) ? (0) : (20)) + delay: up 30s down 1m multiplier 1.5 max 2h + info: number of Docker or runtime operation errors + to: sysadmin # ----------------------------------------------------------------------------- @@ -53,66 +62,84 @@ # quantile 0.5 -template: kubelet_1m_pleg_relist_latency_quantile_05 - on: k8s_kubelet.kubelet_pleg_relist_latency_microseconds - lookup: average -1m unaligned of kubelet_pleg_relist_latency_05 - units: microseconds - every: 10s - info: average Pod Lifecycle Event Generator relisting latency over the last minute (quantile 0.5) - -template: kubelet_10s_pleg_relist_latency_quantile_05 - on: k8s_kubelet.kubelet_pleg_relist_latency_microseconds - lookup: average -10s unaligned of kubelet_pleg_relist_latency_05 - calc: $this * 100 / (($kubelet_1m_pleg_relist_latency_quantile_05 < 1000)?(1000):($kubelet_1m_pleg_relist_latency_quantile_05)) - every: 10s - units: % - warn: $this > (($status >= $WARNING)?(100):(200)) - crit: $this > (($status >= $WARNING)?(200):(400)) - delay: down 1m multiplier 1.5 max 2h - info: ratio of average Pod Lifecycle Event Generator relisting latency over the last 10 seconds, \ - compared to the last minute (quantile 0.5) - to: sysadmin + template: kubelet_1m_pleg_relist_latency_quantile_05 + on: k8s_kubelet.kubelet_pleg_relist_latency_microseconds + class: Kubernetes +component: Kubelet + type: Latency + lookup: average -1m unaligned of kubelet_pleg_relist_latency_05 + units: microseconds + every: 10s + info: average Pod Lifecycle Event Generator relisting latency over the last minute (quantile 0.5) + + template: kubelet_10s_pleg_relist_latency_quantile_05 + on: k8s_kubelet.kubelet_pleg_relist_latency_microseconds + class: Kubernetes +component: Kubelet + type: Latency + lookup: average -10s unaligned of kubelet_pleg_relist_latency_05 + calc: $this * 100 / (($kubelet_1m_pleg_relist_latency_quantile_05 < 1000)?(1000):($kubelet_1m_pleg_relist_latency_quantile_05)) + every: 10s + units: % + warn: $this > (($status >= $WARNING)?(100):(200)) + crit: $this > (($status >= $WARNING)?(200):(400)) + delay: down 1m multiplier 1.5 max 2h + info: ratio of average Pod Lifecycle Event Generator relisting latency over the last 10 seconds, \ + compared to the last minute (quantile 0.5) + to: sysadmin # quantile 0.9 -template: kubelet_1m_pleg_relist_latency_quantile_09 - on: k8s_kubelet.kubelet_pleg_relist_latency_microseconds - lookup: average -1m unaligned of kubelet_pleg_relist_latency_09 - units: microseconds - every: 10s - info: average Pod Lifecycle Event Generator relisting latency over the last minute (quantile 0.9) - -template: kubelet_10s_pleg_relist_latency_quantile_09 - on: k8s_kubelet.kubelet_pleg_relist_latency_microseconds - lookup: average -10s unaligned of kubelet_pleg_relist_latency_09 - calc: $this * 100 / (($kubelet_1m_pleg_relist_latency_quantile_09 < 1000)?(1000):($kubelet_1m_pleg_relist_latency_quantile_09)) - every: 10s - units: % - warn: $this > (($status >= $WARNING)?(200):(400)) - crit: $this > (($status >= $WARNING)?(400):(800)) - delay: down 1m multiplier 1.5 max 2h - info: ratio of average Pod Lifecycle Event Generator relisting latency over the last 10 seconds, \ - compared to the last minute (quantile 0.9) - to: sysadmin + template: kubelet_1m_pleg_relist_latency_quantile_09 + on: k8s_kubelet.kubelet_pleg_relist_latency_microseconds + class: Kubernetes +component: Kubelet + type: Latency + lookup: average -1m unaligned of kubelet_pleg_relist_latency_09 + units: microseconds + every: 10s + info: average Pod Lifecycle Event Generator relisting latency over the last minute (quantile 0.9) + + template: kubelet_10s_pleg_relist_latency_quantile_09 + on: k8s_kubelet.kubelet_pleg_relist_latency_microseconds + class: Kubernetes +component: Kubelet + type: Latency + lookup: average -10s unaligned of kubelet_pleg_relist_latency_09 + calc: $this * 100 / (($kubelet_1m_pleg_relist_latency_quantile_09 < 1000)?(1000):($kubelet_1m_pleg_relist_latency_quantile_09)) + every: 10s + units: % + warn: $this > (($status >= $WARNING)?(200):(400)) + crit: $this > (($status >= $WARNING)?(400):(800)) + delay: down 1m multiplier 1.5 max 2h + info: ratio of average Pod Lifecycle Event Generator relisting latency over the last 10 seconds, \ + compared to the last minute (quantile 0.9) + to: sysadmin # quantile 0.99 -template: kubelet_1m_pleg_relist_latency_quantile_099 - on: k8s_kubelet.kubelet_pleg_relist_latency_microseconds - lookup: average -1m unaligned of kubelet_pleg_relist_latency_099 - units: microseconds - every: 10s - info: average Pod Lifecycle Event Generator relisting latency over the last minute (quantile 0.99) - -template: kubelet_10s_pleg_relist_latency_quantile_099 - on: k8s_kubelet.kubelet_pleg_relist_latency_microseconds - lookup: average -10s unaligned of kubelet_pleg_relist_latency_099 - calc: $this * 100 / (($kubelet_1m_pleg_relist_latency_quantile_099 < 1000)?(1000):($kubelet_1m_pleg_relist_latency_quantile_099)) - every: 10s - units: % - warn: $this > (($status >= $WARNING)?(400):(800)) - crit: $this > (($status >= $WARNING)?(800):(1200)) - delay: down 1m multiplier 1.5 max 2h - info: ratio of average Pod Lifecycle Event Generator relisting latency over the last 10 seconds, \ - compared to the last minute (quantile 0.99) - to: sysadmin + template: kubelet_1m_pleg_relist_latency_quantile_099 + on: k8s_kubelet.kubelet_pleg_relist_latency_microseconds + class: Kubernetes +component: Kubelet + type: Latency + lookup: average -1m unaligned of kubelet_pleg_relist_latency_099 + units: microseconds + every: 10s + info: average Pod Lifecycle Event Generator relisting latency over the last minute (quantile 0.99) + + template: kubelet_10s_pleg_relist_latency_quantile_099 + on: k8s_kubelet.kubelet_pleg_relist_latency_microseconds + class: Kubernetes +component: Kubelet + type: Latency + lookup: average -10s unaligned of kubelet_pleg_relist_latency_099 + calc: $this * 100 / (($kubelet_1m_pleg_relist_latency_quantile_099 < 1000)?(1000):($kubelet_1m_pleg_relist_latency_quantile_099)) + every: 10s + units: % + warn: $this > (($status >= $WARNING)?(400):(800)) + crit: $this > (($status >= $WARNING)?(800):(1200)) + delay: down 1m multiplier 1.5 max 2h + info: ratio of average Pod Lifecycle Event Generator relisting latency over the last 10 seconds, \ + compared to the last minute (quantile 0.99) + to: sysadmin diff --git a/health/health.d/lighttpd.conf b/health/health.d/lighttpd.conf index 915907a4..0f067549 100644 --- a/health/health.d/lighttpd.conf +++ b/health/health.d/lighttpd.conf @@ -1,14 +1,17 @@ # make sure lighttpd is running -template: lighttpd_last_collected_secs - on: lighttpd.requests - calc: $now - $last_collected_t - units: seconds ago - every: 10s - warn: $this > (($status >= $WARNING) ? ($update_every) : ( 5 * $update_every)) - crit: $this > (($status == $CRITICAL) ? ($update_every) : (60 * $update_every)) - delay: down 5m multiplier 1.5 max 1h - info: number of seconds since the last successful data collection - to: webmaster + template: lighttpd_last_collected_secs + on: lighttpd.requests + class: Web Server +component: Lighttpd + type: Latency + calc: $now - $last_collected_t + units: seconds ago + every: 10s + warn: $this > (($status >= $WARNING) ? ($update_every) : ( 5 * $update_every)) + crit: $this > (($status == $CRITICAL) ? ($update_every) : (60 * $update_every)) + delay: down 5m multiplier 1.5 max 1h + info: number of seconds since the last successful data collection + to: webmaster diff --git a/health/health.d/linux_power_supply.conf b/health/health.d/linux_power_supply.conf index a27ea072..e28c246a 100644 --- a/health/health.d/linux_power_supply.conf +++ b/health/health.d/linux_power_supply.conf @@ -1,12 +1,15 @@ # Alert on low battery capacity. -template: linux_power_supply_capacity - on: powersupply.capacity - calc: $capacity - units: % - every: 10s - warn: $this < 10 - crit: $this < 5 - delay: up 30s down 5m multiplier 1.2 max 1h - info: percentage of remaining power supply capacity - to: sysadmin + template: linux_power_supply_capacity + on: powersupply.capacity + class: Power Supply +component: Battery + type: Utilization + calc: $capacity + units: % + every: 10s + warn: $this < 10 + crit: $this < 5 + delay: up 30s down 5m multiplier 1.2 max 1h + info: percentage of remaining power supply capacity + to: sysadmin diff --git a/health/health.d/load.conf b/health/health.d/load.conf index ffaea172..e811f6ee 100644 --- a/health/health.d/load.conf +++ b/health/health.d/load.conf @@ -4,51 +4,63 @@ # Calculate the base trigger point for the load average alarms. # This is the maximum number of CPU's in the system over the past 1 # minute, with a special case for a single CPU of setting the trigger at 2. - alarm: load_cpu_number - on: system.load - os: linux - hosts: * - calc: ($active_processors == nan or $active_processors == inf or $active_processors < 2) ? ( 2 ) : ( $active_processors ) - units: cpus - every: 1m - info: number of active CPU cores in the system + alarm: load_cpu_number + on: system.load + class: System +component: Load + type: Utilization + os: linux + hosts: * + calc: ($active_processors == nan or $active_processors == inf or $active_processors < 2) ? ( 2 ) : ( $active_processors ) + units: cpus + every: 1m + info: number of active CPU cores in the system # Send alarms if the load average is unusually high. # These intentionally _do not_ calculate the average over the sampled # time period because the values being checked already are averages. - alarm: load_average_15 - on: system.load - os: linux - hosts: * - lookup: max -1m unaligned of load15 - units: load - every: 1m - warn: ($this * 100 / $load_cpu_number) > (($status >= $WARNING) ? 175 : 200) - delay: down 15m multiplier 1.5 max 1h - info: system fifteen-minute load average - to: sysadmin + alarm: load_average_15 + on: system.load + class: System +component: Load + type: Utilization + os: linux + hosts: * + lookup: max -1m unaligned of load15 + units: load + every: 1m + warn: ($this * 100 / $load_cpu_number) > (($status >= $WARNING) ? 175 : 200) + delay: down 15m multiplier 1.5 max 1h + info: system fifteen-minute load average + to: sysadmin - alarm: load_average_5 - on: system.load - os: linux - hosts: * - lookup: max -1m unaligned of load5 - units: load - every: 1m - warn: ($this * 100 / $load_cpu_number) > (($status >= $WARNING) ? 350 : 400) - delay: down 15m multiplier 1.5 max 1h - info: system five-minute load average - to: sysadmin + alarm: load_average_5 + on: system.load + class: System +component: Load + type: Utilization + os: linux + hosts: * + lookup: max -1m unaligned of load5 + units: load + every: 1m + warn: ($this * 100 / $load_cpu_number) > (($status >= $WARNING) ? 350 : 400) + delay: down 15m multiplier 1.5 max 1h + info: system five-minute load average + to: sysadmin - alarm: load_average_1 - on: system.load - os: linux - hosts: * - lookup: max -1m unaligned of load1 - units: load - every: 1m - warn: ($this * 100 / $load_cpu_number) > (($status >= $WARNING) ? 700 : 800) - delay: down 15m multiplier 1.5 max 1h - info: system one-minute load average - to: sysadmin + alarm: load_average_1 + on: system.load + class: System +component: Load + type: Utilization + os: linux + hosts: * + lookup: max -1m unaligned of load1 + units: load + every: 1m + warn: ($this * 100 / $load_cpu_number) > (($status >= $WARNING) ? 700 : 800) + delay: down 15m multiplier 1.5 max 1h + info: system one-minute load average + to: sysadmin diff --git a/health/health.d/mdstat.conf b/health/health.d/mdstat.conf index ca2d0d9f..67483b20 100644 --- a/health/health.d/mdstat.conf +++ b/health/health.d/mdstat.conf @@ -1,39 +1,52 @@ -template: mdstat_last_collected - on: md.disks - calc: $now - $last_collected_t - units: seconds ago - every: 10s - warn: $this > (($status >= $WARNING) ? ($update_every) : ( 5 * $update_every)) - crit: $this > (($status == $CRITICAL) ? ($update_every) : (60 * $update_every)) - info: number of seconds since the last successful data collection - to: sysadmin + template: mdstat_last_collected + on: md.disks + class: System +component: RAID + type: Latency + calc: $now - $last_collected_t + units: seconds ago + every: 10s + warn: $this > (($status >= $WARNING) ? ($update_every) : ( 5 * $update_every)) + crit: $this > (($status == $CRITICAL) ? ($update_every) : (60 * $update_every)) + info: number of seconds since the last successful data collection + to: sysadmin -template: mdstat_disks - on: md.disks - units: failed devices - every: 10s - calc: $down - crit: $this > 0 - info: number of devices in the down state. \ - Any number > 0 indicates that the array is degraded. - to: sysadmin + template: mdstat_disks + on: md.disks + class: System +component: RAID + type: Errors + units: failed devices + every: 10s + calc: $down + crit: $this > 0 + info: number of devices in the down state for the $family array. \ + Any number > 0 indicates that the array is degraded. + to: sysadmin -template: mdstat_mismatch_cnt - on: md.mismatch_cnt - units: unsynchronized blocks - calc: $count - every: 60s - warn: $this > 1024 - delay: up 30m - info: number of unsynchronized blocks - to: sysadmin + template: mdstat_mismatch_cnt + on: md.mismatch_cnt + class: System +component: RAID + type: Errors + families: !*(raid1) !*(raid10) * + units: unsynchronized blocks + calc: $count + every: 60s + warn: $this > 1024 + delay: up 30m + info: number of unsynchronized blocks for the $family array + to: sysadmin -template: mdstat_nonredundant_last_collected - on: md.nonredundant - calc: $now - $last_collected_t - units: seconds ago - every: 10s - warn: $this > (($status >= $WARNING) ? ($update_every) : ( 5 * $update_every)) - crit: $this > (($status == $CRITICAL) ? ($update_every) : (60 * $update_every)) - info: number of seconds since the last successful data collection - to: sysadmin + template: mdstat_nonredundant_last_collected + on: md.nonredundant + class: System +component: RAID + type: Latency + calc: $now - $last_collected_t + units: seconds ago + every: 10s + warn: $this > (($status >= $WARNING) ? ($update_every) : ( 5 * $update_every)) + crit: $this > (($status == $CRITICAL) ? ($update_every) : (60 * $update_every)) + info: number of seconds since the last successful data collection + to: sysadmin diff --git a/health/health.d/megacli.conf b/health/health.d/megacli.conf index f861765d..1b6502f6 100644 --- a/health/health.d/megacli.conf +++ b/health/health.d/megacli.conf @@ -1,56 +1,71 @@ ## Adapters (controllers) -template: megacli_adapter_state - on: megacli.adapter_degraded - lookup: max -10s foreach * - units: boolean - every: 10s - crit: $this > 0 - delay: down 5m multiplier 2 max 10m - info: adapter is in the degraded state (0: false, 1: true) - to: sysadmin + template: megacli_adapter_state + on: megacli.adapter_degraded + class: System +component: RAID + type: Errors + lookup: max -10s foreach * + units: boolean + every: 10s + crit: $this > 0 + delay: down 5m multiplier 2 max 10m + info: adapter is in the degraded state (0: false, 1: true) + to: sysadmin ## Physical Disks -template: megacli_pd_predictive_failures - on: megacli.pd_predictive_failure - lookup: sum -10s foreach * - units: predictive failures - every: 10s - warn: $this > 0 - delay: up 1m down 5m multiplier 2 max 10m - info: number of physical drive predictive failures - to: sysadmin - -template: megacli_pd_media_errors - on: megacli.pd_media_error - lookup: sum -10s foreach * - units: media errors - every: 10s - warn: $this > 0 - delay: up 1m down 5m multiplier 2 max 10m - info: number of physical drive media errors - to: sysadmin + template: megacli_pd_predictive_failures + on: megacli.pd_predictive_failure + class: System +component: RAID + type: Errors + lookup: sum -10s foreach * + units: predictive failures + every: 10s + warn: $this > 0 + delay: up 1m down 5m multiplier 2 max 10m + info: number of physical drive predictive failures + to: sysadmin + + template: megacli_pd_media_errors + on: megacli.pd_media_error + class: System +component: RAID + type: Errors + lookup: sum -10s foreach * + units: media errors + every: 10s + warn: $this > 0 + delay: up 1m down 5m multiplier 2 max 10m + info: number of physical drive media errors + to: sysadmin ## Battery Backup Units (BBU) -template: megacli_bbu_relative_charge - on: megacli.bbu_relative_charge - lookup: average -10s - units: percent - every: 10s - warn: $this <= (($status >= $WARNING) ? (85) : (80)) - crit: $this <= (($status == $CRITICAL) ? (50) : (40)) - info: average battery backup unit (BBU) relative state of charge over the last 10 seconds - to: sysadmin - -template: megacli_bbu_cycle_count - on: megacli.bbu_cycle_count - lookup: average -10s - units: cycles - every: 10s - warn: $this >= 100 - crit: $this >= 500 - info: average battery backup unit (BBU) charge cycles count over the last 10 seconds - to: sysadmin + template: megacli_bbu_relative_charge + on: megacli.bbu_relative_charge + class: System +component: RAID + type: Workload + lookup: average -10s + units: percent + every: 10s + warn: $this <= (($status >= $WARNING) ? (85) : (80)) + crit: $this <= (($status == $CRITICAL) ? (50) : (40)) + info: average battery backup unit (BBU) relative state of charge over the last 10 seconds + to: sysadmin + + template: megacli_bbu_cycle_count + on: megacli.bbu_cycle_count + class: System +component: RAID + type: Workload + lookup: average -10s + units: cycles + every: 10s + warn: $this >= 100 + crit: $this >= 500 + info: average battery backup unit (BBU) charge cycles count over the last 10 seconds + to: sysadmin diff --git a/health/health.d/memcached.conf b/health/health.d/memcached.conf index e610f181..f4b734c3 100644 --- a/health/health.d/memcached.conf +++ b/health/health.d/memcached.conf @@ -1,53 +1,65 @@ # make sure memcached is running -template: memcached_last_collected_secs - on: memcached.cache - calc: $now - $last_collected_t - units: seconds ago - every: 10s - warn: $this > (($status >= $WARNING) ? ($update_every) : ( 5 * $update_every)) - crit: $this > (($status == $CRITICAL) ? ($update_every) : (60 * $update_every)) - delay: down 5m multiplier 1.5 max 1h - info: number of seconds since the last successful data collection - to: dba + template: memcached_last_collected_secs + on: memcached.cache + class: KV Storage +component: Memcached + type: Latency + calc: $now - $last_collected_t + units: seconds ago + every: 10s + warn: $this > (($status >= $WARNING) ? ($update_every) : ( 5 * $update_every)) + crit: $this > (($status == $CRITICAL) ? ($update_every) : (60 * $update_every)) + delay: down 5m multiplier 1.5 max 1h + info: number of seconds since the last successful data collection + to: dba # detect if memcached cache is full -template: memcached_cache_memory_usage - on: memcached.cache - calc: $used * 100 / ($used + $available) - units: % - every: 10s - warn: $this > (($status >= $WARNING) ? (70) : (80)) - crit: $this > (($status == $CRITICAL) ? (80) : (90)) - delay: up 0 down 15m multiplier 1.5 max 1h - info: cache memory utilization - to: dba + template: memcached_cache_memory_usage + on: memcached.cache + class: KV Storage +component: Memcached + type: Utilization + calc: $used * 100 / ($used + $available) + units: % + every: 10s + warn: $this > (($status >= $WARNING) ? (70) : (80)) + crit: $this > (($status == $CRITICAL) ? (80) : (90)) + delay: up 0 down 15m multiplier 1.5 max 1h + info: cache memory utilization + to: dba # find the rate memcached cache is filling -template: memcached_cache_fill_rate - on: memcached.cache - lookup: min -10m at -50m unaligned of available - calc: ($this - $available) / (($now - $after) / 3600) - units: KB/hour - every: 1m - info: average rate the cache fills up (positive), or frees up (negative) space over the last hour + template: memcached_cache_fill_rate + on: memcached.cache + class: KV Storage +component: Memcached + type: Utilization + lookup: min -10m at -50m unaligned of available + calc: ($this - $available) / (($now - $after) / 3600) + units: KB/hour + every: 1m + info: average rate the cache fills up (positive), or frees up (negative) space over the last hour # find the hours remaining until memcached cache is full -template: memcached_out_of_cache_space_time - on: memcached.cache - calc: ($memcached_cache_fill_rate > 0) ? ($available / $memcached_cache_fill_rate) : (inf) - units: hours - every: 10s - warn: $this > 0 and $this < (($status >= $WARNING) ? (48) : (8)) - crit: $this > 0 and $this < (($status == $CRITICAL) ? (24) : (2)) - delay: down 15m multiplier 1.5 max 1h - info: estimated time the cache will run out of space \ - if the system continues to add data at the same rate as the past hour - to: dba + template: memcached_out_of_cache_space_time + on: memcached.cache + class: KV Storage +component: Memcached + type: Utilization + calc: ($memcached_cache_fill_rate > 0) ? ($available / $memcached_cache_fill_rate) : (inf) + units: hours + every: 10s + warn: $this > 0 and $this < (($status >= $WARNING) ? (48) : (8)) + crit: $this > 0 and $this < (($status == $CRITICAL) ? (24) : (2)) + delay: down 15m multiplier 1.5 max 1h + info: estimated time the cache will run out of space \ + if the system continues to add data at the same rate as the past hour + to: dba diff --git a/health/health.d/memory.conf b/health/health.d/memory.conf index e95c0aad..ab651315 100644 --- a/health/health.d/memory.conf +++ b/health/health.d/memory.conf @@ -1,38 +1,47 @@ # you can disable an alarm notification by setting the 'to' line to: silent - alarm: 1hour_ecc_memory_correctable - on: mem.ecc_ce - os: linux - hosts: * - lookup: sum -10m unaligned - units: errors - every: 1m - warn: $this > 0 - delay: down 1h multiplier 1.5 max 1h - info: number of ECC correctable errors in the last 10 minutes - to: sysadmin + alarm: 1hour_ecc_memory_correctable + on: mem.ecc_ce + class: System +component: Memory + type: Errors + os: linux + hosts: * + lookup: sum -10m unaligned + units: errors + every: 1m + warn: $this > 0 + delay: down 1h multiplier 1.5 max 1h + info: number of ECC correctable errors in the last 10 minutes + to: sysadmin - alarm: 1hour_ecc_memory_uncorrectable - on: mem.ecc_ue - os: linux - hosts: * - lookup: sum -10m unaligned - units: errors - every: 1m - crit: $this > 0 - delay: down 1h multiplier 1.5 max 1h - info: number of ECC uncorrectable errors in the last 10 minutes - to: sysadmin + alarm: 1hour_ecc_memory_uncorrectable + on: mem.ecc_ue + class: System +component: Memory + type: Errors + os: linux + hosts: * + lookup: sum -10m unaligned + units: errors + every: 1m + crit: $this > 0 + delay: down 1h multiplier 1.5 max 1h + info: number of ECC uncorrectable errors in the last 10 minutes + to: sysadmin - alarm: 1hour_memory_hw_corrupted - on: mem.hwcorrupt - os: linux - hosts: * - calc: $HardwareCorrupted - units: MB - every: 10s - warn: $this > 0 - delay: down 1h multiplier 1.5 max 1h - info: amount of memory corrupted due to a hardware failure - to: sysadmin + alarm: 1hour_memory_hw_corrupted + on: mem.hwcorrupt + class: System +component: Memory + type: Errors + os: linux + hosts: * + calc: $HardwareCorrupted + units: MB + every: 10s + warn: $this > 0 + delay: down 1h multiplier 1.5 max 1h + info: amount of memory corrupted due to a hardware failure + to: sysadmin diff --git a/health/health.d/mongodb.conf b/health/health.d/mongodb.conf index a80cb311..8c9bdeb6 100644 --- a/health/health.d/mongodb.conf +++ b/health/health.d/mongodb.conf @@ -1,13 +1,16 @@ # make sure mongodb is running -template: mongodb_last_collected_secs - on: mongodb.read_operations - calc: $now - $last_collected_t - units: seconds ago - every: 10s - warn: $this > (($status >= $WARNING) ? ($update_every) : ( 5 * $update_every)) - crit: $this > (($status == $CRITICAL) ? ($update_every) : (60 * $update_every)) - delay: down 5m multiplier 1.5 max 1h - info: number of seconds since the last successful data collection - to: dba + template: mongodb_last_collected_secs + on: mongodb.read_operations + class: Database +component: MongoDB + type: Latency + calc: $now - $last_collected_t + units: seconds ago + every: 10s + warn: $this > (($status >= $WARNING) ? ($update_every) : ( 5 * $update_every)) + crit: $this > (($status == $CRITICAL) ? ($update_every) : (60 * $update_every)) + delay: down 5m multiplier 1.5 max 1h + info: number of seconds since the last successful data collection + to: dba diff --git a/health/health.d/mysql.conf b/health/health.d/mysql.conf index 7451b3f4..91860c4a 100644 --- a/health/health.d/mysql.conf +++ b/health/health.d/mysql.conf @@ -1,150 +1,186 @@ # make sure mysql is running -template: mysql_last_collected_secs - on: mysql.queries - calc: $now - $last_collected_t - units: seconds ago - every: 10s - warn: $this > (($status >= $WARNING) ? ($update_every) : ( 5 * $update_every)) - crit: $this > (($status == $CRITICAL) ? ($update_every) : (60 * $update_every)) - delay: down 5m multiplier 1.5 max 1h - info: number of seconds since the last successful data collection - to: dba + template: mysql_last_collected_secs + on: mysql.queries + class: Database +component: MySQL + type: Latency + calc: $now - $last_collected_t + units: seconds ago + every: 10s + warn: $this > (($status >= $WARNING) ? ($update_every) : ( 5 * $update_every)) + crit: $this > (($status == $CRITICAL) ? ($update_every) : (60 * $update_every)) + delay: down 5m multiplier 1.5 max 1h + info: number of seconds since the last successful data collection + to: dba # ----------------------------------------------------------------------------- # slow queries -template: mysql_10s_slow_queries - on: mysql.queries - lookup: sum -10s of slow_queries - units: slow queries - every: 10s - warn: $this > (($status >= $WARNING) ? (5) : (10)) - crit: $this > (($status == $CRITICAL) ? (10) : (20)) - delay: down 5m multiplier 1.5 max 1h - info: number of slow queries in the last 10 seconds - to: dba + template: mysql_10s_slow_queries + on: mysql.queries + class: Database +component: MySQL + type: Latency + lookup: sum -10s of slow_queries + units: slow queries + every: 10s + warn: $this > (($status >= $WARNING) ? (5) : (10)) + crit: $this > (($status == $CRITICAL) ? (10) : (20)) + delay: down 5m multiplier 1.5 max 1h + info: number of slow queries in the last 10 seconds + to: dba # ----------------------------------------------------------------------------- # lock waits -template: mysql_10s_table_locks_immediate - on: mysql.table_locks - lookup: sum -10s absolute of immediate - units: immediate locks - every: 10s - info: number of table immediate locks in the last 10 seconds - to: dba - -template: mysql_10s_table_locks_waited - on: mysql.table_locks - lookup: sum -10s absolute of waited - units: waited locks - every: 10s - info: number of table waited locks in the last 10 seconds - to: dba - -template: mysql_10s_waited_locks_ratio - on: mysql.table_locks - calc: ( ($mysql_10s_table_locks_waited + $mysql_10s_table_locks_immediate) > 0 ) ? (($mysql_10s_table_locks_waited * 100) / ($mysql_10s_table_locks_waited + $mysql_10s_table_locks_immediate)) : 0 - units: % - every: 10s - warn: $this > (($status >= $WARNING) ? (10) : (25)) - crit: $this > (($status == $CRITICAL) ? (25) : (50)) - delay: down 30m multiplier 1.5 max 1h - info: ratio of waited table locks over the last 10 seconds - to: dba + template: mysql_10s_table_locks_immediate + on: mysql.table_locks + class: Database +component: MySQL + type: Utilization + lookup: sum -10s absolute of immediate + units: immediate locks + every: 10s + info: number of table immediate locks in the last 10 seconds + to: dba + + template: mysql_10s_table_locks_waited + on: mysql.table_locks + class: Database +component: MySQL + type: Latency + lookup: sum -10s absolute of waited + units: waited locks + every: 10s + info: number of table waited locks in the last 10 seconds + to: dba + + template: mysql_10s_waited_locks_ratio + on: mysql.table_locks + class: Database +component: MySQL + type: Latency + calc: ( ($mysql_10s_table_locks_waited + $mysql_10s_table_locks_immediate) > 0 ) ? (($mysql_10s_table_locks_waited * 100) / ($mysql_10s_table_locks_waited + $mysql_10s_table_locks_immediate)) : 0 + units: % + every: 10s + warn: $this > (($status >= $WARNING) ? (10) : (25)) + crit: $this > (($status == $CRITICAL) ? (25) : (50)) + delay: down 30m multiplier 1.5 max 1h + info: ratio of waited table locks over the last 10 seconds + to: dba # ----------------------------------------------------------------------------- # connections -template: mysql_connections - on: mysql.connections_active - calc: $active * 100 / $limit - units: % - every: 10s - warn: $this > (($status >= $WARNING) ? (60) : (70)) - crit: $this > (($status == $CRITICAL) ? (80) : (90)) - delay: down 15m multiplier 1.5 max 1h - info: client connections utilization - to: dba + template: mysql_connections + on: mysql.connections_active + class: Database +component: MySQL + type: Utilization + calc: $active * 100 / $limit + units: % + every: 10s + warn: $this > (($status >= $WARNING) ? (60) : (70)) + crit: $this > (($status == $CRITICAL) ? (80) : (90)) + delay: down 15m multiplier 1.5 max 1h + info: client connections utilization + to: dba # ----------------------------------------------------------------------------- # replication -template: mysql_replication - on: mysql.slave_status - calc: ($sql_running <= 0 OR $io_running <= 0)?0:1 - units: ok/failed - every: 10s - crit: $this == 0 - delay: down 5m multiplier 1.5 max 1h - info: replication status (0: stopped, 1: working) - to: dba - -template: mysql_replication_lag - on: mysql.slave_behind - calc: $seconds - units: seconds - every: 10s - warn: $this > (($status >= $WARNING) ? (5) : (10)) - crit: $this > (($status == $CRITICAL) ? (10) : (30)) - delay: down 15m multiplier 1.5 max 1h - info: difference between the timestamp of the latest transaction processed by the SQL thread and \ - the timestamp of the same transaction when it was processed on the master - to: dba + template: mysql_replication + on: mysql.slave_status + class: Database +component: MySQL + type: Errors + calc: ($sql_running <= 0 OR $io_running <= 0)?0:1 + units: ok/failed + every: 10s + crit: $this == 0 + delay: down 5m multiplier 1.5 max 1h + info: replication status (0: stopped, 1: working) + to: dba + + template: mysql_replication_lag + on: mysql.slave_behind + class: Database +component: MySQL + type: Errors + calc: $seconds + units: seconds + every: 10s + warn: $this > (($status >= $WARNING) ? (5) : (10)) + crit: $this > (($status == $CRITICAL) ? (10) : (30)) + delay: down 15m multiplier 1.5 max 1h + info: difference between the timestamp of the latest transaction processed by the SQL thread and \ + the timestamp of the same transaction when it was processed on the master + to: dba # ----------------------------------------------------------------------------- # galera cluster size -template: mysql_galera_cluster_size_max_2m - on: mysql.galera_cluster_size - lookup: max -2m absolute - units: nodes - every: 10s - info: maximum galera cluster size in the last 2 minutes - to: dba - -template: mysql_galera_cluster_size - on: mysql.galera_cluster_size - calc: $nodes - units: nodes - every: 10s - warn: $this > $mysql_galera_cluster_size_max_2m - crit: $this < $mysql_galera_cluster_size_max_2m - delay: up 20s down 5m multiplier 1.5 max 1h - info: current galera cluster size, compared to the maximum size in the last 2 minutes - to: dba + template: mysql_galera_cluster_size_max_2m + on: mysql.galera_cluster_size + class: Database +component: MySQL + type: Utilization + lookup: max -2m absolute + units: nodes + every: 10s + info: maximum galera cluster size in the last 2 minutes + to: dba + + template: mysql_galera_cluster_size + on: mysql.galera_cluster_size + class: Database +component: MySQL + type: Utilization + calc: $nodes + units: nodes + every: 10s + warn: $this > $mysql_galera_cluster_size_max_2m + crit: $this < $mysql_galera_cluster_size_max_2m + delay: up 20s down 5m multiplier 1.5 max 1h + info: current galera cluster size, compared to the maximum size in the last 2 minutes + to: dba # galera node state -template: mysql_galera_cluster_state - on: mysql.galera_cluster_state - calc: $state - every: 10s - warn: $this < 4 - crit: $this < 2 - delay: up 30s down 5m multiplier 1.5 max 1h - info: galera node state \ - (0: undefined, 1: joining, 2: donor/desynced, 3: joined, 4: synced) - to: dba + template: mysql_galera_cluster_state + on: mysql.galera_cluster_state + class: Database +component: MySQL + type: Errors + calc: $state + every: 10s + warn: $this == 2 OR $this == 3 + crit: $this == 0 OR $this == 1 OR $this >= 5 + delay: up 30s down 5m multiplier 1.5 max 1h + info: galera node state \ + (0: Undefined, 1: Joining, 2: Donor/Desynced, 3: Joined, 4: Synced, 5: Inconsistent) + to: dba # galera node status -template: mysql_galera_cluster_status - on: mysql.galera_cluster_status - calc: $wsrep_cluster_status - every: 10s - crit: $mysql_galera_cluster_state != nan AND $this != 0 - delay: up 30s down 5m multiplier 1.5 max 1h - info: galera node cluster component status \ - (-1: unknown, 0: primary/quorum present, 1: non-primary/quorum lost, 2: disconnected). \ - Any other value than primary indicates that the node is part of a nonoperational component. - to: dba + template: mysql_galera_cluster_status + on: mysql.galera_cluster_status + class: Database +component: MySQL + type: Errors + calc: $wsrep_cluster_status + every: 10s + crit: $mysql_galera_cluster_state != nan AND $this != 0 + delay: up 30s down 5m multiplier 1.5 max 1h + info: galera node cluster component status \ + (-1: unknown, 0: primary/quorum present, 1: non-primary/quorum lost, 2: disconnected). \ + Any other value than primary indicates that the node is part of a nonoperational component. + to: dba diff --git a/health/health.d/named.conf b/health/health.d/named.conf index 4fc65c8e..90266df1 100644 --- a/health/health.d/named.conf +++ b/health/health.d/named.conf @@ -1,14 +1,17 @@ # make sure named is running -template: named_last_collected_secs - on: named.global_queries - calc: $now - $last_collected_t - units: seconds ago - every: 10s - warn: $this > (($status >= $WARNING) ? ($update_every) : ( 5 * $update_every)) - crit: $this > (($status == $CRITICAL) ? ($update_every) : (60 * $update_every)) - delay: down 5m multiplier 1.5 max 1h - info: number of seconds since the last successful data collection - to: domainadmin + template: named_last_collected_secs + on: named.global_queries + class: DNS +component: BIND + type: Latency + calc: $now - $last_collected_t + units: seconds ago + every: 10s + warn: $this > (($status >= $WARNING) ? ($update_every) : ( 5 * $update_every)) + crit: $this > (($status == $CRITICAL) ? ($update_every) : (60 * $update_every)) + delay: down 5m multiplier 1.5 max 1h + info: number of seconds since the last successful data collection + to: domainadmin diff --git a/health/health.d/net.conf b/health/health.d/net.conf index 33202421..04219e16 100644 --- a/health/health.d/net.conf +++ b/health/health.d/net.conf @@ -6,16 +6,22 @@ template: interface_speed on: net.net + class: System +component: Network + type: Latency os: * hosts: * families: * calc: ( $nic_speed_max > 0 ) ? ( $nic_speed_max) : ( nan ) units: Mbit every: 10s - info: network interface current speed + info: network interface $family current speed template: 1m_received_traffic_overflow on: net.net + class: System +component: Network + type: Workload os: linux hosts: * families: * @@ -25,11 +31,14 @@ every: 10s warn: $this > (($status >= $WARNING) ? (85) : (90)) delay: up 1m down 1m multiplier 1.5 max 1h - info: average inbound utilization for the network interface over the last minute + info: average inbound utilization for the network interface $family over the last minute to: sysadmin template: 1m_sent_traffic_overflow on: net.net + class: System +component: Network + type: Workload os: linux hosts: * families: * @@ -39,7 +48,7 @@ every: 10s warn: $this > (($status >= $WARNING) ? (85) : (90)) delay: up 1m down 1m multiplier 1.5 max 1h - info: average outbound utilization for the network interface over the last minute + info: average outbound utilization for the network interface $family over the last minute to: sysadmin # ----------------------------------------------------------------------------- @@ -52,110 +61,134 @@ # it is possible to have expected packet drops on an interface for some network configurations # look at the Monitoring Network Interfaces section in the proc.plugin documentation for more information -template: inbound_packets_dropped - on: net.drops - os: linux - hosts: * -families: !net* * - lookup: sum -10m unaligned absolute of inbound - units: packets - every: 1m - info: number of inbound dropped packets for the network interface in the last 10 minutes - -template: outbound_packets_dropped - on: net.drops - os: linux - hosts: * -families: !net* * - lookup: sum -10m unaligned absolute of outbound - units: packets - every: 1m - info: number of outbound dropped packets for the network interface in the last 10 minutes - -template: inbound_packets_dropped_ratio - on: net.packets - os: linux - hosts: * -families: !net* !wl* * - lookup: sum -10m unaligned absolute of received - calc: (($inbound_packets_dropped != nan AND $this > 1000) ? ($inbound_packets_dropped * 100 / $this) : (0)) - units: % - every: 1m - warn: $this >= 2 - delay: up 1m down 1h multiplier 1.5 max 2h - info: ratio of inbound dropped packets for the network interface over the last 10 minutes - to: sysadmin - -template: outbound_packets_dropped_ratio - on: net.packets - os: linux - hosts: * -families: !net* !wl* * - lookup: sum -10m unaligned absolute of sent - calc: (($outbound_packets_dropped != nan AND $this > 1000) ? ($outbound_packets_dropped * 100 / $this) : (0)) - units: % - every: 1m - warn: $this >= 2 - delay: up 1m down 1h multiplier 1.5 max 2h - info: ratio of outbound dropped packets for the network interface over the last 10 minutes - to: sysadmin - -template: wifi_inbound_packets_dropped_ratio - on: net.packets - os: linux - hosts: * -families: wl* - lookup: sum -10m unaligned absolute of received - calc: (($inbound_packets_dropped != nan AND $this > 1000) ? ($inbound_packets_dropped * 100 / $this) : (0)) - units: % - every: 1m - warn: $this >= 10 - delay: up 1m down 1h multiplier 1.5 max 2h - info: ratio of inbound dropped packets for the network interface over the last 10 minutes - to: sysadmin - -template: wifi_outbound_packets_dropped_ratio - on: net.packets - os: linux - hosts: * -families: wl* - lookup: sum -10m unaligned absolute of sent - calc: (($outbound_packets_dropped != nan AND $this > 1000) ? ($outbound_packets_dropped * 100 / $this) : (0)) - units: % - every: 1m - warn: $this >= 10 - delay: up 1m down 1h multiplier 1.5 max 2h - info: ratio of outbound dropped packets for the network interface over the last 10 minutes - to: sysadmin + template: inbound_packets_dropped + on: net.drops + class: System +component: Network + type: Errors + os: linux + hosts: * + families: !net* * + lookup: sum -10m unaligned absolute of inbound + units: packets + every: 1m + info: number of inbound dropped packets for the network interface $family in the last 10 minutes + + template: outbound_packets_dropped + on: net.drops + class: System +component: Network + type: Errors + os: linux + hosts: * + families: !net* * + lookup: sum -10m unaligned absolute of outbound + units: packets + every: 1m + info: number of outbound dropped packets for the network interface $family in the last 10 minutes + + template: inbound_packets_dropped_ratio + on: net.packets + class: System +component: Network + type: Errors + os: linux + hosts: * + families: !net* !wl* * + lookup: sum -10m unaligned absolute of received + calc: (($inbound_packets_dropped != nan AND $this > 1000) ? ($inbound_packets_dropped * 100 / $this) : (0)) + units: % + every: 1m + warn: $this >= 2 + delay: up 1m down 1h multiplier 1.5 max 2h + info: ratio of inbound dropped packets for the network interface $family over the last 10 minutes + to: sysadmin + + template: outbound_packets_dropped_ratio + on: net.packets + class: System +component: Network + type: Errors + os: linux + hosts: * + families: !net* !wl* * + lookup: sum -10m unaligned absolute of sent + calc: (($outbound_packets_dropped != nan AND $this > 1000) ? ($outbound_packets_dropped * 100 / $this) : (0)) + units: % + every: 1m + warn: $this >= 2 + delay: up 1m down 1h multiplier 1.5 max 2h + info: ratio of outbound dropped packets for the network interface $family over the last 10 minutes + to: sysadmin + + template: wifi_inbound_packets_dropped_ratio + on: net.packets + class: System +component: Network + type: Errors + os: linux + hosts: * + families: wl* + lookup: sum -10m unaligned absolute of received + calc: (($inbound_packets_dropped != nan AND $this > 1000) ? ($inbound_packets_dropped * 100 / $this) : (0)) + units: % + every: 1m + warn: $this >= 10 + delay: up 1m down 1h multiplier 1.5 max 2h + info: ratio of inbound dropped packets for the network interface $family over the last 10 minutes + to: sysadmin + + template: wifi_outbound_packets_dropped_ratio + on: net.packets + class: System +component: Network + type: Errors + os: linux + hosts: * + families: wl* + lookup: sum -10m unaligned absolute of sent + calc: (($outbound_packets_dropped != nan AND $this > 1000) ? ($outbound_packets_dropped * 100 / $this) : (0)) + units: % + every: 1m + warn: $this >= 10 + delay: up 1m down 1h multiplier 1.5 max 2h + info: ratio of outbound dropped packets for the network interface $family over the last 10 minutes + to: sysadmin # ----------------------------------------------------------------------------- # interface errors -template: interface_inbound_errors - on: net.errors - os: freebsd - hosts: * -families: * - lookup: sum -10m unaligned absolute of inbound - units: errors - every: 1m - warn: $this >= 5 - delay: down 1h multiplier 1.5 max 2h - info: number of inbound errors for the network interface in the last 10 minutes - to: sysadmin - -template: interface_outbound_errors - on: net.errors - os: freebsd - hosts: * -families: * - lookup: sum -10m unaligned absolute of outbound - units: errors - every: 1m - warn: $this >= 5 - delay: down 1h multiplier 1.5 max 2h - info: number of outbound errors for the network interface in the last 10 minutes - to: sysadmin + template: interface_inbound_errors + on: net.errors + class: System +component: Network + type: Errors + os: freebsd + hosts: * + families: * + lookup: sum -10m unaligned absolute of inbound + units: errors + every: 1m + warn: $this >= 5 + delay: down 1h multiplier 1.5 max 2h + info: number of inbound errors for the network interface $family in the last 10 minutes + to: sysadmin + + template: interface_outbound_errors + on: net.errors + class: System +component: Network + type: Errors + os: freebsd + hosts: * + families: * + lookup: sum -10m unaligned absolute of outbound + units: errors + every: 1m + warn: $this >= 5 + delay: down 1h multiplier 1.5 max 2h + info: number of outbound errors for the network interface $family in the last 10 minutes + to: sysadmin # ----------------------------------------------------------------------------- # FIFO errors @@ -165,18 +198,21 @@ families: * # the alarm is checked every 1 minute # and examines the last 10 minutes of data -template: 10min_fifo_errors - on: net.fifo - os: linux - hosts: * -families: * - lookup: sum -10m unaligned absolute - units: errors - every: 1m - warn: $this > 0 - delay: down 1h multiplier 1.5 max 2h - info: number of FIFO errors for the network interface in the last 10 minutes - to: sysadmin + template: 10min_fifo_errors + on: net.fifo + class: System +component: Network + type: Errors + os: linux + hosts: * + families: * + lookup: sum -10m unaligned absolute + units: errors + every: 1m + warn: $this > 0 + delay: down 1h multiplier 1.5 max 2h + info: number of FIFO errors for the network interface $family in the last 10 minutes + to: sysadmin # ----------------------------------------------------------------------------- # check for packet storms @@ -187,28 +223,34 @@ families: * # we assume the minimum packet storm should at least have # 10000 packets/s, average of the last 10 seconds -template: 1m_received_packets_rate - on: net.packets - os: linux freebsd - hosts: * -families: * - lookup: average -1m unaligned of received - units: packets - every: 10s - info: average number of packets received by the network interface over the last minute - -template: 10s_received_packets_storm - on: net.packets - os: linux freebsd - hosts: * -families: * - lookup: average -10s unaligned of received - calc: $this * 100 / (($1m_received_packets_rate < 1000)?(1000):($1m_received_packets_rate)) - every: 10s - units: % - warn: $this > (($status >= $WARNING)?(200):(5000)) - crit: $this > (($status == $CRITICAL)?(5000):(6000)) - options: no-clear-notification - info: ratio of average number of received packets for the network interface over the last 10 seconds, \ - compared to the rate over the last minute - to: sysadmin + template: 1m_received_packets_rate + on: net.packets + class: System +component: Network + type: Workload + os: linux freebsd + hosts: * + families: * + lookup: average -1m unaligned of received + units: packets + every: 10s + info: average number of packets received by the network interface $family over the last minute + + template: 10s_received_packets_storm + on: net.packets + class: System +component: Network + type: Workload + os: linux freebsd + hosts: * + families: * + lookup: average -10s unaligned of received + calc: $this * 100 / (($1m_received_packets_rate < 1000)?(1000):($1m_received_packets_rate)) + every: 10s + units: % + warn: $this > (($status >= $WARNING)?(200):(5000)) + crit: $this > (($status == $CRITICAL)?(5000):(6000)) + options: no-clear-notification + info: ratio of average number of received packets for the network interface $family over the last 10 seconds, \ + compared to the rate over the last minute + to: sysadmin diff --git a/health/health.d/netfilter.conf b/health/health.d/netfilter.conf index f827d8e4..35c89caf 100644 --- a/health/health.d/netfilter.conf +++ b/health/health.d/netfilter.conf @@ -1,16 +1,19 @@ # you can disable an alarm notification by setting the 'to' line to: silent - alarm: netfilter_conntrack_full - on: netfilter.conntrack_sockets - os: linux - hosts: * - lookup: max -10s unaligned of connections - calc: $this * 100 / $netfilter_conntrack_max - units: % - every: 10s - warn: $this > (($status >= $WARNING) ? (85) : (90)) - crit: $this > (($status == $CRITICAL) ? (90) : (95)) - delay: down 5m multiplier 1.5 max 1h - info: netfilter connection tracker table size utilization - to: sysadmin + alarm: netfilter_conntrack_full + on: netfilter.conntrack_sockets + class: System +component: Network + type: Workload + os: linux + hosts: * + lookup: max -10s unaligned of connections + calc: $this * 100 / $netfilter_conntrack_max + units: % + every: 10s + warn: $this > (($status >= $WARNING) ? (85) : (90)) + crit: $this > (($status == $CRITICAL) ? (90) : (95)) + delay: down 5m multiplier 1.5 max 1h + info: netfilter connection tracker table size utilization + to: sysadmin diff --git a/health/health.d/nginx.conf b/health/health.d/nginx.conf index a686c3d9..30c738f4 100644 --- a/health/health.d/nginx.conf +++ b/health/health.d/nginx.conf @@ -1,14 +1,17 @@ # make sure nginx is running -template: nginx_last_collected_secs - on: nginx.requests - calc: $now - $last_collected_t - units: seconds ago - every: 10s - warn: $this > (($status >= $WARNING) ? ($update_every) : ( 5 * $update_every)) - crit: $this > (($status == $CRITICAL) ? ($update_every) : (60 * $update_every)) - delay: down 5m multiplier 1.5 max 1h - info: number of seconds since the last successful data collection - to: webmaster + template: nginx_last_collected_secs + on: nginx.requests + class: Web Server +component: NGINX + type: Latency + calc: $now - $last_collected_t + units: seconds ago + every: 10s + warn: $this > (($status >= $WARNING) ? ($update_every) : ( 5 * $update_every)) + crit: $this > (($status == $CRITICAL) ? ($update_every) : (60 * $update_every)) + delay: down 5m multiplier 1.5 max 1h + info: number of seconds since the last successful data collection + to: webmaster diff --git a/health/health.d/nginx_plus.conf b/health/health.d/nginx_plus.conf index 5a171a76..5849a9e7 100644 --- a/health/health.d/nginx_plus.conf +++ b/health/health.d/nginx_plus.conf @@ -1,14 +1,17 @@ # make sure nginx_plus is running -template: nginx_plus_last_collected_secs - on: nginx_plus.requests_total - calc: $now - $last_collected_t - units: seconds ago - every: 10s - warn: $this > (($status >= $WARNING) ? ($update_every) : ( 5 * $update_every)) - crit: $this > (($status == $CRITICAL) ? ($update_every) : (60 * $update_every)) - delay: down 5m multiplier 1.5 max 1h - info: number of seconds since the last successful data collection - to: webmaster + template: nginx_plus_last_collected_secs + on: nginx_plus.requests_total + class: Web Server +component: NGINX Plus + type: Latency + calc: $now - $last_collected_t + units: seconds ago + every: 10s + warn: $this > (($status >= $WARNING) ? ($update_every) : ( 5 * $update_every)) + crit: $this > (($status == $CRITICAL) ? ($update_every) : (60 * $update_every)) + delay: down 5m multiplier 1.5 max 1h + info: number of seconds since the last successful data collection + to: webmaster diff --git a/health/health.d/phpfpm.conf b/health/health.d/phpfpm.conf index ec7ae74d..fc073a94 100644 --- a/health/health.d/phpfpm.conf +++ b/health/health.d/phpfpm.conf @@ -1,14 +1,17 @@ # make sure phpfpm is running -template: phpfpm_last_collected_secs - on: phpfpm.requests - calc: $now - $last_collected_t - units: seconds ago - every: 10s - warn: $this > (($status >= $WARNING) ? ($update_every) : ( 5 * $update_every)) - crit: $this > (($status == $CRITICAL) ? ($update_every) : (60 * $update_every)) - delay: down 5m multiplier 1.5 max 1h - info: number of seconds since the last successful data collection - to: webmaster + template: phpfpm_last_collected_secs + on: phpfpm.requests + class: Web Server +component: PHP-FPM + type: Latency + calc: $now - $last_collected_t + units: seconds ago + every: 10s + warn: $this > (($status >= $WARNING) ? ($update_every) : ( 5 * $update_every)) + crit: $this > (($status == $CRITICAL) ? ($update_every) : (60 * $update_every)) + delay: down 5m multiplier 1.5 max 1h + info: number of seconds since the last successful data collection + to: webmaster diff --git a/health/health.d/pihole.conf b/health/health.d/pihole.conf index f450b712..72622cae 100644 --- a/health/health.d/pihole.conf +++ b/health/health.d/pihole.conf @@ -1,65 +1,80 @@ # Make sure Pi-hole is responding. -template: pihole_last_collected_secs - on: pihole.dns_queries_total - calc: $now - $last_collected_t - units: seconds ago - every: 10s - warn: $this > (($status >= $WARNING) ? ($update_every) : ( 5 * $update_every)) - crit: $this > (($status == $CRITICAL) ? ($update_every) : (60 * $update_every)) - delay: down 5m multiplier 1.5 max 1h - info: number of seconds since the last successful data collection - to: webmaster + template: pihole_last_collected_secs + on: pihole.dns_queries_total + class: Ad Filtering +component: Pi-hole + type: Latency + calc: $now - $last_collected_t + units: seconds ago + every: 10s + warn: $this > (($status >= $WARNING) ? ($update_every) : ( 5 * $update_every)) + crit: $this > (($status == $CRITICAL) ? ($update_every) : (60 * $update_every)) + delay: down 5m multiplier 1.5 max 1h + info: number of seconds since the last successful data collection + to: webmaster # Blocked DNS queries. -template: pihole_blocked_queries - on: pihole.dns_queries_percentage - every: 10s - units: % - calc: $blocked - warn: $this > ( ($status >= $WARNING ) ? ( 45 ) : ( 55 ) ) - crit: $this > ( ($status == $CRITICAL) ? ( 55 ) : ( 75 ) ) - delay: up 2m down 5m - info: percentage of blocked dns queries over the last 24 hour - to: sysadmin + template: pihole_blocked_queries + on: pihole.dns_queries_percentage + class: Ad Filtering +component: Pi-hole + type: Errors + every: 10s + units: % + calc: $blocked + warn: $this > ( ($status >= $WARNING ) ? ( 45 ) : ( 55 ) ) + crit: $this > ( ($status == $CRITICAL) ? ( 55 ) : ( 75 ) ) + delay: up 2m down 5m + info: percentage of blocked dns queries over the last 24 hour + to: sysadmin # Blocklist last update time. # Default update interval is a week. -template: pihole_blocklist_last_update - on: pihole.blocklist_last_update - every: 10s - units: seconds - calc: $ago - warn: $this > 60 * 60 * 24 * 8 - crit: $this > 60 * 60 * 24 * 8 * 2 - info: gravity.list (blocklist) file last update time - to: sysadmin + template: pihole_blocklist_last_update + on: pihole.blocklist_last_update + class: Ad Filtering +component: Pi-hole + type: Errors + every: 10s + units: seconds + calc: $ago + warn: $this > 60 * 60 * 24 * 8 + crit: $this > 60 * 60 * 24 * 8 * 2 + info: gravity.list (blocklist) file last update time + to: sysadmin # Gravity file check (gravity.list). -template: pihole_blocklist_gravity_file - on: pihole.blocklist_last_update - every: 10s - units: boolean - calc: $file_exists - crit: $this != 1 - delay: up 2m down 5m - info: gravity.list (blocklist) file existence state (0: exists, 1: not-exists) - to: sysadmin + template: pihole_blocklist_gravity_file + on: pihole.blocklist_last_update + class: Ad Filtering +component: Pi-hole + type: Errors + every: 10s + units: boolean + calc: $file_exists + crit: $this != 1 + delay: up 2m down 5m + info: gravity.list (blocklist) file existence state (0: exists, 1: not-exists) + to: sysadmin # Pi-hole's ability to block unwanted domains. # Should be enabled. The whole point of Pi-hole! -template: pihole_status - on: pihole.unwanted_domains_blocking_status - every: 10s - units: boolean - calc: $enabled - warn: $this != 1 - delay: up 2m down 5m - info: unwanted domains blocking status (0: enabled, 1: disabled) - to: sysadmin + template: pihole_status + on: pihole.unwanted_domains_blocking_status + class: Ad Filtering +component: Pi-hole + type: Errors + every: 10s + units: boolean + calc: $enabled + warn: $this != 1 + delay: up 2m down 5m + info: unwanted domains blocking status (0: enabled, 1: disabled) + to: sysadmin diff --git a/health/health.d/portcheck.conf b/health/health.d/portcheck.conf index 29dcebbc..b977dbb3 100644 --- a/health/health.d/portcheck.conf +++ b/health/health.d/portcheck.conf @@ -1,46 +1,58 @@ -template: portcheck_last_collected_secs -families: * - on: portcheck.status - calc: $now - $last_collected_t - every: 10s - units: seconds ago - warn: $this > (($status >= $WARNING) ? ($update_every) : ( 5 * $update_every)) - crit: $this > (($status == $CRITICAL) ? ($update_every) : (60 * $update_every)) - delay: down 5m multiplier 1.5 max 1h - info: number of seconds since the last successful data collection - to: sysadmin + template: portcheck_last_collected_secs + families: * + on: portcheck.status + class: Other +component: TCP endpoint + type: Latency + calc: $now - $last_collected_t + every: 10s + units: seconds ago + warn: $this > (($status >= $WARNING) ? ($update_every) : ( 5 * $update_every)) + crit: $this > (($status == $CRITICAL) ? ($update_every) : (60 * $update_every)) + delay: down 5m multiplier 1.5 max 1h + info: number of seconds since the last successful data collection + to: sysadmin # This is a fast-reacting no-notification alarm ideal for custom dashboards or badges -template: portcheck_service_reachable -families: * - on: portcheck.status - lookup: average -1m unaligned percentage of success - calc: ($this < 75) ? (0) : ($this) - every: 5s - units: up/down - info: average ratio of successful connections over the last minute (at least 75%) - to: silent + template: portcheck_service_reachable + families: * + on: portcheck.status + class: Other +component: TCP endpoint + type: Workload + lookup: average -1m unaligned percentage of success + calc: ($this < 75) ? (0) : ($this) + every: 5s + units: up/down + info: average ratio of successful connections over the last minute (at least 75%) + to: silent -template: portcheck_connection_timeouts -families: * - on: portcheck.status - lookup: average -5m unaligned percentage of timeout - every: 10s - units: % - warn: $this >= 10 AND $this < 40 - crit: $this >= 40 - delay: down 5m multiplier 1.5 max 1h - info: average ratio of timeouts over the last 5 minutes - to: sysadmin + template: portcheck_connection_timeouts + families: * + on: portcheck.status + class: Other +component: TCP endpoint + type: Errors + lookup: average -5m unaligned percentage of timeout + every: 10s + units: % + warn: $this >= 10 AND $this < 40 + crit: $this >= 40 + delay: down 5m multiplier 1.5 max 1h + info: average ratio of timeouts over the last 5 minutes + to: sysadmin -template: portcheck_connection_fails -families: * - on: portcheck.status - lookup: average -5m unaligned percentage of no_connection,failed - every: 10s - units: % - warn: $this >= 10 AND $this < 40 - crit: $this >= 40 - delay: down 5m multiplier 1.5 max 1h - info: average ratio of failed connections over the last 5 minutes - to: sysadmin + template: portcheck_connection_fails + families: * + on: portcheck.status + class: Other +component: TCP endpoint + type: Errors + lookup: average -5m unaligned percentage of no_connection,failed + every: 10s + units: % + warn: $this >= 10 AND $this < 40 + crit: $this >= 40 + delay: down 5m multiplier 1.5 max 1h + info: average ratio of failed connections over the last 5 minutes + to: sysadmin diff --git a/health/health.d/postgres.conf b/health/health.d/postgres.conf index 4e0583b8..f908a802 100644 --- a/health/health.d/postgres.conf +++ b/health/health.d/postgres.conf @@ -1,13 +1,16 @@ # make sure postgres is running -template: postgres_last_collected_secs - on: postgres.db_stat_transactions - calc: $now - $last_collected_t - units: seconds ago - every: 10s - warn: $this > (($status >= $WARNING) ? ($update_every) : ( 5 * $update_every)) - crit: $this > (($status == $CRITICAL) ? ($update_every) : (60 * $update_every)) - delay: down 5m multiplier 1.5 max 1h - info: number of seconds since the last successful data collection - to: dba + template: postgres_last_collected_secs + on: postgres.db_stat_transactions + class: Database +component: PostgreSQL + type: Latency + calc: $now - $last_collected_t + units: seconds ago + every: 10s + warn: $this > (($status >= $WARNING) ? ($update_every) : ( 5 * $update_every)) + crit: $this > (($status == $CRITICAL) ? ($update_every) : (60 * $update_every)) + delay: down 5m multiplier 1.5 max 1h + info: number of seconds since the last successful data collection + to: dba diff --git a/health/health.d/processes.conf b/health/health.d/processes.conf index b464d8f6..b44a24c0 100644 --- a/health/health.d/processes.conf +++ b/health/health.d/processes.conf @@ -1,13 +1,16 @@ # you can disable an alarm notification by setting the 'to' line to: silent - alarm: active_processes - on: system.active_processes - hosts: * - calc: $active * 100 / $pidmax - units: % - every: 5s - warn: $this > (($status >= $WARNING) ? (85) : (90)) - crit: $this > (($status == $CRITICAL) ? (90) : (95)) - delay: down 5m multiplier 1.5 max 1h - info: system process IDs (PID) space utilization - to: sysadmin + alarm: active_processes + on: system.active_processes + class: System +component: Processes + type: Workload + hosts: * + calc: $active * 100 / $pidmax + units: % + every: 5s + warn: $this > (($status >= $WARNING) ? (85) : (90)) + crit: $this > (($status == $CRITICAL) ? (90) : (95)) + delay: down 5m multiplier 1.5 max 1h + info: system process IDs (PID) space utilization + to: sysadmin diff --git a/health/health.d/pulsar.conf b/health/health.d/pulsar.conf index 01478945..9903d4e3 100644 --- a/health/health.d/pulsar.conf +++ b/health/health.d/pulsar.conf @@ -1,13 +1,16 @@ # Availability -template: pulsar_last_collected_secs - on: pulsar.broker_components - calc: $now - $last_collected_t - units: seconds ago - every: 10s - warn: $this > (($status >= $WARNING) ? ($update_every) : ( 5 * $update_every)) - crit: $this > (($status == $CRITICAL) ? ($update_every) : (60 * $update_every)) - delay: down 5m multiplier 1.5 max 1h - info: number of seconds since the last successful data collection - to: sysadmin + template: pulsar_last_collected_secs + on: pulsar.broker_components + class: Messaging +component: Pulsar + type: Latency + calc: $now - $last_collected_t + units: seconds ago + every: 10s + warn: $this > (($status >= $WARNING) ? ($update_every) : ( 5 * $update_every)) + crit: $this > (($status == $CRITICAL) ? ($update_every) : (60 * $update_every)) + delay: down 5m multiplier 1.5 max 1h + info: number of seconds since the last successful data collection + to: sysadmin diff --git a/health/health.d/ram.conf b/health/health.d/ram.conf index 2daecc48..0e3cc29f 100644 --- a/health/health.d/ram.conf +++ b/health/health.d/ram.conf @@ -1,65 +1,92 @@ # you can disable an alarm notification by setting the 'to' line to: silent - alarm: used_ram_to_ignore - on: system.ram - os: linux freebsd - hosts: * - calc: ($zfs.arc_size.arcsz = nan)?(0):($zfs.arc_size.arcsz - $zfs.arc_size.min) - every: 10s - info: amount of memory reported as used, \ - but it is actually capable for resizing itself based on the system needs (eg. ZFS ARC) + alarm: used_ram_to_ignore + on: system.ram + class: System +component: Memory + type: Utilization + os: linux freebsd + hosts: * + calc: ($zfs.arc_size.arcsz = nan)?(0):($zfs.arc_size.arcsz - $zfs.arc_size.min) + every: 10s + info: amount of memory reported as used, \ + but it is actually capable for resizing itself based on the system needs (eg. ZFS ARC) - alarm: ram_in_use - on: system.ram - os: linux - hosts: * -# calc: $used * 100 / ($used + $cached + $free) - calc: ($used - $used_ram_to_ignore) * 100 / ($used + $cached + $free) - units: % - every: 10s - warn: $this > (($status >= $WARNING) ? (80) : (90)) - crit: $this > (($status == $CRITICAL) ? (90) : (98)) - delay: down 15m multiplier 1.5 max 1h - info: system memory utilization - to: sysadmin + alarm: ram_in_use + on: system.ram + class: System +component: Memory + type: Utilization + os: linux + hosts: * +# calc: $used * 100 / ($used + $cached + $free) + calc: ($used - $used_ram_to_ignore) * 100 / ($used + $cached + $free) + units: % + every: 10s + warn: $this > (($status >= $WARNING) ? (80) : (90)) + crit: $this > (($status == $CRITICAL) ? (90) : (98)) + delay: down 15m multiplier 1.5 max 1h + info: system memory utilization + to: sysadmin + + alarm: ram_available + on: mem.available + class: System +component: Memory + type: Utilization + os: linux + hosts: * + calc: ($avail + $system.ram.used_ram_to_ignore) * 100 / ($system.ram.used + $system.ram.cached + $system.ram.free + $system.ram.buffers) + units: % + every: 10s + warn: $this < (($status >= $WARNING) ? (15) : (10)) + crit: $this < (($status == $CRITICAL) ? (10) : ( 5)) + delay: down 15m multiplier 1.5 max 1h + info: percentage of estimated amount of RAM available for userspace processes, without causing swapping + to: sysadmin - alarm: ram_available - on: mem.available + alarm: oom_kill + on: mem.oom_kill os: linux hosts: * - calc: ($avail + $system.ram.used_ram_to_ignore) * 100 / ($system.ram.used + $system.ram.cached + $system.ram.free + $system.ram.buffers) - units: % + lookup: sum -1m unaligned + units: kills every: 10s - warn: $this < (($status >= $WARNING) ? (15) : (10)) - crit: $this < (($status == $CRITICAL) ? (10) : ( 5)) - delay: down 15m multiplier 1.5 max 1h - info: percentage of estimated amount of RAM available for userspace processes, without causing swapping + warn: $this > 0 + delay: down 5m + info: number of out of memory kills in the last minute to: sysadmin ## FreeBSD - alarm: ram_in_use - on: system.ram - os: freebsd - hosts: * - calc: ($active + $wired + $laundry + $buffers - $used_ram_to_ignore) * 100 / ($active + $wired + $laundry + $buffers - $used_ram_to_ignore + $cache + $free + $inactive) - units: % - every: 10s - warn: $this > (($status >= $WARNING) ? (80) : (90)) - crit: $this > (($status == $CRITICAL) ? (90) : (98)) - delay: down 15m multiplier 1.5 max 1h - info: system memory utilization - to: sysadmin + alarm: ram_in_use + on: system.ram + class: System +component: Memory + type: Utilization + os: freebsd + hosts: * + calc: ($active + $wired + $laundry + $buffers - $used_ram_to_ignore) * 100 / ($active + $wired + $laundry + $buffers - $used_ram_to_ignore + $cache + $free + $inactive) + units: % + every: 10s + warn: $this > (($status >= $WARNING) ? (80) : (90)) + crit: $this > (($status == $CRITICAL) ? (90) : (98)) + delay: down 15m multiplier 1.5 max 1h + info: system memory utilization + to: sysadmin - alarm: ram_available - on: system.ram - os: freebsd - hosts: * - calc: ($free + $inactive + $used_ram_to_ignore) * 100 / ($free + $active + $inactive + $wired + $cache + $laundry + $buffers) - units: % - every: 10s - warn: $this < (($status >= $WARNING) ? (15) : (10)) - crit: $this < (($status == $CRITICAL) ? (10) : ( 5)) - delay: down 15m multiplier 1.5 max 1h - info: percentage of estimated amount of RAM available for userspace processes, without causing swapping - to: sysadmin + alarm: ram_available + on: system.ram + class: System +component: Memory + type: Utilization + os: freebsd + hosts: * + calc: ($free + $inactive + $used_ram_to_ignore) * 100 / ($free + $active + $inactive + $wired + $cache + $laundry + $buffers) + units: % + every: 10s + warn: $this < (($status >= $WARNING) ? (15) : (10)) + crit: $this < (($status == $CRITICAL) ? (10) : ( 5)) + delay: down 15m multiplier 1.5 max 1h + info: percentage of estimated amount of RAM available for userspace processes, without causing swapping + to: sysadmin diff --git a/health/health.d/redis.conf b/health/health.d/redis.conf index 43f98a1d..e8b28994 100644 --- a/health/health.d/redis.conf +++ b/health/health.d/redis.conf @@ -1,34 +1,43 @@ # make sure redis is running -template: redis_last_collected_secs - on: redis.operations - calc: $now - $last_collected_t - units: seconds ago - every: 10s - warn: $this > (($status >= $WARNING) ? ($update_every) : ( 5 * $update_every)) - crit: $this > (($status == $CRITICAL) ? ($update_every) : (60 * $update_every)) - delay: down 5m multiplier 1.5 max 1h - info: number of seconds since the last successful data collection - to: dba + template: redis_last_collected_secs + on: redis.operations + class: KV Storage +component: Redis + type: Latency + calc: $now - $last_collected_t + units: seconds ago + every: 10s + warn: $this > (($status >= $WARNING) ? ($update_every) : ( 5 * $update_every)) + crit: $this > (($status == $CRITICAL) ? ($update_every) : (60 * $update_every)) + delay: down 5m multiplier 1.5 max 1h + info: number of seconds since the last successful data collection + to: dba -template: redis_bgsave_broken -families: * - on: redis.bgsave_health - every: 10s - crit: $rdb_last_bgsave_status != 0 - units: ok/failed - info: status of the last RDB save operation (0: ok, 1: error) - delay: down 5m multiplier 1.5 max 1h - to: dba + template: redis_bgsave_broken + families: * + on: redis.bgsave_health + class: KV Storage +component: Redis + type: Errors + every: 10s + crit: $rdb_last_bgsave_status != 0 + units: ok/failed + info: status of the last RDB save operation (0: ok, 1: error) + delay: down 5m multiplier 1.5 max 1h + to: dba -template: redis_bgsave_slow -families: * - on: redis.bgsave_now - every: 10s - warn: $rdb_bgsave_in_progress > 600 - crit: $rdb_bgsave_in_progress > 1200 - units: seconds - info: duration of the on-going RDB save operation - delay: down 5m multiplier 1.5 max 1h - to: dba + template: redis_bgsave_slow + families: * + on: redis.bgsave_now + class: KV Storage +component: Redis + type: Latency + every: 10s + warn: $rdb_bgsave_in_progress > 600 + crit: $rdb_bgsave_in_progress > 1200 + units: seconds + info: duration of the on-going RDB save operation + delay: down 5m multiplier 1.5 max 1h + to: dba diff --git a/health/health.d/retroshare.conf b/health/health.d/retroshare.conf index 51b1deb4..ca22e60d 100644 --- a/health/health.d/retroshare.conf +++ b/health/health.d/retroshare.conf @@ -1,25 +1,31 @@ # make sure RetroShare is running -template: retroshare_last_collected_secs - on: retroshare.peers - calc: $now - $last_collected_t - units: seconds ago - every: 10s - warn: $this > (($status >= $WARNING) ? ($update_every) : ( 5 * $update_every)) - crit: $this > (($status == $CRITICAL) ? ($update_every) : (60 * $update_every)) - delay: down 5m multiplier 1.5 max 1h - info: number of seconds since the last successful data collection - to: sysadmin + template: retroshare_last_collected_secs + on: retroshare.peers + class: Data Sharing +component: Retroshare + type: Latency + calc: $now - $last_collected_t + units: seconds ago + every: 10s + warn: $this > (($status >= $WARNING) ? ($update_every) : ( 5 * $update_every)) + crit: $this > (($status == $CRITICAL) ? ($update_every) : (60 * $update_every)) + delay: down 5m multiplier 1.5 max 1h + info: number of seconds since the last successful data collection + to: sysadmin # make sure the DHT is fine when active -template: retroshare_dht_working - on: retroshare.dht - calc: $dht_size_all - units: peers - every: 1m - warn: $this < (($status >= $WARNING) ? (120) : (100)) - crit: $this < (($status == $CRITICAL) ? (10) : (1)) - delay: up 0 down 15m multiplier 1.5 max 1h - info: number of DHT peers - to: sysadmin + template: retroshare_dht_working + on: retroshare.dht + class: Data Sharing +component: Retroshare + type: Utilization + calc: $dht_size_all + units: peers + every: 1m + warn: $this < (($status >= $WARNING) ? (120) : (100)) + crit: $this < (($status == $CRITICAL) ? (10) : (1)) + delay: up 0 down 15m multiplier 1.5 max 1h + info: number of DHT peers + to: sysadmin diff --git a/health/health.d/riakkv.conf b/health/health.d/riakkv.conf index d6346026..b2c0e8d9 100644 --- a/health/health.d/riakkv.conf +++ b/health/health.d/riakkv.conf @@ -1,86 +1,107 @@ # Ensure that Riak is running. template: riak_last_collected_secs -template: riakkv_last_collected_secs - on: riak.kv.throughput - calc: $now - $last_collected_t - units: seconds ago - every: 10s - warn: $this > (($status >= $WARNING) ? ($update_every) : ( 5 * $update_every)) - crit: $this > (($status == $CRITICAL) ? ($update_every) : (60 * $update_every)) - delay: down 5m multiplier 1.5 max 1h - info: number of seconds since the last successful data collection - to: dba + template: riakkv_last_collected_secs + on: riak.kv.throughput + class: Database +component: Riak KV + type: Latency + calc: $now - $last_collected_t + units: seconds ago + every: 10s + warn: $this > (($status >= $WARNING) ? ($update_every) : ( 5 * $update_every)) + crit: $this > (($status == $CRITICAL) ? ($update_every) : (60 * $update_every)) + delay: down 5m multiplier 1.5 max 1h + info: number of seconds since the last successful data collection + to: dba # Warn if a list keys operation is running. -template: riakkv_list_keys_active - on: riak.core.fsm_active - calc: $list_fsm_active - units: state machines - every: 10s - warn: $list_fsm_active > 0 - info: number of currently running list keys finite state machines - to: dba + template: riakkv_list_keys_active + on: riak.core.fsm_active + class: Database +component: Riak KV + type: Utilization + calc: $list_fsm_active + units: state machines + every: 10s + warn: $list_fsm_active > 0 + info: number of currently running list keys finite state machines + to: dba ## Timing healthchecks # KV GET -template: riakkv_1h_kv_get_mean_latency - on: riak.kv.latency.get - calc: $node_get_fsm_time_mean - lookup: average -1h unaligned of time - every: 30s - units: ms - info: average time between reception of client GET request and \ - subsequent response to client over the last hour + template: riakkv_1h_kv_get_mean_latency + on: riak.kv.latency.get + class: Database +component: Riak KV + type: Latency + calc: $node_get_fsm_time_mean + lookup: average -1h unaligned of time + every: 30s + units: ms + info: average time between reception of client GET request and \ + subsequent response to client over the last hour -template: riakkv_kv_get_slow - on: riak.kv.latency.get - calc: $mean - lookup: average -3m unaligned of time - units: ms - every: 10s - warn: ($this > ($riakkv_1h_kv_get_mean_latency * 2) ) - crit: ($this > ($riakkv_1h_kv_get_mean_latency * 3) ) - info: average time between reception of client GET request and \ - subsequent response to the client over the last 3 minutes, \ - compared to the average over the last hour - delay: down 5m multiplier 1.5 max 1h - to: dba + template: riakkv_kv_get_slow + on: riak.kv.latency.get + class: Database +component: Riak KV + type: Latency + calc: $mean + lookup: average -3m unaligned of time + units: ms + every: 10s + warn: ($this > ($riakkv_1h_kv_get_mean_latency * 2) ) + crit: ($this > ($riakkv_1h_kv_get_mean_latency * 3) ) + info: average time between reception of client GET request and \ + subsequent response to the client over the last 3 minutes, \ + compared to the average over the last hour + delay: down 5m multiplier 1.5 max 1h + to: dba # KV PUT -template: riakkv_1h_kv_put_mean_latency - on: riak.kv.latency.put - calc: $node_put_fsm_time_mean - lookup: average -1h unaligned of time - every: 30s - units: ms - info: average time between reception of client PUT request and \ - subsequent response to the client over the last hour + template: riakkv_1h_kv_put_mean_latency + on: riak.kv.latency.put + class: Database +component: Riak KV + type: Latency + calc: $node_put_fsm_time_mean + lookup: average -1h unaligned of time + every: 30s + units: ms + info: average time between reception of client PUT request and \ + subsequent response to the client over the last hour -template: riakkv_kv_put_slow - on: riak.kv.latency.put - calc: $mean - lookup: average -3m unaligned of time - units: ms - every: 10s - warn: ($this > ($riakkv_1h_kv_put_mean_latency * 2) ) - crit: ($this > ($riakkv_1h_kv_put_mean_latency * 3) ) - info: average time between reception of client PUT request and \ - subsequent response to the client over the last 3 minutes, \ - compared to the average over the last hour - delay: down 5m multiplier 1.5 max 1h - to: dba + template: riakkv_kv_put_slow + on: riak.kv.latency.put + class: Database +component: Riak KV + type: Latency + calc: $mean + lookup: average -3m unaligned of time + units: ms + every: 10s + warn: ($this > ($riakkv_1h_kv_put_mean_latency * 2) ) + crit: ($this > ($riakkv_1h_kv_put_mean_latency * 3) ) + info: average time between reception of client PUT request and \ + subsequent response to the client over the last 3 minutes, \ + compared to the average over the last hour + delay: down 5m multiplier 1.5 max 1h + to: dba ## VM healthchecks # Default Erlang VM process limit: 262144 # On systems observed, this is < 2000, but may grow depending on load. -template: riakkv_vm_high_process_count - on: riak.vm - calc: $sys_process_count - units: processes - every: 10s - warn: $this > 10000 - crit: $this > 100000 - info: number of processes running in the Erlang VM - to: dba + template: riakkv_vm_high_process_count + on: riak.vm + class: Database +component: Riak KV + type: Utilization + calc: $sys_process_count + units: processes + every: 10s + warn: $this > 10000 + crit: $this > 100000 + info: number of processes running in the Erlang VM + to: dba diff --git a/health/health.d/scaleio.conf b/health/health.d/scaleio.conf index ab9771bb..3c0dc116 100644 --- a/health/health.d/scaleio.conf +++ b/health/health.d/scaleio.conf @@ -1,38 +1,47 @@ # make sure scaleio is running -template: scaleio_last_collected_secs - on: scaleio.system_capacity_total - calc: $now - $last_collected_t - units: seconds ago - every: 10s - warn: $this > (($status >= $WARNING) ? ($update_every) : ( 5 * $update_every)) - crit: $this > (($status == $CRITICAL) ? ($update_every) : (60 * $update_every)) - delay: down 5m multiplier 1.5 max 1h - info: number of seconds since the last successful data collection - to: sysadmin + template: scaleio_last_collected_secs + on: scaleio.system_capacity_total + class: Storage +component: ScaleIO + type: Latency + calc: $now - $last_collected_t + units: seconds ago + every: 10s + warn: $this > (($status >= $WARNING) ? ($update_every) : ( 5 * $update_every)) + crit: $this > (($status == $CRITICAL) ? ($update_every) : (60 * $update_every)) + delay: down 5m multiplier 1.5 max 1h + info: number of seconds since the last successful data collection + to: sysadmin # make sure Storage Pool capacity utilization is under limit -template: scaleio_storage_pool_capacity_utilization - on: scaleio.storage_pool_capacity_utilization - calc: $used - units: % - every: 10s - warn: $this > (($status >= $WARNING) ? (80) : (90)) - crit: $this > (($status == $CRITICAL) ? (90) : (98)) - delay: down 15m multiplier 1.5 max 1h - info: storage pool capacity utilization - to: sysadmin + template: scaleio_storage_pool_capacity_utilization + on: scaleio.storage_pool_capacity_utilization + class: Storage +component: ScaleIO + type: Utilization + calc: $used + units: % + every: 10s + warn: $this > (($status >= $WARNING) ? (80) : (90)) + crit: $this > (($status == $CRITICAL) ? (90) : (98)) + delay: down 15m multiplier 1.5 max 1h + info: storage pool capacity utilization + to: sysadmin # make sure Sdc is connected to MDM -template: scaleio_sdc_mdm_connection_state - on: scaleio.sdc_mdm_connection_state - calc: $connected - every: 10s - warn: $this != 1 - delay: up 30s down 5m multiplier 1.5 max 1h - info: Data Client (SDC) to Metadata Manager (MDM) connection state (0: disconnected, 1: connected) - to: sysadmin + template: scaleio_sdc_mdm_connection_state + on: scaleio.sdc_mdm_connection_state + class: Storage +component: ScaleIO + type: Utilization + calc: $connected + every: 10s + warn: $this != 1 + delay: up 30s down 5m multiplier 1.5 max 1h + info: Data Client (SDC) to Metadata Manager (MDM) connection state (0: disconnected, 1: connected) + to: sysadmin diff --git a/health/health.d/softnet.conf b/health/health.d/softnet.conf index f761e4a0..d8b01caf 100644 --- a/health/health.d/softnet.conf +++ b/health/health.d/softnet.conf @@ -3,43 +3,52 @@ # check for common /proc/net/softnet_stat errors - alarm: 1min_netdev_backlog_exceeded - on: system.softnet_stat - os: linux - hosts: * - lookup: average -1m unaligned absolute of dropped - units: packets - every: 10s - warn: $this > (($status >= $WARNING) ? (0) : (10)) - delay: down 1h multiplier 1.5 max 2h - info: average number of dropped packets in the last minute \ - due to exceeded net.core.netdev_max_backlog - to: sysadmin + alarm: 1min_netdev_backlog_exceeded + on: system.softnet_stat + class: System +component: Network + type: Errors + os: linux + hosts: * + lookup: average -1m unaligned absolute of dropped + units: packets + every: 10s + warn: $this > (($status >= $WARNING) ? (0) : (10)) + delay: down 1h multiplier 1.5 max 2h + info: average number of dropped packets in the last minute \ + due to exceeded net.core.netdev_max_backlog + to: sysadmin - alarm: 1min_netdev_budget_ran_outs - on: system.softnet_stat - os: linux - hosts: * - lookup: average -1m unaligned absolute of squeezed - units: events - every: 10s - warn: $this > (($status >= $WARNING) ? (0) : (10)) - delay: down 1h multiplier 1.5 max 2h - info: average number of times ksoftirq ran out of sysctl net.core.netdev_budget or \ - net.core.netdev_budget_usecs with work remaining over the last minute \ - (this can be a cause for dropped packets) - to: silent + alarm: 1min_netdev_budget_ran_outs + on: system.softnet_stat + class: System +component: Network + type: Errors + os: linux + hosts: * + lookup: average -1m unaligned absolute of squeezed + units: events + every: 10s + warn: $this > (($status >= $WARNING) ? (0) : (10)) + delay: down 1h multiplier 1.5 max 2h + info: average number of times ksoftirq ran out of sysctl net.core.netdev_budget or \ + net.core.netdev_budget_usecs with work remaining over the last minute \ + (this can be a cause for dropped packets) + to: silent - alarm: 10min_netisr_backlog_exceeded - on: system.softnet_stat - os: freebsd - hosts: * - lookup: average -1m unaligned absolute of qdrops - units: packets - every: 10s - warn: $this > (($status >= $WARNING) ? (0) : (10)) - delay: down 1h multiplier 1.5 max 2h - info: average number of drops in the last minute \ - due to exceeded sysctl net.route.netisr_maxqlen \ - (this can be a cause for dropped packets) - to: sysadmin + alarm: 10min_netisr_backlog_exceeded + on: system.softnet_stat + class: System +component: Network + type: Errors + os: freebsd + hosts: * + lookup: average -1m unaligned absolute of qdrops + units: packets + every: 10s + warn: $this > (($status >= $WARNING) ? (0) : (10)) + delay: down 1h multiplier 1.5 max 2h + info: average number of drops in the last minute \ + due to exceeded sysctl net.route.netisr_maxqlen \ + (this can be a cause for dropped packets) + to: sysadmin diff --git a/health/health.d/squid.conf b/health/health.d/squid.conf index 06cc9678..5c3d1762 100644 --- a/health/health.d/squid.conf +++ b/health/health.d/squid.conf @@ -1,14 +1,17 @@ # make sure squid is running -template: squid_last_collected_secs - on: squid.clients_requests - calc: $now - $last_collected_t - units: seconds ago - every: 10s - warn: $this > (($status >= $WARNING) ? ($update_every) : ( 5 * $update_every)) - crit: $this > (($status == $CRITICAL) ? ($update_every) : (60 * $update_every)) - delay: down 5m multiplier 1.5 max 1h - info: number of seconds since the last successful data collection - to: proxyadmin + template: squid_last_collected_secs + on: squid.clients_requests + class: Web Proxy +component: Squid + type: Latency + calc: $now - $last_collected_t + units: seconds ago + every: 10s + warn: $this > (($status >= $WARNING) ? ($update_every) : ( 5 * $update_every)) + crit: $this > (($status == $CRITICAL) ? ($update_every) : (60 * $update_every)) + delay: down 5m multiplier 1.5 max 1h + info: number of seconds since the last successful data collection + to: proxyadmin diff --git a/health/health.d/stiebeleltron.conf b/health/health.d/stiebeleltron.conf index e0361eb2..f793b5ed 100644 --- a/health/health.d/stiebeleltron.conf +++ b/health/health.d/stiebeleltron.conf @@ -1,11 +1,14 @@ -template: stiebeleltron_last_collected_secs -families: * - on: stiebeleltron.heating.hc1 - calc: $now - $last_collected_t - every: 10s - units: seconds ago - warn: $this > (($status >= $WARNING) ? ($update_every) : ( 5 * $update_every)) - crit: $this > (($status == $CRITICAL) ? ($update_every) : (60 * $update_every)) - delay: down 5m multiplier 1.5 max 1h - info: number of seconds since the last successful data collection - to: sitemgr + template: stiebeleltron_last_collected_secs + families: * + on: stiebeleltron.heating.hc1 + class: Other +component: Sensors + type: Latency + calc: $now - $last_collected_t + every: 10s + units: seconds ago + warn: $this > (($status >= $WARNING) ? ($update_every) : ( 5 * $update_every)) + crit: $this > (($status == $CRITICAL) ? ($update_every) : (60 * $update_every)) + delay: down 5m multiplier 1.5 max 1h + info: number of seconds since the last successful data collection + to: sitemgr diff --git a/health/health.d/swap.conf b/health/health.d/swap.conf index 66c36c13..5b3f89a9 100644 --- a/health/health.d/swap.conf +++ b/health/health.d/swap.conf @@ -1,29 +1,35 @@ # you can disable an alarm notification by setting the 'to' line to: silent - alarm: 30min_ram_swapped_out - on: system.swapio - os: linux freebsd - hosts: * - lookup: sum -30m unaligned absolute of out - # we have to convert KB to MB by dividing $this (i.e. the result of the lookup) with 1024 - calc: $this / 1024 * 100 / ( $system.ram.used + $system.ram.cached + $system.ram.free ) - units: % of RAM - every: 1m - warn: $this > (($status >= $WARNING) ? (20) : (30)) - delay: down 15m multiplier 1.5 max 1h - info: percentage of the system RAM swapped in the last 30 minutes - to: sysadmin + alarm: 30min_ram_swapped_out + on: system.swapio + class: System +component: Memory + type: Workload + os: linux freebsd + hosts: * + lookup: sum -30m unaligned absolute of out + # we have to convert KB to MB by dividing $this (i.e. the result of the lookup) with 1024 + calc: $this / 1024 * 100 / ( $system.ram.used + $system.ram.cached + $system.ram.free ) + units: % of RAM + every: 1m + warn: $this > (($status >= $WARNING) ? (20) : (30)) + delay: down 15m multiplier 1.5 max 1h + info: percentage of the system RAM swapped in the last 30 minutes + to: sysadmin - alarm: used_swap - on: system.swap - os: linux freebsd - hosts: * - calc: $used * 100 / ( $used + $free ) - units: % - every: 10s - warn: $this > (($status >= $WARNING) ? (80) : (90)) - crit: $this > (($status == $CRITICAL) ? (90) : (98)) - delay: up 30s down 15m multiplier 1.5 max 1h - info: swap memory utilization - to: sysadmin + alarm: used_swap + on: system.swap + class: System +component: Memory + type: Utilization + os: linux freebsd + hosts: * + calc: $used * 100 / ( $used + $free ) + units: % + every: 10s + warn: $this > (($status >= $WARNING) ? (80) : (90)) + crit: $this > (($status == $CRITICAL) ? (90) : (98)) + delay: up 30s down 15m multiplier 1.5 max 1h + info: swap memory utilization + to: sysadmin diff --git a/health/health.d/systemdunits.conf b/health/health.d/systemdunits.conf new file mode 100644 index 00000000..cc1a8698 --- /dev/null +++ b/health/health.d/systemdunits.conf @@ -0,0 +1,142 @@ +## Check if the are any systemd units in the failed state (crashed). +## States: 1 - active, 2 - inactive, 3 - activating, 4 - deactivating, 5 - failed. + +## Service units + template: systemd_service_units_state + on: systemd.service_units_state + class: Linux +component: Systemd units + type: Errors + lookup: max -1s min2max + units: ok/failed + every: 10s + warn: $this != nan AND $this == 5 + delay: down 5m multiplier 1.5 max 1h + info: one or more systemd service units are in the failed state + to: sysadmin + +## Socket units + template: systemd_socket_units_state + on: systemd.socket_unit_state + class: Linux +component: Systemd units + type: Errors + lookup: max -1s min2max + units: ok/failed + every: 10s + warn: $this != nan AND $this == 5 + delay: down 5m multiplier 1.5 max 1h + info: one or more systemd socket units are in the failed state + to: sysadmin + +## Target units + template: systemd_target_units_state + on: systemd.target_unit_state + class: Linux +component: Systemd units + type: Errors + lookup: max -1s min2max + units: ok/failed + every: 10s + warn: $this != nan AND $this == 5 + delay: down 5m multiplier 1.5 max 1h + info: one or more systemd target units are in the failed state + to: sysadmin + +## Path units + template: systemd_path_units_state + on: systemd.path_unit_state + class: Linux +component: Systemd units + type: Errors + lookup: max -1s min2max + units: ok/failed + every: 10s + warn: $this != nan AND $this == 5 + delay: down 5m multiplier 1.5 max 1h + info: one or more systemd path units are in the failed state + to: sysadmin + +## Device units + template: systemd_device_units_state + on: systemd.device_unit_state + class: Linux +component: Systemd units + type: Errors + lookup: max -1s min2max + units: ok/failed + every: 10s + warn: $this != nan AND $this == 5 + delay: down 5m multiplier 1.5 max 1h + info: one or more the systemd device units are in the failed state + to: sysadmin + +## Mount units + template: systemd_mount_units_state + on: systemd.mount_unit_state + class: Linux +component: Systemd units + type: Errors + lookup: max -1s min2max + units: ok/failed + every: 10s + warn: $this != nan AND $this == 5 + delay: down 5m multiplier 1.5 max 1h + info: one or more the systemd mount units are in the failed state + to: sysadmin + +## Automount units + template: systemd_automount_units_state + on: systemd.automount_unit_state + class: Linux +component: Systemd units + type: Errors + lookup: max -1s min2max + units: ok/failed + every: 10s + warn: $this != nan AND $this == 5 + delay: down 5m multiplier 1.5 max 1h + info: one or more systemd automount units are in the failed state + to: sysadmin + +## Swap units + template: systemd_swap_units_state + on: systemd.swap_unit_state + class: Linux +component: Systemd units + type: Errors + lookup: max -1s min2max + units: ok/failed + every: 10s + warn: $this != nan AND $this == 5 + delay: down 5m multiplier 1.5 max 1h + info: one or more systemd swap units are in the failed state + to: sysadmin + +## Scope units + template: systemd_scope_units_state + on: systemd.scope_unit_state + class: Linux +component: Systemd units + type: Errors + lookup: max -1s min2max + units: ok/failed + every: 10s + warn: $this != nan AND $this == 5 + delay: down 5m multiplier 1.5 max 1h + info: one or more systemd scope units are in the failed state + to: sysadmin + +## Slice units + template: systemd_slice_units_state + on: systemd.slice_unit_state + class: Linux +component: Systemd units + type: Errors + lookup: max -1s min2max + units: ok/failed + every: 10s + warn: $this != nan AND $this == 5 + delay: down 5m multiplier 1.5 max 1h + info: one or more systemd slice units are in the failed state + to: sysadmin diff --git a/health/health.d/tcp_conn.conf b/health/health.d/tcp_conn.conf index 38b1062d..f2c5e4e5 100644 --- a/health/health.d/tcp_conn.conf +++ b/health/health.d/tcp_conn.conf @@ -5,15 +5,18 @@ # In this case, the alarm will always be zero. # - alarm: tcp_connections - on: ipv4.tcpsock - os: linux - hosts: * - calc: (${tcp_max_connections} > 0) ? ( ${connections} * 100 / ${tcp_max_connections} ) : 0 - units: % - every: 10s - warn: $this > (($status >= $WARNING ) ? ( 60 ) : ( 80 )) - crit: $this > (($status == $CRITICAL) ? ( 80 ) : ( 90 )) - delay: up 0 down 5m multiplier 1.5 max 1h - info: IPv4 TCP connections utilization - to: sysadmin + alarm: tcp_connections + on: ipv4.tcpsock + class: System +component: Network + type: Workload + os: linux + hosts: * + calc: (${tcp_max_connections} > 0) ? ( ${connections} * 100 / ${tcp_max_connections} ) : 0 + units: % + every: 10s + warn: $this > (($status >= $WARNING ) ? ( 60 ) : ( 80 )) + crit: $this > (($status == $CRITICAL) ? ( 80 ) : ( 90 )) + delay: up 0 down 5m multiplier 1.5 max 1h + info: IPv4 TCP connections utilization + to: sysadmin diff --git a/health/health.d/tcp_listen.conf b/health/health.d/tcp_listen.conf index dad462eb..51a0e461 100644 --- a/health/health.d/tcp_listen.conf +++ b/health/health.d/tcp_listen.conf @@ -18,33 +18,39 @@ # ----------------------------------------------------------------------------- # tcp accept queue (at the kernel) - alarm: 1m_tcp_accept_queue_overflows - on: ip.tcp_accept_queue - os: linux - hosts: * - lookup: average -60s unaligned absolute of ListenOverflows - units: overflows - every: 10s - warn: $this > 1 - crit: $this > (($status == $CRITICAL) ? (1) : (5)) - delay: up 0 down 5m multiplier 1.5 max 1h - info: average number of overflows in the TCP accept queue over the last minute - to: sysadmin + alarm: 1m_tcp_accept_queue_overflows + on: ip.tcp_accept_queue + class: System +component: Network + type: Workload + os: linux + hosts: * + lookup: average -60s unaligned absolute of ListenOverflows + units: overflows + every: 10s + warn: $this > 1 + crit: $this > (($status == $CRITICAL) ? (1) : (5)) + delay: up 0 down 5m multiplier 1.5 max 1h + info: average number of overflows in the TCP accept queue over the last minute + to: sysadmin # THIS IS TOO GENERIC # CHECK: https://github.com/netdata/netdata/issues/3234#issuecomment-423935842 - alarm: 1m_tcp_accept_queue_drops - on: ip.tcp_accept_queue - os: linux - hosts: * - lookup: average -60s unaligned absolute of ListenDrops - units: drops - every: 10s - warn: $this > 1 - crit: $this > (($status == $CRITICAL) ? (1) : (5)) - delay: up 0 down 5m multiplier 1.5 max 1h - info: average number of dropped packets in the TCP accept queue over the last minute - to: sysadmin + alarm: 1m_tcp_accept_queue_drops + on: ip.tcp_accept_queue + class: System +component: Network + type: Workload + os: linux + hosts: * + lookup: average -60s unaligned absolute of ListenDrops + units: drops + every: 10s + warn: $this > 1 + crit: $this > (($status == $CRITICAL) ? (1) : (5)) + delay: up 0 down 5m multiplier 1.5 max 1h + info: average number of dropped packets in the TCP accept queue over the last minute + to: sysadmin # ----------------------------------------------------------------------------- @@ -55,30 +61,36 @@ # enabled or not. In both cases this probably indicates a SYN flood attack, # so i guess a notification should be sent. - alarm: 1m_tcp_syn_queue_drops - on: ip.tcp_syn_queue - os: linux - hosts: * - lookup: average -60s unaligned absolute of TCPReqQFullDrop - units: drops - every: 10s - warn: $this > 1 - crit: $this > (($status == $CRITICAL) ? (0) : (5)) - delay: up 10 down 5m multiplier 1.5 max 1h - info: average number of SYN requests was dropped due to the full TCP SYN queue over the last minute \ - (SYN cookies were not enabled) - to: sysadmin + alarm: 1m_tcp_syn_queue_drops + on: ip.tcp_syn_queue + class: System +component: Network + type: Workload + os: linux + hosts: * + lookup: average -60s unaligned absolute of TCPReqQFullDrop + units: drops + every: 10s + warn: $this > 1 + crit: $this > (($status == $CRITICAL) ? (0) : (5)) + delay: up 10 down 5m multiplier 1.5 max 1h + info: average number of SYN requests was dropped due to the full TCP SYN queue over the last minute \ + (SYN cookies were not enabled) + to: sysadmin - alarm: 1m_tcp_syn_queue_cookies - on: ip.tcp_syn_queue - os: linux - hosts: * - lookup: average -60s unaligned absolute of TCPReqQFullDoCookies - units: cookies - every: 10s - warn: $this > 1 - crit: $this > (($status == $CRITICAL) ? (0) : (5)) - delay: up 10 down 5m multiplier 1.5 max 1h - info: average number of sent SYN cookies due to the full TCP SYN queue over the last minute - to: sysadmin + alarm: 1m_tcp_syn_queue_cookies + on: ip.tcp_syn_queue + class: System +component: Network + type: Workload + os: linux + hosts: * + lookup: average -60s unaligned absolute of TCPReqQFullDoCookies + units: cookies + every: 10s + warn: $this > 1 + crit: $this > (($status == $CRITICAL) ? (0) : (5)) + delay: up 10 down 5m multiplier 1.5 max 1h + info: average number of sent SYN cookies due to the full TCP SYN queue over the last minute + to: sysadmin diff --git a/health/health.d/tcp_mem.conf b/health/health.d/tcp_mem.conf index 29d4ad68..646e5c6d 100644 --- a/health/health.d/tcp_mem.conf +++ b/health/health.d/tcp_mem.conf @@ -6,15 +6,18 @@ # and a critical when TCP is 90% of its upper memory limit # - alarm: tcp_memory - on: ipv4.sockstat_tcp_mem - os: linux - hosts: * - calc: ${mem} * 100 / ${tcp_mem_high} - units: % - every: 10s - warn: ${mem} > (($status >= $WARNING ) ? ( ${tcp_mem_pressure} * 0.8 ) : ( ${tcp_mem_pressure} )) - crit: ${mem} > (($status == $CRITICAL ) ? ( ${tcp_mem_pressure} ) : ( ${tcp_mem_high} * 0.9 )) - delay: up 0 down 5m multiplier 1.5 max 1h - info: TCP memory utilization - to: sysadmin + alarm: tcp_memory + on: ipv4.sockstat_tcp_mem + class: System +component: Network + type: Utilization + os: linux + hosts: * + calc: ${mem} * 100 / ${tcp_mem_high} + units: % + every: 10s + warn: ${mem} > (($status >= $WARNING ) ? ( ${tcp_mem_pressure} * 0.8 ) : ( ${tcp_mem_pressure} )) + crit: ${mem} > (($status == $CRITICAL ) ? ( ${tcp_mem_pressure} ) : ( ${tcp_mem_high} * 0.9 )) + delay: up 0 down 5m multiplier 1.5 max 1h + info: TCP memory utilization + to: sysadmin diff --git a/health/health.d/tcp_orphans.conf b/health/health.d/tcp_orphans.conf index 17ff7a95..6e94d67d 100644 --- a/health/health.d/tcp_orphans.conf +++ b/health/health.d/tcp_orphans.conf @@ -7,15 +7,18 @@ # so we alarm warning at 25% and critical at 50% # - alarm: tcp_orphans - on: ipv4.sockstat_tcp_sockets - os: linux - hosts: * - calc: ${orphan} * 100 / ${tcp_max_orphans} - units: % - every: 10s - warn: $this > (($status >= $WARNING ) ? ( 20 ) : ( 25 )) - crit: $this > (($status == $CRITICAL) ? ( 25 ) : ( 50 )) - delay: up 0 down 5m multiplier 1.5 max 1h - info: orphan IPv4 TCP sockets utilization - to: sysadmin + alarm: tcp_orphans + on: ipv4.sockstat_tcp_sockets + class: System +component: Network + type: Errors + os: linux + hosts: * + calc: ${orphan} * 100 / ${tcp_max_orphans} + units: % + every: 10s + warn: $this > (($status >= $WARNING ) ? ( 20 ) : ( 25 )) + crit: $this > (($status == $CRITICAL) ? ( 25 ) : ( 50 )) + delay: up 0 down 5m multiplier 1.5 max 1h + info: orphan IPv4 TCP sockets utilization + to: sysadmin diff --git a/health/health.d/tcp_resets.conf b/health/health.d/tcp_resets.conf index af2a7525..41355dad 100644 --- a/health/health.d/tcp_resets.conf +++ b/health/health.d/tcp_resets.conf @@ -4,54 +4,66 @@ # ----------------------------------------------------------------------------- # tcp resets this host sends - alarm: 1m_ipv4_tcp_resets_sent - on: ipv4.tcphandshake - os: linux - hosts: * - lookup: average -1m at -10s unaligned absolute of OutRsts - units: tcp resets/s - every: 10s - info: average number of sent TCP RESETS over the last minute + alarm: 1m_ipv4_tcp_resets_sent + on: ipv4.tcphandshake + class: System +component: Network + type: Errors + os: linux + hosts: * + lookup: average -1m at -10s unaligned absolute of OutRsts + units: tcp resets/s + every: 10s + info: average number of sent TCP RESETS over the last minute - alarm: 10s_ipv4_tcp_resets_sent - on: ipv4.tcphandshake - os: linux - hosts: * - lookup: average -10s unaligned absolute of OutRsts - units: tcp resets/s - every: 10s - warn: $this > ((($1m_ipv4_tcp_resets_sent < 5)?(5):($1m_ipv4_tcp_resets_sent)) * (($status >= $WARNING) ? (1) : (20))) - delay: up 20s down 60m multiplier 1.2 max 2h - options: no-clear-notification - info: average number of sent TCP RESETS over the last 10 seconds. \ - This can indicate a port scan, \ - or that a service running on this host has crashed. \ - Netdata will not send a clear notification for this alarm. - to: sysadmin + alarm: 10s_ipv4_tcp_resets_sent + on: ipv4.tcphandshake + class: System +component: Network + type: Errors + os: linux + hosts: * + lookup: average -10s unaligned absolute of OutRsts + units: tcp resets/s + every: 10s + warn: $this > ((($1m_ipv4_tcp_resets_sent < 5)?(5):($1m_ipv4_tcp_resets_sent)) * (($status >= $WARNING) ? (1) : (20))) + delay: up 20s down 60m multiplier 1.2 max 2h + options: no-clear-notification + info: average number of sent TCP RESETS over the last 10 seconds. \ + This can indicate a port scan, \ + or that a service running on this host has crashed. \ + Netdata will not send a clear notification for this alarm. + to: sysadmin # ----------------------------------------------------------------------------- # tcp resets this host receives - alarm: 1m_ipv4_tcp_resets_received - on: ipv4.tcphandshake - os: linux freebsd - hosts: * - lookup: average -1m at -10s unaligned absolute of AttemptFails - units: tcp resets/s - every: 10s - info: average number of received TCP RESETS over the last minute + alarm: 1m_ipv4_tcp_resets_received + on: ipv4.tcphandshake + class: System +component: Network + type: Errors + os: linux freebsd + hosts: * + lookup: average -1m at -10s unaligned absolute of AttemptFails + units: tcp resets/s + every: 10s + info: average number of received TCP RESETS over the last minute - alarm: 10s_ipv4_tcp_resets_received - on: ipv4.tcphandshake - os: linux freebsd - hosts: * - lookup: average -10s unaligned absolute of AttemptFails - units: tcp resets/s - every: 10s - warn: $this > ((($1m_ipv4_tcp_resets_received < 5)?(5):($1m_ipv4_tcp_resets_received)) * (($status >= $WARNING) ? (1) : (10))) - delay: up 20s down 60m multiplier 1.2 max 2h - options: no-clear-notification - info: average number of received TCP RESETS over the last 10 seconds. \ - This can be an indication that a service this host needs has crashed. \ - Netdata will not send a clear notification for this alarm. - to: sysadmin + alarm: 10s_ipv4_tcp_resets_received + on: ipv4.tcphandshake + class: System +component: Network + type: Errors + os: linux freebsd + hosts: * + lookup: average -10s unaligned absolute of AttemptFails + units: tcp resets/s + every: 10s + warn: $this > ((($1m_ipv4_tcp_resets_received < 5)?(5):($1m_ipv4_tcp_resets_received)) * (($status >= $WARNING) ? (1) : (10))) + delay: up 20s down 60m multiplier 1.2 max 2h + options: no-clear-notification + info: average number of received TCP RESETS over the last 10 seconds. \ + This can be an indication that a service this host needs has crashed. \ + Netdata will not send a clear notification for this alarm. + to: sysadmin diff --git a/health/health.d/udp_errors.conf b/health/health.d/udp_errors.conf index 4836d631..342a1aed 100644 --- a/health/health.d/udp_errors.conf +++ b/health/health.d/udp_errors.conf @@ -4,29 +4,35 @@ # ----------------------------------------------------------------------------- # UDP receive buffer errors - alarm: 1m_ipv4_udp_receive_buffer_errors - on: ipv4.udperrors - os: linux freebsd - hosts: * - lookup: average -1m unaligned absolute of RcvbufErrors - units: errors - every: 10s - warn: $this > (($status >= $WARNING) ? (0) : (10)) - info: average number of UDP receive buffer errors over the last minute - delay: up 1m down 60m multiplier 1.2 max 2h - to: sysadmin + alarm: 1m_ipv4_udp_receive_buffer_errors + on: ipv4.udperrors + class: System +component: Network + type: Errors + os: linux freebsd + hosts: * + lookup: average -1m unaligned absolute of RcvbufErrors + units: errors + every: 10s + warn: $this > (($status >= $WARNING) ? (0) : (10)) + info: average number of UDP receive buffer errors over the last minute + delay: up 1m down 60m multiplier 1.2 max 2h + to: sysadmin # ----------------------------------------------------------------------------- # UDP send buffer errors - alarm: 1m_ipv4_udp_send_buffer_errors - on: ipv4.udperrors - os: linux - hosts: * - lookup: average -1m unaligned absolute of SndbufErrors - units: errors - every: 10s - warn: $this > (($status >= $WARNING) ? (0) : (10)) - info: average number of UDP send buffer errors over the last minute - delay: up 1m down 60m multiplier 1.2 max 2h - to: sysadmin + alarm: 1m_ipv4_udp_send_buffer_errors + on: ipv4.udperrors + class: System +component: Network + type: Errors + os: linux + hosts: * + lookup: average -1m unaligned absolute of SndbufErrors + units: errors + every: 10s + warn: $this > (($status >= $WARNING) ? (0) : (10)) + info: average number of UDP send buffer errors over the last minute + delay: up 1m down 60m multiplier 1.2 max 2h + to: sysadmin diff --git a/health/health.d/unbound.conf b/health/health.d/unbound.conf index 567baf18..1df15474 100644 --- a/health/health.d/unbound.conf +++ b/health/health.d/unbound.conf @@ -1,35 +1,44 @@ # make sure unbound is running -template: unbound_last_collected_secs - on: unbound.queries - calc: $now - $last_collected_t - units: seconds ago - every: 10s - warn: $this > (($status >= $WARNING) ? ($update_every) : ( 5 * $update_every)) - crit: $this > (($status == $CRITICAL) ? ($update_every) : (60 * $update_every)) - delay: down 5m multiplier 1.5 max 1h - info: number of seconds since the last successful data collection - to: sysadmin + template: unbound_last_collected_secs + on: unbound.queries + class: DNS +component: Unbound + type: Latency + calc: $now - $last_collected_t + units: seconds ago + every: 10s + warn: $this > (($status >= $WARNING) ? ($update_every) : ( 5 * $update_every)) + crit: $this > (($status == $CRITICAL) ? ($update_every) : (60 * $update_every)) + delay: down 5m multiplier 1.5 max 1h + info: number of seconds since the last successful data collection + to: sysadmin # make sure there is no overwritten/dropped queries in the request-list -template: unbound_request_list_overwritten - on: unbound.request_list_jostle_list - lookup: average -60s unaligned absolute match-names of overwritten - units: queries - every: 10s - warn: $this > 5 - delay: up 10 down 5m multiplier 1.5 max 1h - info: number of overwritten queries in the request-list - to: sysadmin + template: unbound_request_list_overwritten + on: unbound.request_list_jostle_list + class: DNS +component: Unbound + type: Errors + lookup: average -60s unaligned absolute match-names of overwritten + units: queries + every: 10s + warn: $this > 5 + delay: up 10 down 5m multiplier 1.5 max 1h + info: number of overwritten queries in the request-list + to: sysadmin -template: unbound_request_list_dropped - on: unbound.request_list_jostle_list - lookup: average -60s unaligned absolute match-names of dropped - units: queries - every: 10s - warn: $this > 0 - delay: up 10 down 5m multiplier 1.5 max 1h - info: number of dropped queries in the request-list - to: sysadmin + template: unbound_request_list_dropped + on: unbound.request_list_jostle_list + class: DNS +component: Unbound + type: Errors + lookup: average -60s unaligned absolute match-names of dropped + units: queries + every: 10s + warn: $this > 0 + delay: up 10 down 5m multiplier 1.5 max 1h + info: number of dropped queries in the request-list + to: sysadmin diff --git a/health/health.d/varnish.conf b/health/health.d/varnish.conf index cca7446b..7f3bd6c8 100644 --- a/health/health.d/varnish.conf +++ b/health/health.d/varnish.conf @@ -1,9 +1,12 @@ - alarm: varnish_last_collected - on: varnish.uptime - calc: $now - $last_collected_t - units: seconds ago - every: 10s - warn: $this > (($status >= $WARNING) ? ($update_every) : ( 5 * $update_every)) - crit: $this > (($status == $CRITICAL) ? ($update_every) : (60 * $update_every)) - info: number of seconds since the last successful data collection - to: sysadmin + alarm: varnish_last_collected + on: varnish.uptime + class: Web Proxy +component: Varnish + type: Latency + calc: $now - $last_collected_t + units: seconds ago + every: 10s + warn: $this > (($status >= $WARNING) ? ($update_every) : ( 5 * $update_every)) + crit: $this > (($status == $CRITICAL) ? ($update_every) : (60 * $update_every)) + info: number of seconds since the last successful data collection + to: sysadmin diff --git a/health/health.d/vcsa.conf b/health/health.d/vcsa.conf index f4b03d4c..8538e488 100644 --- a/health/health.d/vcsa.conf +++ b/health/health.d/vcsa.conf @@ -1,16 +1,19 @@ # make sure vcsa is running and responding -template: vcsa_last_collected_secs - on: vcsa.system_health - calc: $now - $last_collected_t - units: seconds ago - every: 10s - warn: $this > (($status >= $WARNING) ? ($update_every) : ( 5 * $update_every)) - crit: $this > (($status == $CRITICAL) ? ($update_every) : (60 * $update_every)) - delay: down 5m multiplier 1.5 max 1h - info: number of seconds since the last successful data collection - to: sysadmin + template: vcsa_last_collected_secs + on: vcsa.system_health + class: Virtual Machine +component: VMware vCenter + type: Latency + calc: $now - $last_collected_t + units: seconds ago + every: 10s + warn: $this > (($status >= $WARNING) ? ($update_every) : ( 5 * $update_every)) + crit: $this > (($status == $CRITICAL) ? ($update_every) : (60 * $update_every)) + delay: down 5m multiplier 1.5 max 1h + info: number of seconds since the last successful data collection + to: sysadmin # Overall system health: # - 0: all components are healthy. @@ -19,17 +22,20 @@ template: vcsa_last_collected_secs # - 3: one or more components might be in an unusable status and the appliance might become unresponsive soon. # - 4: no health data is available. -template: vcsa_system_health - on: vcsa.system_health - lookup: max -10s unaligned of system - units: status - every: 10s - warn: ($this == 1) || ($this == 2) - crit: $this == 3 - delay: down 1m multiplier 1.5 max 1h - info: overall system health status \ - (-1: unknown, 0: green, 1: yellow, 2: orange, 3: red, 4: grey) - to: sysadmin + template: vcsa_system_health + on: vcsa.system_health + class: Virtual Machine +component: VMware vCenter + type: Errors + lookup: max -10s unaligned of system + units: status + every: 10s + warn: ($this == 1) || ($this == 2) + crit: $this == 3 + delay: down 1m multiplier 1.5 max 1h + info: overall system health status \ + (-1: unknown, 0: green, 1: yellow, 2: orange, 3: red, 4: grey) + to: sysadmin # Components health: # - 0: healthy. @@ -38,77 +44,95 @@ template: vcsa_system_health # - 3: unavailable, or will stop functioning soon. # - 4: no health data is available. -template: vcsa_swap_health - on: vcsa.components_health - lookup: max -10s unaligned of swap - units: status - every: 10s - warn: $this == 1 - crit: ($this == 2) || ($this == 3) - delay: down 1m multiplier 1.5 max 1h - info: swap health status \ - (-1: unknown, 0: green, 1: yellow, 2: orange, 3: red, 4: grey) - to: sysadmin + template: vcsa_swap_health + on: vcsa.components_health + class: Virtual Machine +component: VMware vCenter + type: Errors + lookup: max -10s unaligned of swap + units: status + every: 10s + warn: $this == 1 + crit: ($this == 2) || ($this == 3) + delay: down 1m multiplier 1.5 max 1h + info: swap health status \ + (-1: unknown, 0: green, 1: yellow, 2: orange, 3: red, 4: grey) + to: sysadmin -template: vcsa_storage_health - on: vcsa.components_health - lookup: max -10s unaligned of storage - units: status - every: 10s - warn: $this == 1 - crit: ($this == 2) || ($this == 3) - delay: down 1m multiplier 1.5 max 1h - info: storage health status \ - (-1: unknown, 0: green, 1: yellow, 2: orange, 3: red, 4: grey) - to: sysadmin + template: vcsa_storage_health + on: vcsa.components_health + class: Virtual Machine +component: VMware vCenter + type: Errors + lookup: max -10s unaligned of storage + units: status + every: 10s + warn: $this == 1 + crit: ($this == 2) || ($this == 3) + delay: down 1m multiplier 1.5 max 1h + info: storage health status \ + (-1: unknown, 0: green, 1: yellow, 2: orange, 3: red, 4: grey) + to: sysadmin -template: vcsa_mem_health - on: vcsa.components_health - lookup: max -10s unaligned of mem - units: status - every: 10s - warn: $this == 1 - crit: ($this == 2) || ($this == 3) - delay: down 1m multiplier 1.5 max 1h - info: memory health status \ - (-1: unknown, 0: green, 1: yellow, 2: orange, 3: red, 4: grey) - to: sysadmin + template: vcsa_mem_health + on: vcsa.components_health + class: Virtual Machine +component: VMware vCenter + type: Errors + lookup: max -10s unaligned of mem + units: status + every: 10s + warn: $this == 1 + crit: ($this == 2) || ($this == 3) + delay: down 1m multiplier 1.5 max 1h + info: memory health status \ + (-1: unknown, 0: green, 1: yellow, 2: orange, 3: red, 4: grey) + to: sysadmin -template: vcsa_load_health - on: vcsa.components_health - lookup: max -10s unaligned of load - units: status - every: 10s - warn: $this == 1 - crit: ($this == 2) || ($this == 3) - delay: down 1m multiplier 1.5 max 1h - info: load health status \ - (-1: unknown, 0: green, 1: yellow, 2: orange, 3: red, 4: grey) - to: sysadmin + template: vcsa_load_health + on: vcsa.components_health + class: Virtual Machine +component: VMware vCenter + type: Utilization + lookup: max -10s unaligned of load + units: status + every: 10s + warn: $this == 1 + crit: ($this == 2) || ($this == 3) + delay: down 1m multiplier 1.5 max 1h + info: load health status \ + (-1: unknown, 0: green, 1: yellow, 2: orange, 3: red, 4: grey) + to: sysadmin -template: vcsa_database_storage_health - on: vcsa.components_health - lookup: max -10s unaligned of database_storage - units: status - every: 10s - warn: $this == 1 - crit: ($this == 2) || ($this == 3) - delay: down 1m multiplier 1.5 max 1h - info: database storage health status \ - (-1: unknown, 0: green, 1: yellow, 2: orange, 3: red, 4: grey) - to: sysadmin + template: vcsa_database_storage_health + on: vcsa.components_health + class: Virtual Machine +component: VMware vCenter + type: Errors + lookup: max -10s unaligned of database_storage + units: status + every: 10s + warn: $this == 1 + crit: ($this == 2) || ($this == 3) + delay: down 1m multiplier 1.5 max 1h + info: database storage health status \ + (-1: unknown, 0: green, 1: yellow, 2: orange, 3: red, 4: grey) + to: sysadmin -template: vcsa_applmgmt_health - on: vcsa.components_health - lookup: max -10s unaligned of applmgmt - units: status - every: 10s - warn: $this == 1 - crit: ($this == 2) || ($this == 3) - delay: down 1m multiplier 1.5 max 1h - info: applmgmt health status \ - (-1: unknown, 0: green, 1: yellow, 2: orange, 3: red, 4: grey) - to: sysadmin + template: vcsa_applmgmt_health + on: vcsa.components_health + class: Virtual Machine +component: VMware vCenter + type: Errors + lookup: max -10s unaligned of applmgmt + units: status + every: 10s + warn: $this == 1 + crit: ($this == 2) || ($this == 3) + delay: down 1m multiplier 1.5 max 1h + info: applmgmt health status \ + (-1: unknown, 0: green, 1: yellow, 2: orange, 3: red, 4: grey) + to: sysadmin # Software updates health: @@ -117,14 +141,17 @@ template: vcsa_applmgmt_health # - 3: security updates are available. # - 4: an error retrieving information on software updates. -template: vcsa_software_updates_health - on: vcsa.software_updates_health - lookup: max -10s unaligned of software_packages - units: status - every: 10s - warn: $this == 4 - crit: $this == 3 - delay: down 1m multiplier 1.5 max 1h - info: software updates availability status \ - (-1: unknown, 0: green, 2: orange, 3: red, 4: grey) - to: sysadmin + template: vcsa_software_updates_health + on: vcsa.software_updates_health + class: Virtual Machine +component: VMware vCenter + type: Errors + lookup: max -10s unaligned of software_packages + units: status + every: 10s + warn: $this == 4 + crit: $this == 3 + delay: down 1m multiplier 1.5 max 1h + info: software updates availability status \ + (-1: unknown, 0: green, 2: orange, 3: red, 4: grey) + to: sysadmin diff --git a/health/health.d/vernemq.conf b/health/health.d/vernemq.conf index 9598dd39..737147f3 100644 --- a/health/health.d/vernemq.conf +++ b/health/health.d/vernemq.conf @@ -1,300 +1,381 @@ # Availability -template: vernemq_last_collected_secs - on: vernemq.node_uptime - calc: $now - $last_collected_t - units: seconds ago - every: 10s - warn: $this > (($status >= $WARNING) ? ($update_every) : ( 5 * $update_every)) - crit: $this > (($status == $CRITICAL) ? ($update_every) : (60 * $update_every)) - delay: down 5m multiplier 1.5 max 1h - info: number of seconds since the last successful data collection - to: sysadmin + template: vernemq_last_collected_secs + on: vernemq.node_uptime + class: Messaging +component: VerneMQ + type: Latency + calc: $now - $last_collected_t + units: seconds ago + every: 10s + warn: $this > (($status >= $WARNING) ? ($update_every) : ( 5 * $update_every)) + crit: $this > (($status == $CRITICAL) ? ($update_every) : (60 * $update_every)) + delay: down 5m multiplier 1.5 max 1h + info: number of seconds since the last successful data collection + to: sysadmin # Socket errors -template: vernemq_socket_errors - on: vernemq.socket_errors - lookup: sum -1m unaligned absolute of socket_error - units: errors - every: 1m - warn: $this > (($status >= $WARNING) ? (0) : (5)) - delay: up 2m down 5m multiplier 1.5 max 2h - info: number of socket errors in the last minute - to: sysadmin + template: vernemq_socket_errors + on: vernemq.socket_errors + class: Messaging +component: VerneMQ + type: Errors + lookup: sum -1m unaligned absolute of socket_error + units: errors + every: 1m + warn: $this > (($status >= $WARNING) ? (0) : (5)) + delay: up 2m down 5m multiplier 1.5 max 2h + info: number of socket errors in the last minute + to: sysadmin # Queues dropped/expired/unhandled PUBLISH messages -template: vernemq_queue_message_drop - on: vernemq.queue_undelivered_messages - lookup: sum -1m unaligned absolute of queue_message_drop - units: dropped messages - every: 1m - warn: $this > (($status >= $WARNING) ? (0) : (5)) - delay: up 5m down 5m multiplier 1.5 max 2h - info: number of dropped messaged due to full queues in the last minute - to: sysadmin - -template: vernemq_queue_message_expired - on: vernemq.queue_undelivered_messages - lookup: sum -1m unaligned absolute of queue_message_expired - units: expired messages - every: 1m - warn: $this > (($status >= $WARNING) ? (0) : (15)) - delay: up 5m down 5m multiplier 1.5 max 2h - info: number of messages which expired before delivery in the last minute - to: sysadmin - -template: vernemq_queue_message_unhandled - on: vernemq.queue_undelivered_messages - lookup: sum -1m unaligned absolute of queue_message_unhandled - units: unhandled messages - every: 1m - warn: $this > (($status >= $WARNING) ? (0) : (5)) - delay: up 5m down 5m multiplier 1.5 max 2h - info: number of unhandled messages (connections with clean session=true) in the last minute - to: sysadmin + template: vernemq_queue_message_drop + on: vernemq.queue_undelivered_messages + class: Messaging +component: VerneMQ + type: Errors + lookup: average -1m unaligned absolute of queue_message_drop + units: dropped messages + every: 1m + warn: $this > (($status >= $WARNING) ? (0) : (5)) + delay: up 2m down 5m multiplier 1.5 max 2h + info: number of dropped messaged due to full queues in the last minute + to: sysadmin + + template: vernemq_queue_message_expired + on: vernemq.queue_undelivered_messages + class: Messaging +component: VerneMQ + type: Latency + lookup: average -1m unaligned absolute of queue_message_expired + units: expired messages + every: 1m + warn: $this > (($status >= $WARNING) ? (0) : (5)) + delay: up 2m down 5m multiplier 1.5 max 2h + info: number of messages which expired before delivery in the last minute + to: sysadmin + + template: vernemq_queue_message_unhandled + on: vernemq.queue_undelivered_messages + class: Messaging +component: VerneMQ + type: Latency + lookup: average -1m unaligned absolute of queue_message_unhandled + units: unhandled messages + every: 1m + warn: $this > (($status >= $WARNING) ? (0) : (5)) + delay: up 2m down 5m multiplier 1.5 max 2h + info: number of unhandled messages (connections with clean session=true) in the last minute + to: sysadmin # Erlang VM -template: vernemq_average_scheduler_utilization - on: vernemq.average_scheduler_utilization - lookup: average -10m unaligned - units: % - every: 1m - warn: $this > (($status >= $WARNING) ? (75) : (85)) - crit: $this > (($status == $CRITICAL) ? (85) : (95)) - delay: down 15m multiplier 1.5 max 1h - info: average scheduler utilization over the last 10 minutes - to: sysadmin + template: vernemq_average_scheduler_utilization + on: vernemq.average_scheduler_utilization + class: Messaging +component: VerneMQ + type: Utilization + lookup: average -10m unaligned + units: % + every: 1m + warn: $this > (($status >= $WARNING) ? (75) : (85)) + crit: $this > (($status == $CRITICAL) ? (85) : (95)) + delay: down 15m multiplier 1.5 max 1h + info: average scheduler utilization over the last 10 minutes + to: sysadmin # Cluster communication and netsplits -template: vernemq_cluster_dropped - on: vernemq.cluster_dropped - lookup: sum -1m unaligned - units: KiB - every: 1m - warn: $this > 0 - delay: up 5m down 5m multiplier 1.5 max 1h - info: amount of traffic dropped during communication with the cluster nodes in the last minute - to: sysadmin - -template: vernemq_netsplits - on: vernemq.netsplits - lookup: sum -1m unaligned absolute of netsplit_detected - units: netsplits - every: 10s - warn: $this > 0 - delay: down 5m multiplier 1.5 max 2h - info: number of detected netsplits (split brain situation) in the last minute - to: sysadmin + template: vernemq_cluster_dropped + on: vernemq.cluster_dropped + class: Messaging +component: VerneMQ + type: Errors + lookup: sum -1m unaligned + units: KiB + every: 1m + warn: $this > 0 + delay: up 5m down 5m multiplier 1.5 max 1h + info: amount of traffic dropped during communication with the cluster nodes in the last minute + to: sysadmin + + template: vernemq_netsplits + on: vernemq.netsplits + class: Messaging +component: VerneMQ + type: Workload + lookup: sum -1m unaligned absolute of netsplit_detected + units: netsplits + every: 10s + warn: $this > 0 + delay: down 5m multiplier 1.5 max 2h + info: number of detected netsplits (split brain situation) in the last minute + to: sysadmin # Unsuccessful CONNACK -template: vernemq_mqtt_connack_sent_reason_unsuccessful - on: vernemq.mqtt_connack_sent_reason - lookup: sum -1m unaligned absolute match-names of !success,* - units: packets - every: 1m - warn: $this > (($status >= $WARNING) ? (0) : (5)) - delay: up 5m down 5m multiplier 1.5 max 2h - info: number of sent unsuccessful v3/v5 CONNACK packets in the last minute - to: sysadmin + template: vernemq_mqtt_connack_sent_reason_unsuccessful + on: vernemq.mqtt_connack_sent_reason + class: Messaging +component: VerneMQ + type: Errors + lookup: average -1m unaligned absolute match-names of !success,* + units: packets + every: 1m + warn: $this > (($status >= $WARNING) ? (0) : (5)) + delay: up 2m down 5m multiplier 1.5 max 2h + info: number of sent unsuccessful v3/v5 CONNACK packets in the last minute + to: sysadmin # Not normal DISCONNECT -template: vernemq_mqtt_disconnect_received_reason_not_normal - on: vernemq.mqtt_disconnect_received_reason - lookup: sum -1m unaligned absolute match-names of !normal_disconnect,* - units: packets - every: 1m - warn: $this > (($status >= $WARNING) ? (0) : (5)) - delay: up 5m down 5m multiplier 1.5 max 2h - info: number of received not normal v5 DISCONNECT packets in the last minute - to: sysadmin - -template: vernemq_mqtt_disconnect_sent_reason_not_normal - on: vernemq.mqtt_disconnect_sent_reason - lookup: sum -1m unaligned absolute match-names of !normal_disconnect,* - units: packets - every: 1m - warn: $this > (($status >= $WARNING) ? (0) : (5)) - delay: up 5m down 5m multiplier 1.5 max 2h - info: number of sent not normal v5 DISCONNECT packets in the last minute - to: sysadmin + template: vernemq_mqtt_disconnect_received_reason_not_normal + on: vernemq.mqtt_disconnect_received_reason + class: Messaging +component: VerneMQ + type: Workload + lookup: average -1m unaligned absolute match-names of !normal_disconnect,* + units: packets + every: 1m + warn: $this > (($status >= $WARNING) ? (0) : (5)) + delay: up 2m down 5m multiplier 1.5 max 2h + info: number of received not normal v5 DISCONNECT packets in the last minute + to: sysadmin + + template: vernemq_mqtt_disconnect_sent_reason_not_normal + on: vernemq.mqtt_disconnect_sent_reason + class: Messaging +component: VerneMQ + type: Errors + lookup: average -1m unaligned absolute match-names of !normal_disconnect,* + units: packets + every: 1m + warn: $this > (($status >= $WARNING) ? (0) : (5)) + delay: up 2m down 5m multiplier 1.5 max 2h + info: number of sent not normal v5 DISCONNECT packets in the last minute + to: sysadmin # SUBSCRIBE errors and unauthorized attempts -template: vernemq_mqtt_subscribe_error - on: vernemq.mqtt_subscribe_error - lookup: sum -1m unaligned absolute - units: failed ops - every: 1m - warn: $this > (($status >= $WARNING) ? (0) : (5)) - delay: up 5m down 5m multiplier 1.5 max 2h - info: number of failed v3/v5 SUBSCRIBE operations in the last minute - to: sysadmin - -template: vernemq_mqtt_subscribe_auth_error - on: vernemq.mqtt_subscribe_auth_error - lookup: sum -1m unaligned absolute - units: attempts - every: 1m - warn: $this > (($status >= $WARNING) ? (0) : (5)) - delay: up 5m down 5m multiplier 1.5 max 2h - info: number of unauthorized v3/v5 SUBSCRIBE attempts in the last minute - to: sysadmin + template: vernemq_mqtt_subscribe_error + on: vernemq.mqtt_subscribe_error + class: Messaging +component: VerneMQ + type: Errors + lookup: average -1m unaligned absolute + units: failed ops + every: 1m + warn: $this > (($status >= $WARNING) ? (0) : (5)) + delay: up 2m down 5m multiplier 1.5 max 2h + info: number of failed v3/v5 SUBSCRIBE operations in the last minute + to: sysadmin + + template: vernemq_mqtt_subscribe_auth_error + on: vernemq.mqtt_subscribe_auth_error + class: Messaging +component: VerneMQ + type: Workload + lookup: average -1m unaligned absolute + units: attempts + every: 1m + warn: $this > (($status >= $WARNING) ? (0) : (5)) + delay: up 2m down 5m multiplier 1.5 max 2h + info: number of unauthorized v3/v5 SUBSCRIBE attempts in the last minute + to: sysadmin # UNSUBSCRIBE errors -template: vernemq_mqtt_unsubscribe_error - on: vernemq.mqtt_unsubscribe_error - lookup: sum -1m unaligned absolute - units: failed ops - every: 1m - warn: $this > (($status >= $WARNING) ? (0) : (5)) - delay: up 5m down 5m multiplier 1.5 max 2h - info: number of failed v3/v5 UNSUBSCRIBE operations in the last minute - to: sysadmin + template: vernemq_mqtt_unsubscribe_error + on: vernemq.mqtt_unsubscribe_error + class: Messaging +component: VerneMQ + type: Errors + lookup: average -1m unaligned absolute + units: failed ops + every: 1m + warn: $this > (($status >= $WARNING) ? (0) : (5)) + delay: up 2m down 5m multiplier 1.5 max 2h + info: number of failed v3/v5 UNSUBSCRIBE operations in the last minute + to: sysadmin # PUBLISH errors and unauthorized attempts -template: vernemq_mqtt_publish_errors - on: vernemq.mqtt_publish_errors - lookup: sum -1m unaligned absolute - units: failed ops - every: 1m - warn: $this > (($status >= $WARNING) ? (0) : (5)) - delay: up 5m down 5m multiplier 1.5 max 2h - info: number of failed v3/v5 PUBLISH operations in the last minute - to: sysadmin - -template: vernemq_mqtt_publish_auth_errors - on: vernemq.mqtt_publish_auth_errors - lookup: sum -1m unaligned absolute - units: attempts - every: 1m - warn: $this > (($status >= $WARNING) ? (0) : (5)) - delay: up 5m down 5m multiplier 1.5 max 2h - info: number of unauthorized v3/v5 PUBLISH attempts in the last minute - to: sysadmin + template: vernemq_mqtt_publish_errors + on: vernemq.mqtt_publish_errors + class: Messaging +component: VerneMQ + type: Errors + lookup: average -1m unaligned absolute + units: failed ops + every: 1m + warn: $this > (($status >= $WARNING) ? (0) : (5)) + delay: up 2m down 5m multiplier 1.5 max 2h + info: number of failed v3/v5 PUBLISH operations in the last minute + to: sysadmin + + template: vernemq_mqtt_publish_auth_errors + on: vernemq.mqtt_publish_auth_errors + class: Messaging +component: VerneMQ + type: Workload + lookup: average -1m unaligned absolute + units: attempts + every: 1m + warn: $this > (($status >= $WARNING) ? (0) : (5)) + delay: up 2m down 5m multiplier 1.5 max 2h + info: number of unauthorized v3/v5 PUBLISH attempts in the last minute + to: sysadmin # Unsuccessful and unexpected PUBACK -template: vernemq_mqtt_puback_received_reason_unsuccessful - on: vernemq.mqtt_puback_received_reason - lookup: sum -1m unaligned absolute match-names of !success,* - units: packets - every: 1m - warn: $this > (($status >= $WARNING) ? (0) : (5)) - delay: up 5m down 5m multiplier 1.5 max 2h - info: number of received unsuccessful v5 PUBACK packets in the last minute - to: sysadmin - -template: vernemq_mqtt_puback_sent_reason_unsuccessful - on: vernemq.mqtt_puback_sent_reason - lookup: sum -1m unaligned absolute match-names of !success,* - units: packets - every: 1m - warn: $this > (($status >= $WARNING) ? (0) : (5)) - delay: up 5m down 5m multiplier 1.5 max 2h - info: number of sent unsuccessful v5 PUBACK packets in the last minute - to: sysadmin - -template: vernemq_mqtt_puback_unexpected - on: vernemq.mqtt_puback_invalid_error - lookup: sum -1m unaligned absolute - units: messages - every: 1m - warn: $this > (($status >= $WARNING) ? (0) : (5)) - delay: up 5m down 5m multiplier 1.5 max 2h - info: number of received unexpected v3/v5 PUBACK packets in the last minute - to: sysadmin + template: vernemq_mqtt_puback_received_reason_unsuccessful + on: vernemq.mqtt_puback_received_reason + class: Messaging +component: VerneMQ + type: Errors + lookup: average -1m unaligned absolute match-names of !success,* + units: packets + every: 1m + warn: $this > (($status >= $WARNING) ? (0) : (5)) + delay: up 2m down 5m multiplier 1.5 max 2h + info: number of received unsuccessful v5 PUBACK packets in the last minute + to: sysadmin + + template: vernemq_mqtt_puback_sent_reason_unsuccessful + on: vernemq.mqtt_puback_sent_reason + class: Messaging +component: VerneMQ + type: Errors + lookup: average -1m unaligned absolute match-names of !success,* + units: packets + every: 1m + warn: $this > (($status >= $WARNING) ? (0) : (5)) + delay: up 2m down 5m multiplier 1.5 max 2h + info: number of sent unsuccessful v5 PUBACK packets in the last minute + to: sysadmin + + template: vernemq_mqtt_puback_unexpected + on: vernemq.mqtt_puback_invalid_error + class: Messaging +component: VerneMQ + type: Workload + lookup: average -1m unaligned absolute + units: messages + every: 1m + warn: $this > (($status >= $WARNING) ? (0) : (5)) + delay: up 2m down 5m multiplier 1.5 max 2h + info: number of received unexpected v3/v5 PUBACK packets in the last minute + to: sysadmin # Unsuccessful and unexpected PUBREC -template: vernemq_mqtt_pubrec_received_reason_unsuccessful - on: vernemq.mqtt_pubrec_received_reason - lookup: sum -1m unaligned absolute match-names of !success,* - units: packets - every: 1m - warn: $this > (($status >= $WARNING) ? (0) : (5)) - delay: up 5m down 5m multiplier 1.5 max 2h - info: number of received unsuccessful v5 PUBREC packets in the last minute - to: sysadmin - -template: vernemq_mqtt_pubrec_sent_reason_unsuccessful - on: vernemq.mqtt_pubrec_sent_reason - lookup: sum -1m unaligned absolute match-names of !success,* - units: packets - every: 1m - warn: $this > (($status >= $WARNING) ? (0) : (5)) - delay: up 5m down 5m multiplier 1.5 max 2h - info: number of sent unsuccessful v5 PUBREC packets in the last minute - to: sysadmin - -template: vernemq_mqtt_pubrec_invalid_error - on: vernemq.mqtt_pubrec_invalid_error - lookup: sum -1m unaligned absolute - units: messages - every: 1m - warn: $this > (($status >= $WARNING) ? (0) : (5)) - delay: up 5m down 5m multiplier 1.5 max 2h - info: number of received unexpected v3 PUBREC packets in the last minute - to: sysadmin + template: vernemq_mqtt_pubrec_received_reason_unsuccessful + on: vernemq.mqtt_pubrec_received_reason + class: Messaging +component: VerneMQ + type: Errors + lookup: average -1m unaligned absolute match-names of !success,* + units: packets + every: 1m + warn: $this > (($status >= $WARNING) ? (0) : (5)) + delay: up 2m down 5m multiplier 1.5 max 2h + info: number of received unsuccessful v5 PUBREC packets in the last minute + to: sysadmin + + template: vernemq_mqtt_pubrec_sent_reason_unsuccessful + on: vernemq.mqtt_pubrec_sent_reason + class: Messaging +component: VerneMQ + type: Errors + lookup: average -1m unaligned absolute match-names of !success,* + units: packets + every: 1m + warn: $this > (($status >= $WARNING) ? (0) : (5)) + delay: up 2m down 5m multiplier 1.5 max 2h + info: number of sent unsuccessful v5 PUBREC packets in the last minute + to: sysadmin + + template: vernemq_mqtt_pubrec_invalid_error + on: vernemq.mqtt_pubrec_invalid_error + class: Messaging +component: VerneMQ + type: Workload + lookup: average -1m unaligned absolute + units: messages + every: 1m + warn: $this > (($status >= $WARNING) ? (0) : (5)) + delay: up 2m down 5m multiplier 1.5 max 2h + info: number of received unexpected v3 PUBREC packets in the last minute + to: sysadmin # Unsuccessful PUBREL -template: vernemq_mqtt_pubrel_received_reason_unsuccessful - on: vernemq.mqtt_pubrel_received_reason - lookup: sum -1m unaligned absolute match-names of !success,* - units: packets - every: 1m - warn: $this > (($status >= $WARNING) ? (0) : (5)) - delay: up 5m down 5m multiplier 1.5 max 2h - info: number of received unsuccessful v5 PUBREL packets in the last minute - to: sysadmin - -template: vernemq_mqtt_pubrel_sent_reason_unsuccessful - on: vernemq.mqtt_pubrel_sent_reason - lookup: sum -1m unaligned absolute match-names of !success,* - units: packets - every: 1m - warn: $this > (($status >= $WARNING) ? (0) : (5)) - delay: up 5m down 5m multiplier 1.5 max 2h - info: number of sent unsuccessful v5 PUBREL packets in the last minute - to: sysadmin + template: vernemq_mqtt_pubrel_received_reason_unsuccessful + on: vernemq.mqtt_pubrel_received_reason + class: Messaging +component: VerneMQ + type: Errors + lookup: average -1m unaligned absolute match-names of !success,* + units: packets + every: 1m + warn: $this > (($status >= $WARNING) ? (0) : (5)) + delay: up 2m down 5m multiplier 1.5 max 2h + info: number of received unsuccessful v5 PUBREL packets in the last minute + to: sysadmin + + template: vernemq_mqtt_pubrel_sent_reason_unsuccessful + on: vernemq.mqtt_pubrel_sent_reason + class: Messaging +component: VerneMQ + type: Errors + lookup: average -1m unaligned absolute match-names of !success,* + units: packets + every: 1m + warn: $this > (($status >= $WARNING) ? (0) : (5)) + delay: up 2m down 5m multiplier 1.5 max 2h + info: number of sent unsuccessful v5 PUBREL packets in the last minute + to: sysadmin # Unsuccessful and unexpected PUBCOMP -template: vernemq_mqtt_pubcomp_received_reason_unsuccessful - on: vernemq.mqtt_pubcomp_received_reason - lookup: sum -1m unaligned absolute match-names of !success,* - units: packets - every: 1m - warn: $this > (($status >= $WARNING) ? (0) : (5)) - delay: up 5m down 5m multiplier 1.5 max 2h - info: number of received unsuccessful v5 PUBCOMP packets in the last minute - to: sysadmin - -template: vernemq_mqtt_pubcomp_sent_reason_unsuccessful - on: vernemq.mqtt_pubcomp_sent_reason - lookup: sum -1m unaligned absolute match-names of !success,* - units: packets - every: 1m - warn: $this > (($status >= $WARNING) ? (0) : (5)) - delay: up 5m down 5m multiplier 1.5 max 2h - info: number of sent unsuccessful v5 PUBCOMP packets in the last minute - to: sysadmin - -template: vernemq_mqtt_pubcomp_unexpected - on: vernemq.mqtt_pubcomp_invalid_error - lookup: sum -1m unaligned absolute - units: messages - every: 1m - warn: $this > (($status >= $WARNING) ? (0) : (5)) - delay: up 5m down 5m multiplier 1.5 max 2h - info: number of received unexpected v3/v5 PUBCOMP packets in the last minute - to: sysadmin + template: vernemq_mqtt_pubcomp_received_reason_unsuccessful + on: vernemq.mqtt_pubcomp_received_reason + class: Messaging +component: VerneMQ + type: Errors + lookup: average -1m unaligned absolute match-names of !success,* + units: packets + every: 1m + warn: $this > (($status >= $WARNING) ? (0) : (5)) + delay: up 2m down 5m multiplier 1.5 max 2h + info: number of received unsuccessful v5 PUBCOMP packets in the last minute + to: sysadmin + + template: vernemq_mqtt_pubcomp_sent_reason_unsuccessful + on: vernemq.mqtt_pubcomp_sent_reason + class: Messaging +component: VerneMQ + type: Errors + lookup: average -1m unaligned absolute match-names of !success,* + units: packets + every: 1m + warn: $this > (($status >= $WARNING) ? (0) : (5)) + delay: up 2m down 5m multiplier 1.5 max 2h + info: number of sent unsuccessful v5 PUBCOMP packets in the last minute + to: sysadmin + + template: vernemq_mqtt_pubcomp_unexpected + on: vernemq.mqtt_pubcomp_invalid_error + class: Messaging +component: VerneMQ + type: Workload + lookup: average -1m unaligned absolute + units: messages + every: 1m + warn: $this > (($status >= $WARNING) ? (0) : (5)) + delay: up 2m down 5m multiplier 1.5 max 2h + info: number of received unexpected v3/v5 PUBCOMP packets in the last minute + to: sysadmin diff --git a/health/health.d/vsphere.conf b/health/health.d/vsphere.conf index 3e1414c1..aee7c5cd 100644 --- a/health/health.d/vsphere.conf +++ b/health/health.d/vsphere.conf @@ -4,138 +4,171 @@ # -----------------------------------------------VM Specific------------------------------------------------------------ # Memory -template: vsphere_vm_mem_usage - on: vsphere.vm_mem_usage_percentage - hosts: * - calc: $used - units: % - every: 20s - warn: $this > (($status >= $WARNING) ? (80) : (90)) - crit: $this > (($status == $CRITICAL) ? (90) : (98)) - delay: down 15m multiplier 1.5 max 1h - info: virtual machine memory utilization + template: vsphere_vm_mem_usage + on: vsphere.vm_mem_usage_percentage + class: Virtual Machine +component: Memory + type: Utilization + hosts: * + calc: $used + units: % + every: 20s + warn: $this > (($status >= $WARNING) ? (80) : (90)) + crit: $this > (($status == $CRITICAL) ? (90) : (98)) + delay: down 15m multiplier 1.5 max 1h + info: virtual machine memory utilization # -----------------------------------------------HOST Specific---------------------------------------------------------- # Memory -template: vsphere_host_mem_usage - on: vsphere.host_mem_usage_percentage - hosts: * - calc: $used - units: % - every: 20s - warn: $this > (($status >= $WARNING) ? (80) : (90)) - crit: $this > (($status == $CRITICAL) ? (90) : (98)) - delay: down 15m multiplier 1.5 max 1h - info: host memory utilization + template: vsphere_host_mem_usage + on: vsphere.host_mem_usage_percentage + class: Virtual Machine +component: Memory + type: Utilization + hosts: * + calc: $used + units: % + every: 20s + warn: $this > (($status >= $WARNING) ? (80) : (90)) + crit: $this > (($status == $CRITICAL) ? (90) : (98)) + delay: down 15m multiplier 1.5 max 1h + info: host memory utilization # Network errors -template: vsphere_inbound_packets_errors - on: vsphere.net_errors_total - hosts: * -families: * - lookup: sum -10m unaligned absolute match-names of rx - units: packets - every: 1m - info: number of inbound errors for the network interface in the last 10 minutes - -template: vsphere_outbound_packets_errors - on: vsphere.net_errors_total - hosts: * -families: * - lookup: sum -10m unaligned absolute match-names of tx - units: packets - every: 1m - info: number of outbound errors for the network interface in the last 10 minutes + template: vsphere_inbound_packets_errors + on: vsphere.net_errors_total + class: Virtual Machine +component: Network + type: Errors + hosts: * + families: * + lookup: sum -10m unaligned absolute match-names of rx + units: packets + every: 1m + info: number of inbound errors for the network interface in the last 10 minutes + + template: vsphere_outbound_packets_errors + on: vsphere.net_errors_total + class: Virtual Machine +component: Network + type: Errors + hosts: * + families: * + lookup: sum -10m unaligned absolute match-names of tx + units: packets + every: 1m + info: number of outbound errors for the network interface in the last 10 minutes # Network errors ratio -template: vsphere_inbound_packets_errors_ratio - on: vsphere.net_packets_total - hosts: * -families: * - lookup: sum -10m unaligned absolute match-names of rx - calc: (($vsphere_inbound_packets_errors != nan AND $this > 1000) ? ($vsphere_inbound_packets_errors * 100 / $this) : (0)) - units: % - every: 1m - warn: $this >= 2 - delay: up 1m down 1h multiplier 1.5 max 2h - info: ratio of inbound errors for the network interface over the last 10 minutes - to: sysadmin - -template: vsphere_outbound_packets_errors_ratio - on: vsphere.net_packets_total - hosts: * -families: * - lookup: sum -10m unaligned absolute match-names of tx - calc: (($vsphere_outbound_packets_errors != nan AND $this > 1000) ? ($vsphere_outbound_packets_errors * 100 / $this) : (0)) - units: % - every: 1m - warn: $this >= 2 - delay: up 1m down 1h multiplier 1.5 max 2h - info: ratio of outbound errors for the network interface over the last 10 minutes - to: sysadmin + template: vsphere_inbound_packets_errors_ratio + on: vsphere.net_packets_total + class: Virtual Machine +component: Network + type: Errors + hosts: * + families: * + lookup: sum -10m unaligned absolute match-names of rx + calc: (($vsphere_inbound_packets_errors != nan AND $this > 1000) ? ($vsphere_inbound_packets_errors * 100 / $this) : (0)) + units: % + every: 1m + warn: $this >= 2 + delay: up 1m down 1h multiplier 1.5 max 2h + info: ratio of inbound errors for the network interface over the last 10 minutes + to: sysadmin + + template: vsphere_outbound_packets_errors_ratio + on: vsphere.net_packets_total + class: Virtual Machine +component: Network + type: Errors + hosts: * + families: * + lookup: sum -10m unaligned absolute match-names of tx + calc: (($vsphere_outbound_packets_errors != nan AND $this > 1000) ? ($vsphere_outbound_packets_errors * 100 / $this) : (0)) + units: % + every: 1m + warn: $this >= 2 + delay: up 1m down 1h multiplier 1.5 max 2h + info: ratio of outbound errors for the network interface over the last 10 minutes + to: sysadmin # -----------------------------------------------Common------------------------------------------------------------------- # CPU -template: vsphere_cpu_usage - on: vsphere.cpu_usage_total - hosts: * - lookup: average -10m unaligned match-names of used - units: % - every: 20s - warn: $this > (($status >= $WARNING) ? (75) : (85)) - crit: $this > (($status == $CRITICAL) ? (85) : (95)) - delay: down 15m multiplier 1.5 max 1h - info: average CPU utilization - to: sysadmin + template: vsphere_cpu_usage + on: vsphere.cpu_usage_total + class: Virtual Machine +component: CPU + type: Utilization + hosts: * + lookup: average -10m unaligned match-names of used + units: % + every: 20s + warn: $this > (($status >= $WARNING) ? (75) : (85)) + crit: $this > (($status == $CRITICAL) ? (85) : (95)) + delay: down 15m multiplier 1.5 max 1h + info: average CPU utilization + to: sysadmin # Network drops -template: vsphere_inbound_packets_dropped - on: vsphere.net_drops_total - hosts: * -families: * - lookup: sum -10m unaligned absolute match-names of rx - units: packets - every: 1m - info: number of inbound dropped packets for the network interface in the last 10 minutes - -template: vsphere_outbound_packets_dropped - on: vsphere.net_drops_total - hosts: * -families: * - lookup: sum -10m unaligned absolute match-names of tx - units: packets - every: 1m - info: number of outbound dropped packets for the network interface in the last 10 minutes + template: vsphere_inbound_packets_dropped + on: vsphere.net_drops_total + class: Virtual Machine +component: Network + type: Errors + hosts: * + families: * + lookup: sum -10m unaligned absolute match-names of rx + units: packets + every: 1m + info: number of inbound dropped packets for the network interface in the last 10 minutes + + template: vsphere_outbound_packets_dropped + on: vsphere.net_drops_total + class: Virtual Machine +component: Network + type: Errors + hosts: * + families: * + lookup: sum -10m unaligned absolute match-names of tx + units: packets + every: 1m + info: number of outbound dropped packets for the network interface in the last 10 minutes # Network drops ratio -template: vsphere_inbound_packets_dropped_ratio - on: vsphere.net_packets_total - hosts: * -families: * - lookup: sum -10m unaligned absolute match-names of rx - calc: (($vsphere_inbound_packets_dropped != nan AND $this > 1000) ? ($vsphere_inbound_packets_dropped * 100 / $this) : (0)) - units: % - every: 1m - warn: $this >= 2 - delay: up 1m down 1h multiplier 1.5 max 2h - info: ratio of inbound dropped packets for the network interface over the last 10 minutes - to: sysadmin - -template: vsphere_outbound_packets_dropped_ratio - on: vsphere.net_packets_total - hosts: * -families: * - lookup: sum -10m unaligned absolute match-names of tx - calc: (($vsphere_outbound_packets_dropped != nan AND $this > 1000) ? ($vsphere_outbound_packets_dropped * 100 / $this) : (0)) - units: % - every: 1m - warn: $this >= 2 - delay: up 1m down 1h multiplier 1.5 max 2h - info: ratio of outbound dropped packets for the network interface over the last 10 minutes - to: sysadmin + template: vsphere_inbound_packets_dropped_ratio + on: vsphere.net_packets_total + class: Virtual Machine +component: Network + type: Errors + hosts: * + families: * + lookup: sum -10m unaligned absolute match-names of rx + calc: (($vsphere_inbound_packets_dropped != nan AND $this > 1000) ? ($vsphere_inbound_packets_dropped * 100 / $this) : (0)) + units: % + every: 1m + warn: $this >= 2 + delay: up 1m down 1h multiplier 1.5 max 2h + info: ratio of inbound dropped packets for the network interface over the last 10 minutes + to: sysadmin + + template: vsphere_outbound_packets_dropped_ratio + on: vsphere.net_packets_total + class: Virtual Machine +component: Network + type: Errors + hosts: * + families: * + lookup: sum -10m unaligned absolute match-names of tx + calc: (($vsphere_outbound_packets_dropped != nan AND $this > 1000) ? ($vsphere_outbound_packets_dropped * 100 / $this) : (0)) + units: % + every: 1m + warn: $this >= 2 + delay: up 1m down 1h multiplier 1.5 max 2h + info: ratio of outbound dropped packets for the network interface over the last 10 minutes + to: sysadmin diff --git a/health/health.d/web_log.conf b/health/health.d/web_log.conf index 0b01990c..127c9a9c 100644 --- a/health/health.d/web_log.conf +++ b/health/health.d/web_log.conf @@ -1,17 +1,20 @@ # make sure we can collect web log data -template: last_collected_secs - on: web_log.response_codes -families: * - calc: $now - $last_collected_t - units: seconds ago - every: 10s - warn: $this > (($status >= $WARNING) ? ($update_every) : ( 5 * $update_every)) - crit: $this > (($status == $CRITICAL) ? ($update_every) : (60 * $update_every)) - delay: down 5m multiplier 1.5 max 1h - info: number of seconds since the last successful data collection - to: webmaster + template: last_collected_secs + on: web_log.response_codes + class: Web Server +component: Web log + type: Latency + families: * + calc: $now - $last_collected_t + units: seconds ago + every: 10s + warn: $this > (($status >= $WARNING) ? ($update_every) : ( 5 * $update_every)) + crit: $this > (($status == $CRITICAL) ? ($update_every) : (60 * $update_every)) + delay: down 5m multiplier 1.5 max 1h + info: number of seconds since the last successful data collection + to: webmaster # ----------------------------------------------------------------------------- @@ -24,66 +27,81 @@ families: * # # i.e. when there are at least 120 requests during the last minute -template: 1m_requests - on: web_log.response_statuses -families: * - lookup: sum -1m unaligned - calc: ($this == 0)?(1):($this) - units: requests - every: 10s - info: number of HTTP requests in the last minute - -template: 1m_successful - on: web_log.response_statuses -families: * - lookup: sum -1m unaligned of successful_requests - calc: $this * 100 / $1m_requests - units: % - every: 10s - warn: ($1m_requests > 120) ? ($this < (($status >= $WARNING ) ? ( 95 ) : ( 85 )) ) : ( 0 ) - crit: ($1m_requests > 120) ? ($this < (($status == $CRITICAL) ? ( 85 ) : ( 75 )) ) : ( 0 ) - delay: up 2m down 15m multiplier 1.5 max 1h - info: ratio of successful HTTP requests over the last minute (1xx, 2xx, 304, 401) - to: webmaster - -template: 1m_redirects - on: web_log.response_statuses -families: * - lookup: sum -1m unaligned of redirects - calc: $this * 100 / $1m_requests - units: % - every: 10s - warn: ($1m_requests > 120) ? ($this > (($status >= $WARNING ) ? ( 1 ) : ( 20 )) ) : ( 0 ) - crit: ($1m_requests > 120) ? ($this > (($status == $CRITICAL) ? ( 20 ) : ( 30 )) ) : ( 0 ) - delay: up 2m down 15m multiplier 1.5 max 1h - info: ratio of redirection HTTP requests over the last minute (3xx except 304) - to: webmaster - -template: 1m_bad_requests - on: web_log.response_statuses -families: * - lookup: sum -1m unaligned of bad_requests - calc: $this * 100 / $1m_requests - units: % - every: 10s - warn: ($1m_requests > 120) ? ($this > (($status >= $WARNING) ? ( 10 ) : ( 30 )) ) : ( 0 ) - crit: ($1m_requests > 120) ? ($this > (($status == $CRITICAL) ? ( 30 ) : ( 50 )) ) : ( 0 ) - delay: up 2m down 15m multiplier 1.5 max 1h - info: ratio of client error HTTP requests over the last minute (4xx except 401) - to: webmaster - -template: 1m_internal_errors - on: web_log.response_statuses -families: * - lookup: sum -1m unaligned of server_errors - calc: $this * 100 / $1m_requests - units: % - every: 10s - warn: ($1m_requests > 120) ? ($this > (($status >= $WARNING) ? ( 1 ) : ( 2 )) ) : ( 0 ) - crit: ($1m_requests > 120) ? ($this > (($status == $CRITICAL) ? ( 2 ) : ( 5 )) ) : ( 0 ) - delay: up 2m down 15m multiplier 1.5 max 1h - info: ratio of server error HTTP requests over the last minute (5xx) - to: webmaster + template: 1m_requests + on: web_log.response_statuses + class: Web Server +component: Web log + type: Workload + families: * + lookup: sum -1m unaligned + calc: ($this == 0)?(1):($this) + units: requests + every: 10s + info: number of HTTP requests in the last minute + + template: 1m_successful + on: web_log.response_statuses + class: Web Server +component: Web log + type: Workload + families: * + lookup: sum -1m unaligned of successful_requests + calc: $this * 100 / $1m_requests + units: % + every: 10s + warn: ($1m_requests > 120) ? ($this < (($status >= $WARNING ) ? ( 95 ) : ( 85 )) ) : ( 0 ) + crit: ($1m_requests > 120) ? ($this < (($status == $CRITICAL) ? ( 85 ) : ( 75 )) ) : ( 0 ) + delay: up 2m down 15m multiplier 1.5 max 1h + info: ratio of successful HTTP requests over the last minute (1xx, 2xx, 304, 401) + to: webmaster + + template: 1m_redirects + on: web_log.response_statuses + class: Web Server +component: Web log + type: Workload + families: * + lookup: sum -1m unaligned of redirects + calc: $this * 100 / $1m_requests + units: % + every: 10s + warn: ($1m_requests > 120) ? ($this > (($status >= $WARNING ) ? ( 1 ) : ( 20 )) ) : ( 0 ) + crit: ($1m_requests > 120) ? ($this > (($status == $CRITICAL) ? ( 20 ) : ( 30 )) ) : ( 0 ) + delay: up 2m down 15m multiplier 1.5 max 1h + info: ratio of redirection HTTP requests over the last minute (3xx except 304) + to: webmaster + + template: 1m_bad_requests + on: web_log.response_statuses + class: Web Server +component: Web log + type: Errors + families: * + lookup: sum -1m unaligned of bad_requests + calc: $this * 100 / $1m_requests + units: % + every: 10s + warn: ($1m_requests > 120) ? ($this > (($status >= $WARNING) ? ( 10 ) : ( 30 )) ) : ( 0 ) + crit: ($1m_requests > 120) ? ($this > (($status == $CRITICAL) ? ( 30 ) : ( 50 )) ) : ( 0 ) + delay: up 2m down 15m multiplier 1.5 max 1h + info: ratio of client error HTTP requests over the last minute (4xx except 401) + to: webmaster + + template: 1m_internal_errors + on: web_log.response_statuses + class: Web Server +component: Web log + type: Errors + families: * + lookup: sum -1m unaligned of server_errors + calc: $this * 100 / $1m_requests + units: % + every: 10s + warn: ($1m_requests > 120) ? ($this > (($status >= $WARNING) ? ( 1 ) : ( 2 )) ) : ( 0 ) + crit: ($1m_requests > 120) ? ($this > (($status == $CRITICAL) ? ( 2 ) : ( 5 )) ) : ( 0 ) + delay: up 2m down 15m multiplier 1.5 max 1h + info: ratio of server error HTTP requests over the last minute (5xx) + to: webmaster # unmatched lines @@ -94,26 +112,32 @@ families: * # # i.e. when there are at least 120 requests during the last minute -template: 1m_total_requests - on: web_log.response_codes -families: * - lookup: sum -1m unaligned - calc: ($this == 0)?(1):($this) - units: requests - every: 10s - info: number of HTTP requests over the last minute - -template: 1m_unmatched - on: web_log.response_codes -families: * - lookup: sum -1m unaligned of unmatched - calc: $this * 100 / $1m_total_requests - units: % - every: 10s - warn: ($1m_total_requests > 120) ? ($this > 1) : ( 0 ) - delay: up 1m down 5m multiplier 1.5 max 1h - info: percentage of unparsed log lines over the last minute - to: webmaster + template: 1m_total_requests + on: web_log.response_codes + class: Web Server +component: Web log + type: Workload + families: * + lookup: sum -1m unaligned + calc: ($this == 0)?(1):($this) + units: requests + every: 10s + info: number of HTTP requests over the last minute + + template: 1m_unmatched + on: web_log.response_codes + class: Web Server +component: Web log + type: Errors + families: * + lookup: sum -1m unaligned of unmatched + calc: $this * 100 / $1m_total_requests + units: % + every: 10s + warn: ($1m_total_requests > 120) ? ($this > 1) : ( 0 ) + delay: up 1m down 5m multiplier 1.5 max 1h + info: percentage of unparsed log lines over the last minute + to: webmaster # ----------------------------------------------------------------------------- # web slow @@ -125,28 +149,34 @@ families: * # # i.e. when there are at least 120 requests during the last minute -template: 10m_response_time - on: web_log.response_time -families: * - lookup: average -10m unaligned of avg - units: ms - every: 30s - info: average HTTP response time over the last 10 minutes - -template: web_slow - on: web_log.response_time -families: * - lookup: average -1m unaligned of avg - units: ms - every: 10s - green: 500 - red: 1000 - warn: ($1m_requests > 120) ? ($this > $green && $this > ($10m_response_time * 2) ) : ( 0 ) - crit: ($1m_requests > 120) ? ($this > $red && $this > ($10m_response_time * 4) ) : ( 0 ) - delay: down 15m multiplier 1.5 max 1h - info: average HTTP response time over the last minute - options: no-clear-notification - to: webmaster + template: 10m_response_time + on: web_log.response_time + class: System +component: Web log + type: Latency + families: * + lookup: average -10m unaligned of avg + units: ms + every: 30s + info: average HTTP response time over the last 10 minutes + + template: web_slow + on: web_log.response_time + class: Web Server +component: Web log + type: Latency + families: * + lookup: average -1m unaligned of avg + units: ms + every: 10s + green: 500 + red: 1000 + warn: ($1m_requests > 120) ? ($this > $green && $this > ($10m_response_time * 2) ) : ( 0 ) + crit: ($1m_requests > 120) ? ($this > $red && $this > ($10m_response_time * 4) ) : ( 0 ) + delay: down 15m multiplier 1.5 max 1h + info: average HTTP response time over the last minute + options: no-clear-notification + to: webmaster # ----------------------------------------------------------------------------- # web too many or too few requests @@ -159,36 +189,45 @@ families: * # i.e. when there were at least 120 requests during the 5 minutes starting # at -10m and ending at -5m -template: 5m_successful_old - on: web_log.response_statuses -families: * - lookup: average -5m at -5m unaligned of successful_requests - units: requests/s - every: 30s - info: average number of successful HTTP requests for the 5 minutes starting 10 minutes ago - -template: 5m_successful - on: web_log.response_statuses -families: * - lookup: average -5m unaligned of successful_requests - units: requests/s - every: 30s - info: average number of successful HTTP requests over the last 5 minutes - -template: 5m_requests_ratio - on: web_log.response_codes -families: * - calc: ($5m_successful_old > 0)?($5m_successful * 100 / $5m_successful_old):(100) - units: % - every: 30s - warn: ($5m_successful_old > 120) ? ($this > 200 OR $this < 50) : (0) - crit: ($5m_successful_old > 120) ? ($this > 400 OR $this < 25) : (0) - delay: down 15m multiplier 1.5 max 1h -options: no-clear-notification - info: ratio of successful HTTP requests over the last 5 minutes, \ - compared with the previous 5 minutes \ - (clear notification for this alarm will not be sent) - to: webmaster + template: 5m_successful_old + on: web_log.response_statuses + class: Web Server +component: Web log + type: Workload + families: * + lookup: average -5m at -5m unaligned of successful_requests + units: requests/s + every: 30s + info: average number of successful HTTP requests for the 5 minutes starting 10 minutes ago + + template: 5m_successful + on: web_log.response_statuses + class: Web Server +component: Web log + type: Workload + families: * + lookup: average -5m unaligned of successful_requests + units: requests/s + every: 30s + info: average number of successful HTTP requests over the last 5 minutes + + template: 5m_requests_ratio + on: web_log.response_codes + class: Web Server +component: Web log + type: Workload + families: * + calc: ($5m_successful_old > 0)?($5m_successful * 100 / $5m_successful_old):(100) + units: % + every: 30s + warn: ($5m_successful_old > 120) ? ($this > 200 OR $this < 50) : (0) + crit: ($5m_successful_old > 120) ? ($this > 400 OR $this < 25) : (0) + delay: down 15m multiplier 1.5 max 1h + options: no-clear-notification + info: ratio of successful HTTP requests over the last 5 minutes, \ + compared with the previous 5 minutes \ + (clear notification for this alarm will not be sent) + to: webmaster @@ -196,17 +235,20 @@ options: no-clear-notification # make sure we can collect web log data -template: web_log_last_collected_secs - on: web_log.requests -families: * - calc: $now - $last_collected_t - units: seconds ago - every: 10s - warn: $this > (($status >= $WARNING) ? ($update_every) : ( 5 * $update_every)) - crit: $this > (($status == $CRITICAL) ? ($update_every) : (60 * $update_every)) - delay: down 5m multiplier 1.5 max 1h - info: number of seconds since the last successful data collection - to: webmaster + template: web_log_last_collected_secs + on: web_log.requests + class: Web Server +component: Web log + type: Latency + families: * + calc: $now - $last_collected_t + units: seconds ago + every: 10s + warn: $this > (($status >= $WARNING) ? ($update_every) : ( 5 * $update_every)) + crit: $this > (($status == $CRITICAL) ? ($update_every) : (60 * $update_every)) + delay: down 5m multiplier 1.5 max 1h + info: number of seconds since the last successful data collection + to: webmaster # unmatched lines @@ -217,26 +259,32 @@ families: * # # i.e. when there are at least 120 requests during the last minute -template: web_log_1m_total_requests - on: web_log.requests -families: * - lookup: sum -1m unaligned - calc: ($this == 0)?(1):($this) - units: requests - every: 10s - info: number of HTTP requests in the last minute - -template: web_log_1m_unmatched - on: web_log.excluded_requests -families: * - lookup: sum -1m unaligned of unmatched - calc: $this * 100 / $web_log_1m_total_requests - units: % - every: 10s - warn: ($web_log_1m_total_requests > 120) ? ($this > 1) : ( 0 ) - delay: up 1m down 5m multiplier 1.5 max 1h - info: percentage of unparsed log lines over the last minute - to: webmaster + template: web_log_1m_total_requests + on: web_log.requests + class: Web Server +component: Web log + type: Workload + families: * + lookup: sum -1m unaligned + calc: ($this == 0)?(1):($this) + units: requests + every: 10s + info: number of HTTP requests in the last minute + + template: web_log_1m_unmatched + on: web_log.excluded_requests + class: Web Server +component: Web log + type: Errors + families: * + lookup: sum -1m unaligned of unmatched + calc: $this * 100 / $web_log_1m_total_requests + units: % + every: 10s + warn: ($web_log_1m_total_requests > 120) ? ($this > 1) : ( 0 ) + delay: up 1m down 5m multiplier 1.5 max 1h + info: percentage of unparsed log lines over the last minute + to: webmaster # ----------------------------------------------------------------------------- # high level response code alarms @@ -248,66 +296,81 @@ families: * # # i.e. when there are at least 120 requests during the last minute -template: web_log_1m_requests - on: web_log.type_requests -families: * - lookup: sum -1m unaligned - calc: ($this == 0)?(1):($this) - units: requests - every: 10s - info: number of HTTP requests in the last minute - -template: web_log_1m_successful - on: web_log.type_requests -families: * - lookup: sum -1m unaligned of success - calc: $this * 100 / $web_log_1m_requests - units: % - every: 10s - warn: ($web_log_1m_requests > 120) ? ($this < (($status >= $WARNING ) ? ( 95 ) : ( 85 )) ) : ( 0 ) - crit: ($web_log_1m_requests > 120) ? ($this < (($status == $CRITICAL) ? ( 85 ) : ( 75 )) ) : ( 0 ) - delay: up 2m down 15m multiplier 1.5 max 1h - info: ratio of successful HTTP requests over the last minute (1xx, 2xx, 304, 401) - to: webmaster - -template: web_log_1m_redirects - on: web_log.type_requests -families: * - lookup: sum -1m unaligned of redirect - calc: $this * 100 / $web_log_1m_requests - units: % - every: 10s - warn: ($web_log_1m_requests > 120) ? ($this > (($status >= $WARNING ) ? ( 1 ) : ( 20 )) ) : ( 0 ) - crit: ($web_log_1m_requests > 120) ? ($this > (($status == $CRITICAL) ? ( 20 ) : ( 30 )) ) : ( 0 ) - delay: up 2m down 15m multiplier 1.5 max 1h - info: ratio of redirection HTTP requests over the last minute (3xx except 304) - to: webmaster - -template: web_log_1m_bad_requests - on: web_log.type_requests -families: * - lookup: sum -1m unaligned of bad - calc: $this * 100 / $web_log_1m_requests - units: % - every: 10s - warn: ($web_log_1m_requests > 120) ? ($this > (($status >= $WARNING) ? ( 10 ) : ( 30 )) ) : ( 0 ) - crit: ($web_log_1m_requests > 120) ? ($this > (($status == $CRITICAL) ? ( 30 ) : ( 50 )) ) : ( 0 ) - delay: up 2m down 15m multiplier 1.5 max 1h - info: ratio of client error HTTP requests over the last minute (4xx except 401) - to: webmaster - -template: web_log_1m_internal_errors - on: web_log.type_requests -families: * - lookup: sum -1m unaligned of error - calc: $this * 100 / $web_log_1m_requests - units: % - every: 10s - warn: ($web_log_1m_requests > 120) ? ($this > (($status >= $WARNING) ? ( 1 ) : ( 2 )) ) : ( 0 ) - crit: ($web_log_1m_requests > 120) ? ($this > (($status == $CRITICAL) ? ( 2 ) : ( 5 )) ) : ( 0 ) - delay: up 2m down 15m multiplier 1.5 max 1h - info: ratio of server error HTTP requests over the last minute (5xx) - to: webmaster + template: web_log_1m_requests + on: web_log.type_requests + class: Web Server +component: Web log + type: Workload + families: * + lookup: sum -1m unaligned + calc: ($this == 0)?(1):($this) + units: requests + every: 10s + info: number of HTTP requests in the last minute + + template: web_log_1m_successful + on: web_log.type_requests + class: Web Server +component: Web log + type: Workload + families: * + lookup: sum -1m unaligned of success + calc: $this * 100 / $web_log_1m_requests + units: % + every: 10s + warn: ($web_log_1m_requests > 120) ? ($this < (($status >= $WARNING ) ? ( 95 ) : ( 85 )) ) : ( 0 ) + crit: ($web_log_1m_requests > 120) ? ($this < (($status == $CRITICAL) ? ( 85 ) : ( 75 )) ) : ( 0 ) + delay: up 2m down 15m multiplier 1.5 max 1h + info: ratio of successful HTTP requests over the last minute (1xx, 2xx, 304, 401) + to: webmaster + + template: web_log_1m_redirects + on: web_log.type_requests + class: Web Server +component: Web log + type: Workload + families: * + lookup: sum -1m unaligned of redirect + calc: $this * 100 / $web_log_1m_requests + units: % + every: 10s + warn: ($web_log_1m_requests > 120) ? ($this > (($status >= $WARNING ) ? ( 1 ) : ( 20 )) ) : ( 0 ) + crit: ($web_log_1m_requests > 120) ? ($this > (($status == $CRITICAL) ? ( 20 ) : ( 30 )) ) : ( 0 ) + delay: up 2m down 15m multiplier 1.5 max 1h + info: ratio of redirection HTTP requests over the last minute (3xx except 304) + to: webmaster + + template: web_log_1m_bad_requests + on: web_log.type_requests + class: Web Server +component: Web log + type: Errors + families: * + lookup: sum -1m unaligned of bad + calc: $this * 100 / $web_log_1m_requests + units: % + every: 10s + warn: ($web_log_1m_requests > 120) ? ($this > (($status >= $WARNING) ? ( 10 ) : ( 30 )) ) : ( 0 ) + crit: ($web_log_1m_requests > 120) ? ($this > (($status == $CRITICAL) ? ( 30 ) : ( 50 )) ) : ( 0 ) + delay: up 2m down 15m multiplier 1.5 max 1h + info: ratio of client error HTTP requests over the last minute (4xx except 401) + to: webmaster + + template: web_log_1m_internal_errors + on: web_log.type_requests + class: Web Server +component: Web log + type: Errors + families: * + lookup: sum -1m unaligned of error + calc: $this * 100 / $web_log_1m_requests + units: % + every: 10s + warn: ($web_log_1m_requests > 120) ? ($this > (($status >= $WARNING) ? ( 1 ) : ( 2 )) ) : ( 0 ) + crit: ($web_log_1m_requests > 120) ? ($this > (($status == $CRITICAL) ? ( 2 ) : ( 5 )) ) : ( 0 ) + delay: up 2m down 15m multiplier 1.5 max 1h + info: ratio of server error HTTP requests over the last minute (5xx) + to: webmaster # ----------------------------------------------------------------------------- # web slow @@ -319,28 +382,34 @@ families: * # # i.e. when there are at least 120 requests during the last minute -template: web_log_10m_response_time - on: web_log.request_processing_time -families: * - lookup: average -10m unaligned of avg - units: ms - every: 30s - info: average HTTP response time over the last 10 minutes - -template: web_log_web_slow - on: web_log.request_processing_time -families: * - lookup: average -1m unaligned of avg - units: ms - every: 10s - green: 500 - red: 1000 - warn: ($web_log_1m_requests > 120) ? ($this > $green && $this > ($web_log_10m_response_time * 2) ) : ( 0 ) - crit: ($web_log_1m_requests > 120) ? ($this > $red && $this > ($web_log_10m_response_time * 4) ) : ( 0 ) - delay: down 15m multiplier 1.5 max 1h - info: average HTTP response time over the last 1 minute - options: no-clear-notification - to: webmaster + template: web_log_10m_response_time + on: web_log.request_processing_time + class: System +component: Web log + type: Latency + families: * + lookup: average -10m unaligned of avg + units: ms + every: 30s + info: average HTTP response time over the last 10 minutes + + template: web_log_web_slow + on: web_log.request_processing_time + class: Web Server +component: Web log + type: Latency + families: * + lookup: average -1m unaligned of avg + units: ms + every: 10s + green: 500 + red: 1000 + warn: ($web_log_1m_requests > 120) ? ($this > $green && $this > ($web_log_10m_response_time * 2) ) : ( 0 ) + crit: ($web_log_1m_requests > 120) ? ($this > $red && $this > ($web_log_10m_response_time * 4) ) : ( 0 ) + delay: down 15m multiplier 1.5 max 1h + info: average HTTP response time over the last 1 minute + options: no-clear-notification + to: webmaster # ----------------------------------------------------------------------------- # web too many or too few requests @@ -353,33 +422,42 @@ families: * # i.e. when there were at least 120 requests during the 5 minutes starting # at -10m and ending at -5m -template: web_log_5m_successful_old - on: web_log.type_requests -families: * - lookup: average -5m at -5m unaligned of success - units: requests/s - every: 30s - info: average number of successful HTTP requests for the 5 minutes starting 10 minutes ago - -template: web_log_5m_successful - on: web_log.type_requests -families: * - lookup: average -5m unaligned of success - units: requests/s - every: 30s - info: average number of successful HTTP requests over the last 5 minutes - -template: web_log_5m_requests_ratio - on: web_log.type_requests -families: * - calc: ($web_log_5m_successful_old > 0)?($web_log_5m_successful * 100 / $web_log_5m_successful_old):(100) - units: % - every: 30s - warn: ($web_log_5m_successful_old > 120) ? ($this > 200 OR $this < 50) : (0) - crit: ($web_log_5m_successful_old > 120) ? ($this > 400 OR $this < 25) : (0) - delay: down 15m multiplier 1.5 max 1h -options: no-clear-notification - info: ratio of successful HTTP requests over over the last 5 minutes, \ - compared with the previous 5 minutes \ - (clear notification for this alarm will not be sent) - to: webmaster + template: web_log_5m_successful_old + on: web_log.type_requests + class: Web Server +component: Web log + type: Workload + families: * + lookup: average -5m at -5m unaligned of success + units: requests/s + every: 30s + info: average number of successful HTTP requests for the 5 minutes starting 10 minutes ago + + template: web_log_5m_successful + on: web_log.type_requests + class: Web Server +component: Web log + type: Workload + families: * + lookup: average -5m unaligned of success + units: requests/s + every: 30s + info: average number of successful HTTP requests over the last 5 minutes + + template: web_log_5m_requests_ratio + on: web_log.type_requests + class: Web Server +component: Web log + type: Workload + families: * + calc: ($web_log_5m_successful_old > 0)?($web_log_5m_successful * 100 / $web_log_5m_successful_old):(100) + units: % + every: 30s + warn: ($web_log_5m_successful_old > 120) ? ($this > 200 OR $this < 50) : (0) + crit: ($web_log_5m_successful_old > 120) ? ($this > 400 OR $this < 25) : (0) + delay: down 15m multiplier 1.5 max 1h + options: no-clear-notification + info: ratio of successful HTTP requests over over the last 5 minutes, \ + compared with the previous 5 minutes \ + (clear notification for this alarm will not be sent) + to: webmaster diff --git a/health/health.d/whoisquery.conf b/health/health.d/whoisquery.conf index 36ae02fa..c6d3a9de 100644 --- a/health/health.d/whoisquery.conf +++ b/health/health.d/whoisquery.conf @@ -1,24 +1,30 @@ # make sure whoisquery is running -template: whoisquery_last_collected_secs - on: whoisquery.time_until_expiration - calc: $now - $last_collected_t - units: seconds ago - every: 60s - warn: $this > (($status >= $WARNING) ? ($update_every) : ( 5 * $update_every)) - crit: $this > (($status == $CRITICAL) ? ($update_every) : (60 * $update_every)) - delay: down 5m multiplier 1.5 max 1h - info: number of seconds since the last successful data collection - to: webmaster + template: whoisquery_last_collected_secs + on: whoisquery.time_until_expiration + class: Other +component: WHOIS + type: Latency + calc: $now - $last_collected_t + units: seconds ago + every: 60s + warn: $this > (($status >= $WARNING) ? ($update_every) : ( 5 * $update_every)) + crit: $this > (($status == $CRITICAL) ? ($update_every) : (60 * $update_every)) + delay: down 5m multiplier 1.5 max 1h + info: number of seconds since the last successful data collection + to: webmaster -template: whoisquery_days_until_expiration - on: whoisquery.time_until_expiration - calc: $expiry - units: seconds - every: 60s - warn: $this < $days_until_expiration_warning*24*60*60 - crit: $this < $days_until_expiration_critical*24*60*60 - info: time until the domain name registration expires - to: webmaster + template: whoisquery_days_until_expiration + on: whoisquery.time_until_expiration + class: Other +component: WHOIS + type: Utilization + calc: $expiry + units: seconds + every: 60s + warn: $this < $days_until_expiration_warning*24*60*60 + crit: $this < $days_until_expiration_critical*24*60*60 + info: time until the domain name registration expires + to: webmaster diff --git a/health/health.d/wmi.conf b/health/health.d/wmi.conf index f1f71a60..6bd4e077 100644 --- a/health/health.d/wmi.conf +++ b/health/health.d/wmi.conf @@ -3,128 +3,155 @@ ## Availability -template: wmi_last_collected_secs - on: cpu.collector_duration - calc: $now - $last_collected_t - units: seconds ago - every: 10s - warn: $this > (($status >= $WARNING) ? ($update_every) : ( 5 * $update_every)) - crit: $this > (($status == $CRITICAL) ? ($update_every) : (60 * $update_every)) - delay: down 5m multiplier 1.5 max 1h - info: number of seconds since the last successful data collection - to: sysadmin + template: wmi_last_collected_secs + on: cpu.collector_duration + class: Windows +component: Availability + type: Latency + calc: $now - $last_collected_t + units: seconds ago + every: 10s + warn: $this > (($status >= $WARNING) ? ($update_every) : ( 5 * $update_every)) + crit: $this > (($status == $CRITICAL) ? ($update_every) : (60 * $update_every)) + delay: down 5m multiplier 1.5 max 1h + info: number of seconds since the last successful data collection + to: sysadmin ## CPU -template: wmi_10min_cpu_usage - on: wmi.cpu_utilization_total - os: linux - hosts: * - lookup: average -10m unaligned match-names of dpc,user,privileged,interrupt - units: % - every: 1m - warn: $this > (($status >= $WARNING) ? (75) : (85)) - crit: $this > (($status == $CRITICAL) ? (85) : (95)) - delay: down 15m multiplier 1.5 max 1h - info: average CPU utilization over the last 10 minutes - to: sysadmin + template: wmi_10min_cpu_usage + on: wmi.cpu_utilization_total + class: Windows +component: CPU + type: Utilization + os: linux + hosts: * + lookup: average -10m unaligned match-names of dpc,user,privileged,interrupt + units: % + every: 1m + warn: $this > (($status >= $WARNING) ? (75) : (85)) + crit: $this > (($status == $CRITICAL) ? (85) : (95)) + delay: down 15m multiplier 1.5 max 1h + info: average CPU utilization over the last 10 minutes + to: sysadmin ## Memory -template: wmi_ram_in_use - on: wmi.memory_utilization - os: linux - hosts: * - calc: ($used) * 100 / ($used + $available) - units: % - every: 10s - warn: $this > (($status >= $WARNING) ? (80) : (90)) - crit: $this > (($status == $CRITICAL) ? (90) : (98)) - delay: down 15m multiplier 1.5 max 1h - info: memory utilization - to: sysadmin - -template: wmi_swap_in_use - on: wmi.memory_swap_utilization - os: linux - hosts: * - calc: ($used) * 100 / ($used + $available) - units: % - every: 10s - warn: $this > (($status >= $WARNING) ? (80) : (90)) - crit: $this > (($status == $CRITICAL) ? (90) : (98)) - delay: down 15m multiplier 1.5 max 1h - info: swap memory utilization - to: sysadmin + template: wmi_ram_in_use + on: wmi.memory_utilization + class: Windows +component: Memory + type: Utilization + os: linux + hosts: * + calc: ($used) * 100 / ($used + $available) + units: % + every: 10s + warn: $this > (($status >= $WARNING) ? (80) : (90)) + crit: $this > (($status == $CRITICAL) ? (90) : (98)) + delay: down 15m multiplier 1.5 max 1h + info: memory utilization + to: sysadmin + + template: wmi_swap_in_use + on: wmi.memory_swap_utilization + class: Windows +component: Memory + type: Utilization + os: linux + hosts: * + calc: ($used) * 100 / ($used + $available) + units: % + every: 10s + warn: $this > (($status >= $WARNING) ? (80) : (90)) + crit: $this > (($status == $CRITICAL) ? (90) : (98)) + delay: down 15m multiplier 1.5 max 1h + info: swap memory utilization + to: sysadmin ## Network -template: wmi_inbound_packets_discarded - on: wmi.net_discarded - os: linux - hosts: * -families: * - lookup: sum -10m unaligned absolute match-names of inbound - units: packets - every: 1m - warn: $this >= 5 - delay: down 1h multiplier 1.5 max 2h - info: number of inbound discarded packets for the network interface in the last 10 minutes - to: sysadmin - -template: wmi_outbound_packets_discarded - on: wmi.net_discarded - os: linux - hosts: * -families: * - lookup: sum -10m unaligned absolute match-names of outbound - units: packets - every: 1m - warn: $this >= 5 - delay: down 1h multiplier 1.5 max 2h - info: number of outbound discarded packets for the network interface in the last 10 minutes - to: sysadmin - -template: wmi_inbound_packets_errors - on: wmi.net_errors - os: linux - hosts: * -families: * - lookup: sum -10m unaligned absolute match-names of inbound - units: packets - every: 1m - warn: $this >= 5 - delay: down 1h multiplier 1.5 max 2h - info: number of inbound errors for the network interface in the last 10 minutes - to: sysadmin - -template: wmi_outbound_packets_errors - on: wmi.net_errors - os: linux - hosts: * -families: * - lookup: sum -10m unaligned absolute match-names of outbound - units: packets - every: 1m - warn: $this >= 5 - delay: down 1h multiplier 1.5 max 2h - info: number of outbound errors for the network interface in the last 10 minutes - to: sysadmin + template: wmi_inbound_packets_discarded + on: wmi.net_discarded + class: Windows +component: Network + type: Errors + os: linux + hosts: * + families: * + lookup: sum -10m unaligned absolute match-names of inbound + units: packets + every: 1m + warn: $this >= 5 + delay: down 1h multiplier 1.5 max 2h + info: number of inbound discarded packets for the network interface in the last 10 minutes + to: sysadmin + + template: wmi_outbound_packets_discarded + on: wmi.net_discarded + class: Windows +component: Network + type: Errors + os: linux + hosts: * + families: * + lookup: sum -10m unaligned absolute match-names of outbound + units: packets + every: 1m + warn: $this >= 5 + delay: down 1h multiplier 1.5 max 2h + info: number of outbound discarded packets for the network interface in the last 10 minutes + to: sysadmin + + template: wmi_inbound_packets_errors + on: wmi.net_errors + class: Windows +component: Network + type: Errors + os: linux + hosts: * + families: * + lookup: sum -10m unaligned absolute match-names of inbound + units: packets + every: 1m + warn: $this >= 5 + delay: down 1h multiplier 1.5 max 2h + info: number of inbound errors for the network interface in the last 10 minutes + to: sysadmin + + template: wmi_outbound_packets_errors + on: wmi.net_errors + class: Windows +component: Network + type: Errors + os: linux + hosts: * + families: * + lookup: sum -10m unaligned absolute match-names of outbound + units: packets + every: 1m + warn: $this >= 5 + delay: down 1h multiplier 1.5 max 2h + info: number of outbound errors for the network interface in the last 10 minutes + to: sysadmin ## Disk -template: wmi_disk_in_use - on: wmi.logical_disk_utilization - os: linux - hosts: * - calc: ($used) * 100 / ($used + $free) - units: % - every: 10s - warn: $this > (($status >= $WARNING) ? (80) : (90)) - crit: $this > (($status == $CRITICAL) ? (90) : (98)) - delay: down 15m multiplier 1.5 max 1h - info: disk space utilization - to: sysadmin + template: wmi_disk_in_use + on: wmi.logical_disk_utilization + class: Windows +component: Disk + type: Utilization + os: linux + hosts: * + calc: ($used) * 100 / ($used + $free) + units: % + every: 10s + warn: $this > (($status >= $WARNING) ? (80) : (90)) + crit: $this > (($status == $CRITICAL) ? (90) : (98)) + delay: down 15m multiplier 1.5 max 1h + info: disk space utilization + to: sysadmin diff --git a/health/health.d/x509check.conf b/health/health.d/x509check.conf index f2e4a050..93c406b7 100644 --- a/health/health.d/x509check.conf +++ b/health/health.d/x509check.conf @@ -1,32 +1,41 @@ # make sure x509check is running -template: x509check_last_collected_secs - on: x509check.time_until_expiration - calc: $now - $last_collected_t - units: seconds ago - every: 60s - warn: $this > (($status >= $WARNING) ? ($update_every) : ( 5 * $update_every)) - crit: $this > (($status == $CRITICAL) ? ($update_every) : (60 * $update_every)) - delay: down 5m multiplier 1.5 max 1h - info: number of seconds since the last successful data collection - to: webmaster + template: x509check_last_collected_secs + on: x509check.time_until_expiration + class: Certificates +component: x509 certificates + type: Latency + calc: $now - $last_collected_t + units: seconds ago + every: 60s + warn: $this > (($status >= $WARNING) ? ($update_every) : ( 5 * $update_every)) + crit: $this > (($status == $CRITICAL) ? ($update_every) : (60 * $update_every)) + delay: down 5m multiplier 1.5 max 1h + info: number of seconds since the last successful data collection + to: webmaster -template: x509check_days_until_expiration - on: x509check.time_until_expiration - calc: $expiry - units: seconds - every: 60s - warn: $this < $days_until_expiration_warning*24*60*60 - crit: $this < $days_until_expiration_critical*24*60*60 - info: time until x509 certificate expires - to: webmaster + template: x509check_days_until_expiration + on: x509check.time_until_expiration + class: Certificates +component: x509 certificates + type: Latency + calc: $expiry + units: seconds + every: 60s + warn: $this < $days_until_expiration_warning*24*60*60 + crit: $this < $days_until_expiration_critical*24*60*60 + info: time until x509 certificate expires + to: webmaster -template: x509check_revocation_status - on: x509check.revocation_status - calc: $revoked - every: 60s - crit: $this != nan AND $this != 0 - info: x509 certificate revocation status (0: revoked, 1: valid) - to: webmaster + template: x509check_revocation_status + on: x509check.revocation_status + class: Certificates +component: x509 certificates + type: Errors + calc: $revoked + every: 60s + crit: $this != nan AND $this != 0 + info: x509 certificate revocation status (0: revoked, 1: valid) + to: webmaster diff --git a/health/health.d/zfs.conf b/health/health.d/zfs.conf index 74f96dd3..d6f5fa2f 100644 --- a/health/health.d/zfs.conf +++ b/health/health.d/zfs.conf @@ -1,10 +1,41 @@ - alarm: zfs_memory_throttle - on: zfs.memory_ops - lookup: sum -10m unaligned absolute of throttled - units: events - every: 1m - warn: $this > 0 - delay: down 1h multiplier 1.5 max 2h - info: number of times ZFS had to limit the ARC growth in the last 10 minutes - to: sysadmin + alarm: zfs_memory_throttle + on: zfs.memory_ops + class: System +component: File system + type: Utilization + lookup: sum -10m unaligned absolute of throttled + units: events + every: 1m + warn: $this > 0 + delay: down 1h multiplier 1.5 max 2h + info: number of times ZFS had to limit the ARC growth in the last 10 minutes + to: sysadmin + +# ZFS pool state + + template: zfs_pool_state_warn + on: zfspool.state + class: System +component: File system + type: Errors + calc: $degraded + units: boolean + every: 10s + warn: $this > 0 + delay: down 1m multiplier 1.5 max 1h + info: ZFS pool $family state is degraded + to: sysadmin + + template: zfs_pool_state_crit + on: zfspool.state + class: System +component: File system + type: Errors + calc: $faulted + $unavail + units: boolean + every: 10s + crit: $this > 0 + delay: down 1m multiplier 1.5 max 1h + info: ZFS pool $family state is faulted or unavail + to: sysadmin diff --git a/health/health.d/zookeeper.conf b/health/health.d/zookeeper.conf index ffbe31ba..8c7d5a73 100644 --- a/health/health.d/zookeeper.conf +++ b/health/health.d/zookeeper.conf @@ -1,14 +1,17 @@ # make sure zookeeper is running -template: zookeeper_last_collected_secs - on: zookeeper.requests - calc: $now - $last_collected_t - units: seconds ago - every: 10s - warn: $this > (($status >= $WARNING) ? ($update_every) : ( 5 * $update_every)) - crit: $this > (($status == $CRITICAL) ? ($update_every) : (60 * $update_every)) - delay: down 5m multiplier 1.5 max 1h - info: number of seconds since the last successful data collection - to: webmaster + template: zookeeper_last_collected_secs + on: zookeeper.requests + class: KV Storage +component: ZooKeeper + type: Latency + calc: $now - $last_collected_t + units: seconds ago + every: 10s + warn: $this > (($status >= $WARNING) ? ($update_every) : ( 5 * $update_every)) + crit: $this > (($status == $CRITICAL) ? ($update_every) : (60 * $update_every)) + delay: down 5m multiplier 1.5 max 1h + info: number of seconds since the last successful data collection + to: webmaster diff --git a/health/health.h b/health/health.h index 07ce1311..56331b22 100644 --- a/health/health.h +++ b/health/health.h @@ -37,20 +37,6 @@ extern unsigned int default_health_enabled; #define HEALTH_LISTEN_BACKLOG 4096 #endif -#define HEALTH_ON_KEY "on" -#define HEALTH_EVERY_KEY "every" -#define HEALTH_GREEN_KEY "green" -#define HEALTH_RED_KEY "red" -#define HEALTH_WARN_KEY "warn" -#define HEALTH_CRIT_KEY "crit" -#define HEALTH_EXEC_KEY "exec" -#define HEALTH_RECIPIENT_KEY "to" -#define HEALTH_UNITS_KEY "units" -#define HEALTH_INFO_KEY "info" -#define HEALTH_DELAY_KEY "delay" -#define HEALTH_OPTIONS_KEY "options" -#define HEALTH_FOREACH_KEY "foreach" - #define HEALTH_SILENCERS_MAX_FILE_LEN 10000 extern char *silencers_filename; @@ -81,6 +67,9 @@ extern ALARM_ENTRY* health_create_alarm_entry( const char *name, const char *chart, const char *family, + const char *classification, + const char *component, + const char *type, const char *exec, const char *recipient, time_t duration, diff --git a/health/health_config.c b/health/health_config.c index e24acf77..75602371 100644 --- a/health/health_config.c +++ b/health/health_config.c @@ -12,6 +12,7 @@ #define HEALTH_FAMILIES_KEY "families" #define HEALTH_PLUGIN_KEY "plugin" #define HEALTH_MODULE_KEY "module" +#define HEALTH_CHARTS_KEY "charts" #define HEALTH_LOOKUP_KEY "lookup" #define HEALTH_CALC_KEY "calc" #define HEALTH_EVERY_KEY "every" @@ -23,10 +24,14 @@ #define HEALTH_RECIPIENT_KEY "to" #define HEALTH_UNITS_KEY "units" #define HEALTH_INFO_KEY "info" +#define HEALTH_CLASS_KEY "class" +#define HEALTH_COMPONENT_KEY "component" +#define HEALTH_TYPE_KEY "type" #define HEALTH_DELAY_KEY "delay" #define HEALTH_OPTIONS_KEY "options" #define HEALTH_REPEAT_KEY "repeat" #define HEALTH_HOST_LABEL_KEY "host labels" +#define HEALTH_FOREACH_KEY "foreach" static inline int rrdcalc_add_alarm_from_config(RRDHOST *host, RRDCALC *rc) { if(!rc->chart) { @@ -489,6 +494,7 @@ static int health_readfile(const char *filename, void *data) { hash_families = 0, hash_plugin = 0, hash_module = 0, + hash_charts = 0, hash_calc = 0, hash_green = 0, hash_red = 0, @@ -499,6 +505,9 @@ static int health_readfile(const char *filename, void *data) { hash_lookup = 0, hash_units = 0, hash_info = 0, + hash_class = 0, + hash_component = 0, + hash_type = 0, hash_recipient = 0, hash_delay = 0, hash_options = 0, @@ -516,6 +525,7 @@ static int health_readfile(const char *filename, void *data) { hash_families = simple_uhash(HEALTH_FAMILIES_KEY); hash_plugin = simple_uhash(HEALTH_PLUGIN_KEY); hash_module = simple_uhash(HEALTH_MODULE_KEY); + hash_charts = simple_uhash(HEALTH_CHARTS_KEY); hash_calc = simple_uhash(HEALTH_CALC_KEY); hash_lookup = simple_uhash(HEALTH_LOOKUP_KEY); hash_green = simple_uhash(HEALTH_GREEN_KEY); @@ -526,6 +536,9 @@ static int health_readfile(const char *filename, void *data) { hash_every = simple_uhash(HEALTH_EVERY_KEY); hash_units = simple_hash(HEALTH_UNITS_KEY); hash_info = simple_hash(HEALTH_INFO_KEY); + hash_class = simple_uhash(HEALTH_CLASS_KEY); + hash_component = simple_uhash(HEALTH_COMPONENT_KEY); + hash_type = simple_uhash(HEALTH_TYPE_KEY); hash_recipient = simple_hash(HEALTH_RECIPIENT_KEY); hash_delay = simple_uhash(HEALTH_DELAY_KEY); hash_options = simple_uhash(HEALTH_OPTIONS_KEY); @@ -696,6 +709,39 @@ static int health_readfile(const char *filename, void *data) { rc->chart = strdupz(value); rc->hash_chart = simple_hash(rc->chart); } + else if(hash == hash_class && !strcasecmp(key, HEALTH_CLASS_KEY)) { + if(rc->classification) { + if(strcmp(rc->classification, value) != 0) + error("Health configuration at line %zu of file '%s' for alarm '%s' has key '%s' twice, once with value '%s' and later with value '%s'. Using ('%s').", + line, filename, rc->name, key, rc->classification, value, value); + + freez(rc->classification); + } + rc->classification = strdupz(value); + strip_quotes(rc->classification); + } + else if(hash == hash_component && !strcasecmp(key, HEALTH_COMPONENT_KEY)) { + if(rc->component) { + if(strcmp(rc->component, value) != 0) + error("Health configuration at line %zu of file '%s' for alarm '%s' has key '%s' twice, once with value '%s' and later with value '%s'. Using ('%s').", + line, filename, rc->name, key, rc->component, value, value); + + freez(rc->component); + } + rc->component = strdupz(value); + strip_quotes(rc->component); + } + else if(hash == hash_type && !strcasecmp(key, HEALTH_TYPE_KEY)) { + if(rc->type) { + if(strcmp(rc->type, value) != 0) + error("Health configuration at line %zu of file '%s' for alarm '%s' has key '%s' twice, once with value '%s' and later with value '%s'. Using ('%s').", + line, filename, rc->name, key, rc->type, value, value); + + freez(rc->type); + } + rc->type = strdupz(value); + strip_quotes(rc->type); + } else if(hash == hash_lookup && !strcasecmp(key, HEALTH_LOOKUP_KEY)) { health_parse_db_lookup(line, filename, value, &rc->group, &rc->after, &rc->before, &rc->update_every, &rc->options, &rc->dimensions, &rc->foreachdim); @@ -848,6 +894,39 @@ static int health_readfile(const char *filename, void *data) { rt->context = strdupz(value); rt->hash_context = simple_hash(rt->context); } + else if(hash == hash_class && !strcasecmp(key, HEALTH_CLASS_KEY)) { + if(rt->classification) { + if(strcmp(rt->classification, value) != 0) + error("Health configuration at line %zu of file '%s' for alarm '%s' has key '%s' twice, once with value '%s' and later with value '%s'. Using ('%s').", + line, filename, rt->name, key, rt->classification, value, value); + + freez(rt->classification); + } + rt->classification = strdupz(value); + strip_quotes(rt->classification); + } + else if(hash == hash_component && !strcasecmp(key, HEALTH_COMPONENT_KEY)) { + if(rt->component) { + if(strcmp(rt->component, value) != 0) + error("Health configuration at line %zu of file '%s' for alarm '%s' has key '%s' twice, once with value '%s' and later with value '%s'. Using ('%s').", + line, filename, rt->name, key, rt->component, value, value); + + freez(rt->component); + } + rt->component = strdupz(value); + strip_quotes(rt->component); + } + else if(hash == hash_type && !strcasecmp(key, HEALTH_TYPE_KEY)) { + if(rt->type) { + if(strcmp(rt->type, value) != 0) + error("Health configuration at line %zu of file '%s' for alarm '%s' has key '%s' twice, once with value '%s' and later with value '%s'. Using ('%s').", + line, filename, rt->name, key, rt->type, value, value); + + freez(rt->type); + } + rt->type = strdupz(value); + strip_quotes(rt->type); + } else if(hash == hash_families && !strcasecmp(key, HEALTH_FAMILIES_KEY)) { freez(rt->family_match); simple_pattern_free(rt->family_pattern); @@ -869,6 +948,13 @@ static int health_readfile(const char *filename, void *data) { rt->module_match = strdupz(value); rt->module_pattern = simple_pattern_create(rt->module_match, NULL, SIMPLE_PATTERN_EXACT); } + else if(hash == hash_charts && !strcasecmp(key, HEALTH_CHARTS_KEY)) { + freez(rt->charts_match); + simple_pattern_free(rt->charts_pattern); + + rt->charts_match = strdupz(value); + rt->charts_pattern = simple_pattern_create(rt->charts_match, NULL, SIMPLE_PATTERN_EXACT); + } else if(hash == hash_lookup && !strcasecmp(key, HEALTH_LOOKUP_KEY)) { health_parse_db_lookup(line, filename, value, &rt->group, &rt->after, &rt->before, &rt->update_every, &rt->options, &rt->dimensions, &rt->foreachdim); diff --git a/health/health_json.c b/health/health_json.c index 74a384a3..4df44611 100644 --- a/health/health_json.c +++ b/health/health_json.c @@ -23,6 +23,9 @@ void health_alarm_entry2json_nolock(BUFFER *wb, ALARM_ENTRY *ae, RRDHOST *host) "\t\t\"name\": \"%s\",\n" "\t\t\"chart\": \"%s\",\n" "\t\t\"family\": \"%s\",\n" + "\t\t\"class\": \"%s\",\n" + "\t\t\"component\": \"%s\",\n" + "\t\t\"type\": \"%s\",\n" "\t\t\"processed\": %s,\n" "\t\t\"updated\": %s,\n" "\t\t\"exec_run\": %lu,\n" @@ -52,6 +55,9 @@ void health_alarm_entry2json_nolock(BUFFER *wb, ALARM_ENTRY *ae, RRDHOST *host) , ae->name , ae->chart , ae->family + , ae->classification?ae->classification:"Unknown" + , ae->component?ae->component:"Unknown" + , ae->type?ae->type:"Unknown" , (ae->flags & HEALTH_ENTRY_FLAG_PROCESSED)?"true":"false" , (ae->flags & HEALTH_ENTRY_FLAG_UPDATED)?"true":"false" , (unsigned long)ae->exec_run_timestamp @@ -76,7 +82,22 @@ void health_alarm_entry2json_nolock(BUFFER *wb, ALARM_ENTRY *ae, RRDHOST *host) , (ae->flags & HEALTH_ENTRY_FLAG_SILENCED)?"true":"false" ); - health_string2json(wb, "\t\t", "info", ae->info?ae->info:"", ",\n"); + char *replaced_info = NULL; + if (likely(ae->info)) { + char *m = NULL; + replaced_info = strdupz(ae->info); + size_t pos = 0; + while ((m = strstr(replaced_info + pos, "$family"))) { + char *buf = NULL; + pos = m - replaced_info; + buf = find_and_replace(replaced_info, "$family", ae->family ? ae->family : "", m); + freez(replaced_info); + replaced_info = strdupz(buf); + freez(buf); + } + } + + health_string2json(wb, "\t\t", "info", replaced_info?replaced_info:"", ",\n"); if(unlikely(ae->flags & HEALTH_ENTRY_FLAG_NO_CLEAR_NOTIFICATION)) { buffer_strcat(wb, "\t\t\"no_clear_notification\": true,\n"); @@ -91,6 +112,8 @@ void health_alarm_entry2json_nolock(BUFFER *wb, ALARM_ENTRY *ae, RRDHOST *host) buffer_strcat(wb, "\n"); buffer_strcat(wb, "\t}"); + + freez(replaced_info); } void health_alarm_log2json(RRDHOST *host, BUFFER *wb, uint32_t after, char *chart) { @@ -140,12 +163,30 @@ static inline void health_rrdcalc2json_nolock(RRDHOST *host, BUFFER *wb, RRDCALC char value_string[100 + 1]; format_value_and_unit(value_string, 100, rc->value, rc->units, -1); + char *replaced_info = NULL; + if (likely(rc->info)) { + char *m; + replaced_info = strdupz(rc->info); + size_t pos = 0; + while ((m = strstr(replaced_info + pos, "$family"))) { + char *buf = NULL; + pos = m - replaced_info; + buf = find_and_replace(replaced_info, "$family", (rc->rrdset && rc->rrdset->family) ? rc->rrdset->family : "", m); + freez(replaced_info); + replaced_info = strdupz(buf); + freez(buf); + } + } + buffer_sprintf(wb, "\t\t\"%s.%s\": {\n" "\t\t\t\"id\": %lu,\n" "\t\t\t\"name\": \"%s\",\n" "\t\t\t\"chart\": \"%s\",\n" "\t\t\t\"family\": \"%s\",\n" + "\t\t\t\"class\": \"%s\",\n" + "\t\t\t\"component\": \"%s\",\n" + "\t\t\t\"type\": \"%s\",\n" "\t\t\t\"active\": %s,\n" "\t\t\t\"disabled\": %s,\n" "\t\t\t\"silenced\": %s,\n" @@ -174,6 +215,9 @@ static inline void health_rrdcalc2json_nolock(RRDHOST *host, BUFFER *wb, RRDCALC , rc->name , rc->chart , (rc->rrdset && rc->rrdset->family)?rc->rrdset->family:"" + , rc->classification?rc->classification:"Unknown" + , rc->component?rc->component:"Unknown" + , rc->type?rc->type:"Unknown" , (rc->rrdset)?"true":"false" , (rc->rrdcalc_flags & RRDCALC_FLAG_DISABLED)?"true":"false" , (rc->rrdcalc_flags & RRDCALC_FLAG_SILENCED)?"true":"false" @@ -181,7 +225,7 @@ static inline void health_rrdcalc2json_nolock(RRDHOST *host, BUFFER *wb, RRDCALC , rc->recipient?rc->recipient:host->health_default_recipient , rc->source , rc->units?rc->units:"" - , rc->info?rc->info:"" + , replaced_info?replaced_info:"" , rrdcalc_status2string(rc->status) , (unsigned long)rc->last_status_change , (unsigned long)rc->last_updated @@ -252,6 +296,8 @@ static inline void health_rrdcalc2json_nolock(RRDHOST *host, BUFFER *wb, RRDCALC buffer_strcat(wb, "\n"); buffer_strcat(wb, "\t\t}"); + + freez(replaced_info); } //void health_rrdcalctemplate2json_nolock(BUFFER *wb, RRDCALCTEMPLATE *rt) { diff --git a/health/health_log.c b/health/health_log.c index 3205f592..de0a0883 100644 --- a/health/health_log.c +++ b/health/health_log.c @@ -111,6 +111,7 @@ inline void health_alarm_log_save(RRDHOST *host, ALARM_ENTRY *ae) { "\t%d\t%d\t%d\t%d" "\t" CALCULATED_NUMBER_FORMAT_AUTO "\t" CALCULATED_NUMBER_FORMAT_AUTO "\t%016lx" + "\t%s\t%s\t%s" "\n" , (ae->flags & HEALTH_ENTRY_FLAG_SAVED)?'U':'A' , host->hostname @@ -145,6 +146,9 @@ inline void health_alarm_log_save(RRDHOST *host, ALARM_ENTRY *ae) { , ae->new_value , ae->old_value , (uint64_t)ae->last_repeat + , (ae->classification)?ae->classification:"Unknown" + , (ae->component)?ae->component:"Unknown" + , (ae->type)?ae->type:"Unknown" ) < 0)) error("HEALTH [%s]: failed to save alarm log entry to '%s'. Health data may be lost in case of abnormal restart.", host->hostname, host->health_log_filename); else { @@ -191,7 +195,7 @@ static inline ssize_t health_alarm_log_read(RRDHOST *host, FILE *fp, const char host->health_log_entries_written++; line++; - int max_entries = 30, entries = 0; + int max_entries = 33, entries = 0; char *pointers[max_entries]; pointers[entries++] = s++; @@ -301,7 +305,7 @@ static inline ssize_t health_alarm_log_read(RRDHOST *host, FILE *fp, const char continue; } - // check for a possible host missmatch + // check for a possible host mismatch //if(strcmp(pointers[1], host->hostname)) // error("HEALTH [%s]: line %zu of file '%s' provides an alarm for host '%s' but this is named '%s'.", host->hostname, line, filename, pointers[1], host->hostname); @@ -364,6 +368,20 @@ static inline ssize_t health_alarm_log_read(RRDHOST *host, FILE *fp, const char ae->last_repeat = last_repeat; + if (likely(entries > 28)) { + freez(ae->classification); + ae->classification = strdupz(pointers[28]); + if(!*ae->classification) { freez(ae->classification); ae->classification = NULL; } + + freez(ae->component); + ae->component = strdupz(pointers[29]); + if(!*ae->component) { freez(ae->component); ae->component = NULL; } + + freez(ae->type); + ae->type = strdupz(pointers[30]); + if(!*ae->type) { freez(ae->type); ae->type = NULL; } + } + char value_string[100 + 1]; freez(ae->old_value_string); freez(ae->new_value_string); @@ -442,6 +460,9 @@ inline ALARM_ENTRY* health_create_alarm_entry( const char *name, const char *chart, const char *family, + const char *class, + const char *component, + const char *type, const char *exec, const char *recipient, time_t duration, @@ -469,11 +490,19 @@ inline ALARM_ENTRY* health_create_alarm_entry( if(family) ae->family = strdupz(family); + if (class) + ae->classification = strdupz(class); + + if (component) + ae->component = strdupz(component); + + if (type) + ae->type = strdupz(type); + if(exec) ae->exec = strdupz(exec); if(recipient) ae->recipient = strdupz(recipient); if(source) ae->source = strdupz(source); if(units) ae->units = strdupz(units); - if(info) ae->info = strdupz(info); ae->unique_id = host->health_log.next_log_id++; ae->alarm_id = alarm_id; @@ -486,6 +515,24 @@ inline ALARM_ENTRY* health_create_alarm_entry( ae->old_value_string = strdupz(format_value_and_unit(value_string, 100, ae->old_value, ae->units, -1)); ae->new_value_string = strdupz(format_value_and_unit(value_string, 100, ae->new_value, ae->units, -1)); + char *replaced_info = NULL; + if (likely(info)) { + char *m; + replaced_info = strdupz(info); + size_t pos = 0; + while ((m = strstr(replaced_info + pos, "$family"))) { + char *buf = NULL; + pos = m - replaced_info; + buf = find_and_replace(replaced_info, "$family", (ae->family) ? ae->family : "", m); + freez(replaced_info); + replaced_info = strdupz(buf); + freez(buf); + } + } + + if(replaced_info) ae->info = strdupz(replaced_info); + freez(replaced_info); + ae->old_status = old_status; ae->new_status = new_status; ae->duration = duration; @@ -548,6 +595,9 @@ inline void health_alarm_log_free_one_nochecks_nounlink(ALARM_ENTRY *ae) { freez(ae->name); freez(ae->chart); freez(ae->family); + freez(ae->classification); + freez(ae->component); + freez(ae->type); freez(ae->exec); freez(ae->recipient); freez(ae->source); diff --git a/health/notifications/Makefile.am b/health/notifications/Makefile.am index e6b42138..46a6e472 100644 --- a/health/notifications/Makefile.am +++ b/health/notifications/Makefile.am @@ -35,6 +35,7 @@ include hangouts/Makefile.inc include irc/Makefile.inc include kavenegar/Makefile.inc include messagebird/Makefile.inc +include msteams/Makefile.inc include opsgenie/Makefile.inc include pagerduty/Makefile.inc include pushbullet/Makefile.inc diff --git a/health/notifications/alarm-notify.sh.in b/health/notifications/alarm-notify.sh.in index bf6c0281..9a3a80ad 100755 --- a/health/notifications/alarm-notify.sh.in +++ b/health/notifications/alarm-notify.sh.in @@ -165,7 +165,7 @@ pd fleep syslog custom -msteam +msteams kavenegar prowl irc @@ -300,8 +300,11 @@ done # slack configs SLACK_WEBHOOK_URL= -# Microsoft Team configs -MSTEAM_WEBHOOK_URL= +# Microsoft Teams configs +MSTEAMS_WEBHOOK_URL= + +# Legacy Microsoft Teams configs for backwards compatability: +declare -A role_recipients_msteam # rocketchat configs ROCKETCHAT_WEBHOOK_URL= @@ -431,6 +434,38 @@ if [ "${use_fqdn}" = "YES" ] && [ "${host}" = "$(hostname -s 2>/dev/null)" ]; th host="$(hostname -f 2>/dev/null)" fi + +# ----------------------------------------------------------------------------- +# migrate old Microsoft Teams configuration keys after loading configuration + +msteams_migration() { + SEND_MSTEAMS=${SEND_MSTEAM:-$SEND_MSTEAMS} + unset -v SEND_MSTEAM + DEFAULT_RECIPIENT_MSTEAMS=${DEFAULT_RECIPIENT_MSTEAM:-$DEFAULT_RECIPIENT_MSTEAMS} + MSTEAMS_WEBHOOK_URL=${MSTEAM_WEBHOOK_URL:-$MSTEAMS_WEBHOOK_URL} + MSTEAMS_ICON_DEFAULT=${MSTEAM_ICON_DEFAULT:-$MSTEAMS_ICON_DEFAULT} + MSTEAMS_ICON_CLEAR=${MSTEAM_ICON_CLEAR:-$MSTEAMS_ICON_CLEAR} + MSTEAMS_ICON_WARNING=${MSTEAM_ICON_WARNING:-$MSTEAMS_ICON_WARNING} + MSTEAMS_ICON_CRITICAL=${MSTEAM_ICON_CRITICAL:-$MSTEAMS_ICON_CRITICAL} + MSTEAMS_COLOR_DEFAULT=${MSTEAM_COLOR_DEFAULT:-$MSTEAMS_COLOR_DEFAULT} + MSTEAMS_COLOR_CLEAR=${MSTEAM_COLOR_CLEAR:-$MSTEAMS_COLOR_CLEAR} + MSTEAMS_COLOR_WARNING=${MSTEAM_COLOR_WARNING:-$MSTEAMS_COLOR_WARNING} + MSTEAMS_COLOR_CRITICAL=${MSTEAM_COLOR_CRITICAL:-$MSTEAMS_COLOR_CRITICAL} + + # migrate role specific recipients: + for key in "${!role_recipients_msteam[@]}"; do + # Disable check, if role_recipients_msteams is ever used: + # The role_recipients_$method are created and used programmatically + # by iterating over $methods. shellcheck therefore doesn't realize + # that role_recipients_msteams is actually used in the block + # "find the recipients' addresses per method". + # shellcheck disable=SC2034 + role_recipients_msteams["$key"]="${role_recipients_msteam["$key"]}" + done +} + +msteams_migration + # ----------------------------------------------------------------------------- # filter a recipient based on alarm event severity @@ -553,8 +588,8 @@ filter_recipient_by_criticality() { # check stackpulse [ -z "${STACKPULSE_WEBHOOK}" ] && SEND_STACKPULSE="NO" -# check msteam -[ -z "${MSTEAM_WEBHOOK_URL}" ] && SEND_MSTEAM="NO" +# check msteams +[ -z "${MSTEAMS_WEBHOOK_URL}" ] && SEND_MSTEAMS="NO" # check pd [ -z "${DEFAULT_RECIPIENT_PD}" ] && SEND_PD="NO" @@ -562,6 +597,9 @@ filter_recipient_by_criticality() { # check prowl [ -z "${DEFAULT_RECIPIENT_PROWL}" ] && SEND_PROWL="NO" +# check custom +[ -z "${DEFAULT_RECIPIENT_CUSTOM}" ] && SEND_CUSTOM="NO" + if [ "${SEND_PUSHOVER}" = "YES" ] || [ "${SEND_SLACK}" = "YES" ] || [ "${SEND_ROCKETCHAT}" = "YES" ] || @@ -581,7 +619,7 @@ if [ "${SEND_PUSHOVER}" = "YES" ] || [ "${SEND_HANGOUTS}" = "YES" ] || [ "${SEND_MATRIX}" = "YES" ] || [ "${SEND_CUSTOM}" = "YES" ] || - [ "${SEND_MSTEAM}" = "YES" ] || + [ "${SEND_MSTEAMS}" = "YES" ] || [ "${SEND_DYNATRACE}" = "YES" ] || [ "${SEND_STACKPULSE}" = "YES" ] || [ "${SEND_OPSGENIE}" = "YES" ]; then @@ -595,7 +633,7 @@ if [ "${SEND_PUSHOVER}" = "YES" ] || SEND_PUSHBULLET="NO" SEND_TELEGRAM="NO" SEND_SLACK="NO" - SEND_MSTEAM="NO" + SEND_MSTEAMS="NO" SEND_ROCKETCHAT="NO" SEND_ALERTA="NO" SEND_PD="NO" @@ -750,7 +788,7 @@ for method in "${SEND_EMAIL}" \ "${SEND_AWSSNS}" \ "${SEND_SYSLOG}" \ "${SEND_SMS}" \ - "${SEND_MSTEAM}" \ + "${SEND_MSTEAMS}" \ "${SEND_DYNATRACE}" \ "${SEND_STACKPULSE}" \ "${SEND_OPSGENIE}" ; do @@ -1288,22 +1326,22 @@ send_telegram() { # ----------------------------------------------------------------------------- # Microsoft Team sender -send_msteam() { +send_msteams() { local webhook="${1}" channels="${2}" httpcode sent=0 channel color payload - [ "${SEND_MSTEAM}" != "YES" ] && return 1 + [ "${SEND_MSTEAMS}" != "YES" ] && return 1 case "${status}" in - WARNING) icon="${MSTEAM_ICON_WARNING}" && color="${MSTEAM_COLOR_WARNING}" ;; - CRITICAL) icon="${MSTEAM_ICON_CRITICAL}" && color="${MSTEAM_COLOR_CRITICAL}" ;; - CLEAR) icon="${MSTEAM_ICON_CLEAR}" && color="${MSTEAM_COLOR_CLEAR}" ;; - *) icon="${MSTEAM_ICON_DEFAULT}" && color="${MSTEAM_COLOR_DEFAULT}" ;; + WARNING) icon="${MSTEAMS_ICON_WARNING}" && color="${MSTEAMS_COLOR_WARNING}" ;; + CRITICAL) icon="${MSTEAMS_ICON_CRITICAL}" && color="${MSTEAMS_COLOR_CRITICAL}" ;; + CLEAR) icon="${MSTEAMS_ICON_CLEAR}" && color="${MSTEAMS_COLOR_CLEAR}" ;; + *) icon="${MSTEAMS_ICON_DEFAULT}" && color="${MSTEAMS_COLOR_DEFAULT}" ;; esac for channel in ${channels}; do ## More details are available here regarding the payload syntax options : https://docs.microsoft.com/en-us/outlook/actionable-messages/message-card-reference - ## Online designer : https://acdesignerbeta.azurewebsites.net/ + ## Online designer : https://adaptivecards.io/designer/ payload="$( cat <<EOF { @@ -2346,13 +2384,13 @@ send_hangouts "${to_hangouts}" SENT_HANGOUTS=$? # ----------------------------------------------------------------------------- -# send the Microsoft notification +# send the Microsoft Teams notification -# Microsoft team aggregates posts from the same username +# Microsoft teams aggregates posts from the same username # so we use "${host} ${status}" as the bot username, to make them diff -send_msteam "${MSTEAM_WEBHOOK_URL}" "${to_msteam}" -SENT_MSTEAM=$? +send_msteams "${MSTEAMS_WEBHOOK_URL}" "${to_msteams}" +SENT_MSTEAMS=$? # ----------------------------------------------------------------------------- # send the rocketchat notification @@ -2769,7 +2807,7 @@ for state in "${SENT_EMAIL}" \ "${SENT_MATRIX}" \ "${SENT_SYSLOG}" \ "${SENT_SMS}" \ - "${SENT_MSTEAM}" \ + "${SENT_MSTEAMS}" \ "${SENT_DYNATRACE}" \ "${SENT_STACKPULSE}" \ "${SENT_OPSGENIE}"; do diff --git a/health/notifications/health_alarm_notify.conf b/health/notifications/health_alarm_notify.conf index ae23180b..e851a530 100755 --- a/health/notifications/health_alarm_notify.conf +++ b/health/notifications/health_alarm_notify.conf @@ -19,7 +19,7 @@ # - notifications to Amazon SNS topics (aws.amazon.com) # - messages to your irc channel on your selected network # - messages to a local or remote syslog daemon -# - message to Microsoft Team (through webhook) +# - message to Microsoft Teams (through webhook) # - message to Rocket.Chat (through webhook) # - message to Google Hangouts Chat (through webhook) # @@ -464,38 +464,42 @@ SLACK_WEBHOOK_URL="" DEFAULT_RECIPIENT_SLACK="" #------------------------------------------------------------------------------ -# Microsoft Team (office.com) global notification options -# More details are available here regarding the payload syntax options : https://docs.microsoft.com/en-us/outlook/actionable-messages/message-card-reference -# Online designer : https://acdesignerbeta.azurewebsites.net/ +# Microsoft Teams (office.com) global notification options +# More details are available here regarding the payload syntax options: +# https://docs.microsoft.com/en-us/outlook/actionable-messages/message-card-reference +# Online designer : https://adaptivecards.io/designer/ # multiple recipients can be given like this: # "CHANNEL1 CHANNEL2 ..." -# enable/disable sending team notifications -SEND_MSTEAM="YES" +# enable/disable sending teams notifications +SEND_MSTEAMS="YES" + +# In Microsoft Teams the channel name is encoded in the URI after +# .../IncomingWebhook/... +# You have to replace the encoded channel name by the placeholder `CHANNEL` +# in `MSTEAMS_WEBHOOK_URL`. The placeholder `CHANNEL` will be replaced by the +# actual encoded channel name before sending the notification. +MSTEAMS_WEBHOOK_URL="" # if a role's recipients are not configured, a notification will be send to -# this slack channel (empty = do not send a notification for unconfigured +# this Teams channel (empty = do not send a notification for unconfigured # roles): -# For team the channel name is encoded in the URI after ....IncomingWebhook/___/..... -# This value will be replaced in the webhook value to publish to several channels in a same Team. -# In order to get it working properly, you have to replace the value between [] ....IncomingWebhook/[___]/..... by "CHANNEL" string. -DEFAULT_RECIPIENT_MSTEAM="" -# Based on the way MS Teams is working, put the different channels here like : "CHANNEL1 CHANNEL2 ..." +# Put the different encoded channel names here like : "CHANNEL1 CHANNEL2 ..." # AT LEAST ONE CHANNEL IS MANDATORY -MSTEAM_WEBHOOK_URL="" +DEFAULT_RECIPIENT_MSTEAMS="" -# Define the default color scheme for alert to MS Team - icon and color +# Define the default color scheme for alert to MS Teams - icon and color # Icons - go to https://emojipedia.org/bomb/ -MSTEAM_ICON_DEFAULT="♡" -MSTEAM_ICON_CLEAR="💚" -MSTEAM_ICON_WARNING="⚠️" -MSTEAM_ICON_CRITICAL="🔥" +MSTEAMS_ICON_DEFAULT="♡" +MSTEAMS_ICON_CLEAR="💚" +MSTEAMS_ICON_WARNING="⚠️" +MSTEAMS_ICON_CRITICAL="🔥" # Colors -MSTEAM_COLOR_DEFAULT="0076D7" -MSTEAM_COLOR_CLEAR="65A677" -MSTEAM_COLOR_WARNING="FFA500" -MSTEAM_COLOR_CRITICAL="D93F3C" +MSTEAMS_COLOR_DEFAULT="0076D7" +MSTEAMS_COLOR_CLEAR="65A677" +MSTEAMS_COLOR_WARNING="FFA500" +MSTEAMS_COLOR_CRITICAL="D93F3C" #------------------------------------------------------------------------------ @@ -955,7 +959,7 @@ role_recipients_awssns[sysadmin]="${DEFAULT_RECIPIENT_AWSSNS}" role_recipients_custom[sysadmin]="${DEFAULT_RECIPIENT_CUSTOM}" -role_recipients_msteam[sysadmin]="${DEFAULT_RECIPIENT_MSTEAM}" +role_recipients_msteams[sysadmin]="${DEFAULT_RECIPIENT_MSTEAMS}" role_recipients_rocketchat[sysadmin]="${DEFAULT_RECIPIENT_ROCKETCHAT}" @@ -1010,7 +1014,7 @@ role_recipients_awssns[domainadmin]="${DEFAULT_RECIPIENT_AWSSNS}" role_recipients_custom[domainadmin]="${DEFAULT_RECIPIENT_CUSTOM}" -role_recipients_msteam[domainadmin]="${DEFAULT_RECIPIENT_MSTEAM}" +role_recipients_msteams[domainadmin]="${DEFAULT_RECIPIENT_MSTEAMS}" role_recipients_rocketchat[domainadmin]="${DEFAULT_RECIPIENT_ROCKETCHAT}" @@ -1068,7 +1072,7 @@ role_recipients_awssns[dba]="${DEFAULT_RECIPIENT_AWSSNS}" role_recipients_custom[dba]="${DEFAULT_RECIPIENT_CUSTOM}" -role_recipients_msteam[dba]="${DEFAULT_RECIPIENT_MSTEAM}" +role_recipients_msteams[dba]="${DEFAULT_RECIPIENT_MSTEAMS}" role_recipients_rocketchat[dba]="${DEFAULT_RECIPIENT_ROCKETCHAT}" @@ -1126,7 +1130,7 @@ role_recipients_awssns[webmaster]="${DEFAULT_RECIPIENT_AWSSNS}" role_recipients_custom[webmaster]="${DEFAULT_RECIPIENT_CUSTOM}" -role_recipients_msteam[webmaster]="${DEFAULT_RECIPIENT_MSTEAM}" +role_recipients_msteams[webmaster]="${DEFAULT_RECIPIENT_MSTEAMS}" role_recipients_rocketchat[webmaster]="${DEFAULT_RECIPIENT_ROCKETCHAT}" @@ -1184,7 +1188,7 @@ role_recipients_awssns[proxyadmin]="${DEFAULT_RECIPIENT_AWSSNS}" role_recipients_custom[proxyadmin]="${DEFAULT_RECIPIENT_CUSTOM}" -role_recipients_msteam[proxyadmin]="${DEFAULT_RECIPIENT_MSTEAM}" +role_recipients_msteams[proxyadmin]="${DEFAULT_RECIPIENT_MSTEAMS}" role_recipients_rocketchat[proxyadmin]="${DEFAULT_RECIPIENT_ROCKETCHAT}" @@ -1240,7 +1244,7 @@ role_recipients_awssns[sitemgr]="${DEFAULT_RECIPIENT_AWSSNS}" role_recipients_custom[sitemgr]="${DEFAULT_RECIPIENT_CUSTOM}" -role_recipients_msteam[sitemgr]="${DEFAULT_RECIPIENT_MSTEAM}" +role_recipients_msteams[sitemgr]="${DEFAULT_RECIPIENT_MSTEAMS}" role_recipients_rocketchat[sitemgr]="${DEFAULT_RECIPIENT_ROCKETCHAT}" diff --git a/health/notifications/msteams/Makefile.inc b/health/notifications/msteams/Makefile.inc new file mode 100644 index 00000000..f4c6995b --- /dev/null +++ b/health/notifications/msteams/Makefile.inc @@ -0,0 +1,12 @@ +# SPDX-License-Identifier: GPL-3.0-or-later + +# THIS IS NOT A COMPLETE Makefile +# IT IS INCLUDED BY ITS PARENT'S Makefile.am +# IT IS REQUIRED TO REFERENCE ALL FILES RELATIVE TO THE PARENT + +# install these files +dist_noinst_DATA += \ + msteams/README.md \ + msteams/Makefile.inc \ + $(NULL) + diff --git a/health/notifications/msteams/README.md b/health/notifications/msteams/README.md new file mode 100644 index 00000000..3ff5de68 --- /dev/null +++ b/health/notifications/msteams/README.md @@ -0,0 +1,45 @@ +<!-- +--- +title: "Microsoft Teams" +custom_edit_url: https://github.com/netdata/netdata/edit/master/health/notifications/msteams/README.md +--- +--> + +# Microsoft Teams + +This is what you will get: +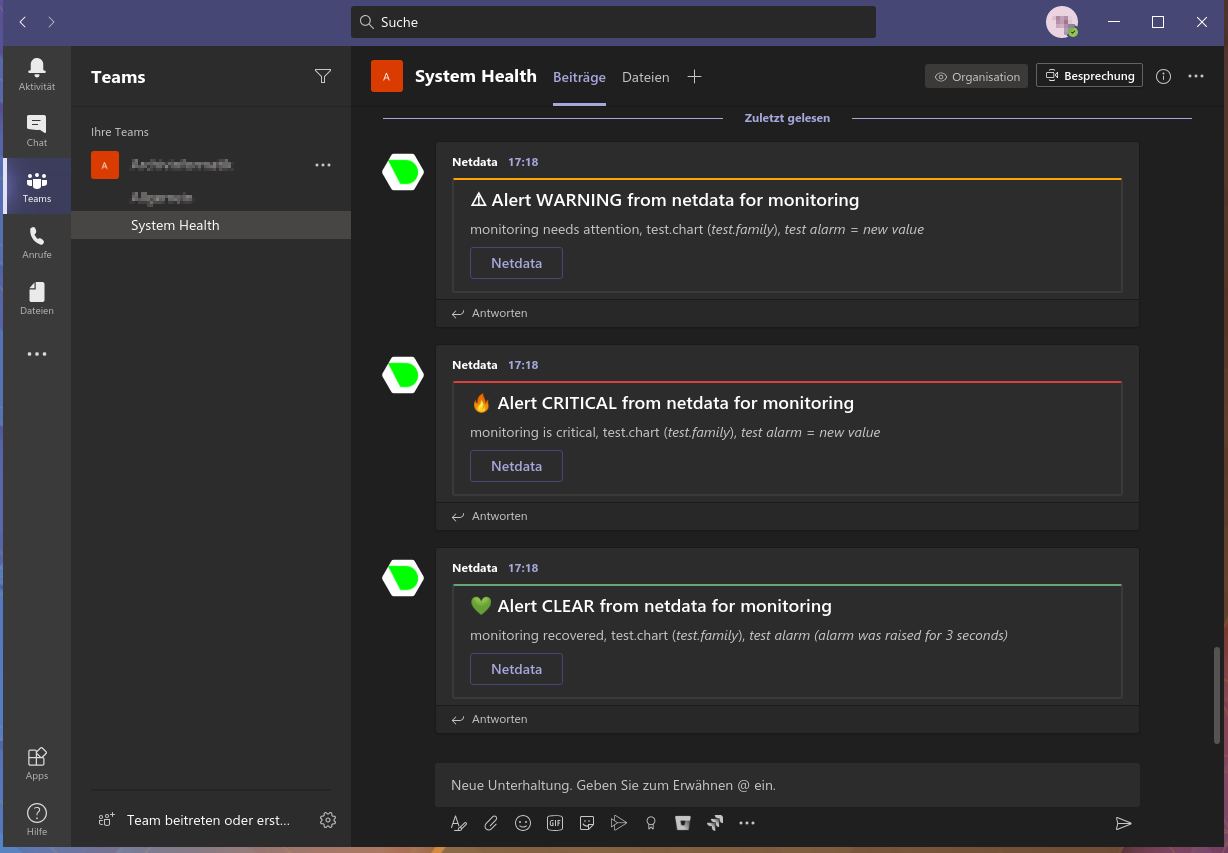 + +You need: + +1. The **incoming webhook URL** as given by Microsoft Teams. You can use the same on all your Netdata servers (or you can have multiple if you like - your decision). +2. One or more channels to post the messages to. + +In Microsoft Teams the channel name is encoded in the URI after `/IncomingWebhook/` (for clarity the marked with `[]` in the following example): `https://outlook.office.com/webhook/XXXXXXXX-XXXX-XXXX-XXXX-XXXXXXXXXXXX@XXXXXXXX-XXXX-XXXX-XXXX-XXXXXXXXXXXX/IncomingWebhook/[XXXXXXXXXXXXXXXXXXXXXXXXXXXXXXXX]/XXXXXXXX-XXXX-XXXX-XXXX-XXXXXXXXXXXX` + +You have to replace the encoded channel name by the placeholder `CHANNEL` in `MSTEAMS_WEBHOOK_URL`. The placeholder `CHANNEL` will be replaced by the actual encoded channel name before sending the notification. This makes it possible to publish to several channels in the same team. + +The encoded channel name must then be added to `DEFAULT_RECIPIENTS_MSTEAMS` or to one of the specific variables `role_recipients_msteams[]`. **At least one channel is mandatory for `DEFAULT_RECIPIENTS_MSTEAMS`.** + +Set the webhook and the recipients in `/etc/netdata/health_alarm_notify.conf` (to edit it on your system run `/etc/netdata/edit-config health_alarm_notify.conf`), like this: + +``` +SEND_MSTEAMS="YES" + +MSTEAMS_WEBHOOK_URL="https://outlook.office.com/webhook/XXXXXXXX-XXXX-XXXX-XXXX-XXXXXXXXXXXX@XXXXXXXX-XXXX-XXXX-XXXX-XXXXXXXXXXXX/IncomingWebhook/CHANNEL/XXXXXXXX-XXXX-XXXX-XXXX-XXXXXXXXXXXX" + +DEFAULT_RECIPIENT_MSTEAMS="XXXXXXXXXXXXXXXXXXXXXXXXXXXXXXXX" +``` + +You can define multiple recipients by listing the encoded channel names like this: `XXXXXXXXXXXXXXXXXXXXXXXXXXXXXXXX YYYYYYYYYYYYYYYYYYYYYYYYYYYYYYYY`. +This example will send the alarm to the two channels specified by their encoded channel names. + +You can give different recipients per **role** using these (in the same file): + +``` +role_recipients_msteams[sysadmin]="XXXXXXXXXXXXXXXXXXXXXXXXXXXXXXXX" +role_recipients_msteams[dba]="YYYYYYYYYYYYYYYYYYYYYYYYYYYYYYYY" +role_recipients_msteams[webmaster]="ZZZZZZZZZZZZZZZZZZZZZZZZZZZZZZZZ" +``` + +[](<>) |