
diff options
| author | Daniel Baumann <daniel.baumann@progress-linux.org> | 2019-09-13 05:05:25 +0000 |
|---|---|---|
| committer | Daniel Baumann <daniel.baumann@progress-linux.org> | 2019-09-13 05:05:25 +0000 |
| commit | d72015c7962af72903326a01fb114f8f2d37eebc (patch) | |
| tree | 5bb5ae6928f3f2a92f478f69c2f5c9aa9333fbf8 /web/gui | |
| parent | Releasing debian version 1.17.0-3. (diff) | |
| download | netdata-d72015c7962af72903326a01fb114f8f2d37eebc.tar.xz netdata-d72015c7962af72903326a01fb114f8f2d37eebc.zip | |
Merging upstream version 1.17.1.
Signed-off-by: Daniel Baumann <daniel.baumann@progress-linux.org>
Diffstat (limited to 'web/gui')
30 files changed, 2013 insertions, 1159 deletions
diff --git a/web/gui/Makefile.am b/web/gui/Makefile.am index ef8aa05fd..84ef6a92b 100644 --- a/web/gui/Makefile.am +++ b/web/gui/Makefile.am @@ -67,6 +67,7 @@ dist_web_DATA = \ refresh-badges.js \ sitemap.xml \ tv.html \ + dash-example.html \ version.txt \ $(NULL) diff --git a/web/gui/Makefile.in b/web/gui/Makefile.in deleted file mode 100644 index 265440bdc..000000000 --- a/web/gui/Makefile.in +++ /dev/null @@ -1,914 +0,0 @@ -# Makefile.in generated by automake 1.15.1 from Makefile.am. -# @configure_input@ - -# Copyright (C) 1994-2017 Free Software Foundation, Inc. - -# This Makefile.in is free software; the Free Software Foundation -# gives unlimited permission to copy and/or distribute it, -# with or without modifications, as long as this notice is preserved. - -# This program is distributed in the hope that it will be useful, -# but WITHOUT ANY WARRANTY, to the extent permitted by law; without -# even the implied warranty of MERCHANTABILITY or FITNESS FOR A -# PARTICULAR PURPOSE. - -@SET_MAKE@ - -VPATH = @srcdir@ -am__is_gnu_make = { \ - if test -z '$(MAKELEVEL)'; then \ - false; \ - elif test -n '$(MAKE_HOST)'; then \ - true; \ - elif test -n '$(MAKE_VERSION)' && test -n '$(CURDIR)'; then \ - true; \ - else \ - false; \ - fi; \ -} -am__make_running_with_option = \ - case $${target_option-} in \ - ?) ;; \ - *) echo "am__make_running_with_option: internal error: invalid" \ - "target option '$${target_option-}' specified" >&2; \ - exit 1;; \ - esac; \ - has_opt=no; \ - sane_makeflags=$$MAKEFLAGS; \ - if $(am__is_gnu_make); then \ - sane_makeflags=$$MFLAGS; \ - else \ - case $$MAKEFLAGS in \ - *\\[\ \ ]*) \ - bs=\\; \ - sane_makeflags=`printf '%s\n' "$$MAKEFLAGS" \ - | sed "s/$$bs$$bs[$$bs $$bs ]*//g"`;; \ - esac; \ - fi; \ - skip_next=no; \ - strip_trailopt () \ - { \ - flg=`printf '%s\n' "$$flg" | sed "s/$$1.*$$//"`; \ - }; \ - for flg in $$sane_makeflags; do \ - test $$skip_next = yes && { skip_next=no; continue; }; \ - case $$flg in \ - *=*|--*) continue;; \ - -*I) strip_trailopt 'I'; skip_next=yes;; \ - -*I?*) strip_trailopt 'I';; \ - -*O) strip_trailopt 'O'; skip_next=yes;; \ - -*O?*) strip_trailopt 'O';; \ - -*l) strip_trailopt 'l'; skip_next=yes;; \ - -*l?*) strip_trailopt 'l';; \ - -[dEDm]) skip_next=yes;; \ - -[JT]) skip_next=yes;; \ - esac; \ - case $$flg in \ - *$$target_option*) has_opt=yes; break;; \ - esac; \ - done; \ - test $$has_opt = yes -am__make_dryrun = (target_option=n; $(am__make_running_with_option)) -am__make_keepgoing = (target_option=k; $(am__make_running_with_option)) -pkgdatadir = $(datadir)/@PACKAGE@ -pkgincludedir = $(includedir)/@PACKAGE@ -pkglibdir = $(libdir)/@PACKAGE@ -pkglibexecdir = $(libexecdir)/@PACKAGE@ -am__cd = CDPATH="$${ZSH_VERSION+.}$(PATH_SEPARATOR)" && cd -install_sh_DATA = $(install_sh) -c -m 644 -install_sh_PROGRAM = $(install_sh) -c -install_sh_SCRIPT = $(install_sh) -c -INSTALL_HEADER = $(INSTALL_DATA) -transform = $(program_transform_name) -NORMAL_INSTALL = : -PRE_INSTALL = : -POST_INSTALL = : -NORMAL_UNINSTALL = : -PRE_UNINSTALL = : -POST_UNINSTALL = : -build_triplet = @build@ -host_triplet = @host@ -subdir = web/gui -ACLOCAL_M4 = $(top_srcdir)/aclocal.m4 -am__aclocal_m4_deps = $(top_srcdir)/build/m4/ax_c___atomic.m4 \ - $(top_srcdir)/build/m4/ax_c__generic.m4 \ - $(top_srcdir)/build/m4/ax_c_lto.m4 \ - $(top_srcdir)/build/m4/ax_c_mallinfo.m4 \ - $(top_srcdir)/build/m4/ax_c_mallopt.m4 \ - $(top_srcdir)/build/m4/ax_check_compile_flag.m4 \ - $(top_srcdir)/build/m4/ax_gcc_func_attribute.m4 \ - $(top_srcdir)/build/m4/ax_pthread.m4 \ - $(top_srcdir)/build/m4/jemalloc.m4 \ - $(top_srcdir)/build/m4/tcmalloc.m4 $(top_srcdir)/configure.ac -am__configure_deps = $(am__aclocal_m4_deps) $(CONFIGURE_DEPENDENCIES) \ - $(ACLOCAL_M4) -DIST_COMMON = $(srcdir)/Makefile.am $(dist_noinst_DATA) \ - $(dist_web_DATA) $(dist_webcss_DATA) $(dist_webdnt_DATA) \ - $(dist_webfonts_DATA) $(dist_webimages_DATA) \ - $(dist_weblib_DATA) $(dist_webstatic_DATA) \ - $(dist_webwellknown_DATA) $(am__DIST_COMMON) -mkinstalldirs = $(install_sh) -d -CONFIG_HEADER = $(top_builddir)/config.h -CONFIG_CLEAN_FILES = -CONFIG_CLEAN_VPATH_FILES = -AM_V_P = $(am__v_P_@AM_V@) -am__v_P_ = $(am__v_P_@AM_DEFAULT_V@) -am__v_P_0 = false -am__v_P_1 = : -AM_V_GEN = $(am__v_GEN_@AM_V@) -am__v_GEN_ = $(am__v_GEN_@AM_DEFAULT_V@) -am__v_GEN_0 = @echo " GEN " $@; -am__v_GEN_1 = -AM_V_at = $(am__v_at_@AM_V@) -am__v_at_ = $(am__v_at_@AM_DEFAULT_V@) -am__v_at_0 = @ -am__v_at_1 = -SOURCES = -DIST_SOURCES = -am__can_run_installinfo = \ - case $$AM_UPDATE_INFO_DIR in \ - n|no|NO) false;; \ - *) (install-info --version) >/dev/null 2>&1;; \ - esac -am__vpath_adj_setup = srcdirstrip=`echo "$(srcdir)" | sed 's|.|.|g'`; -am__vpath_adj = case $$p in \ - $(srcdir)/*) f=`echo "$$p" | sed "s|^$$srcdirstrip/||"`;; \ - *) f=$$p;; \ - esac; -am__strip_dir = f=`echo $$p | sed -e 's|^.*/||'`; -am__install_max = 40 -am__nobase_strip_setup = \ - srcdirstrip=`echo "$(srcdir)" | sed 's/[].[^$$\\*|]/\\\\&/g'` -am__nobase_strip = \ - for p in $$list; do echo "$$p"; done | sed -e "s|$$srcdirstrip/||" -am__nobase_list = $(am__nobase_strip_setup); \ - for p in $$list; do echo "$$p $$p"; done | \ - sed "s| $$srcdirstrip/| |;"' / .*\//!s/ .*/ ./; s,\( .*\)/[^/]*$$,\1,' | \ - $(AWK) 'BEGIN { files["."] = "" } { files[$$2] = files[$$2] " " $$1; \ - if (++n[$$2] == $(am__install_max)) \ - { print $$2, files[$$2]; n[$$2] = 0; files[$$2] = "" } } \ - END { for (dir in files) print dir, files[dir] }' -am__base_list = \ - sed '$$!N;$$!N;$$!N;$$!N;$$!N;$$!N;$$!N;s/\n/ /g' | \ - sed '$$!N;$$!N;$$!N;$$!N;s/\n/ /g' -am__uninstall_files_from_dir = { \ - test -z "$$files" \ - || { test ! -d "$$dir" && test ! -f "$$dir" && test ! -r "$$dir"; } \ - || { echo " ( cd '$$dir' && rm -f" $$files ")"; \ - $(am__cd) "$$dir" && rm -f $$files; }; \ - } -am__installdirs = "$(DESTDIR)$(webdir)" "$(DESTDIR)$(webcssdir)" \ - "$(DESTDIR)$(webdntdir)" "$(DESTDIR)$(webfontsdir)" \ - "$(DESTDIR)$(webimagesdir)" "$(DESTDIR)$(weblibdir)" \ - "$(DESTDIR)$(webstaticdir)" "$(DESTDIR)$(webwellknowndir)" -DATA = $(dist_noinst_DATA) $(dist_web_DATA) $(dist_webcss_DATA) \ - $(dist_webdnt_DATA) $(dist_webfonts_DATA) \ - $(dist_webimages_DATA) $(dist_weblib_DATA) \ - $(dist_webstatic_DATA) $(dist_webwellknown_DATA) -am__tagged_files = $(HEADERS) $(SOURCES) $(TAGS_FILES) $(LISP) -am__DIST_COMMON = $(srcdir)/Makefile.in -DISTFILES = $(DIST_COMMON) $(DIST_SOURCES) $(TEXINFOS) $(EXTRA_DIST) -ACLOCAL = @ACLOCAL@ -AMTAR = @AMTAR@ -AM_DEFAULT_VERBOSITY = @AM_DEFAULT_VERBOSITY@ -AUTOCONF = @AUTOCONF@ -AUTOHEADER = @AUTOHEADER@ -AUTOMAKE = @AUTOMAKE@ -AWK = @AWK@ -CC = @CC@ -CCDEPMODE = @CCDEPMODE@ -CFLAGS = @CFLAGS@ -CPP = @CPP@ -CPPFLAGS = @CPPFLAGS@ -CUPSCONFIG = @CUPSCONFIG@ -CXX = @CXX@ -CXXDEPMODE = @CXXDEPMODE@ -CXXFLAGS = @CXXFLAGS@ -CXX_BINARY = @CXX_BINARY@ -CYGPATH_W = @CYGPATH_W@ -DEFS = @DEFS@ -DEPDIR = @DEPDIR@ -ECHO_C = @ECHO_C@ -ECHO_N = @ECHO_N@ -ECHO_T = @ECHO_T@ -EGREP = @EGREP@ -EXEEXT = @EXEEXT@ -GREP = @GREP@ -INSTALL = @INSTALL@ -INSTALL_DATA = @INSTALL_DATA@ -INSTALL_PROGRAM = @INSTALL_PROGRAM@ -INSTALL_SCRIPT = @INSTALL_SCRIPT@ -INSTALL_STRIP_PROGRAM = @INSTALL_STRIP_PROGRAM@ -IPMIMONITORING_CFLAGS = @IPMIMONITORING_CFLAGS@ -IPMIMONITORING_LIBS = @IPMIMONITORING_LIBS@ -JSON_CFLAGS = @JSON_CFLAGS@ -JSON_LIBS = @JSON_LIBS@ -LDFLAGS = @LDFLAGS@ -LIBCAP_CFLAGS = @LIBCAP_CFLAGS@ -LIBCAP_LIBS = @LIBCAP_LIBS@ -LIBCRYPTO_CFLAGS = @LIBCRYPTO_CFLAGS@ -LIBCRYPTO_LIBS = @LIBCRYPTO_LIBS@ -LIBCURL_CFLAGS = @LIBCURL_CFLAGS@ -LIBCURL_LIBS = @LIBCURL_LIBS@ -LIBMNL_CFLAGS = @LIBMNL_CFLAGS@ -LIBMNL_LIBS = @LIBMNL_LIBS@ -LIBMONGOC_CFLAGS = @LIBMONGOC_CFLAGS@ -LIBMONGOC_LIBS = @LIBMONGOC_LIBS@ -LIBOBJS = @LIBOBJS@ -LIBS = @LIBS@ -LIBSSL_CFLAGS = @LIBSSL_CFLAGS@ -LIBSSL_LIBS = @LIBSSL_LIBS@ -LTLIBOBJS = @LTLIBOBJS@ -MAINT = @MAINT@ -MAKEINFO = @MAKEINFO@ -MATH_CFLAGS = @MATH_CFLAGS@ -MATH_LIBS = @MATH_LIBS@ -MKDIR_P = @MKDIR_P@ -NFACCT_CFLAGS = @NFACCT_CFLAGS@ -NFACCT_LIBS = @NFACCT_LIBS@ -OBJEXT = @OBJEXT@ -OPTIONAL_CUPS_CFLAGS = @OPTIONAL_CUPS_CFLAGS@ -OPTIONAL_CUPS_LIBS = @OPTIONAL_CUPS_LIBS@ -OPTIONAL_IPMIMONITORING_CFLAGS = @OPTIONAL_IPMIMONITORING_CFLAGS@ -OPTIONAL_IPMIMONITORING_LIBS = @OPTIONAL_IPMIMONITORING_LIBS@ -OPTIONAL_JSONC_LIBS = @OPTIONAL_JSONC_LIBS@ -OPTIONAL_JUDY_LIBS = @OPTIONAL_JUDY_LIBS@ -OPTIONAL_KINESIS_CFLAGS = @OPTIONAL_KINESIS_CFLAGS@ -OPTIONAL_KINESIS_LIBS = @OPTIONAL_KINESIS_LIBS@ -OPTIONAL_LIBCAP_CFLAGS = @OPTIONAL_LIBCAP_CFLAGS@ -OPTIONAL_LIBCAP_LIBS = @OPTIONAL_LIBCAP_LIBS@ -OPTIONAL_LZ4_LIBS = @OPTIONAL_LZ4_LIBS@ -OPTIONAL_MATH_CFLAGS = @OPTIONAL_MATH_CFLAGS@ -OPTIONAL_MATH_LIBS = @OPTIONAL_MATH_LIBS@ -OPTIONAL_MONGOC_CFLAGS = @OPTIONAL_MONGOC_CFLAGS@ -OPTIONAL_MONGOC_LIBS = @OPTIONAL_MONGOC_LIBS@ -OPTIONAL_NFACCT_CFLAGS = @OPTIONAL_NFACCT_CFLAGS@ -OPTIONAL_NFACCT_LIBS = @OPTIONAL_NFACCT_LIBS@ -OPTIONAL_PROMETHEUS_REMOTE_WRITE_CFLAGS = @OPTIONAL_PROMETHEUS_REMOTE_WRITE_CFLAGS@ -OPTIONAL_PROMETHEUS_REMOTE_WRITE_LIBS = @OPTIONAL_PROMETHEUS_REMOTE_WRITE_LIBS@ -OPTIONAL_SSL_LIBS = @OPTIONAL_SSL_LIBS@ -OPTIONAL_UUID_CFLAGS = @OPTIONAL_UUID_CFLAGS@ -OPTIONAL_UUID_LIBS = @OPTIONAL_UUID_LIBS@ -OPTIONAL_UV_LIBS = @OPTIONAL_UV_LIBS@ -OPTIONAL_XENSTAT_CFLAGS = @OPTIONAL_XENSTAT_CFLAGS@ -OPTIONAL_XENSTAT_LIBS = @OPTIONAL_XENSTAT_LIBS@ -OPTIONAL_ZLIB_CFLAGS = @OPTIONAL_ZLIB_CFLAGS@ -OPTIONAL_ZLIB_LIBS = @OPTIONAL_ZLIB_LIBS@ -PACKAGE = @PACKAGE@ -PACKAGE_BUGREPORT = @PACKAGE_BUGREPORT@ -PACKAGE_NAME = @PACKAGE_NAME@ -PACKAGE_RPM_VERSION = @PACKAGE_RPM_VERSION@ -PACKAGE_STRING = @PACKAGE_STRING@ -PACKAGE_TARNAME = @PACKAGE_TARNAME@ -PACKAGE_URL = @PACKAGE_URL@ -PACKAGE_VERSION = @PACKAGE_VERSION@ -PATH_SEPARATOR = @PATH_SEPARATOR@ -PKG_CONFIG = @PKG_CONFIG@ -PKG_CONFIG_LIBDIR = @PKG_CONFIG_LIBDIR@ -PKG_CONFIG_PATH = @PKG_CONFIG_PATH@ -PROTOBUF_CFLAGS = @PROTOBUF_CFLAGS@ -PROTOBUF_LIBS = @PROTOBUF_LIBS@ -PROTOC = @PROTOC@ -PTHREAD_CC = @PTHREAD_CC@ -PTHREAD_CFLAGS = @PTHREAD_CFLAGS@ -PTHREAD_LIBS = @PTHREAD_LIBS@ -SET_MAKE = @SET_MAKE@ -SHELL = @SHELL@ -SSE_CANDIDATE = @SSE_CANDIDATE@ -STRIP = @STRIP@ -UUID_CFLAGS = @UUID_CFLAGS@ -UUID_LIBS = @UUID_LIBS@ -VERSION = @VERSION@ -XENLIGHT_CFLAGS = @XENLIGHT_CFLAGS@ -XENLIGHT_LIBS = @XENLIGHT_LIBS@ -YAJL_CFLAGS = @YAJL_CFLAGS@ -YAJL_LIBS = @YAJL_LIBS@ -ZLIB_CFLAGS = @ZLIB_CFLAGS@ -ZLIB_LIBS = @ZLIB_LIBS@ -abs_builddir = @abs_builddir@ -abs_srcdir = @abs_srcdir@ -abs_top_builddir = @abs_top_builddir@ -abs_top_srcdir = @abs_top_srcdir@ -ac_ct_CC = @ac_ct_CC@ -ac_ct_CXX = @ac_ct_CXX@ -am__include = @am__include@ -am__leading_dot = @am__leading_dot@ -am__quote = @am__quote@ -am__tar = @am__tar@ -am__untar = @am__untar@ -ax_pthread_config = @ax_pthread_config@ -bindir = @bindir@ -build = @build@ -build_alias = @build_alias@ -build_cpu = @build_cpu@ -build_os = @build_os@ -build_target = @build_target@ -build_vendor = @build_vendor@ -builddir = @builddir@ -cachedir = @cachedir@ -chartsdir = @chartsdir@ -configdir = @configdir@ -datadir = @datadir@ -datarootdir = @datarootdir@ -docdir = @docdir@ -dvidir = @dvidir@ -exec_prefix = @exec_prefix@ -has_jemalloc = @has_jemalloc@ -has_tcmalloc = @has_tcmalloc@ -host = @host@ -host_alias = @host_alias@ -host_cpu = @host_cpu@ -host_os = @host_os@ -host_vendor = @host_vendor@ -htmldir = @htmldir@ -includedir = @includedir@ -infodir = @infodir@ -install_sh = @install_sh@ -libconfigdir = @libconfigdir@ -libdir = @libdir@ -libexecdir = @libexecdir@ -localedir = @localedir@ -localstatedir = @localstatedir@ -logdir = @logdir@ -mandir = @mandir@ -mkdir_p = @mkdir_p@ -nodedir = @nodedir@ -oldincludedir = @oldincludedir@ -pdfdir = @pdfdir@ -pluginsdir = @pluginsdir@ -prefix = @prefix@ -program_transform_name = @program_transform_name@ -psdir = @psdir@ -pythondir = @pythondir@ -registrydir = @registrydir@ -runstatedir = @runstatedir@ -sbindir = @sbindir@ -sharedstatedir = @sharedstatedir@ -srcdir = @srcdir@ -sysconfdir = @sysconfdir@ -target_alias = @target_alias@ -top_build_prefix = @top_build_prefix@ -top_builddir = @top_builddir@ -top_srcdir = @top_srcdir@ -varlibdir = @varlibdir@ -webdir = @webdir@ - -# -# Copyright (C) 2015 Alon Bar-Lev <alon.barlev@gmail.com> -# SPDX-License-Identifier: GPL-3.0-or-later -# -MAINTAINERCLEANFILES = $(srcdir)/Makefile.in -CLEANFILES = \ - version.txt \ - $(NULL) - -DASHBOARD_JS_FILES = \ - src/dashboard.js/prologue.js.inc \ - src/dashboard.js/utils.js \ - src/dashboard.js/server-detection.js \ - src/dashboard.js/dependencies.js \ - src/dashboard.js/error-handling.js \ - src/dashboard.js/compatibility.js \ - src/dashboard.js/xss.js \ - src/dashboard.js/colors.js \ - src/dashboard.js/units-conversion.js \ - src/dashboard.js/options.js \ - src/dashboard.js/localstorage.js \ - src/dashboard.js/timeout.js \ - src/dashboard.js/themes.js \ - src/dashboard.js/charting/dygraph.js \ - src/dashboard.js/charting/sparkline.js \ - src/dashboard.js/charting/google-charts.js \ - src/dashboard.js/charting/gauge.js \ - src/dashboard.js/charting/easy-pie-chart.js \ - src/dashboard.js/charting/d3pie.js \ - src/dashboard.js/charting/d3.js \ - src/dashboard.js/charting/peity.js \ - src/dashboard.js/charting/textonly.js \ - src/dashboard.js/charting.js \ - src/dashboard.js/chart-registry.js \ - src/dashboard.js/common.js \ - src/dashboard.js/main.js \ - src/dashboard.js/alarms.js \ - src/dashboard.js/registry.js \ - src/dashboard.js/boot.js \ - src/dashboard.js/epilogue.js.inc \ - $(NULL) - -dist_noinst_DATA = \ - README.md \ - $(DASHBOARD_JS_FILES) \ - $(NULL) - -dist_web_DATA = \ - demo.html \ - demo2.html \ - demosites.html \ - demosites2.html \ - dashboard.html \ - dashboard.js \ - dashboard_info.js \ - dashboard_info_custom_example.js \ - dashboard.css \ - dashboard.slate.css \ - favicon.ico \ - goto-host-from-alarm.html \ - index.html \ - main.css \ - main.js \ - console.html \ - infographic.html \ - robots.txt \ - refresh-badges.js \ - sitemap.xml \ - tv.html \ - version.txt \ - $(NULL) - -webstaticdir = $(webdir)/static/img -dist_webstatic_DATA = \ - static/img/netdata-logomark.svg \ - $(NULL) - -weblibdir = $(webdir)/lib -dist_weblib_DATA = \ - lib/bootstrap-3.3.7.min.js \ - lib/bootstrap-slider-10.0.0.min.js \ - lib/bootstrap-table-1.11.0.min.js \ - lib/bootstrap-table-export-1.11.0.min.js \ - lib/bootstrap-toggle-2.2.2.min.js \ - lib/clipboard-polyfill-be05dad.js \ - lib/d3-4.12.2.min.js \ - lib/d3pie-0.2.1-netdata-3.js \ - lib/dygraph-c91c859.min.js \ - lib/dygraph-smooth-plotter-c91c859.js \ - lib/fontawesome-all-5.0.1.min.js \ - lib/gauge-1.3.2.min.js \ - lib/jquery-2.2.4.min.js \ - lib/jquery.easypiechart-97b5824.min.js \ - lib/jquery.peity-3.2.0.min.js \ - lib/jquery.sparkline-2.1.2.min.js \ - lib/lz-string-1.4.4.min.js \ - lib/pako-1.0.6.min.js \ - lib/perfect-scrollbar-0.6.15.min.js \ - lib/tableExport-1.6.0.min.js \ - $(NULL) - -webcssdir = $(webdir)/css -dist_webcss_DATA = \ - css/morris-0.5.1.css \ - css/bootstrap-3.3.7.css \ - css/bootstrap-theme-3.3.7.min.css \ - css/bootstrap-slate-flat-3.3.7.css \ - css/bootstrap-slider-10.0.0.min.css \ - css/bootstrap-toggle-2.2.2.min.css \ - css/c3-0.4.18.min.css \ - $(NULL) - -webfontsdir = $(webdir)/fonts -dist_webfonts_DATA = \ - fonts/glyphicons-halflings-regular.eot \ - fonts/glyphicons-halflings-regular.svg \ - fonts/glyphicons-halflings-regular.ttf \ - fonts/glyphicons-halflings-regular.woff \ - fonts/glyphicons-halflings-regular.woff2 \ - $(NULL) - -webimagesdir = $(webdir)/images -dist_webimages_DATA = \ - images/netdata-logomark.svg \ - images/alert-128-orange.png \ - images/alert-128-red.png \ - images/alert-multi-size-orange.ico \ - images/alert-multi-size-red.ico \ - images/animated.gif \ - images/check-mark-2-128-green.png \ - images/check-mark-2-multi-size-green.ico \ - images/netdata.svg \ - images/post.png \ - images/android-icon-36x36.png \ - images/android-icon-48x48.png \ - images/android-icon-72x72.png \ - images/android-icon-96x96.png \ - images/android-icon-144x144.png \ - images/android-icon-192x192.png \ - images/apple-icon-57x57.png \ - images/apple-icon-60x60.png \ - images/apple-icon-72x72.png \ - images/apple-icon-76x76.png \ - images/apple-icon-114x114.png \ - images/apple-icon-120x120.png \ - images/apple-icon-144x144.png \ - images/apple-icon-152x152.png \ - images/apple-icon-180x180.png \ - images/apple-icon-precomposed.png \ - images/apple-icon.png \ - images/favicon-16x16.png \ - images/favicon-32x32.png \ - images/favicon-96x96.png \ - images/favicon.ico \ - images/ms-icon-70x70.png \ - images/ms-icon-144x144.png \ - images/ms-icon-150x150.png \ - images/ms-icon-310x310.png \ - images/banner-icon-144x144.png \ - $(NULL) - -webwellknowndir = $(webdir)/.well-known -dist_webwellknown_DATA = \ - $(NULL) - -webdntdir = $(webdir)/.well-known/dnt -dist_webdnt_DATA = \ - .well-known/dnt/cookies \ - $(NULL) - -all: all-am - -.SUFFIXES: -$(srcdir)/Makefile.in: @MAINTAINER_MODE_TRUE@ $(srcdir)/Makefile.am $(am__configure_deps) - @for dep in $?; do \ - case '$(am__configure_deps)' in \ - *$$dep*) \ - ( cd $(top_builddir) && $(MAKE) $(AM_MAKEFLAGS) am--refresh ) \ - && { if test -f $@; then exit 0; else break; fi; }; \ - exit 1;; \ - esac; \ - done; \ - echo ' cd $(top_srcdir) && $(AUTOMAKE) --gnu web/gui/Makefile'; \ - $(am__cd) $(top_srcdir) && \ - $(AUTOMAKE) --gnu web/gui/Makefile -Makefile: $(srcdir)/Makefile.in $(top_builddir)/config.status - @case '$?' in \ - *config.status*) \ - cd $(top_builddir) && $(MAKE) $(AM_MAKEFLAGS) am--refresh;; \ - *) \ - echo ' cd $(top_builddir) && $(SHELL) ./config.status $(subdir)/$@ $(am__depfiles_maybe)'; \ - cd $(top_builddir) && $(SHELL) ./config.status $(subdir)/$@ $(am__depfiles_maybe);; \ - esac; - -$(top_builddir)/config.status: $(top_srcdir)/configure $(CONFIG_STATUS_DEPENDENCIES) - cd $(top_builddir) && $(MAKE) $(AM_MAKEFLAGS) am--refresh - -$(top_srcdir)/configure: @MAINTAINER_MODE_TRUE@ $(am__configure_deps) - cd $(top_builddir) && $(MAKE) $(AM_MAKEFLAGS) am--refresh -$(ACLOCAL_M4): @MAINTAINER_MODE_TRUE@ $(am__aclocal_m4_deps) - cd $(top_builddir) && $(MAKE) $(AM_MAKEFLAGS) am--refresh -$(am__aclocal_m4_deps): -install-dist_webDATA: $(dist_web_DATA) - @$(NORMAL_INSTALL) - @list='$(dist_web_DATA)'; test -n "$(webdir)" || list=; \ - if test -n "$$list"; then \ - echo " $(MKDIR_P) '$(DESTDIR)$(webdir)'"; \ - $(MKDIR_P) "$(DESTDIR)$(webdir)" || exit 1; \ - fi; \ - for p in $$list; do \ - if test -f "$$p"; then d=; else d="$(srcdir)/"; fi; \ - echo "$$d$$p"; \ - done | $(am__base_list) | \ - while read files; do \ - echo " $(INSTALL_DATA) $$files '$(DESTDIR)$(webdir)'"; \ - $(INSTALL_DATA) $$files "$(DESTDIR)$(webdir)" || exit $$?; \ - done - -uninstall-dist_webDATA: - @$(NORMAL_UNINSTALL) - @list='$(dist_web_DATA)'; test -n "$(webdir)" || list=; \ - files=`for p in $$list; do echo $$p; done | sed -e 's|^.*/||'`; \ - dir='$(DESTDIR)$(webdir)'; $(am__uninstall_files_from_dir) -install-dist_webcssDATA: $(dist_webcss_DATA) - @$(NORMAL_INSTALL) - @list='$(dist_webcss_DATA)'; test -n "$(webcssdir)" || list=; \ - if test -n "$$list"; then \ - echo " $(MKDIR_P) '$(DESTDIR)$(webcssdir)'"; \ - $(MKDIR_P) "$(DESTDIR)$(webcssdir)" || exit 1; \ - fi; \ - for p in $$list; do \ - if test -f "$$p"; then d=; else d="$(srcdir)/"; fi; \ - echo "$$d$$p"; \ - done | $(am__base_list) | \ - while read files; do \ - echo " $(INSTALL_DATA) $$files '$(DESTDIR)$(webcssdir)'"; \ - $(INSTALL_DATA) $$files "$(DESTDIR)$(webcssdir)" || exit $$?; \ - done - -uninstall-dist_webcssDATA: - @$(NORMAL_UNINSTALL) - @list='$(dist_webcss_DATA)'; test -n "$(webcssdir)" || list=; \ - files=`for p in $$list; do echo $$p; done | sed -e 's|^.*/||'`; \ - dir='$(DESTDIR)$(webcssdir)'; $(am__uninstall_files_from_dir) -install-dist_webdntDATA: $(dist_webdnt_DATA) - @$(NORMAL_INSTALL) - @list='$(dist_webdnt_DATA)'; test -n "$(webdntdir)" || list=; \ - if test -n "$$list"; then \ - echo " $(MKDIR_P) '$(DESTDIR)$(webdntdir)'"; \ - $(MKDIR_P) "$(DESTDIR)$(webdntdir)" || exit 1; \ - fi; \ - for p in $$list; do \ - if test -f "$$p"; then d=; else d="$(srcdir)/"; fi; \ - echo "$$d$$p"; \ - done | $(am__base_list) | \ - while read files; do \ - echo " $(INSTALL_DATA) $$files '$(DESTDIR)$(webdntdir)'"; \ - $(INSTALL_DATA) $$files "$(DESTDIR)$(webdntdir)" || exit $$?; \ - done - -uninstall-dist_webdntDATA: - @$(NORMAL_UNINSTALL) - @list='$(dist_webdnt_DATA)'; test -n "$(webdntdir)" || list=; \ - files=`for p in $$list; do echo $$p; done | sed -e 's|^.*/||'`; \ - dir='$(DESTDIR)$(webdntdir)'; $(am__uninstall_files_from_dir) -install-dist_webfontsDATA: $(dist_webfonts_DATA) - @$(NORMAL_INSTALL) - @list='$(dist_webfonts_DATA)'; test -n "$(webfontsdir)" || list=; \ - if test -n "$$list"; then \ - echo " $(MKDIR_P) '$(DESTDIR)$(webfontsdir)'"; \ - $(MKDIR_P) "$(DESTDIR)$(webfontsdir)" || exit 1; \ - fi; \ - for p in $$list; do \ - if test -f "$$p"; then d=; else d="$(srcdir)/"; fi; \ - echo "$$d$$p"; \ - done | $(am__base_list) | \ - while read files; do \ - echo " $(INSTALL_DATA) $$files '$(DESTDIR)$(webfontsdir)'"; \ - $(INSTALL_DATA) $$files "$(DESTDIR)$(webfontsdir)" || exit $$?; \ - done - -uninstall-dist_webfontsDATA: - @$(NORMAL_UNINSTALL) - @list='$(dist_webfonts_DATA)'; test -n "$(webfontsdir)" || list=; \ - files=`for p in $$list; do echo $$p; done | sed -e 's|^.*/||'`; \ - dir='$(DESTDIR)$(webfontsdir)'; $(am__uninstall_files_from_dir) -install-dist_webimagesDATA: $(dist_webimages_DATA) - @$(NORMAL_INSTALL) - @list='$(dist_webimages_DATA)'; test -n "$(webimagesdir)" || list=; \ - if test -n "$$list"; then \ - echo " $(MKDIR_P) '$(DESTDIR)$(webimagesdir)'"; \ - $(MKDIR_P) "$(DESTDIR)$(webimagesdir)" || exit 1; \ - fi; \ - for p in $$list; do \ - if test -f "$$p"; then d=; else d="$(srcdir)/"; fi; \ - echo "$$d$$p"; \ - done | $(am__base_list) | \ - while read files; do \ - echo " $(INSTALL_DATA) $$files '$(DESTDIR)$(webimagesdir)'"; \ - $(INSTALL_DATA) $$files "$(DESTDIR)$(webimagesdir)" || exit $$?; \ - done - -uninstall-dist_webimagesDATA: - @$(NORMAL_UNINSTALL) - @list='$(dist_webimages_DATA)'; test -n "$(webimagesdir)" || list=; \ - files=`for p in $$list; do echo $$p; done | sed -e 's|^.*/||'`; \ - dir='$(DESTDIR)$(webimagesdir)'; $(am__uninstall_files_from_dir) -install-dist_weblibDATA: $(dist_weblib_DATA) - @$(NORMAL_INSTALL) - @list='$(dist_weblib_DATA)'; test -n "$(weblibdir)" || list=; \ - if test -n "$$list"; then \ - echo " $(MKDIR_P) '$(DESTDIR)$(weblibdir)'"; \ - $(MKDIR_P) "$(DESTDIR)$(weblibdir)" || exit 1; \ - fi; \ - for p in $$list; do \ - if test -f "$$p"; then d=; else d="$(srcdir)/"; fi; \ - echo "$$d$$p"; \ - done | $(am__base_list) | \ - while read files; do \ - echo " $(INSTALL_DATA) $$files '$(DESTDIR)$(weblibdir)'"; \ - $(INSTALL_DATA) $$files "$(DESTDIR)$(weblibdir)" || exit $$?; \ - done - -uninstall-dist_weblibDATA: - @$(NORMAL_UNINSTALL) - @list='$(dist_weblib_DATA)'; test -n "$(weblibdir)" || list=; \ - files=`for p in $$list; do echo $$p; done | sed -e 's|^.*/||'`; \ - dir='$(DESTDIR)$(weblibdir)'; $(am__uninstall_files_from_dir) -install-dist_webstaticDATA: $(dist_webstatic_DATA) - @$(NORMAL_INSTALL) - @list='$(dist_webstatic_DATA)'; test -n "$(webstaticdir)" || list=; \ - if test -n "$$list"; then \ - echo " $(MKDIR_P) '$(DESTDIR)$(webstaticdir)'"; \ - $(MKDIR_P) "$(DESTDIR)$(webstaticdir)" || exit 1; \ - fi; \ - for p in $$list; do \ - if test -f "$$p"; then d=; else d="$(srcdir)/"; fi; \ - echo "$$d$$p"; \ - done | $(am__base_list) | \ - while read files; do \ - echo " $(INSTALL_DATA) $$files '$(DESTDIR)$(webstaticdir)'"; \ - $(INSTALL_DATA) $$files "$(DESTDIR)$(webstaticdir)" || exit $$?; \ - done - -uninstall-dist_webstaticDATA: - @$(NORMAL_UNINSTALL) - @list='$(dist_webstatic_DATA)'; test -n "$(webstaticdir)" || list=; \ - files=`for p in $$list; do echo $$p; done | sed -e 's|^.*/||'`; \ - dir='$(DESTDIR)$(webstaticdir)'; $(am__uninstall_files_from_dir) -install-dist_webwellknownDATA: $(dist_webwellknown_DATA) - @$(NORMAL_INSTALL) - @list='$(dist_webwellknown_DATA)'; test -n "$(webwellknowndir)" || list=; \ - if test -n "$$list"; then \ - echo " $(MKDIR_P) '$(DESTDIR)$(webwellknowndir)'"; \ - $(MKDIR_P) "$(DESTDIR)$(webwellknowndir)" || exit 1; \ - fi; \ - for p in $$list; do \ - if test -f "$$p"; then d=; else d="$(srcdir)/"; fi; \ - echo "$$d$$p"; \ - done | $(am__base_list) | \ - while read files; do \ - echo " $(INSTALL_DATA) $$files '$(DESTDIR)$(webwellknowndir)'"; \ - $(INSTALL_DATA) $$files "$(DESTDIR)$(webwellknowndir)" || exit $$?; \ - done - -uninstall-dist_webwellknownDATA: - @$(NORMAL_UNINSTALL) - @list='$(dist_webwellknown_DATA)'; test -n "$(webwellknowndir)" || list=; \ - files=`for p in $$list; do echo $$p; done | sed -e 's|^.*/||'`; \ - dir='$(DESTDIR)$(webwellknowndir)'; $(am__uninstall_files_from_dir) -tags TAGS: - -ctags CTAGS: - -cscope cscopelist: - - -distdir: $(DISTFILES) - @srcdirstrip=`echo "$(srcdir)" | sed 's/[].[^$$\\*]/\\\\&/g'`; \ - topsrcdirstrip=`echo "$(top_srcdir)" | sed 's/[].[^$$\\*]/\\\\&/g'`; \ - list='$(DISTFILES)'; \ - dist_files=`for file in $$list; do echo $$file; done | \ - sed -e "s|^$$srcdirstrip/||;t" \ - -e "s|^$$topsrcdirstrip/|$(top_builddir)/|;t"`; \ - case $$dist_files in \ - */*) $(MKDIR_P) `echo "$$dist_files" | \ - sed '/\//!d;s|^|$(distdir)/|;s,/[^/]*$$,,' | \ - sort -u` ;; \ - esac; \ - for file in $$dist_files; do \ - if test -f $$file || test -d $$file; then d=.; else d=$(srcdir); fi; \ - if test -d $$d/$$file; then \ - dir=`echo "/$$file" | sed -e 's,/[^/]*$$,,'`; \ - if test -d "$(distdir)/$$file"; then \ - find "$(distdir)/$$file" -type d ! -perm -700 -exec chmod u+rwx {} \;; \ - fi; \ - if test -d $(srcdir)/$$file && test $$d != $(srcdir); then \ - cp -fpR $(srcdir)/$$file "$(distdir)$$dir" || exit 1; \ - find "$(distdir)/$$file" -type d ! -perm -700 -exec chmod u+rwx {} \;; \ - fi; \ - cp -fpR $$d/$$file "$(distdir)$$dir" || exit 1; \ - else \ - test -f "$(distdir)/$$file" \ - || cp -p $$d/$$file "$(distdir)/$$file" \ - || exit 1; \ - fi; \ - done -check-am: all-am -check: check-am -all-am: Makefile $(DATA) -installdirs: - for dir in "$(DESTDIR)$(webdir)" "$(DESTDIR)$(webcssdir)" "$(DESTDIR)$(webdntdir)" "$(DESTDIR)$(webfontsdir)" "$(DESTDIR)$(webimagesdir)" "$(DESTDIR)$(weblibdir)" "$(DESTDIR)$(webstaticdir)" "$(DESTDIR)$(webwellknowndir)"; do \ - test -z "$$dir" || $(MKDIR_P) "$$dir"; \ - done -install: install-am -install-exec: install-exec-am -install-data: install-data-am -uninstall: uninstall-am - -install-am: all-am - @$(MAKE) $(AM_MAKEFLAGS) install-exec-am install-data-am - -installcheck: installcheck-am -install-strip: - if test -z '$(STRIP)'; then \ - $(MAKE) $(AM_MAKEFLAGS) INSTALL_PROGRAM="$(INSTALL_STRIP_PROGRAM)" \ - install_sh_PROGRAM="$(INSTALL_STRIP_PROGRAM)" INSTALL_STRIP_FLAG=-s \ - install; \ - else \ - $(MAKE) $(AM_MAKEFLAGS) INSTALL_PROGRAM="$(INSTALL_STRIP_PROGRAM)" \ - install_sh_PROGRAM="$(INSTALL_STRIP_PROGRAM)" INSTALL_STRIP_FLAG=-s \ - "INSTALL_PROGRAM_ENV=STRIPPROG='$(STRIP)'" install; \ - fi -mostlyclean-generic: - -clean-generic: - -test -z "$(CLEANFILES)" || rm -f $(CLEANFILES) - -distclean-generic: - -test -z "$(CONFIG_CLEAN_FILES)" || rm -f $(CONFIG_CLEAN_FILES) - -test . = "$(srcdir)" || test -z "$(CONFIG_CLEAN_VPATH_FILES)" || rm -f $(CONFIG_CLEAN_VPATH_FILES) - -maintainer-clean-generic: - @echo "This command is intended for maintainers to use" - @echo "it deletes files that may require special tools to rebuild." - -test -z "$(MAINTAINERCLEANFILES)" || rm -f $(MAINTAINERCLEANFILES) -clean: clean-am - -clean-am: clean-generic mostlyclean-am - -distclean: distclean-am - -rm -f Makefile -distclean-am: clean-am distclean-generic - -dvi: dvi-am - -dvi-am: - -html: html-am - -html-am: - -info: info-am - -info-am: - -install-data-am: install-dist_webDATA install-dist_webcssDATA \ - install-dist_webdntDATA install-dist_webfontsDATA \ - install-dist_webimagesDATA install-dist_weblibDATA \ - install-dist_webstaticDATA install-dist_webwellknownDATA - -install-dvi: install-dvi-am - -install-dvi-am: - -install-exec-am: - -install-html: install-html-am - -install-html-am: - -install-info: install-info-am - -install-info-am: - -install-man: - -install-pdf: install-pdf-am - -install-pdf-am: - -install-ps: install-ps-am - -install-ps-am: - -installcheck-am: - -maintainer-clean: maintainer-clean-am - -rm -f Makefile -maintainer-clean-am: distclean-am maintainer-clean-generic - -mostlyclean: mostlyclean-am - -mostlyclean-am: mostlyclean-generic - -pdf: pdf-am - -pdf-am: - -ps: ps-am - -ps-am: - -uninstall-am: uninstall-dist_webDATA uninstall-dist_webcssDATA \ - uninstall-dist_webdntDATA uninstall-dist_webfontsDATA \ - uninstall-dist_webimagesDATA uninstall-dist_weblibDATA \ - uninstall-dist_webstaticDATA uninstall-dist_webwellknownDATA - -.MAKE: install-am install-strip - -.PHONY: all all-am check check-am clean clean-generic cscopelist-am \ - ctags-am distclean distclean-generic distdir dvi dvi-am html \ - html-am info info-am install install-am install-data \ - install-data-am install-dist_webDATA install-dist_webcssDATA \ - install-dist_webdntDATA install-dist_webfontsDATA \ - install-dist_webimagesDATA install-dist_weblibDATA \ - install-dist_webstaticDATA install-dist_webwellknownDATA \ - install-dvi install-dvi-am install-exec install-exec-am \ - install-html install-html-am install-info install-info-am \ - install-man install-pdf install-pdf-am install-ps \ - install-ps-am install-strip installcheck installcheck-am \ - installdirs maintainer-clean maintainer-clean-generic \ - mostlyclean mostlyclean-generic pdf pdf-am ps ps-am tags-am \ - uninstall uninstall-am uninstall-dist_webDATA \ - uninstall-dist_webcssDATA uninstall-dist_webdntDATA \ - uninstall-dist_webfontsDATA uninstall-dist_webimagesDATA \ - uninstall-dist_weblibDATA uninstall-dist_webstaticDATA \ - uninstall-dist_webwellknownDATA - -.PRECIOUS: Makefile - - -dashboard.js: $(DASHBOARD_JS_FILES) - if test -f $@; then rm -f $@; fi - cat $(DASHBOARD_JS_FILES) > $@.tmp && mv $@.tmp $@ - -version.txt: - if test -d "$(top_srcdir)/.git"; then \ - git --git-dir="$(top_srcdir)/.git" log -n 1 --format=%H; \ - fi > $@.tmp - test -s $@.tmp || echo 0 > $@.tmp - mv $@.tmp $@ - -# regenerate these files, even if they are up to date -.PHONY: version.txt dashboard.js - -# Tell versions [3.59,3.63) of GNU make to not export all variables. -# Otherwise a system limit (for SysV at least) may be exceeded. -.NOEXPORT: diff --git a/web/gui/README.md b/web/gui/README.md index 26ef59bc5..876d499fc 100644 --- a/web/gui/README.md +++ b/web/gui/README.md @@ -1,118 +1,159 @@ -# Netdata agent web GUI +# The standard web dashboard -## Generating dashboard.js +The standard web dashboard is the heart of Netdata's performance troubleshooting +toolkit. You've probably seen it before: -The monolithic `dashboards.js` file is automatically generated by concatenating the source files located in the `web/gui/src/dashboard.js/` directory by running the build script: + -```sh -cd web/gui -make -``` +Learn more about how dashboards work and how they're populated using the +`dashboards.js` file in our [web dashboards overview](../README.md). -After every change in the `src` directory, the `dashboard.js` file should be regenerated and commited to the repository. +By default, Netdata starts a web server for its dashboard at port `19999`. Open +up your web browser of choice and navigate to `http://SERVER-IP:19999`, or +`http://localhost:19999` on `localhost`. -## Custom Dashboards +Netdata uses an [internal, static-threaded web server](../server/) to host the +HTML, CSS, and JavaScript files that make up the standard dashboard. You don't +have to configure anything to access it, although you can adjust [your +settings](../server/#other-netdataconf-web-section-options) in the +`netdata.conf` file, or run Netdata behind an Nginx proxy, and so on. -For information on creating custom dashboards, see **[Custom Dashboards](custom/)** and **[Atlassian Confluence Dashboards](confluence/)** +## Navigating the standard dashboard -## Supported chart libraries +Beyond charts, the standard dashboard can be broken down into three key areas: -- Dygraph -- jQuery Sparkline -- Peity -- Google Charts -- Morris -- EasyPieChart -- Gauge.js -- D3 -- C3 +1. [**Sections**](#sections) +2. [**Menus/submenus**](#menus) +3. [**Nodes menu**](#nodes-menu) -### Dygraph +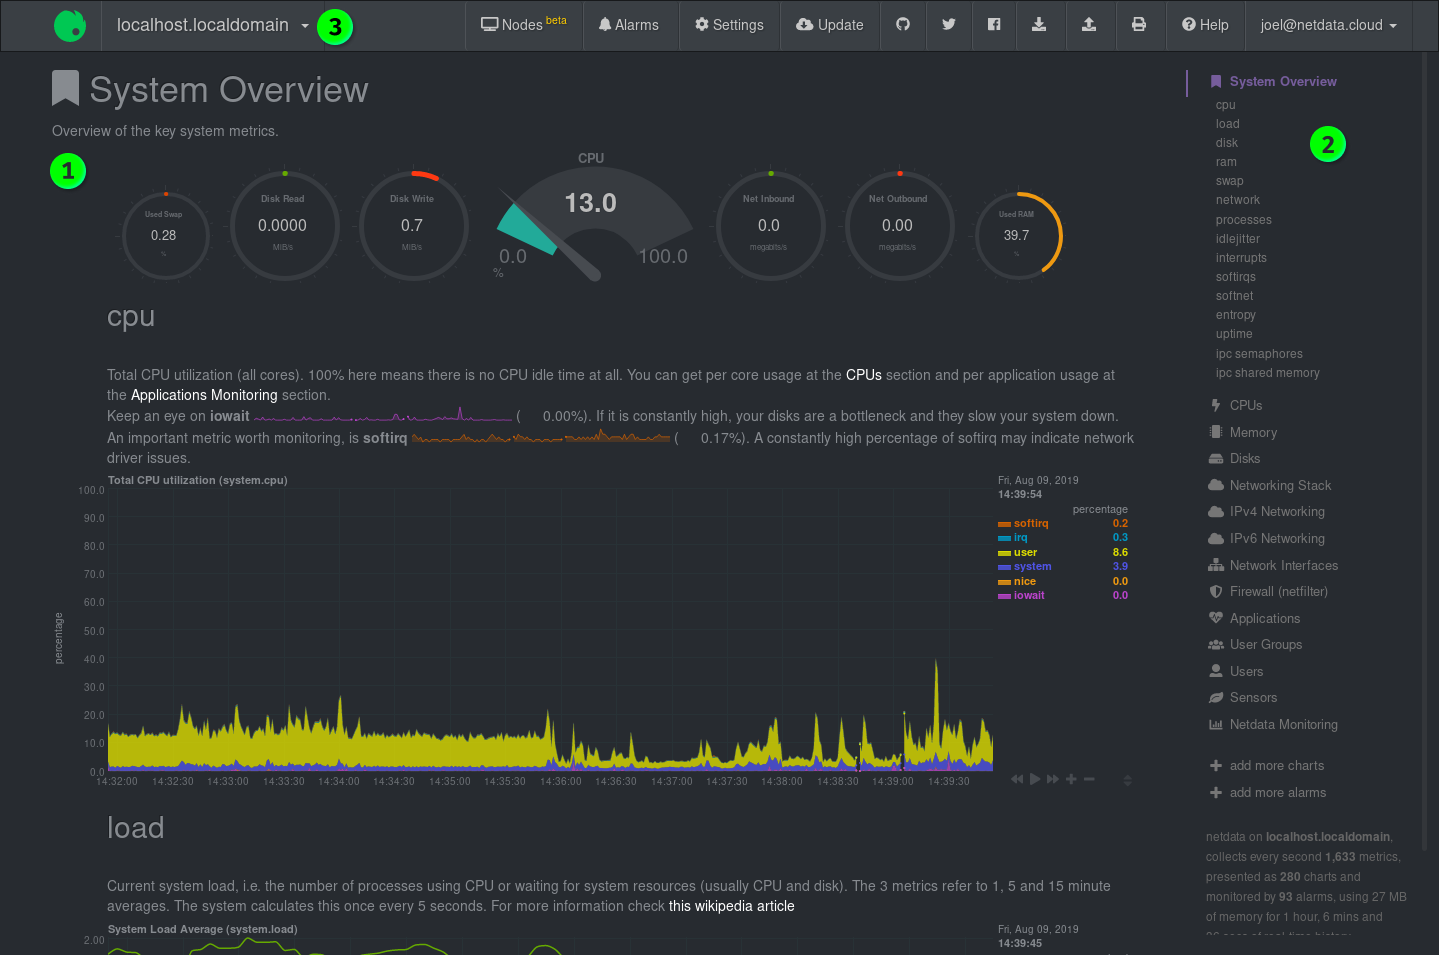 -#### Settings +### Sections -[Example settings here](https://github.com/netdata/netdata/blob/e91f00d99f4965e985981b93fa46ef33f94dd726/web/dashboard.js#L3793) +Netdata is broken up into multiple **sections**, such as **System Overview**, +**CPU**, **Disk**, and more. Inside each section you'll find a number of charts, +broken down into [contexts](../README.md#contexts) and +[families](../README.md#families). -#### Value Range +An example of the **Memory** section on a Linux desktop system. -You can set the min and max values of the y-axis using `data-dygraph-valuerange="[MIN, MAX]"` +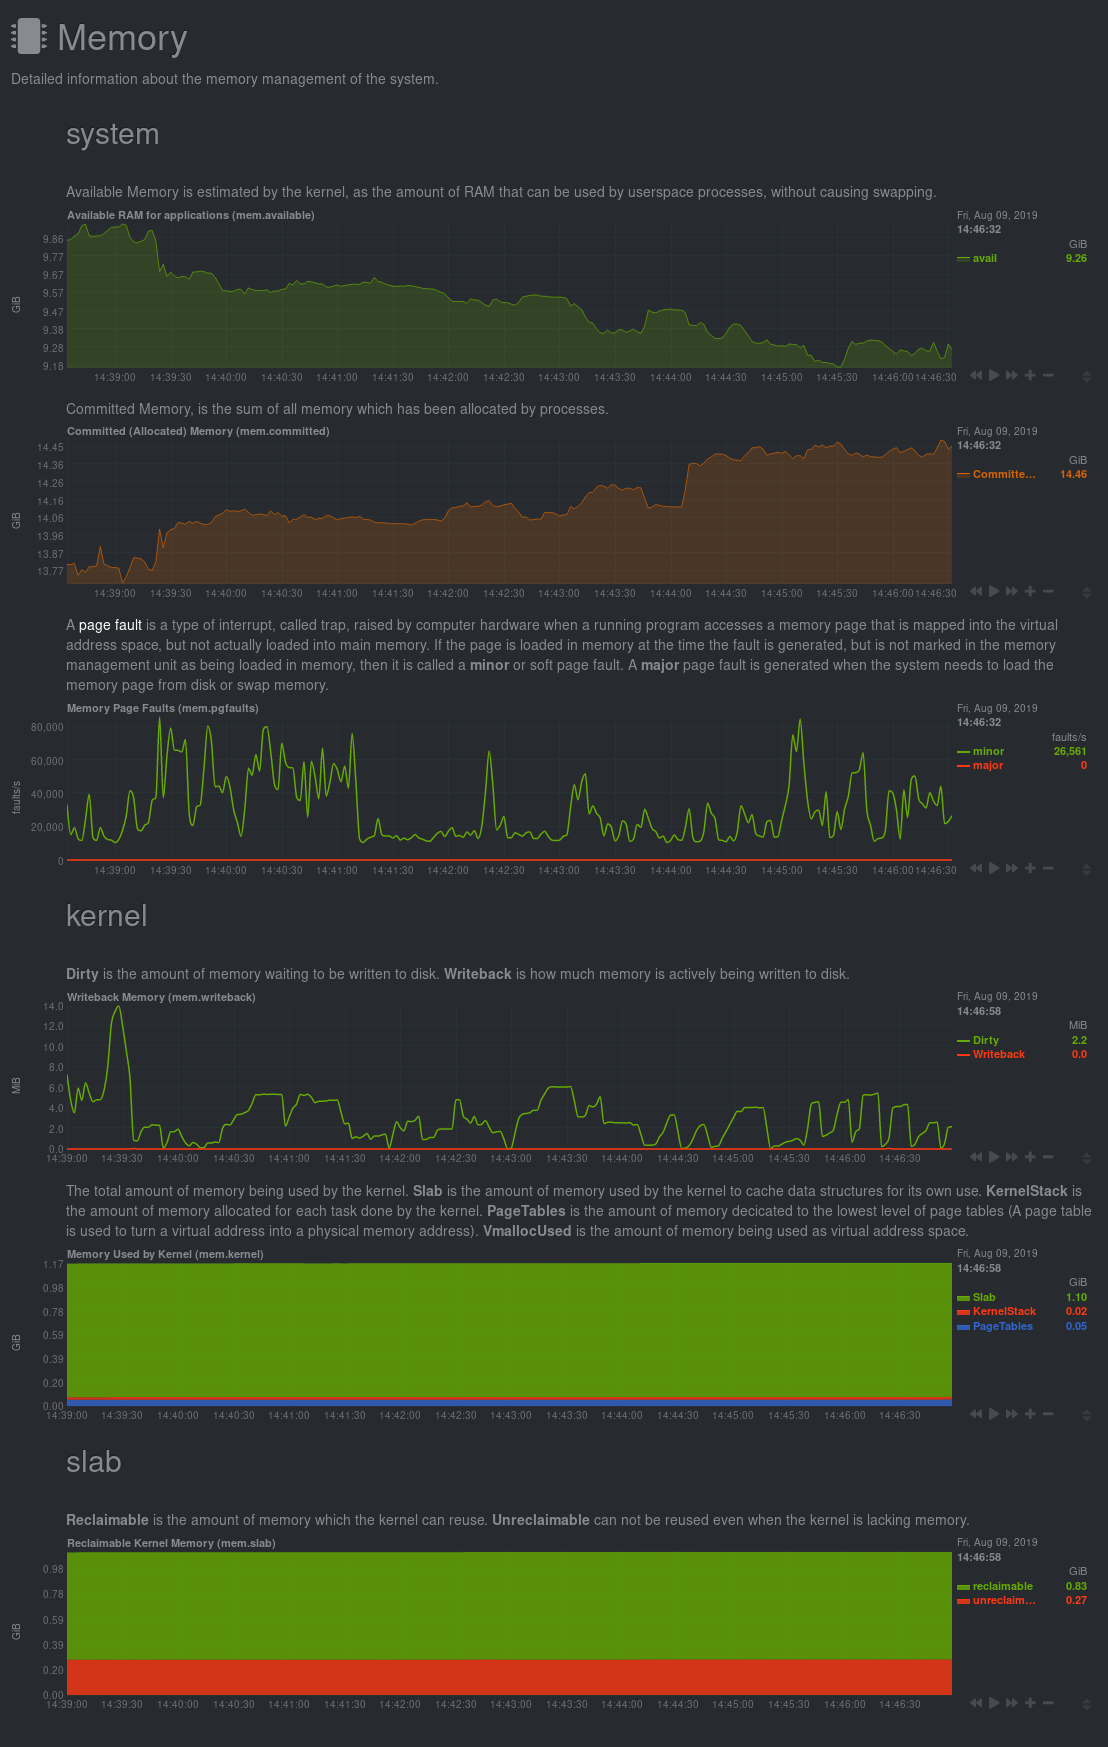 -### EasyPieChart +All sections and their associated charts appear on a single "page," so all you +need to do to view different sections is scroll up and down the page. But it's +usually quicker to use the [menus](#menus). -#### Settings +### Menus -TBD +**Menus** appears on the right-hand side of the standard dashboard. Netdata +generates a menu for each section, and menus link to the section they're +associated with. -#### Value Range +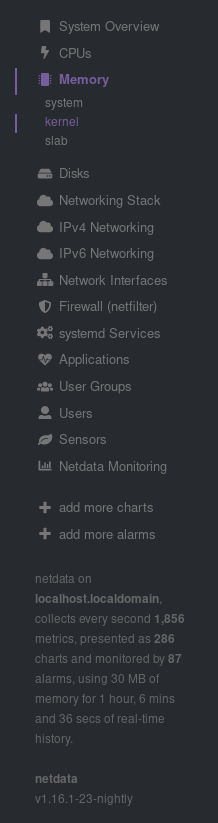 -You can set the max value of the chart using the following snippet: +Most menu items will contain several **submenu** entries, which represent any +[families](../README.md#families) from that section. Netdata automatically +generates these submenu entries. -```html -<div data-netdata="unique.id" - data-chart-library="easypiechart" - data-easypiechart-max-value="40" - ></div> -``` +Here's a **Disks** menu with several submenu entries for each disk drive and +partition Netdata recognizes. -Be aware that values that exceed the max value will get expanded (e.g. "41" is still 100%). Similar for the minimum: +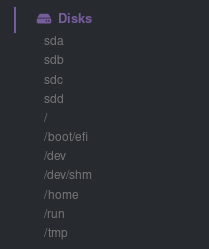 -```html -<div data-netdata="unique.id" - data-chart-library="easypiechart" - data-easypiechart-min-value="20" - ></div> -``` +### Nodes menu + +The nodes menu appears in the top-left corner of the standard dashboard and is +labeled with the hostname of the system Netdata is monitoring. + +Clicking on it will display a drop-down menu of any nodes you might have +connected via the [Netdata registry](../../registry/). By default, you'll find +nothing under the **My nodes** heading, but you can try out any of the demo +Netdata nodes to see how the nodes menu works. + +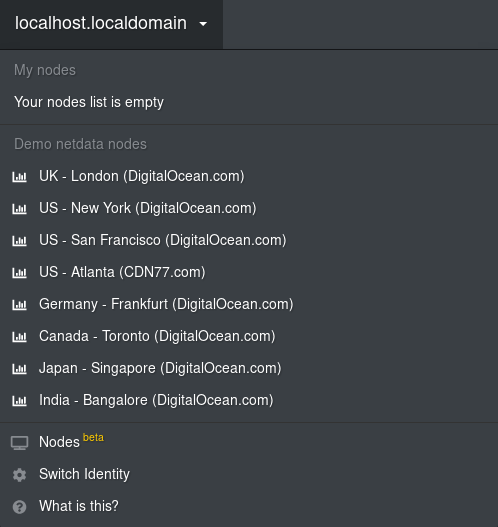 + +Once you add nodes via [Netdata Cloud](../../docs/netdata-cloud/) or a [private +registry](../../registry/#run-your-own-registry), you will see them appear under +the **My nodes** heading. + +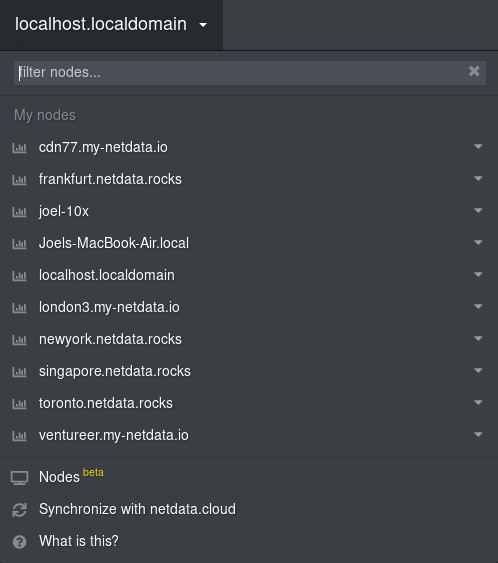 + +The nodes menu will also show the master netdata node and all slave nodes +streaming to that master, if you have [configured streaming](../../streaming). -If you specify both minimum and maximum, the rendering behavior changes. Instead of displaying the `value` based from zero, it is now based on the range that is provided by the snippet: +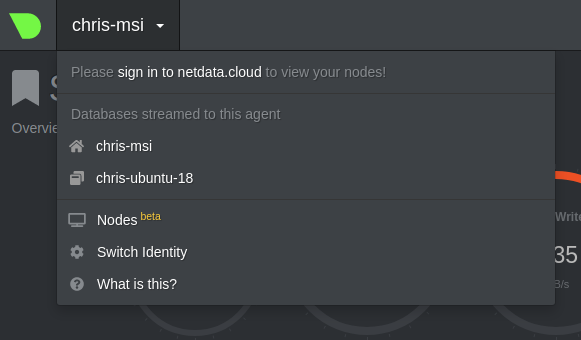 -```html -<div data-netdata="unique.id" - data-chart-library="easypiechart" - data-easypiechart-min-value="20" - data-easypiechart-max-value="40" - ></div> +## Customizing the standard dashboard + +Netdata stores information about individual charts in the `dashboard_info.js` +file. This file includes section and subsection headings, descriptions, colors, +titles, tooltips, and other information for Netdata to render on the dashboard. + +For example, here is how `dashboard_info.js` defines the **System Overview** +section. + +```javascript +netdataDashboard.menu = { + 'system': { + title: 'System Overview', + icon: '<i class="fas fa-bookmark"></i>', + info: 'Overview of the key system metrics.' + }, ``` -In the first example, a value of `30`, without specifying the minimum, fills the chart bar to `75%` (100% / 40 \* 30). However, in this example the range is now `20` (40 - 20 = 20). The value `30` will fill the chart to **`50%`**, since it's in the middle between 20 and 40. +If you want to customize this information, you should avoid editing +`dashboard_info.js` directly. These changes are not persistent; Netdata will +overwrite the file when it's updated. Instead, you should create a new file with +your customizations. -This szenario is useful if you have metrics that change only within a specific range, e.g. temperatures that are very unlikely to fall out of range. In these cases it is more useful to have the chart render the values between the given min and max, to better highlight the changes within them. +We created an example file at +[`dashboard_info_custom_example.js`](dashboard_info_custom_example.js). You can +copy this to a new file with a name of your choice in the `web/` directory. This +directory changes based on your operating system and installation method. If +you're on a Linux system, it should be at `/usr/share/netdata/web/`. -#### Negative Values +```shell +cd /usr/share/netdata/web/ +sudo cp dashboard_info_custom_example.js your_dashboard_info_file.js +``` -EasyPieCharts can render negative values with the following flag: +Edit the file with your customizations. For example: -```html -<div data-netdata="unique.id" - data-chart-library="easypiechart" - data-override-options="signed" - ></div> +```javascript +customDashboard.menu = { + 'system': { + title: 'Testing, testing, 1 2 3', + icon: '<i class="fas fa-thumbs-up"></i>', + info: 'This is overwritten info for the system overview section!' + }, +}; ``` -Negative values are rendered counter-clockwise. - -#### Full example - -This is a chart that displays the hotwater temperature in the given range of 40 to 50. - -```html -<div data-netdata="stiebeleltron_system.hotwater.hotwatertemp" - data-title="Hot Water Temperature" - data-decimal-digits="1" - data-chart-library="easypiechart" - data-colors="#FE3912" - data-width="55%" - data-height="50%" - data-points="1200" - data-after="-1200" - data-dimensions="actual" - data-units="°C" - data-easypiechart-max-value="50" - data-easypiechart-min-value="40" - data-common-max="netdata-hotwater-max" - data-common-min="netdata-hotwater-min" -></div> +Finally, tell Netdata where you placed your customization file by replacing +`your_dashboard_info_file.js` below. + +```conf +[web] + custom dashboard_info.js = your_dashboard_info_file.js ``` -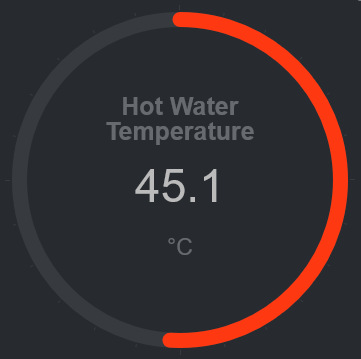 +Once you restart Netdata, refresh the dashboard to find your custom +configuration: + +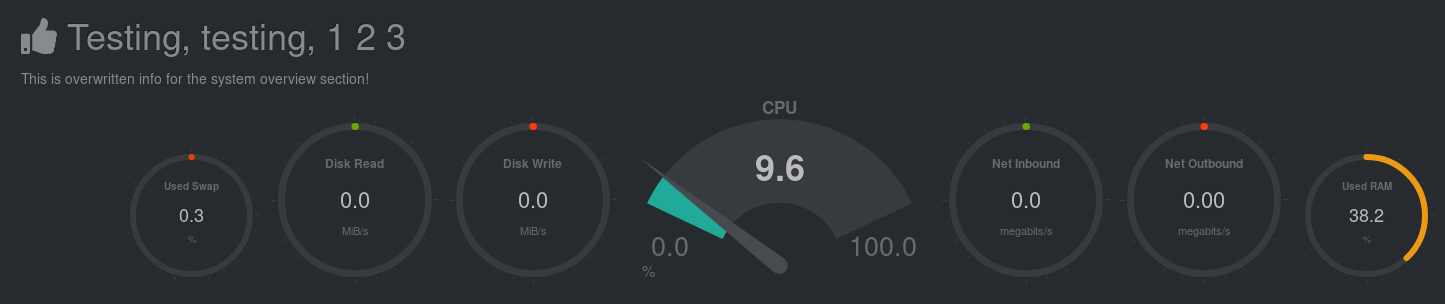 + +## Custom dashboards + +For information on creating custom dashboards from scratch, see the [custom +dashboards](custom/) or [Atlassian Confluence dashboards](confluence/) guides. [](<>) diff --git a/web/gui/browserconfig.xml b/web/gui/browserconfig.xml new file mode 100644 index 000000000..32f47595e --- /dev/null +++ b/web/gui/browserconfig.xml @@ -0,0 +1,2 @@ +<?xml version="1.0" encoding="utf-8"?> +<browserconfig><msapplication><tile><square70x70logo src="images/ms-icon-70x70.png"/><square150x150logo src="images/ms-icon-150x150.png"/><square310x310logo src="images/ms-icon-310x310.png"/><TileColor>#ffffff</TileColor></tile></msapplication></browserconfig> diff --git a/web/gui/console.html b/web/gui/console.html index 9b172644e..b85b4ffbd 100644 --- a/web/gui/console.html +++ b/web/gui/console.html @@ -66,7 +66,7 @@ var netdataTheme = "white" var netdataNoBootstrap = true </script> - <script type="text/javascript" src="dashboard.js?v20190523"></script> + <script type="text/javascript" src="dashboard.js?v20190902-0"></script> </body> </html>
\ No newline at end of file diff --git a/web/gui/custom/README.md b/web/gui/custom/README.md index 68d8bbb56..c7bb83404 100644 --- a/web/gui/custom/README.md +++ b/web/gui/custom/README.md @@ -2,45 +2,57 @@ You can: -- create your own dashboards using simple HTML (no javascript is required for basic dashboards) +- create your own dashboards using simple HTML (no javascript is required for + basic dashboards) - utilizing any or all of the available chart libraries, on the same dashboard - using data from one or more Netdata servers, on the same dashboard - host your dashboard HTML page on any web server, anywhere -Netdata charts can also be added to existing web pages. +You can also add Netdata charts to existing web pages. -Check this **[very simple working example of a custom dashboard](http://netdata.firehol.org/demo.html)**, and its **[html source](../demo.html)**. +Check this **[very simple working example of a custom +dashboard](http://netdata.firehol.org/demo.html)**, and its **[html +source](../demo.html)**. -You should also look at the **[custom dashboard template](https://my-netdata.io/dashboard.html)**, that contains samples of all supported charts. The code is [here](../dashboard.html). +You should also look at the [custom dashboard +template](https://my-netdata.io/dashboard.html), which contains samples of all +supported charts. The code is [here](../dashboard.html). -If you plan to put the dashboard on TV, check **[tv.html](../tv.html)**. This is a screenshot of it, monitoring 2 servers on the same page: +If you plan to put the dashboard on TV, check out [tv.html](../tv.html). Here's +is a screenshot of it, monitoring two servers on the same page:  --- + +-- ## Web directory -All of the mentioned examples are available on your local Netdata installation (e.g. `http://myhost:19999/dashboard.html`). The default web root directory with the HTML and JS code is `/usr/share/netdata/web`. The main dashboard is also in that directory and called `index.html`.\ -Note: index.html has a different syntax. Don't use it as a template for simple custom dashboards. +All of the mentioned examples are available on your local Netdata installation +(e.g. `http://myhost:19999/dashboard.html`). The default web root directory with +the HTML and JS code is `/usr/share/netdata/web`. The main dashboard is also in +that directory and called `index.html`.\ +Note: index.html has a different syntax. Don't use it as a template for simple +custom dashboards. ## Example empty dashboard -If you need to create a new dashboard on an empty page, we suggest the following header: +If you need to create a new dashboard on an empty page, we suggest the following +header: ```html <!DOCTYPE html> <html lang="en"> <head> - <title>Your dashboard</title> + <title>Your dashboard</title> - <meta http-equiv="Content-Type" content="text/html; charset=utf-8" /> - <meta charset="utf-8"> - <meta http-equiv="X-UA-Compatible" content="IE=edge,chrome=1"> - <meta name="viewport" content="width=device-width, initial-scale=1"> - <meta name="apple-mobile-web-app-capable" content="yes"> - <meta name="apple-mobile-web-app-status-bar-style" content="black-translucent"> + <meta http-equiv="Content-Type" content="text/html; charset=utf-8" /> + <meta charset="utf-8"> + <meta http-equiv="X-UA-Compatible" content="IE=edge,chrome=1"> + <meta name="viewport" content="width=device-width, initial-scale=1"> + <meta name="apple-mobile-web-app-capable" content="yes"> + <meta name="apple-mobile-web-app-status-bar-style" content="black-translucent"> - <!-- here we will add dashboard.js --> + <!-- here we will add dashboard.js --> </head> <body> @@ -51,75 +63,143 @@ If you need to create a new dashboard on an empty page, we suggest the following </html> ``` +## Dash (Multi-Host Dashboard) + +`dash-example.html` is an all-in-one page that automatically fetches graphs from all your hosts. Just add your graphs and charts (or use the defaults) one time using the `dash-*` syntax and it will be automatically replicated for all of your hosts; showing alarms and graphs for all your hosts on **one page!** + +### Configure Dash + +First, rename the file so it doesn't get overwritten. For instance, with a webroot at `/usr/share/netdata/web`: +``` +cp /usr/share/netdata/web/dash-example.html /usr/share/netdata/web/dash.html +``` + +Change the following line in `dash.html` to reflect your URLs. The second URL is used if you access your netdata dashboard from a reverse proxy. The reverse proxy URL is optional, if it is not set then both will use the netdata host URL. + +```js +/* +* TUTORIAL: Change this to the URL of your netdata host +* If you use netdata behind a reverse proxy, add a second parameter for the reverse proxy url like so: +* new Dash('http://localhost:19999', 'https://my-domain.com/stats'); +*/ +var dash = new Dash('http://localhost:19999'); +``` + +If you want to change the graphs or styling to fit your needs, just add an element to the page as shown. child divs will be generated to create your graph/chart: +``` +<div class="dash-graph" <---- Use class dash-graph for line graphs, etc + data-dash-netdata="system.cpu" <---- REQUIRED: Use data-dash-netdata to set the data source + data-dygraph-valuerange="[0, 100]"> <---- OPTIONAL: This overrides the default config. Any other data-* attributes will +</div> be added to the generated div, so you can set any desired options here + +<div class="dash-chart" <---- Use class dash-chart for pie charts, etc. CHARTS ARE SQUARE + data-dash-netdata="system.io" <---- REQUIRED: Use data-dash-netdata to set the data source + data-dimensions="in" <---- Use this to override or append default options + data-title="Disk Read" <---- Use this to override or append default options + data-common-units="dash.io"> <---- Use this to override or append default options +</div> +``` + +To change the sizes of graphs and charts, find the `Dash.options` object in `dash.html` and set your preferences: +```js +/* +* TUTORIAL: Change your graph/chart dimensions here. Host columns will automatically adjust. +* Charts are square! Their width is the same as their height. +*/ +this.options = { + graph_width: '40em', + graph_height: '20em', + chart_width: '10em' // Charts are square +}; +``` + +To change the display order of your hosts, which is saved in localStorage, click the settings gear in the lower right corner + + ## dashboard.js -To add Netdata charts to any web page (dedicated to Netdata or not), you need to include the `/dashboard.js` file of a Netdata server. +To add Netdata charts to any web page (dedicated to Netdata or not), you need to +include the `/dashboard.js` file of a Netdata server. -For example, if your Netdata server listens at `http://box:19999/`, you will need to add the following to the `head` section of your web page: +For example, if your Netdata server listens at `http://box:19999/`, you will +need to add the following to the `head` section of your web page: ```html <script type="text/javascript" src="http://box:19999/dashboard.js"></script> ``` -### what dashboard.js does? +### What does dashboard.js do? `dashboard.js` will automatically load the following: 1. `dashboard.css`, required for the Netdata charts -2. `jquery.min.js`, (only if jquery is not already loaded for this web page) +2. `jquery.min.js`, (only if jQuery is not already loaded for this web page) -3. `bootstrap.min.js` (only if bootstrap is not already loaded) and `bootstrap.min.css`. +3. `bootstrap.min.js` (only if Bootstrap is not already loaded) and + `bootstrap.min.css`. - You can disable this by adding the following before loading `dashboard.js`: + You can disable this by adding the following before loading `dashboard.js`: ```html <script>var netdataNoBootstrap = true;</script> ``` -4. `jquery.nanoscroller.min.js`, required for the scrollbar of the chart legends. +4. `jquery.nanoscroller.min.js`, required for the scrollbar of the chart + legends. -5. `bootstrap-toggle.min.js` and `bootstrap-toggle.min.css`, required for the settings toggle buttons. +5. `bootstrap-toggle.min.js` and `bootstrap-toggle.min.css`, required for the + settings toggle buttons. 6. `font-awesome.min.css`, for icons. -When `dashboard.js` loads will scan the page for elements that define charts (see below) and immediately start refreshing them. Keep in mind more javascript modules may be loaded (every chart library is a different javascript file, that is loaded on first use). +When `dashboard.js` loads will scan the page for elements that define charts +(see below) and immediately start refreshing them. Keep in mind more javascript +modules may be loaded (every chart library is a different javascript file, that +is loaded on first use). ### Prevent dashboard.js from starting chart refreshes -If your web page is not static and you plan to add charts using javascript, you can tell `dashboard.js` not to start processing charts immediately after loaded, by adding this fragment before loading it: +If your web page is not static and you plan to add charts using JavaScript, you +can tell `dashboard.js` not to start processing charts immediately after loaded, +by adding this fragment before loading it: ```html <script>var netdataDontStart = true;</script> -``` +`" The above, will inform the `dashboard.js` to load everything, but not process the web page until you tell it to. You can tell it to start processing the page, by running this javascript code: ```js NETDATA.start(); -``` +`" -Be careful not to call the `NETDATA.start()` multiple times. Each call to this function will spawn a new thread that will start refreshing the charts. +Be careful not to call the `NETDATA.start()` multiple times. Each call to this +function will spawn a new thread that will start refreshing the charts. -If, after calling `NETDATA.start()` you need to update the page (or even get your javascript code synchronized with `dashboard.js`), you can call (after you loaded `dashboard.js`): +If, after calling `NETDATA.start()` you need to update the page (or even get +your javascript code synchronized with `dashboard.js`), you can call (after you +loaded `dashboard.js`): ```js NETDATA.pause(function() { - // ok, it is paused + // ok, it is paused - // update the DOM as you wish + // update the DOM as you wish - // and then call this to let the charts refresh: - NETDATA.unpause(); + // and then call this to let the charts refresh: + NETDATA.unpause(); }); ``` ### The default Netdata server -`dashboard.js` will attempt to auto-detect the URL of the Netdata server it is loaded from, and set this server as the default Netdata server for all charts. +`dashboard.js` will attempt to auto-detect the URL of the Netdata server it is +loaded from, and set this server as the default Netdata server for all charts. -If you need to set any other URL as the default Netdata server for all charts that do not specify a Netdata server, add this before loading `dashboard.js`: +If you need to set any other URL as the default Netdata server for all charts +that do not specify a Netdata server, add this before loading `dashboard.js`: ```html <script type="text/javascript">var netdataServer = "http://your.netdata.server:19999";</script> @@ -129,11 +209,15 @@ If you need to set any other URL as the default Netdata server for all charts th ## Adding charts -To add charts, you need to add a `div` for each of them. Each of these `div` elements accept a few `data-` attributes: +To add charts, you need to add a `div` for each of them. Each of these `div` +elements accept a few `data-` attributes: ### The chart unique ID -The unique ID of a chart is shown at the title of the chart of the default Netdata dashboard. You can also find all the charts available at your Netdata server with this URL: `http://your.netdata.server:19999/api/v1/charts` ([example](http://netdata.firehol.org/api/v1/charts)). +The unique ID of a chart is shown at the title of the chart of the default +Netdata dashboard. You can also find all the charts available at your Netdata +server with this URL: `http://your.netdata.server:19999/api/v1/charts` +([example](http://netdata.firehol.org/api/v1/charts)). To specify the unique id, use this: @@ -141,26 +225,34 @@ To specify the unique id, use this: <div data-netdata="unique.id"></div> ``` -The above is enough for adding a chart. It most probably have the wrong visual settings though. Keep reading... +The above is enough for adding a chart. It most probably have the wrong visual +settings though. Keep reading... ### The duration of the chart -You can specify the duration of the chart (how much time of data it will show) using: +You can specify the duration of the chart (how much time of data it will show) +using: ```html <div data-netdata="unique.id" - data-after="AFTER_SECONDS" - data-before="BEFORE_SECONDS" - ></div> + data-after="AFTER_SECONDS" + data-before="BEFORE_SECONDS" + ></div> ``` -`AFTER_SECONDS` and `BEFORE_SECONDS` are numbers representing a time-frame in seconds. +`AFTER_SECONDS` and `BEFORE_SECONDS` are numbers representing a time-frame in +seconds. The can be either: -- **absolute** unix timestamps (in javascript terms, they are `new Date().getTime() / 1000`. Using absolute timestamps you can have a chart showing always the same time-frame. +- **absolute** unix timestamps (in javascript terms, they are `new + Date().getTime() / 1000`. Using absolute timestamps you can have a chart + showing always the same time-frame. -- **relative** number of seconds to now. To show the last 10 minutes of data, `AFTER_SECONDS` must be `-600` (relative to now) and `BEFORE_SECONDS` must be `0` (meaning: now). If you want the chart to auto-refresh the current values, you need to specify **relative** values. +- **relative** number of seconds to now. To show the last 10 minutes of data, + `AFTER_SECONDS` must be `-600` (relative to now) and `BEFORE_SECONDS` must + be `0` (meaning: now). If you want the chart to auto-refresh the current + values, you need to specify **relative** values. ### Chart sizes @@ -168,122 +260,160 @@ You can set the size of the chart using this: ```html <div data-netdata="unique.id" - data-width="WIDTH" - data-height="HEIGHT" - ></div> + data-width="WIDTH" + data-height="HEIGHT" + ></div> ``` -`WIDTH` and `HEIGHT` can be anything CSS accepts for width and height (e.g. percentages, pixels, etc). -Keep in mind that for certain chart libraries, `dashboard.js` may apply an aspect ratio to these. +`WIDTH` and `HEIGHT` can be anything CSS accepts for width and height (e.g. +percentages, pixels, etc). Keep in mind that for certain chart libraries, +`dashboard.js` may apply an aspect ratio to these. -If you want `dashboard.js` to remember permanently (browser local storage) the dimensions of the chart (the user may resize it), you can add: `data-id="SETTINGS_ID"`, where `SETTINGS_ID` is anything that will be common for this chart across user sessions. +If you want `dashboard.js` to permanently remember (browser local storage) the +dimensions of the chart (the user may resize it), you can add: `data-id=" +SETTINGS_ID"`, where `SETTINGS_ID` is anything that will be common for this +chart across user sessions. ### Netdata server -Each chart can get data from a different Netdata server. You can give per chart the Netdata server using: +Each chart can get data from a different Netdata server. You can specify the Netdata server to use for each chart using: ```html <div data-netdata="unique.id" - data-host="http://another.netdata.server:19999/" - ></div> + data-host="http://another.netdata.server:19999/" + ></div> ``` -If you have ephemeral monitoring setup ([More info here](../../../streaming/#monitoring-ephemeral-nodes)) and have no direct access to the nodes dashboards, you can use the following: +If you have ephemeral monitoring setup ([More info +here](../../../streaming/#monitoring-ephemeral-nodes)) and have no direct access +to the nodes dashboards, you can use the following: ```html <div data-netdata="unique.id" - data-host="http://yournetdata.server:19999/host/reported-hostname" - ></div> + data-host="http://yournetdata.server:19999/host/reported-hostname" + ></div> ``` ### Chart library -The default chart library is `dygraph`. You set a different chart library per chart using this: +Netdata supports a number of chart libraries. The default chart library is +`dygraph`, but you can set a different chart library per chart using +`data-chart-library`: ```html <div data-netdata="unique.id" - data-chart-library="gauge" - ></div> + data-chart-library="gauge" + ></div> ``` -Each chart library may support more chart-library specific settings. Please refer to the documentation of the chart library you are interested, in this wiki or the source code: - -- options `data-dygraph-XXX` [here](https://github.com/netdata/netdata/blob/643cfe20a8d8beba0ed31ec6afaade80853fd310/web/dashboard.js#L6251-L6361) -- options `data-easypiechart-XXX` [here](https://github.com/netdata/netdata/blob/643cfe20a8d8beba0ed31ec6afaade80853fd310/web/dashboard.js#L7954-L7966) -- options `data-gauge-XXX` [here](https://github.com/netdata/netdata/blob/643cfe20a8d8beba0ed31ec6afaade80853fd310/web/dashboard.js#L8182-L8189) -- options `data-d3pie-XXX` [here](https://github.com/netdata/netdata/blob/643cfe20a8d8beba0ed31ec6afaade80853fd310/web/dashboard.js#L7394-L7561) -- options `data-sparkline-XXX` [here](https://github.com/netdata/netdata/blob/643cfe20a8d8beba0ed31ec6afaade80853fd310/web/dashboard.js#L5940-L5985) -- options `data-peity-XXX` [here](https://github.com/netdata/netdata/blob/643cfe20a8d8beba0ed31ec6afaade80853fd310/web/dashboard.js#L5892) +Each chart library has a number of specific settings. To learn more about them, +you should investigate the documentation of the given chart library, or visit +the appropriate JavaScript file that defines the library's options. These files +are concatenated into the monolithin `dashboard.js` for deployment. + +- [Dygraph](https://github.com/netdata/netdata/blob/5b57fc441c40959514c4e2d0863be2e6a417e352/web/gui/dashboard.js#L2034) +- [d3](https://github.com/netdata/netdata/blob/5b57fc441c40959514c4e2d0863be2e6a417e352/web/gui/dashboard.js#L4095) +- [d3pie](https://github.com/netdata/netdata/blob/5b57fc441c40959514c4e2d0863be2e6a417e352/web/gui/dashboard.js#L3753) +- [Gauge.js](https://github.com/netdata/netdata/blob/5b57fc441c40959514c4e2d0863be2e6a417e352/web/gui/dashboard.js#L3065) +- [Google Charts](https://github.com/netdata/netdata/blob/5b57fc441c40959514c4e2d0863be2e6a417e352/web/gui/dashboard.js#L2936) +- [EasyPieChart](https://github.com/netdata/netdata/blob/5b57fc441c40959514c4e2d0863be2e6a417e352/web/gui/dashboard.js#L3531) +- [Peity](https://github.com/netdata/netdata/blob/5b57fc441c40959514c4e2d0863be2e6a417e352/web/gui/dashboard.js#L4137) +- [Sparkline](https://github.com/netdata/netdata/blob/5b57fc441c40959514c4e2d0863be2e6a417e352/web/gui/dashboard.js#L2779) +- [Text-only](https://github.com/netdata/netdata/blob/5b57fc441c40959514c4e2d0863be2e6a417e352/web/gui/dashboard.js#L4200) ### Data points -For the time-frame requested, `dashboard.js` will use the chart dimensions and the settings of the chart library to find out how many data points it can show. +For the time-frame requested, `dashboard.js` will use the chart dimensions and +the settings of the chart library to find out how many data points it can show. -For example, most line chart libraries are using 3 pixels per data point. If the chart shows 10 minutes of data (600 seconds), its update frequency is 1 second, and the chart width is 1800 pixels, then `dashboard.js` will request from the Netdata server: 10 minutes of data, represented in 600 points, and the chart will be refreshed per second. If the user resizes the window so that the chart becomes 600 pixels wide, then `dashboard.js` will request the same 10 minutes of data, represented in 200 points and the chart will be refreshed once every 3 seconds. +For example, most line chart libraries are using 3 pixels per data point. If the +chart shows 10 minutes of data (600 seconds), its update frequency is 1 second, +and the chart width is 1800 pixels, then `dashboard.js` will request from the +Netdata server: 10 minutes of data, represented in 600 points, and the chart +will be refreshed per second. If the user resizes the window so that the chart +becomes 600 pixels wide, then `dashboard.js` will request the same 10 minutes of +data, represented in 200 points and the chart will be refreshed once every 3 +seconds. -If you need to have a fixed number of points in the data source retrieved from the Netdata server, you can set: +If you need the chart to show a fixed number of points, you can set the `data-points` option. Replace `DATA_POINTS` with the number of points you need: ```html <div data-netdata="unique.id" - data-points="DATA_POINTS" - ></div> + data-points="DATA_POINTS" + ></div> ``` -Where `DATA_POINTS` is the number of points you need. - You can also overwrite the pixels-per-point per chart using this: ```html <div data-netdata="unique.id" - data-pixels-per-point="PIXELS_PER_POINT" - ></div> + data-pixels-per-point="PIXELS_PER_POINT" + ></div> ``` Where `PIXELS_PER_POINT` is the number of pixels each data point should occupy. ### Data grouping method -Netdata supports **average** (the default), **sum** and **max** grouping methods. The grouping method is used when the Netdata server is requested to return fewer points for a time-frame, compared to the number of points available. +Netdata supports **average** (the default), **sum** and **max** grouping +methods. The grouping method is used when the Netdata server is requested to +return fewer points for a time-frame, compared to the number of points +available. You can give it per chart, using: ```html <div data-netdata="unique.id" - data-method="max" - ></div> + data-method="max" + ></div> ``` ### Changing rates -Netdata can change the rate of charts on the fly. So a charts that shows values **per second** can be turned to **per minute** (or any other, e.g. **per 10 seconds**), with this: +Netdata can change the rate of charts on the fly. So a charts that shows values +**per second** can be turned to **per minute** (or any other, e.g. **per 10 +seconds**), with this: ```html <div data-netdata="unique.id" - data-method="average" - data-gtime="60" - data-units="per minute" - ></div> + data-method="average" + data-gtime="60" + data-units="per minute" + ></div> ``` -The above will provide the average rate per minute (60 seconds). -Use 60 for `/minute`, 3600 for `/hour`, 86400 for `/day` (provided you have that many data). +The above will provide the average rate per minute (60 seconds). Use 60 for +`/minute`, 3600 for `/hour`, 86400 for `/day` (provided you have that many +data). -- The `data-gtime` setting does not change the units of the chart. You have to change them yourself with `data-units`. +- The `data-gtime` setting does not change the units of the chart. You have to + change them yourself with `data-units`. - This works only for `data-method="average"`. -- Netdata may aggregate multiple points to satisfy the `data-points` setting. For example, you request `per minute` but the requested number of points to be returned are not enough to report every single minute. In this case Netdata will sum the `per second` raw data of the database to find the `per minute` for every single minute and then **average** them to find the **average per minute rate of every X minutes**. So, it works as if the data collection frequency was per minute. +- Netdata may aggregate multiple points to satisfy the `data-points` setting. + For example, you request `per minute` but the requested number of points to + be returned are not enough to report every single minute. In this case + Netdata will sum the `per second` raw data of the database to find the `per + minute` for every single minute and then **average** them to find the + **average per minute rate of every X minutes**. So, it works as if the data + collection frequency was per minute. ### Selecting dimensions -By default, `dashboard.js` will show all the dimensions of the chart. -You can select specific dimensions using this: +By default, `dashboard.js` will show all the dimensions of the chart. You can +select specific dimensions using this: ```html <div data-netdata="unique.id" - data-dimensions="dimension1,dimension2,dimension3,..." - ></div> + data-dimensions="dimension1,dimension2,dimension3,..." + ></div> ``` -Netdata supports coma (`,`) or pipe (`|`) separated [simple patterns](../../../libnetdata/simple_pattern/) for dimensions. By default it searches for both dimension IDs and dimension NAMEs. You can control the target of the match with: `data-append-options="match-ids"` or `data-append-options="match-names"`. Spaces in `data-dimensions=""` are matched in the dimension names and IDs. +Netdata supports coma (`,`) or pipe (`|`) separated [simple +patterns](../../../libnetdata/simple_pattern/) for dimensions. By default it +searches for both dimension IDs and dimension NAMEs. You can control the target +of the match with: `data-append-options="match-ids"` or +`data-append-options="match-names"`. Spaces in `data-dimensions=""` are matched +in the dimension names and IDs. ### Chart title @@ -291,40 +421,44 @@ You can overwrite the title of the chart using this: ```html <div data-netdata="unique.id" - data-title="my super chart" - ></div> + data-title="my super chart" + ></div> ``` ### Chart units -You can overwrite the units of measurement of the dimensions of the chart, using this: +You can overwrite the units of measurement of the dimensions of the chart, using +this: ```html <div data-netdata="unique.id" - data-units="words/second" - ></div> + data-units="words/second" + ></div> ``` ### Chart colors -`dashboard.js` has an internal palette of colors for the dimensions of the charts. -You can prepend colors to it (so that your will be used first) using this: +`dashboard.js` has an internal palette of colors for the dimensions of the +charts. You can prepend colors to it (so that your will be used first) using +this: ```html <div data-netdata="unique.id" - data-colors="#AABBCC #DDEEFF ..." - ></div> + data-colors="#AABBCC #DDEEFF ..." + ></div> ``` ### Extracting dimension values -`dashboard.js` can update the selected values of the chart at elements you specify. For example, let's assume we have a chart that measures the bandwidth of eth0, with 2 dimensions `in` and `out`. You can use this: +`dashboard.js` can update the selected values of the chart at elements you +specify. For example, let's assume we have a chart that measures the bandwidth +of eth0, with 2 dimensions `in` and `out`. You can use this: ```html <div data-netdata="net.eth0" - data-show-value-of-in-at="eth0_in_value" - data-show-value-of-out-at="eth0_out_value" - ></div> + data-show-value-of-in-at="eth0_in_value" + data-show-value-of-out-at="eth0_out_value" + ></div> My eth0 interface, is receiving <span id="eth0_in_value"></span> and transmitting <span id="eth0_out_value"></span>. @@ -332,12 +466,13 @@ and transmitting <span id="eth0_out_value"></span>. ### Hiding the legend of a chart -On charts that by default have a legend managed by `dashboard.js` you can remove it, using this: +On charts that by default have a legend managed by `dashboard.js` you can remove +it, using this: ```html <div data-netdata="unique.id" - data-legend="no" - ></div> + data-legend="no" + ></div> ``` ### API options @@ -346,69 +481,167 @@ You can append Netdata **[REST API v1](../../api)** data options, using this: ```html <div data-netdata="unique.id" - data-append-options="absolute,percentage" - ></div> + data-append-options="absolute,percentage" + ></div> ``` A few useful options are: -- `absolute` to show all values are absolute (i.e. turn negative dimensions to positive) -- `percentage` to express the values as a percentage of the chart total (so, the values of the dimensions are added, and the sum of them if expressed as a percentage of the sum of all dimensions) -- `unaligned` to prevent Netdata from aligning the charts (e.g. when requesting 60 seconds aggregation per point, Netdata returns chart data aligned to XX:XX:00 to XX:XX:59 - similarly for hours, days, etc - the `unaligned` option disables this feature) -- `match-ids` or `match-names` is used to control what `data-dimensions=` will match. +- `absolute` to show all values are absolute (i.e. turn negative dimensions to + positive) +- `percentage` to express the values as a percentage of the chart total (so, + the values of the dimensions are added, and the sum of them if expressed as + a percentage of the sum of all dimensions) +- `unaligned` to prevent Netdata from aligning the charts (e.g. when + requesting 60 seconds aggregation per point, Netdata returns chart data + aligned to XX:XX:00 to XX:XX:59 - similarly for hours, days, etc - the + `unaligned` option disables this feature) +- `match-ids` or `match-names` is used to control what `data-dimensions=` will + match. ### Chart library performance -`dashboard.js` measures the performance of the chart library when it renders the charts. You can specify an element ID you want this information to be visualized, using this: +`dashboard.js` measures the performance of the chart library when it renders the +charts. You can specify an element ID you want this information to be +visualized, using this: ```html <div data-netdata="unique.id" - data-dt-element-name="measurement1" - ></div> + data-dt-element-name="measurement1" + ></div> refreshed in <span id="measurement1"></span> milliseconds! ``` ### Syncing charts y-range -If you give the same `data-common-max="NAME"` to 2+ charts, then all of them will share the same max value of their y-range. If one spikes, all of them will be aligned to have the same scale. This is done for the cpu interrupts and and cpu softnet charts at the dashboard and also for the `gauge` and `easypiecharts` of the Netdata home page. +If you give the same `data-common-max="NAME"` to 2+ charts, then all of them +will share the same max value of their y-range. If one spikes, all of them will +be aligned to have the same scale. This is done for the cpu interrupts and and +cpu softnet charts at the dashboard and also for the `gauge` and `easypiecharts` +of the Netdata home page. ```html <div data-netdata="chart1" - data-common-max="chart-group-1" - ></div> + data-common-max="chart-group-1" + ></div> <div data-netdata="chart2" - data-common-max="chart-group-1" - ></div> + data-common-max="chart-group-1" + ></div> ``` The same functionality exists for `data-common-min`. ### Syncing chart units -Netdata dashboards support auto-scaling of units. So, `MB` can become `KB`, `GB`, etc dynamically, based on the value to be shown. +Netdata dashboards support auto-scaling of units. So, `MB` can become `KB`, +`GB`, etc dynamically, based on the value to be shown. -Giving the same `NAME` with `data-common-units="NAME"`, 2+ charts can be forced to always have the same units. +Giving the same `NAME` with `data-common-units= "NAME"`, 2+ charts can be forced +to always have the same units. ```html <div data-netdata="chart1" - data-common-units="chart-group-1" - ></div> + data-common-units="chart-group-1" + ></div> <div data-netdata="chart2" - data-common-units="chart-group-1" - ></div> + data-common-units="chart-group-1" + ></div> ``` ### Setting desired units -Charts can be scaled to specific units with `data-desired-units="UNITS"`. If the dashboard can convert the units to the desired one, it will do. +Charts can be scaled to specific units with `data-desired-units=" UNITS"`. If +the dashboard can convert the units to the desired one, it will do. ```html <div data-netdata="chart1" - data-desired-units="GB" - ></div> + data-desired-units="GB" + ></div> ``` -[](<>) +## Chart library settings + +### Dygraph + +You can set the min and max values of the y-axis using +`data-dygraph-valuerange=" [MIN, MAX] "`. + +### EasyPieChart + +#### Value range + +You can set the max value of the chart using the following snippet: + +```html +<div data-netdata="unique.id" + data-chart-library="easypiechart" + data-easypiechart-max-value="40" + ></div> +``` + +Be aware that values that exceed the max value will get expanded (e.g. "41" is +still 100%). Similar for the minimum: + +```html +<div data-netdata="unique.id" + data-chart-library="easypiechart" + data-easypiechart-min-value="20" + ></div> +``` + +If you specify both minimum and maximum, the rendering behavior changes. Instead +of displaying the `value` based from zero, it is now based on the range that is +provided by the snippet: + +```html +<div data-netdata="unique.id" + data-chart-library="easypiechart" + data-easypiechart-min-value="20" + data-easypiechart-max-value="40" + ></div> +`" +In the first example, a value of `30`, without specifying the minimum, fills the chart bar to '75 %` (100% / 40 * 30). However, in this example the range is now `20` (40 - 20 = 20). The value `30` will fill the chart to ** '50 %`**, since it's in the middle between 20 and 40. + +This szenario is useful if you have metrics that change only within a specific range, e.g. temperatures that are very unlikely to fall out of range. In these cases it is more useful to have the chart render the values between the given min and max, to better highlight the changes within them. + +#### Negative values + +EasyPieCharts can render negative values with the following flag: +```html +<div data-netdata="unique.id" + data-chart-library="easypiechart" + data-override-options="signed" + ></div> +``` +Negative values are rendered counter-clockwise. + +#### Full example with EasyPieChart + +This is a chart that displays the hotwater temperature in the given range of 40 +to 50. +```html +<div data-netdata="stiebeleltron_system.hotwater.hotwatertemp" + data-title="Hot Water Temperature" + data-decimal-digits="1" + data-chart-library="easypiechart" + data-colors="#FE3912" + data-width="55%" + data-height="50%" + data-points="1200" + data-after="-1200" + data-dimensions="actual" + data-units="°C" + data-easypiechart-max-value="50" + data-easypiechart-min-value="40" + data-common-max="netdata-hotwater-max" + data-common-min="netdata-hotwater-min" +></div> +``` + + + +[]() diff --git a/web/gui/dash-example.html b/web/gui/dash-example.html new file mode 100644 index 000000000..55cd6400c --- /dev/null +++ b/web/gui/dash-example.html @@ -0,0 +1,1015 @@ +<!DOCTYPE html> +<html lang="en"> +<head> + <meta http-equiv="Content-Type" content="text/html; charset=utf-8"> + <meta charset="utf-8"> + <meta http-equiv="X-UA-Compatible" content="IE=edge,chrome=1"> + <meta name="viewport" content="width=device-width, initial-scale=1"> + <meta name="apple-mobile-web-app-capable" content="yes"> + <meta name="apple-mobile-web-app-status-bar-style" content="black-translucent"> +</head> +<body> + <div id="alarms" class="collapsed"> + <div class="alarm-collapse-button" onclick="dash.toggle_alarm_collapse()">›</div> + <span class="alarm-count"></span> + <h1>Alarms</h1> + <div class="alarm-host-list"></div> + <div class="settings-button" onclick="dash.reorder_hosts()">⚙</div> + </div> + <div id="dash"> + <div class="netdata-host-stats-container template"> + <div class="drag-anchor"></div> + <div class="netdata-host-name">host</div> + <div class="netdata-host-stats"> + <div class="dash-graph" + data-dash-netdata="system.cpu" + data-dygraph-valuerange="[0, 100]"> + </div> + <div class="dash-graph" + data-dash-netdata="system.load"> + </div> + <div class="dash-graph" + data-dash-netdata="system.ram"> + </div> + <div class="dash-graph" + data-dash-netdata="system.net"> + </div> + <div class="dash-graph" + data-dash-netdata="system.processes"> + </div> + <div class="dash-graph" + data-dash-netdata="apps.cpu"> + </div> + <div class="dash-graph" + data-dash-netdata="apps.mem"> + </div> + <div class="dash-charts"> + <div class="dash-chart" + data-dash-netdata="system.io" + data-dimensions="in" + data-title="Disk Read" + data-common-units="dash.io"> + </div> + <div class="dash-chart" + data-dash-netdata="system.io" + data-dimensions="out" + data-title="Disk Write" + data-common-units="dash.io"> + </div> + <div class="dash-chart" + data-dash-netdata="system.cpu" + data-chart-library="gauge" + data-title="CPU" + data-units="%" + data-gauge-max-value="100" + data-colors="#22AA99" + data-gauge-stroke-color="#373B40"> + </div> + <div class="dash-chart" + data-dash-netdata="system.net" + data-dimensions="received" + data-title="Net Inbound" + data-common-units="dash.net"> + </div> + <div class="dash-chart" + data-dash-netdata="system.net" + data-dimensions="sent" + data-title="Net Outbound" + data-common-units="dash.net"> + </div> + <div class="dash-chart" + data-dash-netdata="system.ram" + data-dimensions="used|buffers|active|wired" + data-append-options="percentage" + data-title="Used RAM" + data-units="%" + data-easypiechart-max-value="100" + data-colors="#EE9911"> + </div> + </div> + </div> + </div> + </div> +</body> +<script + src="https://code.jquery.com/jquery-3.4.1.min.js" + integrity="sha256-CSXorXvZcTkaix6Yvo6HppcZGetbYMGWSFlBw8HfCJo=" + crossorigin="anonymous"> +</script> +<script type="text/javascript"> +class PickNSort { + // PickNSort.js + + constructor (dark) { + this.items = []; + this.callback = function (output, disabled) { console.log(output, disabled) }; + this.reset = function () { this.items = [] }; + this.last_output = { + enabled: [], + disabled: [] + } + + this.add_css_to_page(dark); + } + + create_modal () { + $("<div></div>", { + id: "picknsort-container" + }).appendTo('body'); + + $("<div></div>", { + id: 'picknsort-window' + }).appendTo('#picknsort-container'); + + $("<div></div>", { + id: "picknsort-close-button", + text: '\u2573' + }).appendTo('#picknsort-window'); + + $("<div></div>", { + id: "picknsort-item-list" + }).appendTo('#picknsort-window') + + $("<div></div>", { + text: "Apply", + id: "picknsort-apply-button" + }).appendTo('#picknsort-window'); + + $("<div></div>", { + text: "Reset", + id: "picknsort-reset-button" + }).appendTo('#picknsort-window'); + + $('#picknsort-close-button').click(function () { + picknsort.destroy_modal(); + picknsort.callback(null, null); + }); + + $('#picknsort-apply-button').click(function () { + picknsort.apply(); + }); + + $('#picknsort-reset-button').click(function () { + picknsort.reset(); + }); + } + + destroy_modal () { + $('#picknsort-container').remove(); + } + + populate_list () { + this.clear_list(); + + for (var i=0, len=this.items.length; i<len; i++) { + this.draw_item(i); + } + } + + draw_item (index) { + var item = this.items[index]; + + var $item = $("<div></div>").addClass("picknsort-item"); + + var $checkbox= $("<div></div>").addClass('picknsort-item-checkbox-wrapper'); + + $("<input>", { + type: "checkbox", + checked: item.enabled + }).addClass('picknsort-item-checkbox') + .appendTo($checkbox); + + var $value = $("<div></div>", { + text: item.value + }).addClass("picknsort-item-value"); + + var $nav = $("<div></div>").addClass("picknsort-item-nav") + .append("<div class='picknsort-item-down' data-index='" + index + "' onclick='picknsort.shift_down(this)'>↓</div>") + .append("<div class='picknsort-item-up' data-index='" + index + "' onclick='picknsort.shift_up(this)'>↑</div>"); + + $item.append($checkbox).append($value).append($nav).appendTo('#picknsort-item-list'); + } + + clear_list () { + $('#picknsort-item-list').html(''); + } + + popup (callback, reset, options={}) { + this.callback = callback || this.callback; + this.reset = reset || this.reset; + if (!options.enabled) { + options.enabled = this.last_output.enabled; + } + if (!options.disabled) { + options.disabled = this.last_output.disabled; + } + + this.parse_items(options.enabled, options.disabled); + if (this.items.length) { + this.create_modal(); + this.populate_list(); + } + + } + + parse_items (enabled, disabled) { + this.items = []; + + for (var i=0, len=enabled.length; i<len; i++) { + this.items.push({ + value: enabled[i], + enabled: true + }); + } + + for (var i=0, len=disabled.length; i<len; i++) { + this.items.push({ + value: disabled[i], + enabled: false + }); + } + } + + shift_down (el) { + var index = $(el).data('index'); + if (index === this.items.length - 1) { + return; + } + var temp = this.items[index]; + this.items[index] = this.items[index + 1]; + this.items[index + 1] = temp; + this.move_element_down(index); + } + + shift_up (el) { + var index = $(el).data('index'); + if (index === 0) { + return; + } + var temp = this.items[index]; + this.items[index] = this.items[index - 1]; + this.items[index - 1] = temp; + this.move_element_up(index); + } + + move_element_up (index) { + var $src = $('.picknsort-item:eq(' + index + ')'); + var $dest = $('.picknsort-item:eq(' + (index-1) + ')'); + $src.insertBefore($dest); + + // Update data-index + $src.find('.picknsort-item-down, .picknsort-item-up').data("index", index-1); + $dest.find('.picknsort-item-down, .picknsort-item-up').data("index", index); + } + + move_element_down (index) { + var $src = $('.picknsort-item:eq(' + index + ')'); + var $dest = $('.picknsort-item:eq(' + (index+1) + ')'); + $src.insertAfter($dest); + + // Update data-index + $src.find('.picknsort-item-down, .picknsort-item-up').data("index", index+1); + $dest.find('.picknsort-item-down, .picknsort-item-up').data("index", index); + } + + apply () { + var out = []; + for (var i=0, len=this.items.length; i<len; i++) { + out.push(this.items[i].value); + } + var disabled = []; + $('input.picknsort-item-checkbox:not(:checked)').each(function (elindex) { + var itemindex = $('input.picknsort-item-checkbox').index($(this)); + // Adjust for deleted elements + var spliceindex = itemindex - (1 * elindex); + var del = out.splice(spliceindex, 1); + disabled.push(del[0]); + }); + this.callback(out, disabled); + this.last_output = { + enabled: out, + disabled: disabled + } + this.destroy_modal(); + } + + add_css_to_page (dark) { + var light_theme = { + windowbg: "#FFF", + itembg: "#F4F4F4", + itemcolor: "#535353" + } + var dark_theme = { + windowbg: "#444", + itembg: "#333", + itemcolor: "#DBDBDB" + } + var current_theme = (dark) ? dark_theme : light_theme; + $("<style>") + .prop("type", "text/css") + .html(` +#picknsort-container { + position: fixed; + z-index: 9999 !important; + top: 0; + bottom: 0; + left: 0; + right: 0; + background: rgba(0,0,0,0.5); +} +#picknsort-window { + max-height: 90vh; + width: 40em; + background: ${current_theme.windowbg}; + position: absolute; + top: 5em; + left: calc(50% - 20em); + padding: 2em; + padding-top: 4em; +} +#picknsort-close-button { + position: absolute; + top: 1em; + font-size: 1.5em; + color: #666; + right: 1em; + cursor: pointer; +} +#picknsort-item-list { + max-height: 60vh; + overflow-y: scroll; + margin-bottom: 1em; +} +#picknsort-apply-button, #picknsort-reset-button { + text-align: center; + font-size: 1.5em; + padding: 1em; + background: rgb(106, 232, 165); + font-weight: bold; + color: #FFF; + cursor: pointer; + margin-top: 1em; +} +#picknsort-reset-button { + background: #CCC; +} +.picknsort-item { + padding: 1em; + border-top: solid 1px #CCC; + margin-bottom: 1em; + position: relative; + background: ${current_theme.itembg}; + color: ${current_theme.itemcolor} +} +.picknsort-item-checkbox-wrapper { + position: absolute; + top: 0; + left: 0; + bottom: 0; + width: 3em; + text-align: center; +} +.picknsort-item-checkbox { + transform: scale(1.5); + margin-top: 1.3em !important; +} +.picknsort-item-value { + margin-left: 3em; +} +.picknsort-item-nav { + font-size: 2em; + position: absolute; + right: 0; + top: 0; + bottom: 0; + color: #CCC; + cursor: pointer; +} +.picknsort-item-down, .picknsort-item-up { + display: inline-block; + padding: 0em 0.5em; + height: calc(100% - 0.2em); +} + `).appendTo("head"); + } +} +</script> +<script type="text/javascript"> + // Dash JS + + function picknsort_setup () { + if (localStorage.getItem('netdata_ordered_hosts')) { + picknsort.last_output = JSON.parse(localStorage.getItem('netdata_ordered_hosts')); + } else { + picknsort.last_output = { + enabled: dash.netdata_info.mirrored_hosts, + disabled: [] + } + } + } + + class Dash { + constructor (base_url, link_base_url) { + this.base_url = base_url; // URL of netdata host, with port + this.link_base_url = link_base_url || base_url; // Reverse proxy URL (Optional) + this.link_base_url; + this.netdata_info; + this.current_alarms = {}; + this.new_alarms = {}; + this.first_build = true; + /* + * TUTORIAL: Change your graph/chart dimensions here. Host columns will automatically adjust. + * Charts are square! Their width is the same as their height. + */ + this.options = { + graph_width: '40em', + graph_height: '20em', + chart_width: '10em' // Charts are square + }; + + this.init(); + } + + reorder_hosts () { + picknsort.popup(dash.update_ordered_hosts, dash.find_new_hosts); + } + + get_enabled_hosts () { + try { + return JSON.parse(localStorage.getItem('netdata_ordered_hosts')).enabled + } catch (e) { + return this.netdata_info.mirrored_hosts; + } + } + + get_ordered_hosts () { + try { + return JSON.parse(localStorage.getItem('netdata_ordered_hosts')); + } catch (e) { + return null; + } + } + + set_ordered_hosts (hosts) { + localStorage.setItem('netdata_ordered_hosts', JSON.stringify(hosts)); + location.reload(); + } + + update_ordered_hosts (enabled, disabled) { + if (enabled === null && disabled === null) { + return; + } + dash.set_ordered_hosts({ + enabled: enabled, + disabled: disabled + }); + } + + find_new_hosts () { + var newhosts = dash.netdata_info.mirrored_hosts.slice(); + var currenthosts = dash.get_ordered_hosts(); + + for (var i=0,len=currenthosts.enabled.length; i<len; i++) { + var found = newhosts.indexOf(currenthosts.enabled[i]); + + if (found > -1) { + newhosts.splice(found, 1); + } else { + currenthosts.enabled.splice(i, 1); + } + } + + for (var i=0,len=currenthosts.disabled.length; i<len; i++) { + var found = newhosts.indexOf(currenthosts.disabled[i]); + + if (found > -1) { + newhosts.splice(found, 1); + } else { + currenthosts.enabled.splice(i, 1); + } + } + + for (var i=0,len=newhosts.length; i<len; i++) { + currenthosts.enabled.push(newhosts[i]); + } + + dash.set_ordered_hosts(currenthosts); + } + + get_host_url (hostname, link) { + var base = ( link ) ? this.link_base_url : this.base_url; + return (hostname) ? base + '/host/' + hostname : base; + } + + get_api_url (hostname) { + return this.get_host_url(hostname) + '/api/v1' + } + + + init () { + var that = this; + $.get(this.get_api_url() + '/info', function (data) { + that.netdata_info = data; + picknsort_setup() + that.build(); + }); + } + + digest () { + this.fetch_active_alarms(); + this.fix_layout_errors(); + } + + build () { + // Fix vertically misaligned stats on load error + $('.dash-graph').css({ + height: this.options.graph_height, + width: this.options.graph_width + }); + $('.dash-chart').css({ + height: this.options.chart_width, // Charts are square + width: this.options.chart_width + }); + + // Fix chart alignment + $('.netdata-host-stats-container').css({ + width: 'calc(' + this.options.graph_width + ' + (2 * ' + $('.netdata-host-stats-container').css('padding-left') + '))' + }); + + var $template = $('.netdata-host-stats-container').first(); + + var hosts = this.get_enabled_hosts(); + + for (var i=0, len=hosts.length; i<len; i++) { + var hostname = hosts[i]; + $('#alarms .alarm-host-list').append('<div class="host-alarms ' + hostname + '"><a target="_blank" href="' + this.get_host_url(hostname, true) + '/"><h2>' + hostname + '</h2></a></div>'); + + $template.clone().removeClass('template').appendTo('#dash'); + var $newest = $('.netdata-host-stats-container').last(); + this.build_stats($newest, hostname); + } + + + if (this.first_build === true) { + this.remove_template_elements(); + this.first_build = false; + } + } + + build_stats ($hoststats, hostname) { + var that = this; + + $hoststats.find('.netdata-host-stats .dash-graph').each(function () { + that.build_graph($(this), hostname); + }); + + $hoststats.find('.netdata-host-stats .dash-chart').each(function () { + that.build_chart($(this), hostname); + }); + + $hoststats.find('.netdata-host-name').html('<a target="_blank" href="' + that.get_host_url(hostname, true) + '/">' + hostname + '</a>'); + } + + build_graph ($wrapper, hostname) { + var that = this; + var $graph = $('<div>', { + // Defaults + 'data-netdata': $wrapper.attr('data-dash-netdata'), + 'data-host': that.get_host_url(hostname), + 'data-before': '0', + 'data-after': '-540', + 'role': 'application', + 'data-width': that.options.graph_width, + 'data-height': that.options.graph_height + }); + + $.each($wrapper[0].attributes, function (key, node) { + if ( node.name.match(/^data-(?!dash).*/ ) ) { + $graph.attr(node.name, node.value); + } + }); + + $graph.appendTo($wrapper); + } + + build_chart ($wrapper, hostname) { + var that = this; + var $graph = $('<div>', { + // Defaults + 'data-netdata': $wrapper.attr('data-dash-netdata'), + 'data-host': that.get_host_url(hostname), + 'data-before': '0', + 'data-after': '-540', + 'data-points': '540', + 'role': 'application', + 'data-width': that.options.chart_width, + 'data-title': ' ', + 'data-easypiechart-trackcolor': "#373B40", + 'data-chart-library': 'easypiechart' + + }) + + $.each($wrapper[0].attributes, function (key, node) { + if ( node.name.match(/^data-(?!dash).*/ ) ) { + $graph.attr(node.name, node.value); + } + }); + + $graph.appendTo($wrapper); + } + + all_alarms_are_warnings () { + var out = true; + $.each(this.current_alarms, function (host, alarms) { + if (out === false) { + return false; // Maximum efficiency + } + $.each(alarms, function (name, data) { + if (data.status != "WARNING") { + out = false; + return false; + } + }); + }); + return out; + } + + update_alarm_count () { + console.log(this.all_alarms_are_warnings()); + var count = $('img.alarm-badge').length; + $('.alarm-count').text($('img.alarm-badge').length); + $('.alarm-count').removeClass('no-alarms warnings-only'); + if ( count === 0 ) { + $('.alarm-count').addClass('no-alarms'); + return + } + if (this.all_alarms_are_warnings()) { + $('.alarm-count').addClass('warnings-only'); + } + } + + fetch_active_alarms () { + var that = this; + console.log("Getting alarms..."); + var hosts = this.get_enabled_hosts(); + for (var i=0, len=hosts.length; i<len; i++) { + var hostname = hosts[i]; + + $.get(this.get_api_url(hostname) + '/alarms', function (data) { + that.new_alarms[ data.hostname ] = data.alarms; + if ( Object.keys(that.new_alarms).length === len ) { + // All responses received + if ( that.check_new_current_alarms() ) { + console.log("No alarm changes detected... Refreshing images."); + that.new_alarms = {}; + that.refresh_alarm_images(); + return; + } + + that.current_alarms = that.new_alarms; + that.new_alarms = {}; + that.draw_alarms(); + that.update_alarm_count(); + } + }); + } + } + + toggle_alarm_collapse () { + $('#alarms').toggleClass('collapsed'); + } + + check_new_current_alarms () { + // Create arrays of property names + var a = this.current_alarms; + var b = this.new_alarms; + var aProps = Object.keys(a); + var bProps = Object.keys(b); + + // If number of properties is different, + // objects are not equivalent + if (aProps.length != bProps.length) { + return false; + } + + for (var i = 0; i < aProps.length; i++) { + var propName = aProps[i]; + var aa = a[propName] + var aaProps = Object.keys(aa); + var bb = b[propName]; + var bbProps = Object.keys(bb); + + if (aaProps.length != bbProps.length) { + return false; + } + + for (var n = 0, len=aaProps.length; i < len; i++) { + if ( bb[aaProps[n]] === undefined ) { + return false; + } + } + } + + // If we made it this far, objects + // are considered equivalent + return true; + } + + refresh_alarm_images () { + // Use Math.random() to "reload" the image + $('.alarm-badge').each(function () { + var old_src = $(this).attr('src').replace(/&rand=.*/g, ""); + $(this).attr('src', old_src + "&rand=" + Math.random()); + }); + } + + draw_alarms () { + var that = this; + console.log("Drawing...", that.current_alarms); + $.each(that.current_alarms, function(hostname, alarms) { + $('#alarms .host-alarms.' + hostname + ' .alarm-badge').remove(); + $.each(alarms, function (index, alarm) { + that.draw_alarm(hostname, alarm); + }) + }); + } + + draw_alarm (hostname, alarm) { + var queryStr = '/badge.svg?alarm=' + alarm.name + '&chart=' + alarm.chart + $('<img />', { + src: this.get_api_url(hostname) + queryStr, + class: 'alarm-badge' + }).appendTo($('#alarms .host-alarms.' + hostname)); + } + + remove_template_elements () { + $('.netdata-host-stats-container').first().remove(); + } + + fix_layout_errors () { + $('.dash-graph:contains("chart not found")').html('<div class="loading-error">Not found</div>'); + $('.dash-chart:contains("chart not found")').html('<div class="loading-error">Not found</div>'); + } + } + + /* + * TUTORIAL: Change this to the URL of your netdata host + * If you use netdata behind a reverse proxy, add a second parameter for the reverse proxy url like so: + * new Dash('http://localhost:19999', 'https://my-domain.com/stats'); + */ + var dash = new Dash('http://localhost:19999'); + + var picknsort = new PickNSort(true); + + // Import dashboard.js + $.getScript(dash.base_url + '/dashboard.js', function() { + console.log("Loaded dashboard.js"); + setTimeout(function () { + $('#alarms').css("visibility", "visible"); + }, 400); + }); + + setInterval(function () { + dash.digest(); + }, 6 * 1000); + +</script> +<style type="text/css"> + body { + background-color: #272b30; + } + + a, a:hover { + color: #AAA !important; + } + + #dash { + overflow: scroll; + width: 100vw; + white-space: nowrap; + height: 100vh; + + } + + #alarms { + display: block; + z-index: 9999; + position: fixed; + right: 0; + top: 0; + bottom: 0; + background-color: #111; + width: 23em; + padding: 1em; + color: #AAA; + box-shadow: 0 0 3em #060606; + border: solid 1px #2d2d2d; + visibility: hidden; + } + + + + #alarms h1 { + text-align: center; + margin: 0; + margin-bottom: 0.5em; + margin-top: -0.1em; + font-size: 2em; + } + + #alarms h2 { + font-size: 1.5em; + } + + #alarms .alarm-collapse-button { + position: absolute; + top: 0; + left: 0; + width: 0.9em; + height: 0.9em; + font-size: 4em; + line-height: 0.8; + background: #111; + text-align: center; + cursor: default; + } + + #alarms .alarm-collapse-button:hover { + background: #000; + } + + #alarms.collapsed { + width: 4em; + } + + #alarms.collapsed .alarm-collapse-button { + position: fixed; + left: auto; + right: 0; + top: 0; + bottom: 0; + width: 4em; + height: 100vh; + opacity: 0; + z-index: 9999; + } + + #alarms.collapsed h1 { + transform: rotate(-90deg); + position: absolute; + left: -9.1em; + top: 4em; + width: 20em; + } + + #alarms .alarm-host-list { + margin-top: 1em; + height: 100%; + overflow-y: scroll; + scrollbar-width: thin; + } + + #alarms.collapsed .alarm-host-list { + display: none; + } + + + + #alarms .host-alarms { + background: #1d1d1d; + margin-bottom: 1em; + padding: 0.2em 1em; + padding-bottom: 1.5em; + border-top: 1px solid; + position: relative; + } + + .host-alarms a:last-child:after { + position: absolute; + display: block; + content: 'no alarms'; + width: 6em; + height: 1em; + right: 0; + top: 2em; + color: #646464; + } + + #alarms .host-alarms img.alarm-badge { + margin: .25em; + height: 1.2em; + } + + #alarms .alarm-count { + width: 1.5em; + height: 1.5em; + text-align: center; + position: absolute; + right: 0.5em; + top: 0.5em; + font-size: 1.5em; + background: #6f1515; + border-radius: 50%; + } + + #alarms .alarm-count:empty { + background: #333; + } + + #alarms .no-alarms { + background: #156f15; + color: rgba(0,0,0,0); + } + + #alarms .warnings-only { + background: #f48041; + color: #EEE; + } + + .settings-button { + position: absolute; + bottom: 0; + right: 0; + font-size: 3em; + width: 1.3em; + height: 1.3em; + z-index: 9999; + text-align: center; + line-height: 1.2; + cursor: default; + } + + .settings-button:hover { + background: #424242; + } + + .drag-anchor { + position: absolute; + top: 0; + left: 0; + width: 100%; + height: 2em; + background: #111; + + } + + .netdata-host-name { + font-size: 3em; + color: #FFF; + text-align: center; + white-space: nowrap; + } + + .netdata-host-stats-container { + position: relative; + margin: 0 1em; + padding: 3em 2em; + display: inline-block; + text-align: center; + color: #CCC; + background: #232323; + } + + .netdata-host-stats-container:last-of-type { + margin-right: 27em; + } + + .netdata-host-stats { + + } + + .netdata-message { + } + + .dash-graph { + margin-bottom: 1em; + } + + .netdata-legend-resize-handler { + display: none + } + + .dash-charts { + white-space: normal; + margin: 2em 0; + } + + .dash-chart { + display: inline-block; + vertical-align: top; + } + + .easyPieChartLabel { + color: #FFF; + } + + .loading-error { + padding-top: 2em; + font-size: 2em; + } + + .netdata-legend-value, .netdata-legend-toolbox, .netdata-legend-toolbox-button, .netdata-legend-resize-handler { + background: initial; + } +</style> +</html> diff --git a/web/gui/dashboard.html b/web/gui/dashboard.html index d32224802..d843fc5cb 100644 --- a/web/gui/dashboard.html +++ b/web/gui/dashboard.html @@ -696,4 +696,4 @@ So, to avoid flashing the charts, we destroy and re-create the charts on each up <!-- load the dashboard manager - it will do the rest --> <!-- <script>var netdataTheme = 'slate';</script> --> -<script type="text/javascript" src="dashboard.js?v20180130-1"></script> +<script type="text/javascript" src="dashboard.js?v20190902-0"></script> diff --git a/web/gui/dashboard.js b/web/gui/dashboard.js index 0c379dc05..9bce4f72a 100644 --- a/web/gui/dashboard.js +++ b/web/gui/dashboard.js @@ -868,6 +868,13 @@ NETDATA.unitsConversion = { 'TiB': 1024, 'PiB': 1024 * 1024, 'EiB': 1024 * 1024 * 1024 + }, + 'num': { + 'num': 1, + 'num (K)': 1000, + 'num (M)': 1000000, + 'num (G)': 1000000000, + 'num (T)': 1000000000000 } /* 'milliseconds': { @@ -967,6 +974,72 @@ NETDATA.unitsConversion = { + NETDATA.zeropad(milliseconds); } } + }, + 'nanoseconds': { + 'nanoseconds': { + check: function (max) { + return NETDATA.options.current.seconds_as_time && max < 1000; + }, + convert: function (nanoseconds) { + let tms = Math.round(nanoseconds * 10); + nanoseconds = Math.floor(tms / 10); + + tms -= nanoseconds * 10; + + return (nanoseconds).toString() + '.' + tms.toString(); + } + }, + 'microseconds': { + check: function (max) { + return NETDATA.options.current.seconds_as_time + && max >= 1000 && max < 1000 * 1000; + }, + convert: function (nanoseconds) { + nanoseconds = Math.round(nanoseconds); + + let microseconds = Math.floor(nanoseconds / 1000); + nanoseconds -= microseconds * 1000; + + nanoseconds = Math.round(nanoseconds / 10 ); + + return microseconds.toString() + '.' + + NETDATA.zeropad(nanoseconds); + } + }, + 'milliseconds': { + check: function (max) { + return NETDATA.options.current.seconds_as_time + && max >= 1000 * 1000 && max < 1000 * 1000 * 1000; + }, + convert: function (nanoseconds) { + nanoseconds = Math.round(nanoseconds); + + let milliseconds = Math.floor(nanoseconds / 1000 / 1000); + nanoseconds -= milliseconds * 1000 * 1000; + + nanoseconds = Math.round(nanoseconds / 1000 / 10); + + return milliseconds.toString() + '.' + + NETDATA.zeropad(nanoseconds); + } + }, + 'seconds': { + check: function (max) { + return NETDATA.options.current.seconds_as_time + && max >= 1000 * 1000 * 1000; + }, + convert: function (nanoseconds) { + nanoseconds = Math.round(nanoseconds); + + let seconds = Math.floor(nanoseconds / 1000 / 1000 / 1000); + nanoseconds -= seconds * 1000 * 1000 * 1000; + + nanoseconds = Math.round(nanoseconds / 1000 / 1000 / 10); + + return seconds.toString() + '.' + + NETDATA.zeropad(nanoseconds); + } + }, } }, @@ -1710,7 +1783,7 @@ NETDATA.timeout.init(); NETDATA.themes = { white: { bootstrap_css: NETDATA.serverStatic + 'css/bootstrap-3.3.7.css', - dashboard_css: NETDATA.serverStatic + 'dashboard.css?v20180210-1', + dashboard_css: NETDATA.serverStatic + 'dashboard.css?v20190902-0', background: '#FFFFFF', foreground: '#000000', grid: '#F0F0F0', @@ -1741,7 +1814,7 @@ NETDATA.themes = { }, slate: { bootstrap_css: NETDATA.serverStatic + 'css/bootstrap-slate-flat-3.3.7.css?v20161229-1', - dashboard_css: NETDATA.serverStatic + 'dashboard.slate.css?v20180210-1', + dashboard_css: NETDATA.serverStatic + 'dashboard.slate.css?v20190902-0', background: '#272b30', foreground: '#C8C8C8', grid: '#283236', diff --git a/web/gui/demo.html b/web/gui/demo.html index 68f374b65..b096bef33 100644 --- a/web/gui/demo.html +++ b/web/gui/demo.html @@ -21,7 +21,7 @@ <meta property="og:title" content="netdata - real-time performance monitoring, done right!"/> <meta property="og:description" content="Stunning real-time dashboards, blazingly fast and extremely interactive. Zero configuration, zero dependencies, zero maintenance." /> </head> -<script type="text/javascript" src="dashboard.js?v20170724-1"></script> +<script type="text/javascript" src="dashboard.js?v20190902-0"></script> <body> <div style="width: 100%; text-align: center;"> diff --git a/web/gui/demo2.html b/web/gui/demo2.html index 183a9550d..05ca72084 100644 --- a/web/gui/demo2.html +++ b/web/gui/demo2.html @@ -22,7 +22,7 @@ <meta property="og:description" content="Stunning real-time dashboards, blazingly fast and extremely interactive. Zero configuration, zero dependencies, zero maintenance." /> </head> <script>var netdataTheme = 'slate';</script> -<script type="text/javascript" src="http://my-netdata.io/dashboard.js?v20170724-1"></script> +<script type="text/javascript" src="http://my-netdata.io/dashboard.js?v20190902-0"></script> <body> <div class="container" style="width: 90%; padding-top: 10px; text-align: center; color: #AAA"> diff --git a/web/gui/demosites.html b/web/gui/demosites.html index f5d263807..e8a310a19 100644 --- a/web/gui/demosites.html +++ b/web/gui/demosites.html @@ -538,7 +538,7 @@ p { and that you have chown it to be owned by netdata:netdata --> <!-- <script type="text/javascript" src="http://my.server:19999/dashboard.js"></script> --> -<script type="text/javascript" src="dashboard.js?v20170724-1"></script> +<script type="text/javascript" src="dashboard.js?v20190902-0"></script> <script> // --- OPTIONS FOR THE CHARTS -- diff --git a/web/gui/demosites2.html b/web/gui/demosites2.html index 41ad9d6c6..fe35cfb6d 100644 --- a/web/gui/demosites2.html +++ b/web/gui/demosites2.html @@ -53,7 +53,7 @@ and that you have chown it to be owned by netdata:netdata --> <!-- <script type="text/javascript" src="http://my.server:19999/dashboard.js"></script> --> - <script type="text/javascript" src="dashboard.js?v20170724-1"></script> + <script type="text/javascript" src="dashboard.js?v20190902-0"></script> <script> // --- OPTIONS FOR THE CHARTS -- diff --git a/web/gui/goto-host-from-alarm.html b/web/gui/goto-host-from-alarm.html index eb1d4839b..ec53df084 100644 --- a/web/gui/goto-host-from-alarm.html +++ b/web/gui/goto-host-from-alarm.html @@ -24,7 +24,7 @@ var netdataTheme = 'slate'; var netdataShowHelp = true; </script> -<script type="text/javascript" src="dashboard.js?v20170724-7"></script> +<script type="text/javascript" src="dashboard.js?v20190902-0"></script> <script> function escapeUserInputHTML(s) { diff --git a/web/gui/images/favicon-128.png b/web/gui/images/favicon-128.png Binary files differnew file mode 100644 index 000000000..5371f920c --- /dev/null +++ b/web/gui/images/favicon-128.png diff --git a/web/gui/images/favicon-196x196.png b/web/gui/images/favicon-196x196.png Binary files differnew file mode 100644 index 000000000..a208c27fa --- /dev/null +++ b/web/gui/images/favicon-196x196.png diff --git a/web/gui/images/ms-icon-310x150.png b/web/gui/images/ms-icon-310x150.png Binary files differnew file mode 100644 index 000000000..5d4ac57b6 --- /dev/null +++ b/web/gui/images/ms-icon-310x150.png diff --git a/web/gui/images/ms-icon-36x36.png b/web/gui/images/ms-icon-36x36.png Binary files differnew file mode 100644 index 000000000..e251302ed --- /dev/null +++ b/web/gui/images/ms-icon-36x36.png diff --git a/web/gui/images/packaging-beta-tag.svg b/web/gui/images/packaging-beta-tag.svg new file mode 100644 index 000000000..cebdc0847 --- /dev/null +++ b/web/gui/images/packaging-beta-tag.svg @@ -0,0 +1,42 @@ +<svg width="127" height="16" viewBox="0 0 127 16" fill="none" xmlns="http://www.w3.org/2000/svg"> +<rect width="127" height="16" rx="2" fill="url(#paint0_linear)"/> +<path d="M86 0H125C126.105 0 127 0.895431 127 2V14C127 15.1046 126.105 16 125 16H86V0Z" fill="url(#paint1_linear)"/> +<path d="M6.5 4V10" stroke="white" stroke-linecap="round" stroke-linejoin="round"/> +<path d="M12.5 7C13.3284 7 14 6.32843 14 5.5C14 4.67157 13.3284 4 12.5 4C11.6716 4 11 4.67157 11 5.5C11 6.32843 11.6716 7 12.5 7Z" stroke="white" stroke-linecap="round" stroke-linejoin="round"/> +<path d="M6.5 13C7.32843 13 8 12.3284 8 11.5C8 10.6716 7.32843 10 6.5 10C5.67157 10 5 10.6716 5 11.5C5 12.3284 5.67157 13 6.5 13Z" stroke="white" stroke-linecap="round" stroke-linejoin="round"/> +<path d="M12.5 7C12.5 8.19347 12.0259 9.33807 11.182 10.182C10.3381 11.0259 9.19347 11.5 8 11.5" stroke="white" stroke-linecap="round" stroke-linejoin="round"/> +<g filter="url(#filter0_d)"> +<path d="M23.939 7.93848V11H22.9077V3.17969H25.792C26.6478 3.17969 27.3174 3.39811 27.8008 3.83496C28.2878 4.27181 28.5312 4.8501 28.5312 5.56982C28.5312 6.32894 28.2931 6.91439 27.8169 7.32617C27.3442 7.73438 26.6657 7.93848 25.7812 7.93848H23.939ZM23.939 7.09521H25.792C26.3434 7.09521 26.766 6.96631 27.0596 6.7085C27.3532 6.4471 27.5 6.07113 27.5 5.58057C27.5 5.11507 27.3532 4.74268 27.0596 4.46338C26.766 4.18408 26.3631 4.03906 25.8511 4.02832H23.939V7.09521ZM33.6548 11C33.5976 10.8854 33.551 10.6813 33.5152 10.3877C33.0533 10.8675 32.5018 11.1074 31.8609 11.1074C31.288 11.1074 30.8171 10.9463 30.4483 10.624C30.0831 10.2982 29.9004 9.88639 29.9004 9.38867C29.9004 8.78353 30.1296 8.31445 30.5879 7.98145C31.0499 7.64486 31.698 7.47656 32.5323 7.47656H33.4991V7.02002C33.4991 6.67269 33.3952 6.39697 33.1876 6.19287C32.9799 5.98519 32.6737 5.88135 32.2691 5.88135C31.9146 5.88135 31.6174 5.97087 31.3775 6.1499C31.1376 6.32894 31.0176 6.54557 31.0176 6.7998H30.0186C30.0186 6.50977 30.1207 6.23047 30.3248 5.96191C30.5324 5.68978 30.8117 5.47493 31.1627 5.31738C31.5171 5.15983 31.9057 5.08105 32.3282 5.08105C32.9978 5.08105 33.5224 5.24935 33.9019 5.58594C34.2815 5.91895 34.4784 6.37907 34.4927 6.96631V9.64111C34.4927 10.1746 34.5608 10.599 34.6968 10.9141V11H33.6548ZM32.0059 10.2427C32.3174 10.2427 32.6129 10.1621 32.8921 10.001C33.1714 9.83984 33.3738 9.63037 33.4991 9.37256V8.18018H32.7203C31.5028 8.18018 30.8941 8.53646 30.8941 9.24902C30.8941 9.56055 30.9979 9.80404 31.2056 9.97949C31.4133 10.1549 31.6801 10.2427 32.0059 10.2427ZM38.8214 10.2964C39.1759 10.2964 39.4856 10.189 39.7506 9.97412C40.0156 9.75928 40.1624 9.49072 40.191 9.16846H41.131C41.1131 9.50146 40.9985 9.81836 40.7872 10.1191C40.576 10.4199 40.2931 10.6598 39.9386 10.8389C39.5877 11.0179 39.2153 11.1074 38.8214 11.1074C38.0301 11.1074 37.3999 10.8442 36.9308 10.3179C36.4653 9.78792 36.2325 9.06462 36.2325 8.14795V7.98145C36.2325 7.41569 36.3364 6.9126 36.5441 6.47217C36.7517 6.03174 37.0489 5.68978 37.4357 5.44629C37.826 5.2028 38.2861 5.08105 38.816 5.08105C39.4677 5.08105 40.0084 5.2762 40.4381 5.6665C40.8714 6.0568 41.1023 6.56348 41.131 7.18652H40.191C40.1624 6.81055 40.0192 6.5026 39.7613 6.2627C39.5071 6.01921 39.192 5.89746 38.816 5.89746C38.3112 5.89746 37.9191 6.08008 37.6398 6.44531C37.364 6.80697 37.2262 7.33154 37.2262 8.01904V8.20703C37.2262 8.87663 37.364 9.39225 37.6398 9.75391C37.9155 10.1156 38.3094 10.2964 38.8214 10.2964ZM44.3102 8.30908L43.6872 8.95898V11H42.6935V2.75H43.6872V7.73975L44.2189 7.10059L46.029 5.18848H47.2375L44.9762 7.61621L47.5007 11H46.3351L44.3102 8.30908ZM52.2913 11C52.234 10.8854 52.1874 10.6813 52.1516 10.3877C51.6897 10.8675 51.1383 11.1074 50.4973 11.1074C49.9244 11.1074 49.4535 10.9463 49.0847 10.624C48.7195 10.2982 48.5369 9.88639 48.5369 9.38867C48.5369 8.78353 48.766 8.31445 49.2244 7.98145C49.6863 7.64486 50.3344 7.47656 51.1687 7.47656H52.1355V7.02002C52.1355 6.67269 52.0316 6.39697 51.824 6.19287C51.6163 5.98519 51.3101 5.88135 50.9055 5.88135C50.551 5.88135 50.2538 5.97087 50.0139 6.1499C49.774 6.32894 49.654 6.54557 49.654 6.7998H48.655C48.655 6.50977 48.7571 6.23047 48.9612 5.96191C49.1689 5.68978 49.4482 5.47493 49.7991 5.31738C50.1536 5.15983 50.5421 5.08105 50.9646 5.08105C51.6342 5.08105 52.1588 5.24935 52.5383 5.58594C52.9179 5.91895 53.1148 6.37907 53.1291 6.96631V9.64111C53.1291 10.1746 53.1972 10.599 53.3332 10.9141V11H52.2913ZM50.6423 10.2427C50.9538 10.2427 51.2493 10.1621 51.5286 10.001C51.8079 9.83984 52.0102 9.63037 52.1355 9.37256V8.18018H51.3567C50.1392 8.18018 49.5305 8.53646 49.5305 9.24902C49.5305 9.56055 49.6343 9.80404 49.842 9.97949C50.0497 10.1549 50.3165 10.2427 50.6423 10.2427ZM54.8904 8.0459C54.8904 7.13997 55.0999 6.42025 55.5188 5.88672C55.9378 5.34961 56.4928 5.08105 57.1839 5.08105C57.8929 5.08105 58.4461 5.33171 58.8436 5.83301L58.8919 5.18848H59.7996V10.8604C59.7996 11.6123 59.5758 12.2049 59.1282 12.6382C58.6842 13.0715 58.0862 13.2881 57.3343 13.2881C56.9153 13.2881 56.5053 13.1986 56.1043 13.0195C55.7033 12.8405 55.3971 12.5952 55.1858 12.2837L55.7015 11.6875C56.1276 12.2139 56.6486 12.4771 57.2645 12.4771C57.7479 12.4771 58.1238 12.341 58.3924 12.0688C58.6645 11.7967 58.8006 11.4136 58.8006 10.9194V10.4199C58.4031 10.8783 57.8606 11.1074 57.1731 11.1074C56.4928 11.1074 55.9414 10.8335 55.5188 10.2856C55.0999 9.73779 54.8904 8.99121 54.8904 8.0459ZM55.8895 8.15869C55.8895 8.81396 56.0237 9.32959 56.2923 9.70557C56.5608 10.078 56.9368 10.2642 57.4202 10.2642C58.0468 10.2642 58.507 9.97949 58.8006 9.41016V6.75684C58.4962 6.20182 58.0397 5.92432 57.431 5.92432C56.9476 5.92432 56.5698 6.1123 56.2977 6.48828C56.0255 6.86426 55.8895 7.42106 55.8895 8.15869ZM62.8231 11H61.8295V5.18848H62.8231V11ZM61.7489 3.64697C61.7489 3.48584 61.7972 3.34977 61.8939 3.23877C61.9942 3.12777 62.141 3.07227 62.3343 3.07227C62.5277 3.07227 62.6745 3.12777 62.7748 3.23877C62.875 3.34977 62.9252 3.48584 62.9252 3.64697C62.9252 3.80811 62.875 3.94238 62.7748 4.0498C62.6745 4.15723 62.5277 4.21094 62.3343 4.21094C62.141 4.21094 61.9942 4.15723 61.8939 4.0498C61.7972 3.94238 61.7489 3.80811 61.7489 3.64697ZM65.7983 5.18848L65.8305 5.91895C66.2745 5.36035 66.8546 5.08105 67.5707 5.08105C68.7989 5.08105 69.4184 5.77393 69.4291 7.15967V11H68.4355V7.1543C68.4319 6.73535 68.3352 6.42562 68.1454 6.2251C67.9592 6.02458 67.6674 5.92432 67.2699 5.92432C66.9477 5.92432 66.6648 6.01025 66.4213 6.18213C66.1778 6.354 65.988 6.57959 65.852 6.85889V11H64.8583V5.18848H65.7983ZM71.1313 8.0459C71.1313 7.13997 71.3408 6.42025 71.7597 5.88672C72.1787 5.34961 72.7337 5.08105 73.4248 5.08105C74.1338 5.08105 74.687 5.33171 75.0845 5.83301L75.1328 5.18848H76.0405V10.8604C76.0405 11.6123 75.8167 12.2049 75.3691 12.6382C74.9251 13.0715 74.3271 13.2881 73.5752 13.2881C73.1562 13.2881 72.7462 13.1986 72.3452 13.0195C71.9442 12.8405 71.638 12.5952 71.4267 12.2837L71.9424 11.6875C72.3685 12.2139 72.8895 12.4771 73.5054 12.4771C73.9888 12.4771 74.3647 12.341 74.6333 12.0688C74.9054 11.7967 75.0415 11.4136 75.0415 10.9194V10.4199C74.644 10.8783 74.1015 11.1074 73.414 11.1074C72.7337 11.1074 72.1823 10.8335 71.7597 10.2856C71.3408 9.73779 71.1313 8.99121 71.1313 8.0459ZM72.1304 8.15869C72.1304 8.81396 72.2646 9.32959 72.5332 9.70557C72.8017 10.078 73.1777 10.2642 73.6611 10.2642C74.2877 10.2642 74.7479 9.97949 75.0415 9.41016V6.75684C74.7371 6.20182 74.2806 5.92432 73.6719 5.92432C73.1885 5.92432 72.8107 6.1123 72.5386 6.48828C72.2664 6.86426 72.1304 7.42106 72.1304 8.15869Z" fill="white"/> +</g> +<g filter="url(#filter1_d)"> +<path d="M93.7949 12V4.17969H96.4751C97.3595 4.17969 98.0327 4.35693 98.4946 4.71143C98.9565 5.06592 99.1875 5.59408 99.1875 6.2959C99.1875 6.65397 99.0908 6.97624 98.8975 7.2627C98.7041 7.54915 98.4212 7.77116 98.0488 7.92871C98.4714 8.04329 98.7972 8.25993 99.0264 8.57861C99.2591 8.89372 99.3755 9.27327 99.3755 9.71729C99.3755 10.4513 99.1392 11.0153 98.6665 11.4092C98.1974 11.8031 97.5243 12 96.647 12H93.7949ZM95.1538 8.47119V10.915H96.6631C97.0892 10.915 97.4222 10.8094 97.6621 10.5981C97.902 10.3869 98.022 10.0933 98.022 9.71729C98.022 8.90446 97.6066 8.4891 96.7759 8.47119H95.1538ZM95.1538 7.47217H96.4858C96.9084 7.47217 97.2378 7.37728 97.4741 7.1875C97.714 6.99414 97.834 6.72201 97.834 6.37109C97.834 5.98438 97.723 5.70508 97.501 5.5332C97.2826 5.36133 96.9406 5.27539 96.4751 5.27539H95.1538V7.47217ZM105.745 8.50879H102.533V10.915H106.288V12H101.174V4.17969H106.25V5.27539H102.533V7.43457H105.745V8.50879ZM113.592 5.27539H111.153V12H109.805V5.27539H107.388V4.17969H113.592V5.27539ZM118.796 10.1792H115.767L115.133 12H113.72L116.674 4.17969H117.894L120.853 12H119.435L118.796 10.1792ZM116.148 9.0835H118.415L117.281 5.83936L116.148 9.0835Z" fill="white"/> +</g> +<defs> +<filter id="filter0_d" x="21.9077" y="2.75" width="55.1328" height="12.5381" filterUnits="userSpaceOnUse" color-interpolation-filters="sRGB"> +<feFlood flood-opacity="0" result="BackgroundImageFix"/> +<feColorMatrix in="SourceAlpha" type="matrix" values="0 0 0 0 0 0 0 0 0 0 0 0 0 0 0 0 0 0 127 0"/> +<feOffset dy="1"/> +<feGaussianBlur stdDeviation="0.5"/> +<feColorMatrix type="matrix" values="0 0 0 0 0 0 0 0 0 0 0 0 0 0 0 0 0 0 0.5 0"/> +<feBlend mode="normal" in2="BackgroundImageFix" result="effect1_dropShadow"/> +<feBlend mode="normal" in="SourceGraphic" in2="effect1_dropShadow" result="shape"/> +</filter> +<filter id="filter1_d" x="92.7949" y="4.17969" width="29.0583" height="9.82031" filterUnits="userSpaceOnUse" color-interpolation-filters="sRGB"> +<feFlood flood-opacity="0" result="BackgroundImageFix"/> +<feColorMatrix in="SourceAlpha" type="matrix" values="0 0 0 0 0 0 0 0 0 0 0 0 0 0 0 0 0 0 127 0"/> +<feOffset dy="1"/> +<feGaussianBlur stdDeviation="0.5"/> +<feColorMatrix type="matrix" values="0 0 0 0 0 0 0 0 0 0 0 0 0 0 0 0 0 0 0.5 0"/> +<feBlend mode="normal" in2="BackgroundImageFix" result="effect1_dropShadow"/> +<feBlend mode="normal" in="SourceGraphic" in2="effect1_dropShadow" result="shape"/> +</filter> +<linearGradient id="paint0_linear" x1="63.5" y1="0" x2="63.5" y2="16" gradientUnits="userSpaceOnUse"> +<stop stop-color="#606060"/> +<stop offset="1" stop-color="#4D4D4D"/> +</linearGradient> +<linearGradient id="paint1_linear" x1="106.5" y1="0" x2="106.5" y2="16" gradientUnits="userSpaceOnUse"> +<stop stop-color="#BFBFBF"/> +<stop offset="1" stop-color="#7F7F7F"/> +</linearGradient> +</defs> +</svg> diff --git a/web/gui/images/seo-performance-128.png b/web/gui/images/seo-performance-128.png Binary files differnew file mode 100644 index 000000000..2a212a475 --- /dev/null +++ b/web/gui/images/seo-performance-128.png diff --git a/web/gui/index.html b/web/gui/index.html index 58b074404..41017936c 100644 --- a/web/gui/index.html +++ b/web/gui/index.html @@ -33,7 +33,7 @@ <meta name="twitter:description" content="Unparalleled insights, in real-time, of everything happening on your Linux systems and applications, with stunning, interactive web dashboards and powerful performance and health alarms." /> <meta name="twitter:image" content="https://cloud.githubusercontent.com/assets/2662304/14092712/93b039ea-f551-11e5-822c-beadbf2b2a2e.gif" /> - <script src="main.js?v=7"></script> + <script src="main.js?v20190905-0"></script> </head> <body data-spy="scroll" data-target="#sidebar" data-offset="100"> @@ -1317,6 +1317,6 @@ </div> <iframe id="ssoifrm" width="0" height="0"></iframe> <div id="hiddenDownloadLinks" style="display: none;" hidden></div> - <script type="text/javascript" src="dashboard.js?v20190621-1"></script> + <script type="text/javascript" src="dashboard.js?v20190902-0"></script> </body> </html> diff --git a/web/gui/main.js b/web/gui/main.js index 6aebb8ed3..71af6b59d 100644 --- a/web/gui/main.js +++ b/web/gui/main.js @@ -1786,21 +1786,26 @@ function renderPage(menus, data) { html += mhead + shtml + '</div></div><hr role="separator"/>'; } + const isMemoryModeDbEngine = data.memory_mode === "dbengine"; + sidebar += '<li class="" style="padding-top:15px;"><a href="https://github.com/netdata/netdata/blob/master/docs/Add-more-charts-to-netdata.md#add-more-charts-to-netdata" target="_blank"><i class="fas fa-plus"></i> add more charts</a></li>'; sidebar += '<li class=""><a href="https://github.com/netdata/netdata/tree/master/health#Health-monitoring" target="_blank"><i class="fas fa-plus"></i> add more alarms</a></li>'; sidebar += '<li class="" style="margin:20px;color:#666;"><small>Every ' + ((data.update_every === 1) ? 'second' : data.update_every.toString() + ' seconds') + ', ' + - 'Netdata collects <b>' + data.dimensions_count.toLocaleString() + '</b> metrics, presents them in <b>' + - data.charts_count.toLocaleString() + '</b> charts and monitors them with <b>' + - data.alarms_count.toLocaleString() + '</b> alarms. Netdata is using ' + - Math.round(data.rrd_memory_bytes / 1024 / 1024).toLocaleString() + ' MB of memory on <b>' + - data.hostname.toString() + '</b> for ' + - NETDATA.seconds4human(data.update_every * data.history, { - minute: 'minute', minutes: 'minutes', second: 'second', seconds: 'seconds', space: ' ', - }) + - ' of real-time history.<br /> <br />' + 'Get more history by ' + - '<a href="https://docs.netdata.cloud/docs/configuration-guide/#increase-the-metrics-retention-period" target=_blank>configuring Netdata\'s <b>history</b></a> or using the <a href="https://docs.netdata.cloud/database/engine/" target=_blank>DB engine.</a>' + - '<br/> <br/><b>netdata</b><br/>' + data.version.toString() + '</small></li>'; + 'Netdata collects <strong>' + data.dimensions_count.toLocaleString() + '</strong> metrics on ' + + data.hostname.toString() + ', presents them in <strong>' + + data.charts_count.toLocaleString() + '</strong> charts' + + (isMemoryModeDbEngine ? '' : ',') + // oxford comma + ' and monitors them with <strong>' + + data.alarms_count.toLocaleString() + '</strong> alarms.'; + + if (!isMemoryModeDbEngine) { + sidebar += '<br /> <br />Get more history by ' + + '<a href="https://docs.netdata.cloud/docs/configuration-guide/#increase-the-metrics-retention-period" target=_blank>configuring Netdata\'s <strong>history</strong></a> or using the <a href="https://docs.netdata.cloud/database/engine/" target=_blank>DB engine.</a>' + } + + sidebar += '<br/> <br/><strong>netdata</strong><br/>' + data.version.toString() + '</small></li>'; + sidebar += '</ul>'; div.innerHTML = html; document.getElementById('sidebar').innerHTML = sidebar; diff --git a/web/gui/manifest.json b/web/gui/manifest.json new file mode 100644 index 000000000..52cb4831c --- /dev/null +++ b/web/gui/manifest.json @@ -0,0 +1,41 @@ +{ + "name": "App", + "icons": [ + { + "src": "images\/android-icon-36x36.png", + "sizes": "36x36", + "type": "image\/png", + "density": "0.75" + }, + { + "src": "images\/android-icon-48x48.png", + "sizes": "48x48", + "type": "image\/png", + "density": "1.0" + }, + { + "src": "images\/android-icon-72x72.png", + "sizes": "72x72", + "type": "image\/png", + "density": "1.5" + }, + { + "src": "images\/android-icon-96x96.png", + "sizes": "96x96", + "type": "image\/png", + "density": "2.0" + }, + { + "src": "images\/android-icon-144x144.png", + "sizes": "144x144", + "type": "image\/png", + "density": "3.0" + }, + { + "src": "images\/android-icon-192x192.png", + "sizes": "192x192", + "type": "image\/png", + "density": "4.0" + } + ] +} diff --git a/web/gui/src/dashboard.js/charting/_c3.js b/web/gui/src/dashboard.js/charting/_c3.js new file mode 100644 index 000000000..6688bbcce --- /dev/null +++ b/web/gui/src/dashboard.js/charting/_c3.js @@ -0,0 +1,114 @@ + +// DEPRECATED: will be removed! + +// c3 + +NETDATA.c3Initialize = function(callback) { + if (typeof netdataNoC3 === 'undefined' || !netdataNoC3) { + + // C3 requires D3 + if (!NETDATA.chartLibraries.d3.initialized) { + if (NETDATA.chartLibraries.d3.enabled) { + NETDATA.d3Initialize(function() { + NETDATA.c3Initialize(callback); + }); + } else { + NETDATA.chartLibraries.c3.enabled = false; + if (typeof callback === "function") + return callback(); + } + } else { + NETDATA._loadCSS(NETDATA.c3_css); + + $.ajax({ + url: NETDATA.c3_js, + cache: true, + dataType: "script", + xhrFields: { withCredentials: true } // required for the cookie + }) + .done(function() { + NETDATA.registerChartLibrary('c3', NETDATA.c3_js); + }) + .fail(function() { + NETDATA.chartLibraries.c3.enabled = false; + NETDATA.error(100, NETDATA.c3_js); + }) + .always(function() { + if (typeof callback === "function") + return callback(); + }); + } + } else { + NETDATA.chartLibraries.c3.enabled = false; + if (typeof callback === "function") + return callback(); + } +}; + +NETDATA.c3ChartUpdate = function(state, data) { + state.c3_instance.destroy(); + return NETDATA.c3ChartCreate(state, data); + + //state.c3_instance.load({ + // rows: data.result, + // unload: true + //}); + + //return true; +}; + +NETDATA.c3ChartCreate = function(state, data) { + + state.element_chart.id = 'c3-' + state.uuid; + // console.log('id = ' + state.element_chart.id); + + state.c3_instance = c3.generate({ + bindto: '#' + state.element_chart.id, + size: { + width: state.chartWidth(), + height: state.chartHeight() + }, + color: { + pattern: state.chartColors() + }, + data: { + x: 'time', + rows: data.result, + type: (state.chart.chart_type === 'line')?'spline':'area-spline' + }, + axis: { + x: { + type: 'timeseries', + tick: { + format: function(x) { + return NETDATA.dateTime.xAxisTimeString(x); + } + } + } + }, + grid: { + x: { + show: true + }, + y: { + show: true + } + }, + point: { + show: false + }, + line: { + connectNull: false + }, + transition: { + duration: 0 + }, + interaction: { + enabled: true + } + }); + + // console.log(state.c3_instance); + + return true; +}; diff --git a/web/gui/src/dashboard.js/charting/_morris.js b/web/gui/src/dashboard.js/charting/_morris.js new file mode 100644 index 000000000..30789e4e2 --- /dev/null +++ b/web/gui/src/dashboard.js/charting/_morris.js @@ -0,0 +1,81 @@ + +// DEPRECATED: will be removed! + +// morris + +NETDATA.morrisInitialize = function(callback) { + if (typeof netdataNoMorris === 'undefined' || !netdataNoMorris) { + + // morris requires raphael + if (!NETDATA.chartLibraries.raphael.initialized) { + if (NETDATA.chartLibraries.raphael.enabled) { + NETDATA.raphaelInitialize(function() { + NETDATA.morrisInitialize(callback); + }); + } else { + NETDATA.chartLibraries.morris.enabled = false; + if (typeof callback === "function") + return callback(); + } + } else { + NETDATA._loadCSS(NETDATA.morris_css); + + $.ajax({ + url: NETDATA.morris_js, + cache: true, + dataType: "script", + xhrFields: { withCredentials: true } // required for the cookie + }) + .done(function() { + NETDATA.registerChartLibrary('morris', NETDATA.morris_js); + }) + .fail(function() { + NETDATA.chartLibraries.morris.enabled = false; + NETDATA.error(100, NETDATA.morris_js); + }) + .always(function() { + if (typeof callback === "function") + return callback(); + }); + } + } else { + NETDATA.chartLibraries.morris.enabled = false; + if (typeof callback === "function") + return callback(); + } +}; + +NETDATA.morrisChartUpdate = function(state, data) { + state.morris_instance.setData(data.result.data); + return true; +}; + +NETDATA.morrisChartCreate = function(state, data) { + + state.morris_options = { + element: state.element_chart.id, + data: data.result.data, + xkey: 'time', + ykeys: data.dimension_names, + labels: data.dimension_names, + lineWidth: 2, + pointSize: 3, + smooth: true, + hideHover: 'auto', + parseTime: true, + continuousLine: false, + behaveLikeLine: false + }; + + if (state.chart.chart_type === 'line') + state.morris_instance = new Morris.Line(state.morris_options); + + else if (state.chart.chart_type === 'area') { + state.morris_options.behaveLikeLine = true; + state.morris_instance = new Morris.Area(state.morris_options); + } + else // stacked + state.morris_instance = new Morris.Area(state.morris_options); + + return true; +}; diff --git a/web/gui/src/dashboard.js/charting/_raphael.js b/web/gui/src/dashboard.js/charting/_raphael.js new file mode 100644 index 000000000..2d89a22a8 --- /dev/null +++ b/web/gui/src/dashboard.js/charting/_raphael.js @@ -0,0 +1,48 @@ + +// DEPRECATED: will be removed! + +// raphael + +NETDATA.raphaelInitialize = function(callback) { + if (typeof netdataStopRaphael === 'undefined' || !netdataStopRaphael) { + $.ajax({ + url: NETDATA.raphael_js, + cache: true, + dataType: "script", + xhrFields: { withCredentials: true } // required for the cookie + }) + .done(function() { + NETDATA.registerChartLibrary('raphael', NETDATA.raphael_js); + }) + .fail(function() { + NETDATA.chartLibraries.raphael.enabled = false; + NETDATA.error(100, NETDATA.raphael_js); + }) + .always(function() { + if (typeof callback === "function") + return callback(); + }); + } else { + NETDATA.chartLibraries.raphael.enabled = false; + if (typeof callback === "function") + return callback(); + } +}; + +NETDATA.raphaelChartUpdate = function(state, data) { + $(state.element_chart).raphael(data.result, { + width: state.chartWidth(), + height: state.chartHeight() + }); + + return false; +}; + +NETDATA.raphaelChartCreate = function(state, data) { + $(state.element_chart).raphael(data.result, { + width: state.chartWidth(), + height: state.chartHeight() + }); + + return false; +}; diff --git a/web/gui/src/dashboard.js/themes.js b/web/gui/src/dashboard.js/themes.js index aafe15768..d5126a642 100644 --- a/web/gui/src/dashboard.js/themes.js +++ b/web/gui/src/dashboard.js/themes.js @@ -4,7 +4,7 @@ NETDATA.themes = { white: { bootstrap_css: NETDATA.serverStatic + 'css/bootstrap-3.3.7.css', - dashboard_css: NETDATA.serverStatic + 'dashboard.css?v20180210-1', + dashboard_css: NETDATA.serverStatic + 'dashboard.css?v20190902-0', background: '#FFFFFF', foreground: '#000000', grid: '#F0F0F0', @@ -35,7 +35,7 @@ NETDATA.themes = { }, slate: { bootstrap_css: NETDATA.serverStatic + 'css/bootstrap-slate-flat-3.3.7.css?v20161229-1', - dashboard_css: NETDATA.serverStatic + 'dashboard.slate.css?v20180210-1', + dashboard_css: NETDATA.serverStatic + 'dashboard.slate.css?v20190902-0', background: '#272b30', foreground: '#C8C8C8', grid: '#283236', diff --git a/web/gui/src/dashboard.js/units-conversion.js b/web/gui/src/dashboard.js/units-conversion.js index 26b840344..af2c843eb 100644 --- a/web/gui/src/dashboard.js/units-conversion.js +++ b/web/gui/src/dashboard.js/units-conversion.js @@ -101,6 +101,13 @@ NETDATA.unitsConversion = { 'TiB': 1024, 'PiB': 1024 * 1024, 'EiB': 1024 * 1024 * 1024 + }, + 'num': { + 'num': 1, + 'num (K)': 1000, + 'num (M)': 1000000, + 'num (G)': 1000000000, + 'num (T)': 1000000000000 } /* 'milliseconds': { @@ -200,6 +207,72 @@ NETDATA.unitsConversion = { + NETDATA.zeropad(milliseconds); } } + }, + 'nanoseconds': { + 'nanoseconds': { + check: function (max) { + return NETDATA.options.current.seconds_as_time && max < 1000; + }, + convert: function (nanoseconds) { + let tms = Math.round(nanoseconds * 10); + nanoseconds = Math.floor(tms / 10); + + tms -= nanoseconds * 10; + + return (nanoseconds).toString() + '.' + tms.toString(); + } + }, + 'microseconds': { + check: function (max) { + return NETDATA.options.current.seconds_as_time + && max >= 1000 && max < 1000 * 1000; + }, + convert: function (nanoseconds) { + nanoseconds = Math.round(nanoseconds); + + let microseconds = Math.floor(nanoseconds / 1000); + nanoseconds -= microseconds * 1000; + + nanoseconds = Math.round(nanoseconds / 10 ); + + return microseconds.toString() + '.' + + NETDATA.zeropad(nanoseconds); + } + }, + 'milliseconds': { + check: function (max) { + return NETDATA.options.current.seconds_as_time + && max >= 1000 * 1000 && max < 1000 * 1000 * 1000; + }, + convert: function (nanoseconds) { + nanoseconds = Math.round(nanoseconds); + + let milliseconds = Math.floor(nanoseconds / 1000 / 1000); + nanoseconds -= milliseconds * 1000 * 1000; + + nanoseconds = Math.round(nanoseconds / 1000 / 10); + + return milliseconds.toString() + '.' + + NETDATA.zeropad(nanoseconds); + } + }, + 'seconds': { + check: function (max) { + return NETDATA.options.current.seconds_as_time + && max >= 1000 * 1000 * 1000; + }, + convert: function (nanoseconds) { + nanoseconds = Math.round(nanoseconds); + + let seconds = Math.floor(nanoseconds / 1000 / 1000 / 1000); + nanoseconds -= seconds * 1000 * 1000 * 1000; + + nanoseconds = Math.round(nanoseconds / 1000 / 1000 / 10); + + return seconds.toString() + '.' + + NETDATA.zeropad(nanoseconds); + } + }, } }, diff --git a/web/gui/tv.html b/web/gui/tv.html index 58485b267..e15fb2e27 100644 --- a/web/gui/tv.html +++ b/web/gui/tv.html @@ -51,7 +51,7 @@ var netdataTheme = 'slate'; // this is dark and that you have chown it to be owned by netdata:netdata --> <!-- <script type="text/javascript" src="http://my.server:19999/dashboard.js"></script> --> -<script type="text/javascript" src="dashboard.js?v20170724-7"></script> +<script type="text/javascript" src="dashboard.js?v20190902-0"></script> <script> // Set options for TV operation diff --git a/web/gui/version.txt b/web/gui/version.txt deleted file mode 100644 index 3c59cf509..000000000 --- a/web/gui/version.txt +++ /dev/null @@ -1 +0,0 @@ -588ce5a7b18999dfa66698cd3a2f005f7a3c31cf |