
diff options
Diffstat (limited to 'collectors/python.d.plugin/pandas')
| -rw-r--r-- | collectors/python.d.plugin/pandas/Makefile.inc | 13 | ||||
| -rw-r--r-- | collectors/python.d.plugin/pandas/README.md | 92 | ||||
| -rw-r--r-- | collectors/python.d.plugin/pandas/pandas.chart.py | 89 | ||||
| -rw-r--r-- | collectors/python.d.plugin/pandas/pandas.conf | 191 |
4 files changed, 385 insertions, 0 deletions
diff --git a/collectors/python.d.plugin/pandas/Makefile.inc b/collectors/python.d.plugin/pandas/Makefile.inc new file mode 100644 index 000000000..9f4f9b34b --- /dev/null +++ b/collectors/python.d.plugin/pandas/Makefile.inc @@ -0,0 +1,13 @@ +# SPDX-License-Identifier: GPL-3.0-or-later + +# THIS IS NOT A COMPLETE Makefile +# IT IS INCLUDED BY ITS PARENT'S Makefile.am +# IT IS REQUIRED TO REFERENCE ALL FILES RELATIVE TO THE PARENT + +# install these files +dist_python_DATA += pandas/pandas.chart.py +dist_pythonconfig_DATA += pandas/pandas.conf + +# do not install these files, but include them in the distribution +dist_noinst_DATA += pandas/README.md pandas/Makefile.inc + diff --git a/collectors/python.d.plugin/pandas/README.md b/collectors/python.d.plugin/pandas/README.md new file mode 100644 index 000000000..141549478 --- /dev/null +++ b/collectors/python.d.plugin/pandas/README.md @@ -0,0 +1,92 @@ +<!-- +title: "Pandas" +custom_edit_url: https://github.com/netdata/netdata/edit/master/collectors/python.d.plugin/pandas/README.md +--> + +# Pandas Netdata Collector + +<a href="https://pandas.pydata.org/" target="_blank"> + <img src="https://pandas.pydata.org/docs/_static/pandas.svg" alt="Pandas" width="100px" height="50px" /> + </a> + +A python collector using [pandas](https://pandas.pydata.org/) to pull data and do pandas based +preprocessing before feeding to Netdata. + +## Requirements + +This collector depends on some Python (Python 3 only) packages that can usually be installed via `pip` or `pip3`. + +```bash +sudo pip install pandas requests +``` + +## Configuration + +Below is an example configuration to query some json weather data from [Open-Meteo](https://open-meteo.com), +do some data wrangling on it and save in format as expected by Netdata. + +```yaml +# example pulling some hourly temperature data +temperature: + name: "temperature" + update_every: 3 + chart_configs: + - name: "temperature_by_city" + title: "Temperature By City" + family: "temperature.today" + context: "pandas.temperature" + type: "line" + units: "Celsius" + df_steps: > + pd.DataFrame.from_dict( + {city: requests.get( + f'https://api.open-meteo.com/v1/forecast?latitude={lat}&longitude={lng}&hourly=temperature_2m' + ).json()['hourly']['temperature_2m'] + for (city,lat,lng) + in [ + ('dublin', 53.3441, -6.2675), + ('athens', 37.9792, 23.7166), + ('london', 51.5002, -0.1262), + ('berlin', 52.5235, 13.4115), + ('paris', 48.8567, 2.3510), + ] + } + ); # use dictionary comprehension to make multiple requests; + df.describe(); # get aggregate stats for each city; + df.transpose()[['mean', 'max', 'min']].reset_index(); # just take mean, min, max; + df.rename(columns={'index':'city'}); # some column renaming; + df.pivot(columns='city').mean().to_frame().reset_index(); # force to be one row per city; + df.rename(columns={0:'degrees'}); # some column renaming; + pd.concat([df, df['city']+'_'+df['level_0']], axis=1); # add new column combining city and summary measurement label; + df.rename(columns={0:'measurement'}); # some column renaming; + df[['measurement', 'degrees']].set_index('measurement'); # just take two columns we want; + df.sort_index(); # sort by city name; + df.transpose(); # transpose so its just one wide row; +``` + +`chart_configs` is a list of dictionary objects where each one defines the sequence of `df_steps` to be run using [`pandas`](https://pandas.pydata.org/), +and the `name`, `title` etc to define the +[CHART variables](https://learn.netdata.cloud/docs/agent/collectors/python.d.plugin#global-variables-order-and-chart) +that will control how the results will look in netdata. + +The example configuration above would result in a `data` dictionary like the below being collected by Netdata +at each time step. They keys in this dictionary will be the +[dimension](https://learn.netdata.cloud/docs/agent/web#dimensions) names on the chart. + +```javascript +{'athens_max': 26.2, 'athens_mean': 19.45952380952381, 'athens_min': 12.2, 'berlin_max': 17.4, 'berlin_mean': 10.764285714285714, 'berlin_min': 5.7, 'dublin_max': 15.3, 'dublin_mean': 12.008928571428571, 'dublin_min': 6.6, 'london_max': 18.9, 'london_mean': 12.510714285714286, 'london_min': 5.2, 'paris_max': 19.4, 'paris_mean': 12.054166666666665, 'paris_min': 4.8} +``` + +Which, given the above configuration would end up as a chart like below in Netdata. + +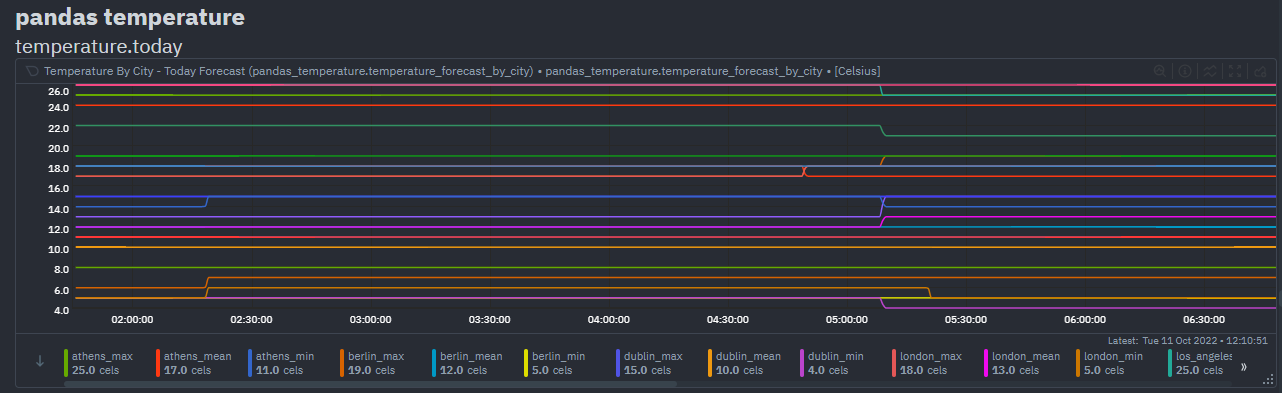 + +## Notes +- Each line in `df_steps` must return a pandas +[DataFrame](https://pandas.pydata.org/docs/reference/api/pandas.DataFrame.html) object (`df`) at each step. +- You can use +[this colab notebook](https://colab.research.google.com/drive/1VYrddSegZqGtkWGFuiUbMbUk5f3rW6Hi?usp=sharing) +to mock up and work on your `df_steps` iteratively before adding them to your config. +- This collector is expecting one row in the final pandas DataFrame. It is that first row that will be taken +as the most recent values for each dimension on each chart using (`df.to_dict(orient='records')[0]`). +See [pd.to_dict()](https://pandas.pydata.org/docs/reference/api/pandas.DataFrame.to_dict.html). diff --git a/collectors/python.d.plugin/pandas/pandas.chart.py b/collectors/python.d.plugin/pandas/pandas.chart.py new file mode 100644 index 000000000..8eb4452fb --- /dev/null +++ b/collectors/python.d.plugin/pandas/pandas.chart.py @@ -0,0 +1,89 @@ +# -*- coding: utf-8 -*- +# Description: pandas netdata python.d module +# Author: Andrew Maguire (andrewm4894) +# SPDX-License-Identifier: GPL-3.0-or-later + +import pandas as pd + +try: + import requests + HAS_REQUESTS = True +except ImportError: + HAS_REQUESTS = False + +from bases.FrameworkServices.SimpleService import SimpleService + +ORDER = [] + +CHARTS = {} + + +class Service(SimpleService): + def __init__(self, configuration=None, name=None): + SimpleService.__init__(self, configuration=configuration, name=name) + self.order = ORDER + self.definitions = CHARTS + self.chart_configs = self.configuration.get('chart_configs', None) + self.line_sep = self.configuration.get('line_sep', ';') + + def run_code(self, df_steps): + """eval() each line of code and ensure the result is a pandas dataframe""" + + # process each line of code + lines = df_steps.split(self.line_sep) + for line in lines: + line_clean = line.strip('\n').strip(' ') + if line_clean != '' and line_clean[0] != '#': + df = eval(line_clean) + assert isinstance(df, pd.DataFrame), 'The result of each evaluated line of `df_steps` must be of type `pd.DataFrame`' + + # take top row of final df as data to be collected by netdata + data = df.to_dict(orient='records')[0] + + return data + + def check(self): + """ensure charts and dims all configured and that we can get data""" + + if not HAS_REQUESTS: + self.warn('requests library could not be imported') + + if not self.chart_configs: + self.error('chart_configs must be defined') + + data = dict() + + # add each chart as defined by the config + for chart_config in self.chart_configs: + if chart_config['name'] not in self.charts: + chart_template = { + 'options': [ + chart_config['name'], + chart_config['title'], + chart_config['units'], + chart_config['family'], + chart_config['context'], + chart_config['type'] + ], + 'lines': [] + } + self.charts.add_chart([chart_config['name']] + chart_template['options']) + + data_tmp = self.run_code(chart_config['df_steps']) + data.update(data_tmp) + + for dim in data_tmp: + self.charts[chart_config['name']].add_dimension([dim, dim, 'absolute', 1, 1]) + + return True + + def get_data(self): + """get data for each chart config""" + + data = dict() + + for chart_config in self.chart_configs: + data_tmp = self.run_code(chart_config['df_steps']) + data.update(data_tmp) + + return data diff --git a/collectors/python.d.plugin/pandas/pandas.conf b/collectors/python.d.plugin/pandas/pandas.conf new file mode 100644 index 000000000..6684af9d5 --- /dev/null +++ b/collectors/python.d.plugin/pandas/pandas.conf @@ -0,0 +1,191 @@ +# netdata python.d.plugin configuration for pandas +# +# This file is in YaML format. Generally the format is: +# +# name: value +# +# There are 2 sections: +# - global variables +# - one or more JOBS +# +# JOBS allow you to collect values from multiple sources. +# Each source will have its own set of charts. +# +# JOB parameters have to be indented (using spaces only, example below). + +# ---------------------------------------------------------------------- +# Global Variables +# These variables set the defaults for all JOBs, however each JOB +# may define its own, overriding the defaults. + +# update_every sets the default data collection frequency. +# If unset, the python.d.plugin default is used. +update_every: 5 + +# priority controls the order of charts at the netdata dashboard. +# Lower numbers move the charts towards the top of the page. +# If unset, the default for python.d.plugin is used. +# priority: 60000 + +# penalty indicates whether to apply penalty to update_every in case of failures. +# Penalty will increase every 5 failed updates in a row. Maximum penalty is 10 minutes. +# penalty: yes + +# autodetection_retry sets the job re-check interval in seconds. +# The job is not deleted if check fails. +# Attempts to start the job are made once every autodetection_retry. +# This feature is disabled by default. +# autodetection_retry: 0 + +# ---------------------------------------------------------------------- +# JOBS (data collection sources) +# +# The default JOBS share the same *name*. JOBS with the same name +# are mutually exclusive. Only one of them will be allowed running at +# any time. This allows autodetection to try several alternatives and +# pick the one that works. +# +# Any number of jobs is supported. +# +# All python.d.plugin JOBS (for all its modules) support a set of +# predefined parameters. These are: +# +# job_name: +# name: myname # the JOB's name as it will appear on the dashboard +# # dashboard (by default is the job_name) +# # JOBs sharing a name are mutually exclusive +# update_every: 1 # the JOB's data collection frequency +# priority: 60000 # the JOB's order on the dashboard +# penalty: yes # the JOB's penalty +# autodetection_retry: 0 # the JOB's re-check interval in seconds +# +# Additionally to the above, example also supports the following: +# +# num_lines: 4 # the number of lines to create +# lower: 0 # the lower bound of numbers to randomly sample from +# upper: 100 # the upper bound of numbers to randomly sample from +# +# ---------------------------------------------------------------------- +# AUTO-DETECTION JOBS + +# Some example configurations, enable this collector, uncomment and example below and restart netdata to enable. + +# example pulling some hourly temperature data, a chart for today forecast (mean,min,max) and another chart for current. +# temperature: +# name: "temperature" +# update_every: 5 +# chart_configs: +# - name: "temperature_forecast_by_city" +# title: "Temperature By City - Today Forecast" +# family: "temperature.today" +# context: "pandas.temperature" +# type: "line" +# units: "Celsius" +# df_steps: > +# pd.DataFrame.from_dict( +# {city: requests.get(f'https://api.open-meteo.com/v1/forecast?latitude={lat}&longitude={lng}&hourly=temperature_2m').json()['hourly']['temperature_2m'] +# for (city,lat,lng) +# in [ +# ('dublin', 53.3441, -6.2675), +# ('athens', 37.9792, 23.7166), +# ('london', 51.5002, -0.1262), +# ('berlin', 52.5235, 13.4115), +# ('paris', 48.8567, 2.3510), +# ('madrid', 40.4167, -3.7033), +# ('new_york', 40.71, -74.01), +# ('los_angeles', 34.05, -118.24), +# ] +# } +# ); +# df.describe(); # get aggregate stats for each city; +# df.transpose()[['mean', 'max', 'min']].reset_index(); # just take mean, min, max; +# df.rename(columns={'index':'city'}); # some column renaming; +# df.pivot(columns='city').mean().to_frame().reset_index(); # force to be one row per city; +# df.rename(columns={0:'degrees'}); # some column renaming; +# pd.concat([df, df['city']+'_'+df['level_0']], axis=1); # add new column combining city and summary measurement label; +# df.rename(columns={0:'measurement'}); # some column renaming; +# df[['measurement', 'degrees']].set_index('measurement'); # just take two columns we want; +# df.sort_index(); # sort by city name; +# df.transpose(); # transpose so its just one wide row; +# - name: "temperature_current_by_city" +# title: "Temperature By City - Current" +# family: "temperature.current" +# context: "pandas.temperature" +# type: "line" +# units: "Celsius" +# df_steps: > +# pd.DataFrame.from_dict( +# {city: requests.get(f'https://api.open-meteo.com/v1/forecast?latitude={lat}&longitude={lng}¤t_weather=true').json()['current_weather'] +# for (city,lat,lng) +# in [ +# ('dublin', 53.3441, -6.2675), +# ('athens', 37.9792, 23.7166), +# ('london', 51.5002, -0.1262), +# ('berlin', 52.5235, 13.4115), +# ('paris', 48.8567, 2.3510), +# ('madrid', 40.4167, -3.7033), +# ('new_york', 40.71, -74.01), +# ('los_angeles', 34.05, -118.24), +# ] +# } +# ); +# df.transpose(); +# df[['temperature']]; +# df.transpose(); + +# example showing a read_csv from a url and some light pandas data wrangling. +# pull data in csv format from london demo server and then ratio of user cpus over system cpu averaged over last 60 seconds. +# example_csv: +# name: "example_csv" +# update_every: 2 +# chart_configs: +# - name: "london_system_cpu" +# title: "London System CPU - Ratios" +# family: "london_system_cpu" +# context: "pandas" +# type: "line" +# units: "n" +# df_steps: > +# pd.read_csv('https://london.my-netdata.io/api/v1/data?chart=system.cpu&format=csv&after=-60', storage_options={'User-Agent': 'netdata'}); +# df.drop('time', axis=1); +# df.mean().to_frame().transpose(); +# df.apply(lambda row: (row.user / row.system), axis = 1).to_frame(); +# df.rename(columns={0:'average_user_system_ratio'}); +# df*100; + +# example showing a read_json from a url and some light pandas data wrangling. +# pull data in json format (using requests.get() if json data is too complex for pd.read_json() ) from london demo server and work out 'total_bandwidth'. +# example_json: +# name: "example_json" +# update_every: 2 +# chart_configs: +# - name: "london_system_net" +# title: "London System Net - Total Bandwidth" +# family: "london_system_net" +# context: "pandas" +# type: "area" +# units: "kilobits/s" +# df_steps: > +# pd.DataFrame(requests.get('https://london.my-netdata.io/api/v1/data?chart=system.net&format=json&after=-1').json()['data'], columns=requests.get('https://london.my-netdata.io/api/v1/data?chart=system.net&format=json&after=-1').json()['labels']); +# df.drop('time', axis=1); +# abs(df); +# df.sum(axis=1).to_frame(); +# df.rename(columns={0:'total_bandwidth'}); + +# example showing a read_xml from a url and some light pandas data wrangling. +# pull weather forecast data in xml format, use xpath to pull out temperature forecast. +# example_xml: +# name: "example_xml" +# update_every: 2 +# line_sep: "|" +# chart_configs: +# - name: "temperature_forcast" +# title: "Temperature Forecast" +# family: "temp" +# context: "pandas.temp" +# type: "line" +# units: "celsius" +# df_steps: > +# pd.read_xml('http://metwdb-openaccess.ichec.ie/metno-wdb2ts/locationforecast?lat=54.7210798611;long=-8.7237392806', xpath='./product/time[1]/location/temperature', parser='etree')| +# df.rename(columns={'value': 'dublin'})| +# df[['dublin']]|
\ No newline at end of file |