
diff options
Diffstat (limited to 'collectors/statsd.plugin/k6.md')
| -rw-r--r-- | collectors/statsd.plugin/k6.md | 76 |
1 files changed, 76 insertions, 0 deletions
diff --git a/collectors/statsd.plugin/k6.md b/collectors/statsd.plugin/k6.md new file mode 100644 index 000000000..4f8c70133 --- /dev/null +++ b/collectors/statsd.plugin/k6.md @@ -0,0 +1,76 @@ +<!-- +title: "K6 load test monitoring with Netdata" +custom_edit_url: https://github.com/netdata/netdata/edit/master/collectors/statsd.plugin/k6.md + +sidebar_label: "K6 Load Testing" +--> + +# K6 Load Testing monitoring with Netdata + +Monitors the impact of load testing experiments performed with [K6](https://k6.io/). + +You can read more about the metrics that K6 sends in the [K6 documentation](https://k6.io/docs/using-k6/metrics/). + +## Requirements + +- When running the k6 experiment, specify a [StatsD output](https://k6.io/docs/results-visualization/statsd/). + - Tip: K6 currently supports tags only with [datadog output](https://k6.io/docs/results-visualization/datadog/), which is in essence StatsD. Netdata can be used with both. + +## Metrics + +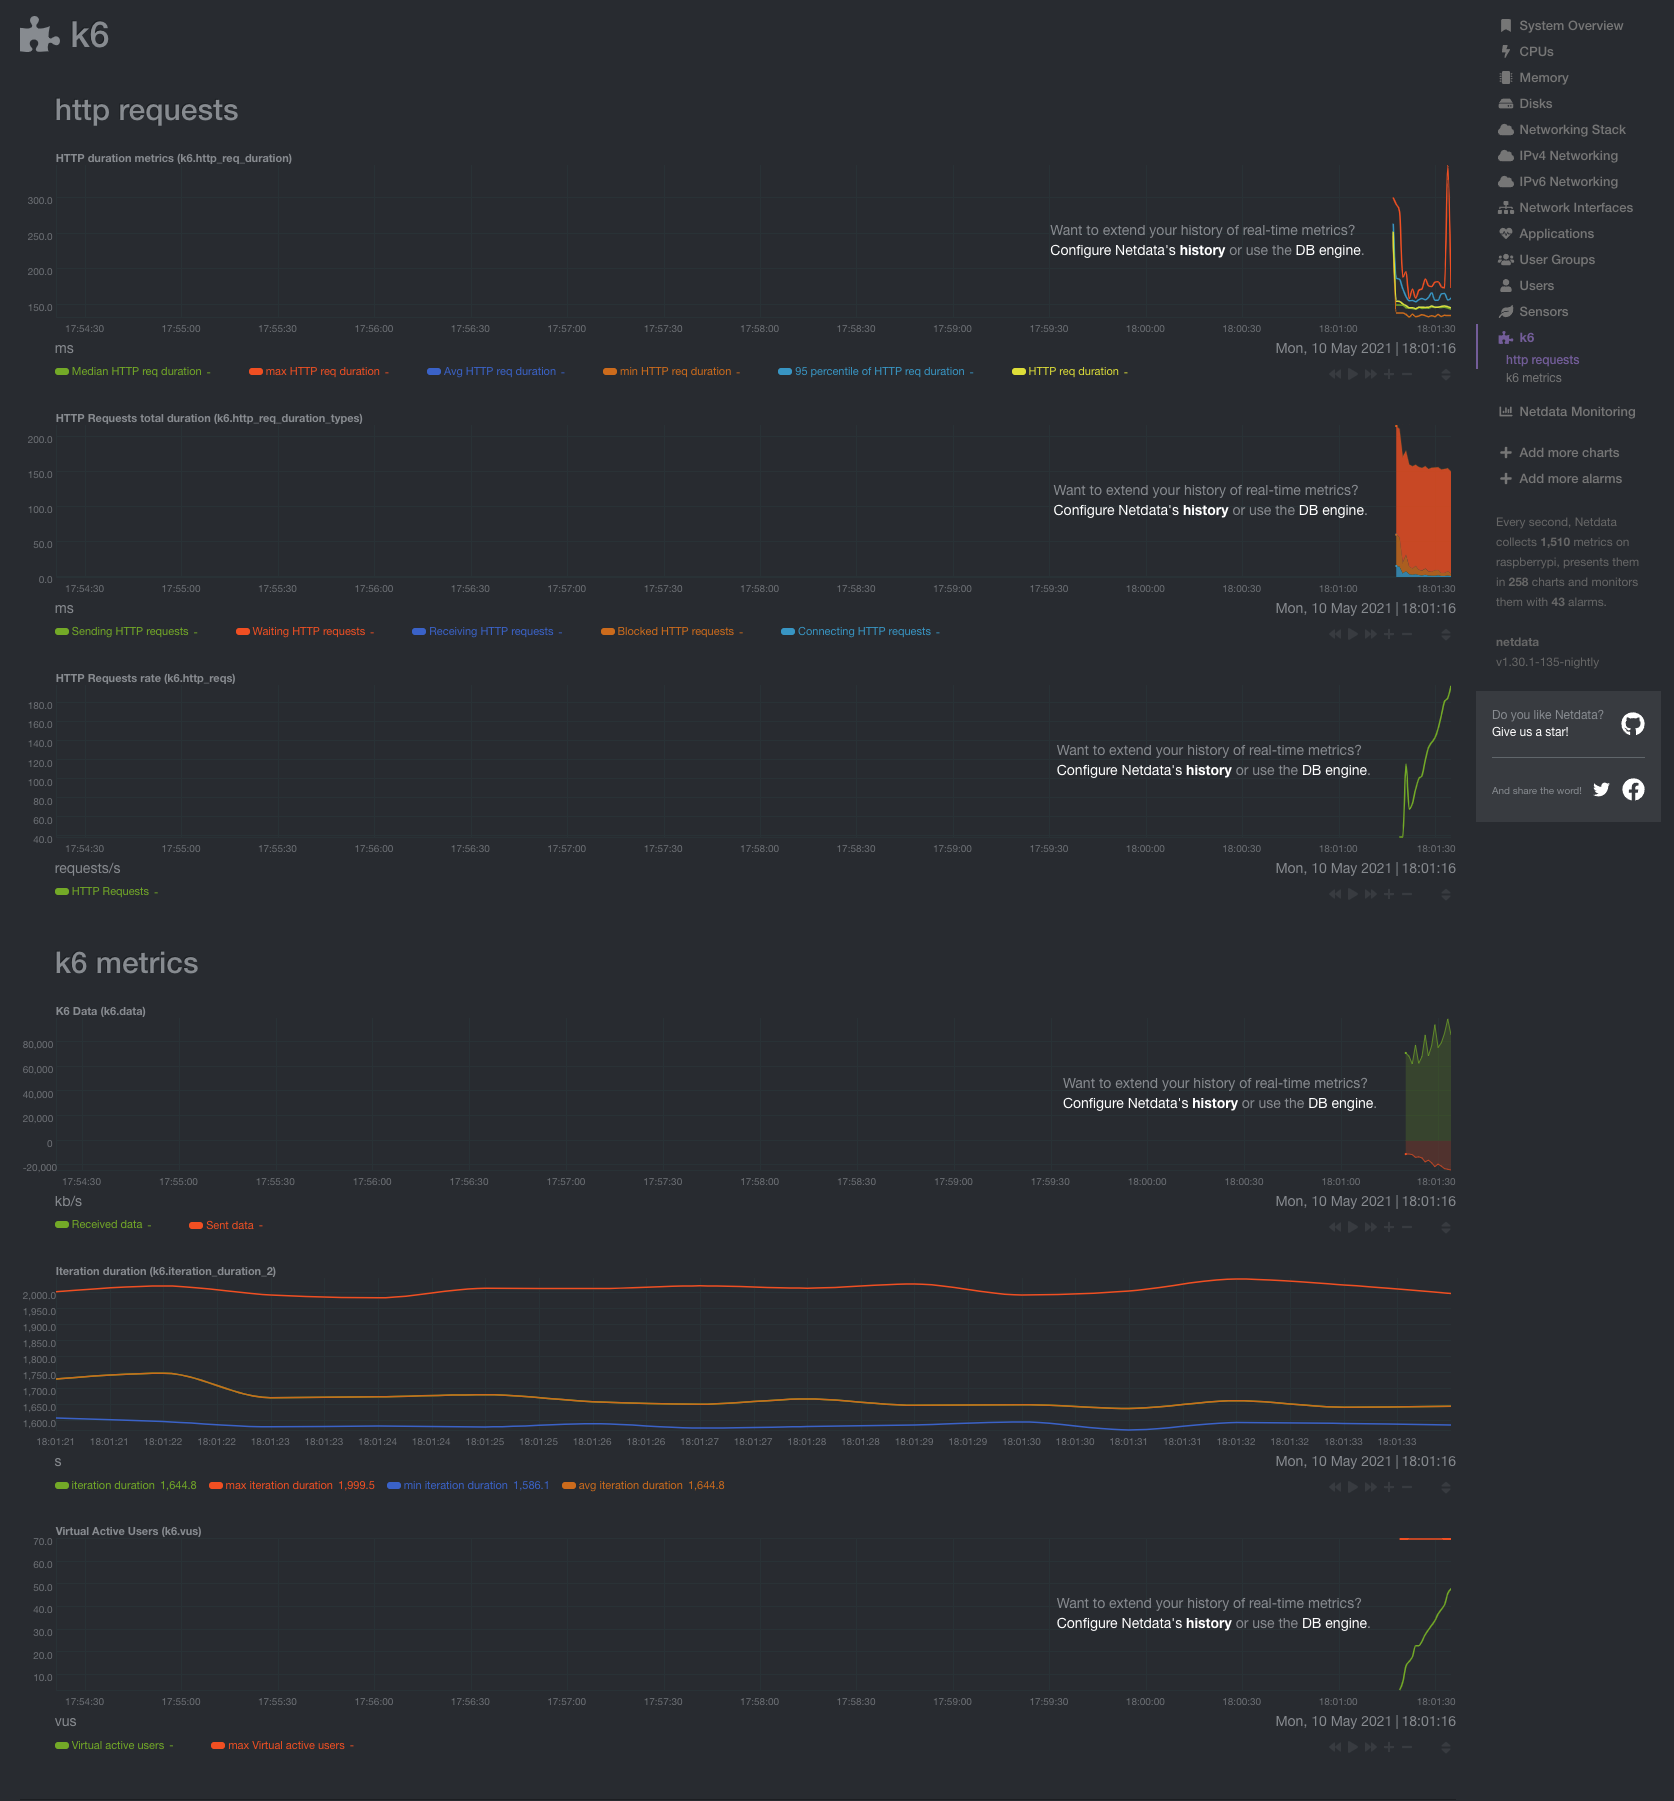 + + +### HTTP Requests + +Number of HTTP requests that K6 generates, per second. + +### Failed HTTP Requests + +Number of failed HTTP requests that K6 generates, per second. + +### Virtual Active Users +Current number of active virtual users. + +### Iteration Duration + +The time it took K6 to complete one full iteration of the main function. + +### Dropped Iterations + +The number of iterations that could not be started either due to lack of Virtual Users or lack of time. + +### Data + +The amount of data received and sent. + +### TTP Requests total duration + +The total duration it took for a round-trip of an HTTP request. It includes: +- Blocked HTTP requests: time spent blocked before initiating the request +- Connecting HTTP requests: time spent establishing TCP connection to the remote host +- Sending HTTP requests: time spent sending data to the remote host +- Receiving HTTP requests: time spent receiving data from the remote host +- Waiting HTTP requests: time spent waiting for response from the remote host + +### HTTP duration metrics + +Different metrics on the HTTP request as defined by K6. The HTTP request duration is defined by K6 as: `HTTP sending request` + `HTTP receiving request` + `HTTP waiting request`. + +Metrics: +- Median +- Average +- Max +- Min +- 95th percentile +- absolute (the value as it is, without any computation) + +## Configuration + +The collector is preconfigured and defined in `statsd.plugin/k6.conf`. + +Due to being a StatsD collector, you only need to define the configuration file and then send data to Netdata using the StatsD protocol. + +If Netdata is running on the same machine as K6, no further configuration is required. Otherwise, you will have to [point K6](https://k6.io/docs/results-visualization/statsd/) to your node and make sure that the K6 process can reach Netdata. + +The default namespace that is used in the configuration is `k6`. If you change it in K6, you will have to change it as well in the configuration file `k6.conf`. |