
diff options
Diffstat (limited to 'docs/cloud/visualize/nodes.md')
| -rw-r--r-- | docs/cloud/visualize/nodes.md | 30 |
1 files changed, 8 insertions, 22 deletions
diff --git a/docs/cloud/visualize/nodes.md b/docs/cloud/visualize/nodes.md index 9878b6b1..4160166f 100644 --- a/docs/cloud/visualize/nodes.md +++ b/docs/cloud/visualize/nodes.md @@ -1,20 +1,12 @@ ---- -title: "Nodes view" -description: "See charts from all your nodes in one pane of glass, then dive in to embedded dashboards for granular troubleshooting of ongoing issues." -custom_edit_url: "https://github.com/netdata/netdata/blob/master/docs/cloud/visualize/nodes.md" -sidebar_label: "Nodes view" -learn_status: "Published" -learn_topic_type: "Concepts" -learn_rel_path: "Operations/Visualizations" ---- - -The Nodes view lets you see and customize key metrics from any number of Agent-monitored nodes and seamlessly navigate +# Nodes tab + +The Nodes tab lets you see and customize key metrics from any number of Agent-monitored nodes and seamlessly navigate to any node's dashboard for troubleshooting performance issues or anomalies using Netdata's highly-granular metrics. -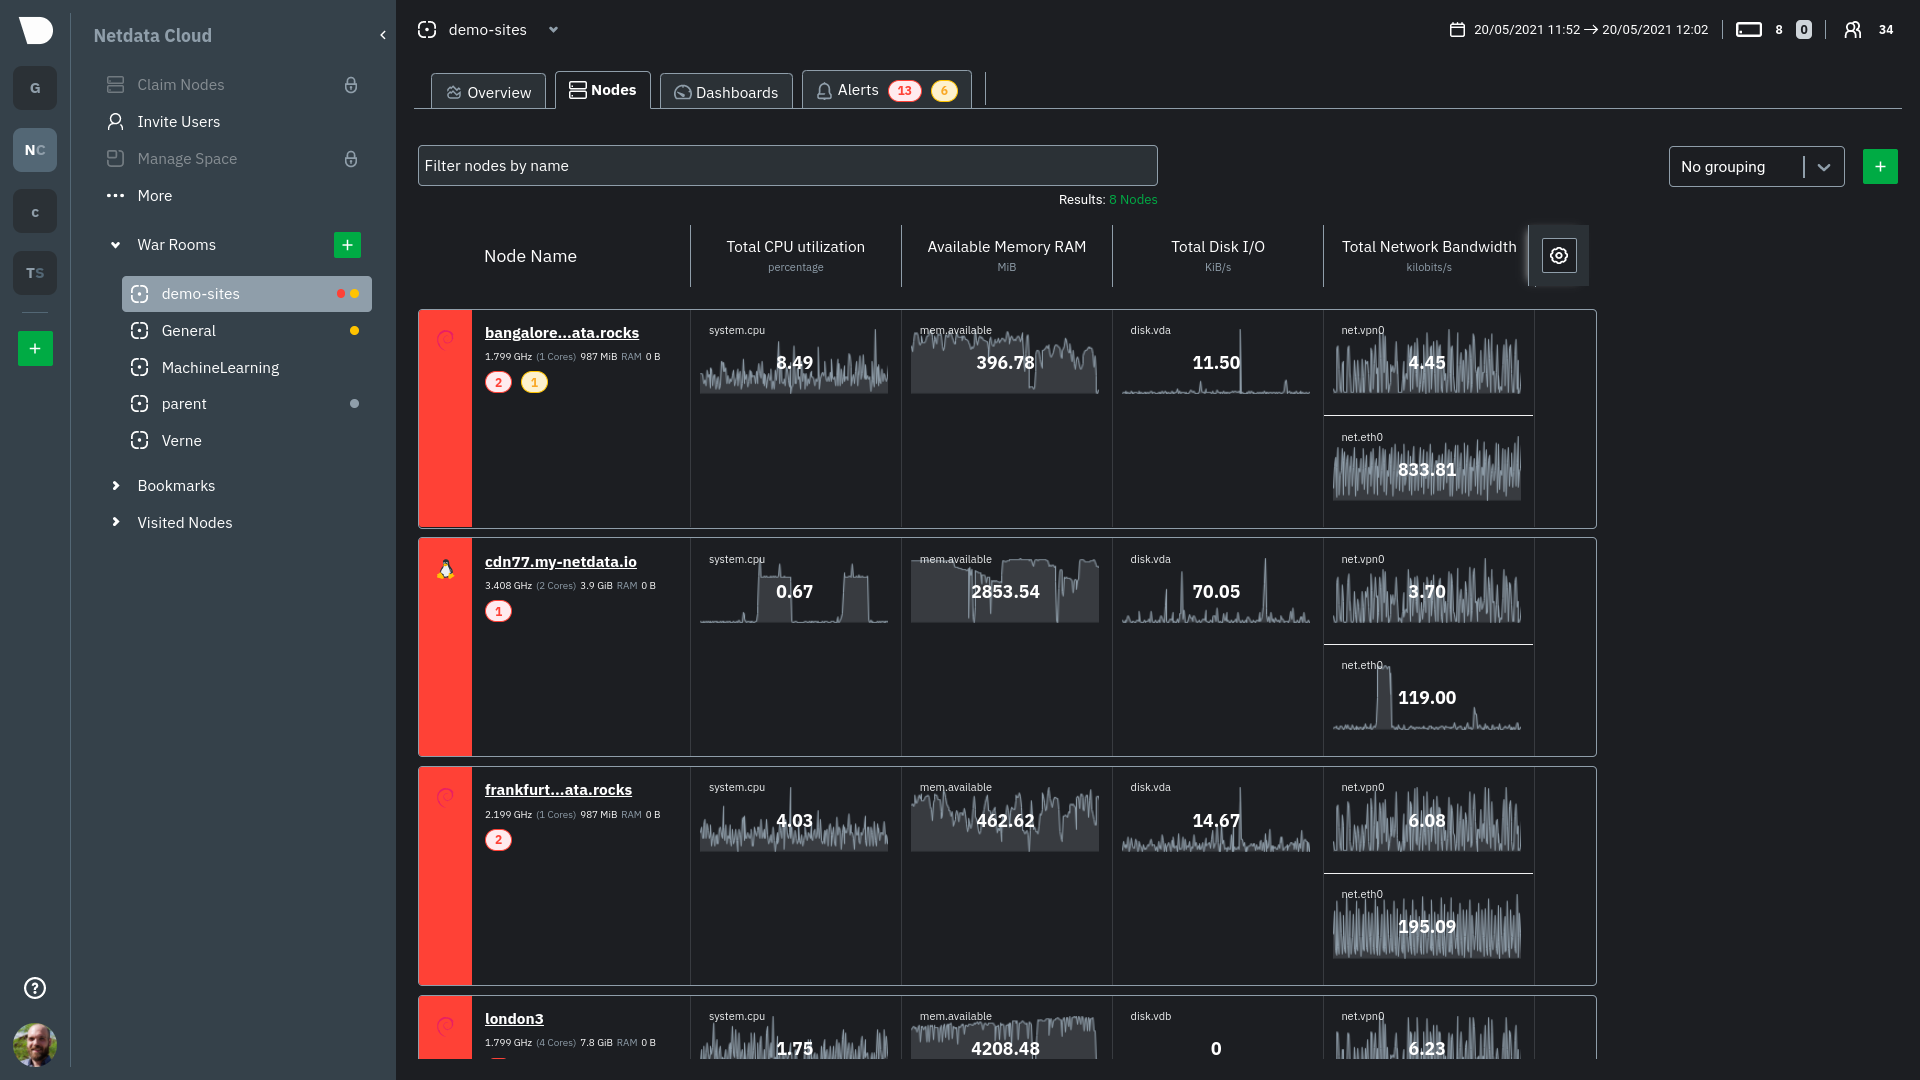 -Each War Room's Nodes view is populated based on the nodes you added to that specific War Room. Each node occupies a +Each War Room's Nodes tab is populated based on the nodes you added to that specific War Room. Each node occupies a single row, first featuring that node's alarm status (yellow for warnings, red for critical alarms) and operating system, some essential information about the node, followed by columns of user-defined key metrics represented in real-time charts. @@ -39,15 +31,9 @@ These customizations appear for anyone else with access to that War Room. ## See more metrics in Netdata Cloud If you want to add more metrics to your War Rooms and they don't show up when you add new metrics to Nodes, you likely -need to configure those nodes to collect from additional data sources. See our [collectors doc](https://github.com/netdata/netdata/blob/master/docs/collect/enable-configure.md) +need to configure those nodes to collect from additional data sources. See our [collectors configuration reference](https://github.com/netdata/netdata/blob/master/collectors/REFERENCE.md) to learn how to use dozens of pre-installed collectors that can instantly collect from your favorite services and applications. -If you want to see up to 30 days of historical metrics in Cloud (and more on individual node dashboards), read our guide -on [long-term storage of historical metrics](https://github.com/netdata/netdata/blob/master/docs/guides/longer-metrics-storage.md). Also, see our -[calculator](/docs/store/change-metrics-storage#calculate-the-system-resources-RAM-disk-space-needed-to-store-metrics) +If you want to see up to 30 days of historical metrics in Cloud (and more on individual node dashboards), read about [changing how long Netdata stores metrics](https://github.com/netdata/netdata/blob/master/docs/store/change-metrics-storage.md). Also, see our +[calculator](https://github.com/netdata/netdata/blob/master/docs/store/change-metrics-storage.md#calculate-the-system-resources-ram-disk-space-needed-to-store-metrics) for finding the disk and RAM you need to store metrics for a certain period of time. - -## What's next? - -Now that you know how to view your nodes at a glance, learn how to [track active -alarms](https://github.com/netdata/netdata/blob/master/docs/cloud/alerts-notifications/view-active-alerts.mdx) with the Alerts Smartboard. |