
diff options
Diffstat (limited to 'docs/cloud/visualize/nodes.md')
| -rw-r--r-- | docs/cloud/visualize/nodes.md | 53 |
1 files changed, 53 insertions, 0 deletions
diff --git a/docs/cloud/visualize/nodes.md b/docs/cloud/visualize/nodes.md new file mode 100644 index 000000000..9878b6b10 --- /dev/null +++ b/docs/cloud/visualize/nodes.md @@ -0,0 +1,53 @@ +--- +title: "Nodes view" +description: "See charts from all your nodes in one pane of glass, then dive in to embedded dashboards for granular troubleshooting of ongoing issues." +custom_edit_url: "https://github.com/netdata/netdata/blob/master/docs/cloud/visualize/nodes.md" +sidebar_label: "Nodes view" +learn_status: "Published" +learn_topic_type: "Concepts" +learn_rel_path: "Operations/Visualizations" +--- + +The Nodes view lets you see and customize key metrics from any number of Agent-monitored nodes and seamlessly navigate +to any node's dashboard for troubleshooting performance issues or anomalies using Netdata's highly-granular metrics. + +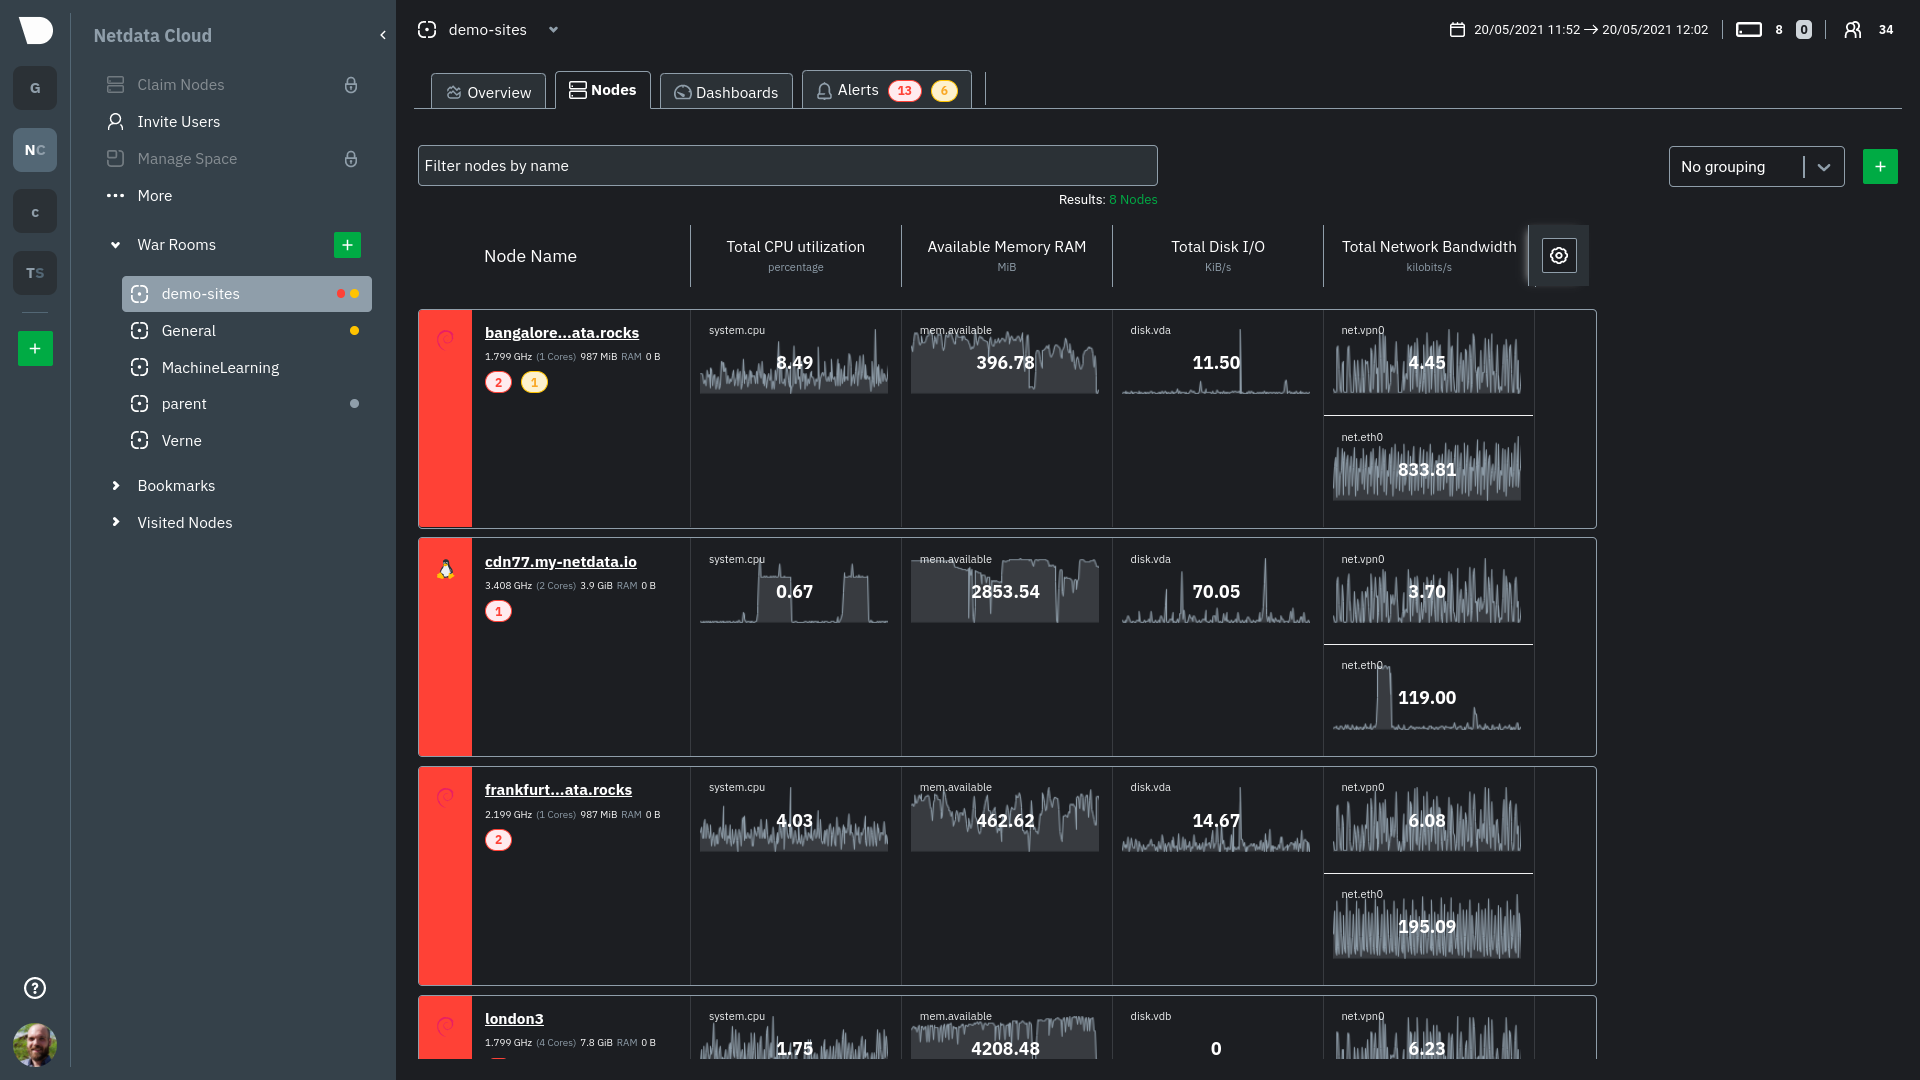 + +Each War Room's Nodes view is populated based on the nodes you added to that specific War Room. Each node occupies a +single row, first featuring that node's alarm status (yellow for warnings, red for critical alarms) and operating +system, some essential information about the node, followed by columns of user-defined key metrics represented in +real-time charts. + +Use the [Overview](https://github.com/netdata/netdata/blob/master/docs/cloud/visualize/overview.md) for monitoring an infrastructure in real time using +composite charts and Netdata's familiar dashboard UI. + +Check the [War Room docs](https://github.com/netdata/netdata/blob/master/docs/cloud/war-rooms.md) for details on the utility bar, which contains the [node +filter](https://github.com/netdata/netdata/blob/master/docs/cloud/war-rooms.md#node-filter) and the [timeframe +selector](https://github.com/netdata/netdata/blob/master/docs/cloud/war-rooms.md#play-pause-force-play-and-timeframe-selector). + +## Add and customize metrics columns + +Add more metrics columns by clicking the gear icon. Choose the context you'd like to add, give it a relevant name, and +select whether you want to see all dimensions (the default), or only the specific dimensions your team is interested in. + +Click the gear icon and hover over any existing charts, then click the pencil icon. This opens a panel to +edit that chart. Edit the context, its title, add or remove dimensions, or delete the chart altogether. + +These customizations appear for anyone else with access to that War Room. + +## See more metrics in Netdata Cloud + +If you want to add more metrics to your War Rooms and they don't show up when you add new metrics to Nodes, you likely +need to configure those nodes to collect from additional data sources. See our [collectors doc](https://github.com/netdata/netdata/blob/master/docs/collect/enable-configure.md) +to learn how to use dozens of pre-installed collectors that can instantly collect from your favorite services and applications. + +If you want to see up to 30 days of historical metrics in Cloud (and more on individual node dashboards), read our guide +on [long-term storage of historical metrics](https://github.com/netdata/netdata/blob/master/docs/guides/longer-metrics-storage.md). Also, see our +[calculator](/docs/store/change-metrics-storage#calculate-the-system-resources-RAM-disk-space-needed-to-store-metrics) +for finding the disk and RAM you need to store metrics for a certain period of time. + +## What's next? + +Now that you know how to view your nodes at a glance, learn how to [track active +alarms](https://github.com/netdata/netdata/blob/master/docs/cloud/alerts-notifications/view-active-alerts.mdx) with the Alerts Smartboard. |