
diff options
Diffstat (limited to 'docs/cloud/war-rooms.md')
| -rw-r--r-- | docs/cloud/war-rooms.md | 168 |
1 files changed, 33 insertions, 135 deletions
diff --git a/docs/cloud/war-rooms.md b/docs/cloud/war-rooms.md index 99f9e368..c599fd5b 100644 --- a/docs/cloud/war-rooms.md +++ b/docs/cloud/war-rooms.md @@ -1,162 +1,60 @@ ---- -title: "War Rooms" -description: >- - "Netdata Cloud uses War Rooms to group related nodes and create insightful compositedashboards based on - their aggregate health and performance." -custom_edit_url: "https://github.com/netdata/netdata/blob/master/docs/cloud/war-rooms.md" -sidebar_label: "War Rooms" -learn_status: "Published" -learn_topic_type: "Tasks" -learn_rel_path: "Operations" ---- - -War Rooms organize your connected nodes and provide infrastructure-wide dashboards using real-time metrics and -visualizations. - -Once you add nodes to a Space, all of your nodes will be visible in the _All nodes_ War Room. This is a special War Room -which gives you an overview of all of your nodes in this particular space. Then you can create functional separations of -your nodes into more War Rooms. Every War Room has its own dashboards, navigation, indicators, and management tools. - - - -## Navigation - -### Switching between views - static tabs - -Every War Rooms provides multiple views. Each view focus on a particular area/subject of the nodes which you monitor in -this War Rooms. Let's explore what view you have available: - -- The default view for any War Room is - the [Home tab](https://github.com/netdata/netdata/blob/master/docs/cloud/visualize/overview.md#home), which give you - an overview - of this space. Here you can see the number of Nodes claimed, data retention statics, user particate, alerts and more - -- The second and most important view is - the [Overview tab](https://github.com/netdata/netdata/blob/master/docs/cloud/visualize/overview.md#overview) which - uses composite - charts to display real-time metrics from every available node in a given War Room. - -- The [Nodes tab](https://github.com/netdata/netdata/blob/master/docs/cloud/visualize/nodes.md) gives you the ability to - see the status (offline or online), host details - , alarm status and also a short overview of some key metrics from all your nodes at a glance. - -- [Kubernetes tab](https://github.com/netdata/netdata/blob/master/docs/cloud/visualize/kubernetes.md) is a logical - grouping of charts regards to your Kubernetes clusters. - It contains a subset of the charts available in the _Overview tab_ - -- - -The [Dashboards tab](https://github.com/netdata/netdata/blob/master/docs/cloud/visualize/dashboards.md) -gives you the ability to have tailored made views of -specific/targeted interfaces for your infrastructure using any number of charts from any number of nodes. - -- The **Alerts tab** provides you with an overview for all the active alerts you receive for the nodes in this War Room, - you can also see alla the alerts that are configured to be triggered in any given moment. - -- The **Anomalies tab** is dedicated to - the [Anomaly Advisor](https://github.com/netdata/netdata/blob/master/docs/cloud/insights/anomaly-advisor.mdx) tool +# Netdata Cloud War rooms -### Non static tabs +Netdata Cloud uses War Rooms to organize your connected nodes and provide infrastructure-wide dashboards using real-time metrics and visualizations. -If you open -a [new dashboard](https://github.com/netdata/netdata/blob/master/docs/cloud/visualize/dashboards.md), -jump to a single-node dashboard, or navigate to a dedicated alert page they will open in a new War Room tab. - -Tabs can be rearranged with drag-and-drop or closed with the **X** button. Open tabs persist between sessions, so you -can always come right back to your preferred setup. - -### Play, pause, force play, and timeframe selector - -A War Room has three different states: playing, paused, and force playing. The default playing state refreshes charts -every second as long as the browser tab is in -focus. [Interacting with a chart](https://github.com/netdata/netdata/blob/master/docs/dashboard/interact-charts.mdx) -pauses -the War Room. Once the tab loses focus, charts pause automatically. - -The top navigation bar features a play/pause button to quickly change the state, and a dropdown to select **Force Play** -, which keeps charts refreshing, potentially at the expense of system performance. - -Next to the play/pause button is the timeframe selector, which helps you select a precise window of metrics data to -visualize. By default, all visualizations in Netdata Cloud show the last 15 minutes of metrics data. - -Use the **Quick Selector** to visualize metrics from predefined timeframes, or use the input field below to enter a -number and an appropriate unit of time. The calendar allows you to select multiple days of metrics data. - -Click **Apply** to re-render all visualizations with new metrics data streamed to your browser from each distributed -node. Click **Clear** to remove any changes and apply the default 15-minute timeframe. - -The fields beneath the calendar display the beginning and ending timestamps your selected timeframe. - -### Node filter - -The node filter allows you to quickly filter the nodes visualized in a War Room's views. It appears on all views, but -not on single-node dashboards. +Once you add nodes to a Space, all of your nodes will be visible in the **All nodes** War Room. This is a special War Room +which gives you an overview of all of your nodes in this particular Space. Then you can create functional separations of +your nodes into more War Rooms. Every War Room has its own dashboards, navigation, indicators, and management tools. -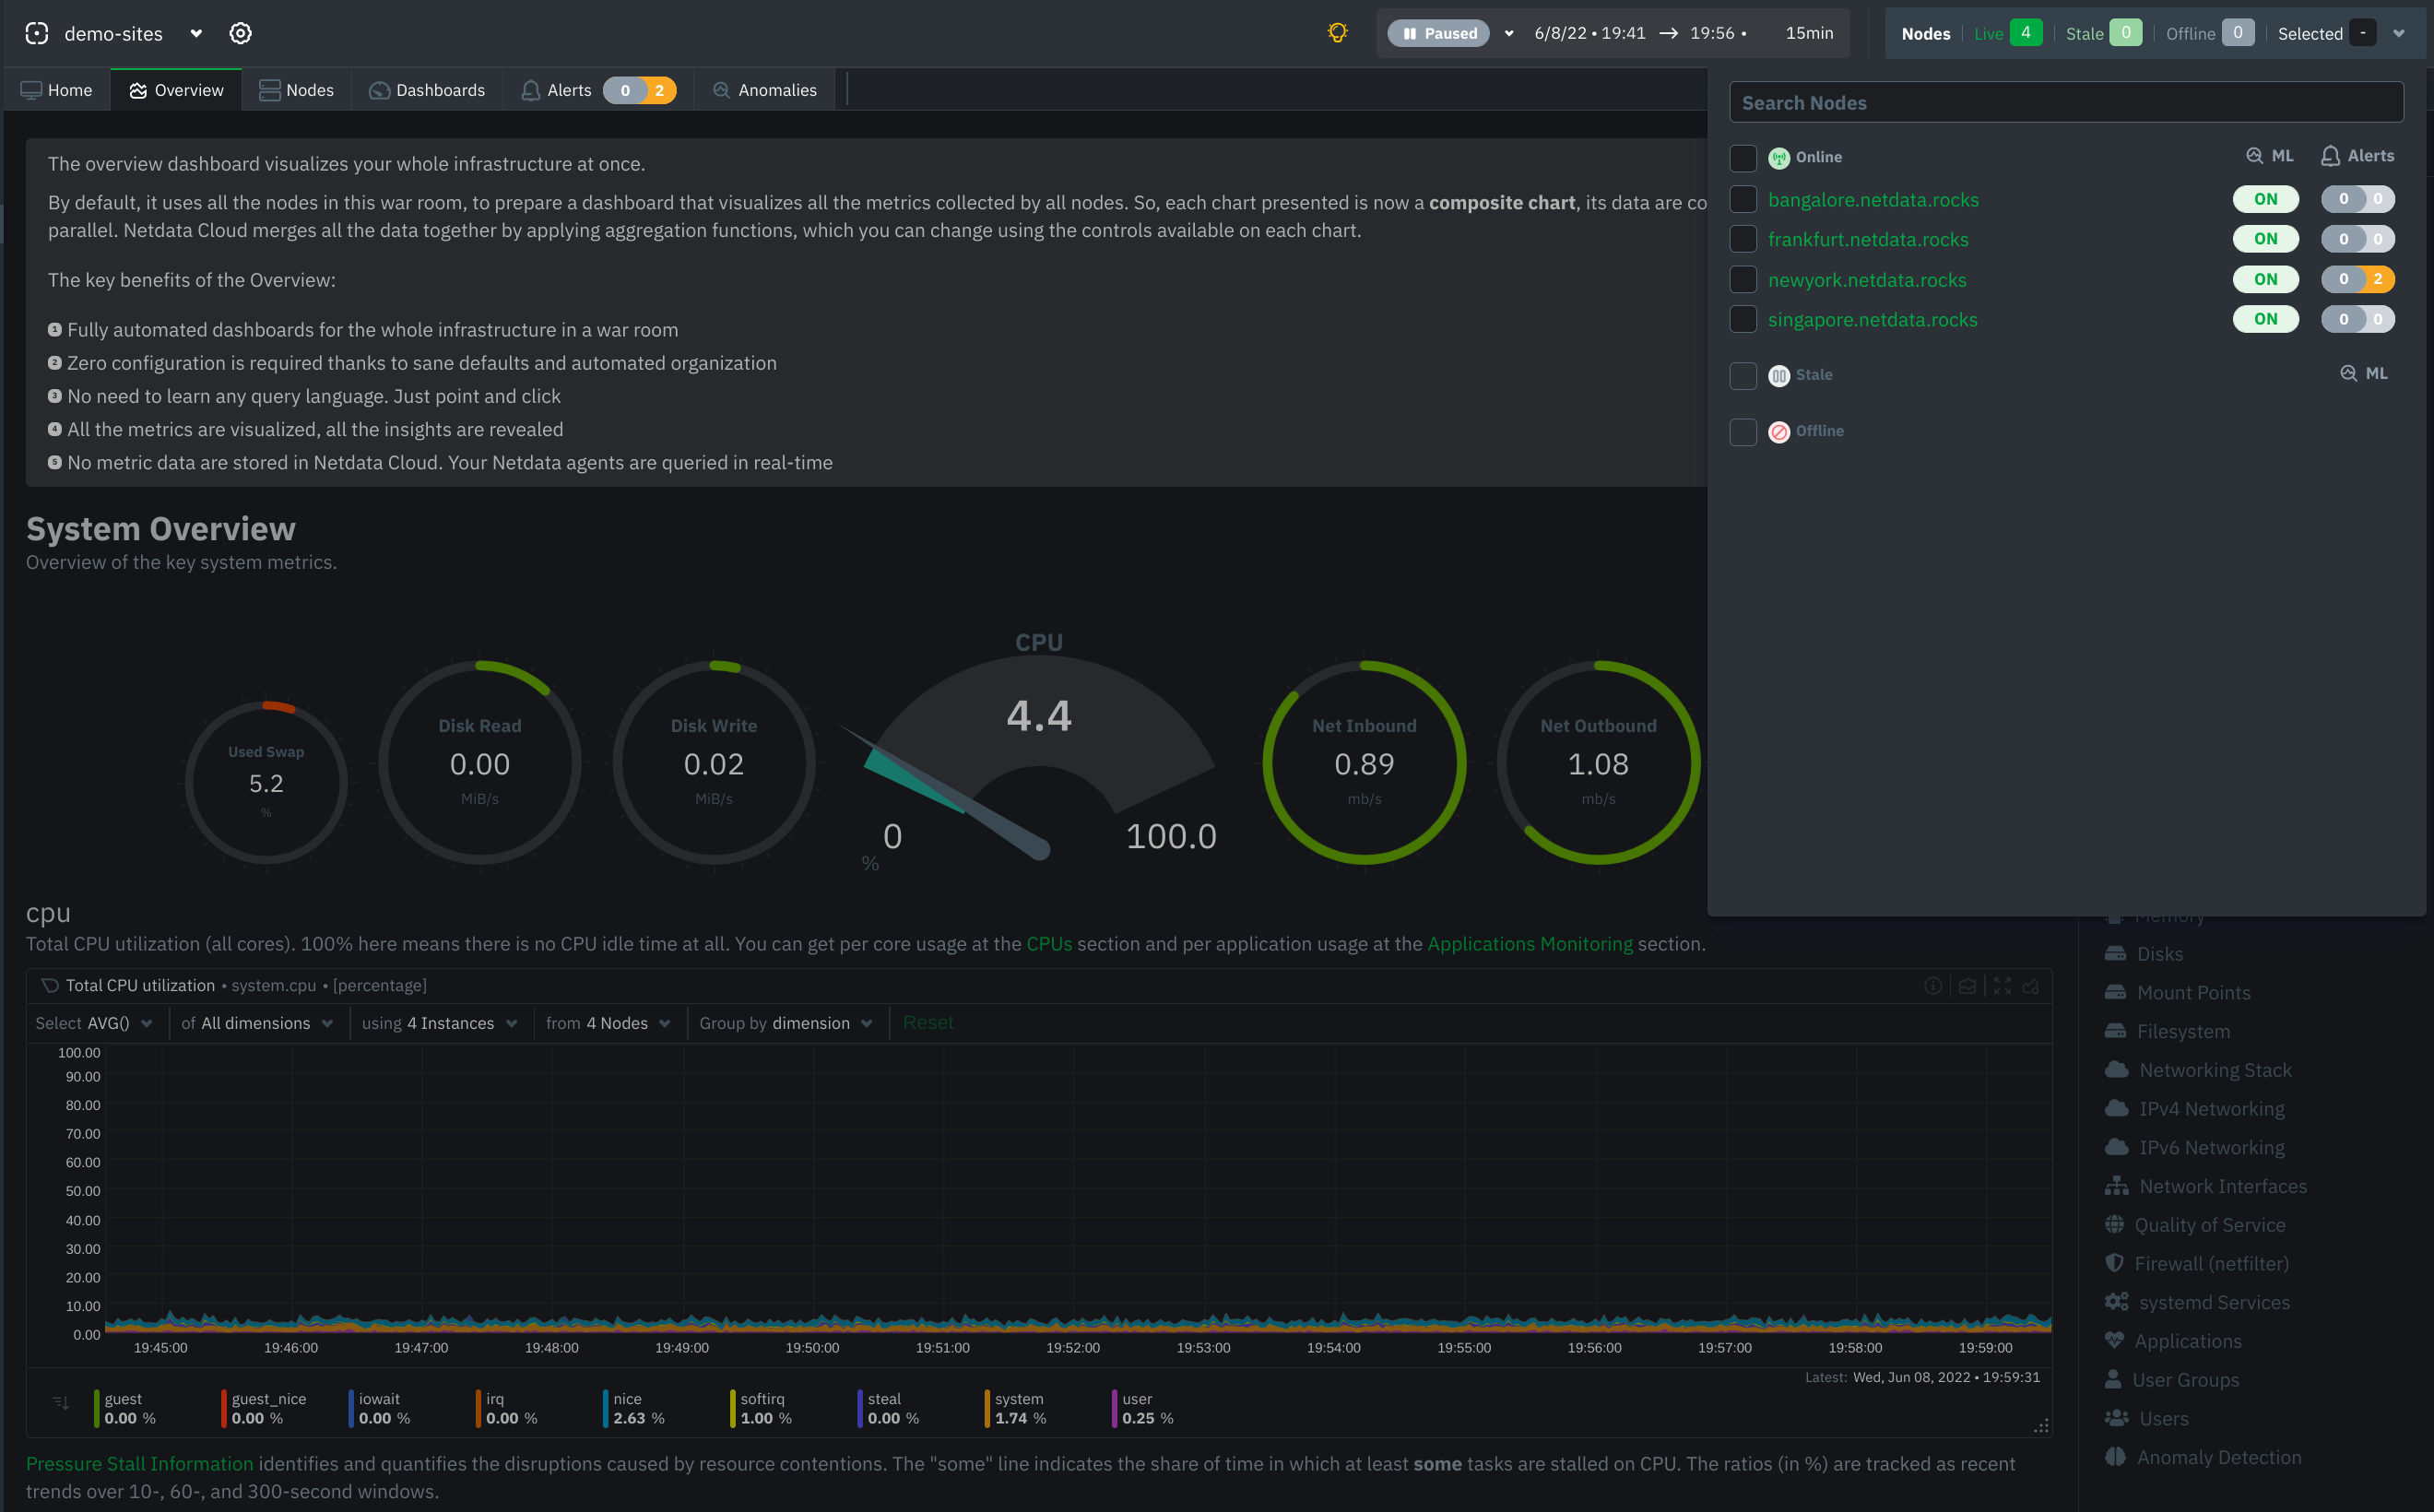 +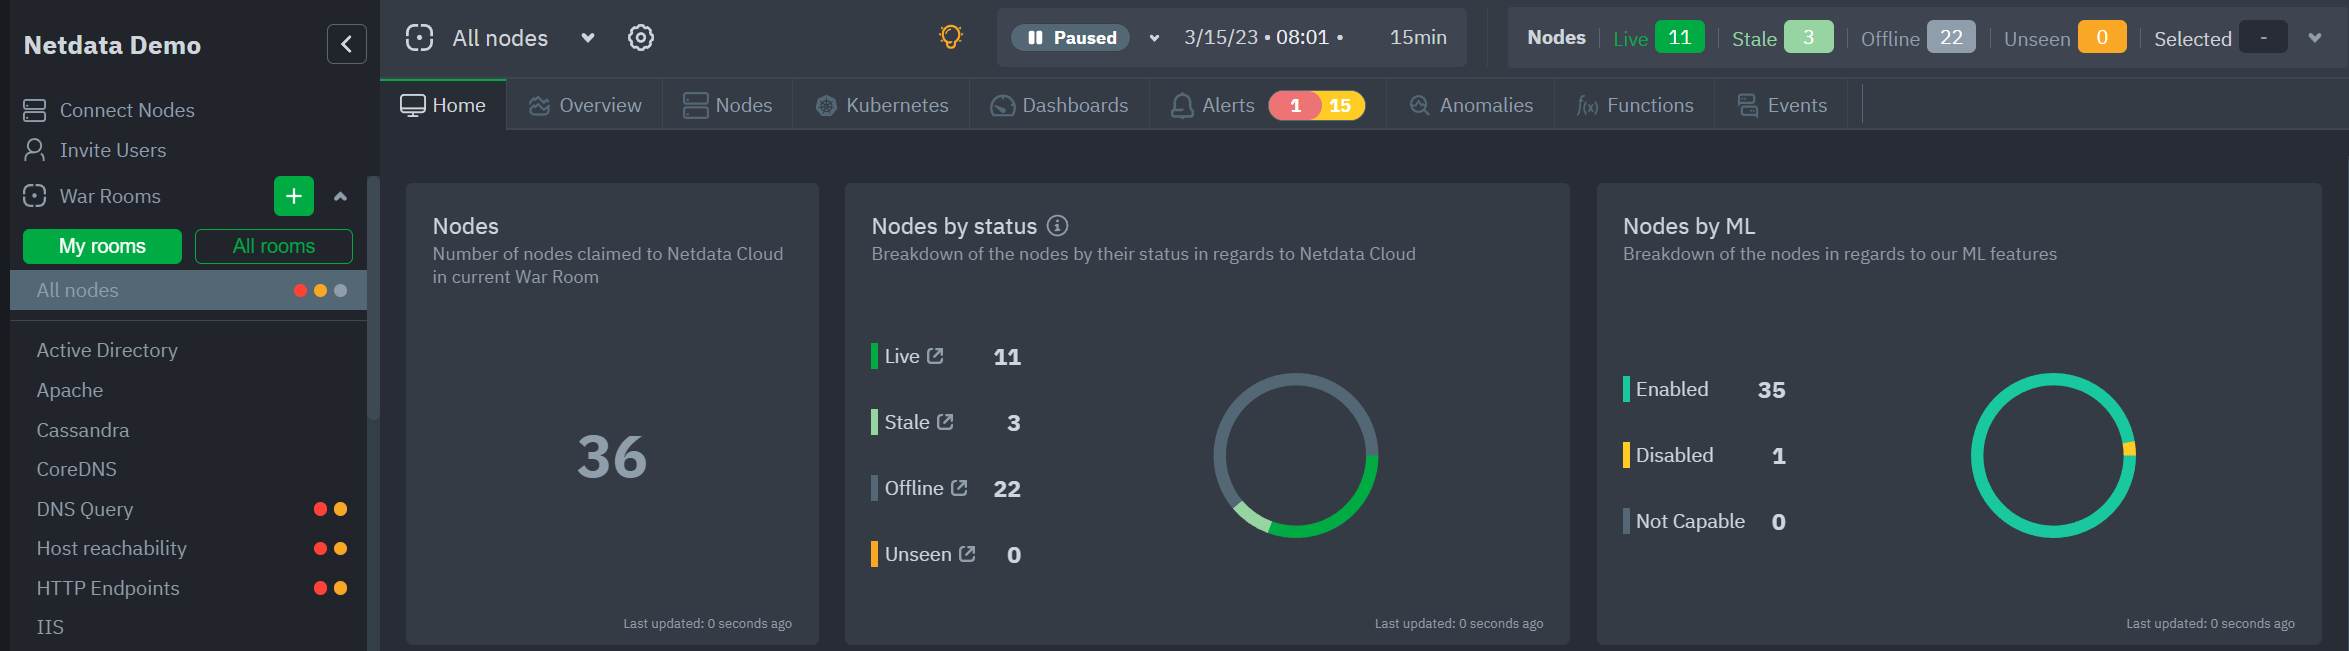 ## War Room organization We recommend a few strategies for organizing your War Rooms. -**Service, purpose, location, etc.**: You can group War Rooms by a service (think Nginx, MySQL, Pulsar, and so on), -their purpose (webserver, database, application), their physical location, whether they're baremetal or a Docker -container, the PaaS/cloud provider it runs on, and much more. This allows you to see entire slices of your -infrastructure by moving from one War Room to another. +- **Service, purpose, location, etc.** + You can group War Rooms by a service (Nginx, MySQL, Pulsar, and so on), their purpose (webserver, database, application), their physical location, whether they're "bare metal" or a Docker container, the PaaS/cloud provider it runs on, and much more. + This allows you to see entire slices of your infrastructure by moving from one War Room to another. -**End-to-end apps/services**: If you have a user-facing SaaS product, or an internal service that said product relies -on, you may want to monitor that entire stack in a single War Room. This might include Kubernetes clusters, Docker -containers, proxies, databases, web servers, brokers, and more. End-to-end War Rooms are valuable tools for ensuring the -health and performance of your organization's essential services. +- **End-to-end apps/services** + If you have a user-facing SaaS product, or an internal service that this said product relies on, you may want to monitor that entire stack in a single War Room. This might include Kubernetes clusters, Docker containers, proxies, databases, web servers, brokers, and more. + End-to-end War Rooms are valuable tools for ensuring the health and performance of your organization's essential services. -**Incident response**: You can also create new War Rooms as one of the first steps in your incident response process. -For example, you have a user-facing web app that relies on Apache Pulsar for a message queue, and one of your nodes -using the [Pulsar collector](https://github.com/netdata/go.d.plugin/blob/master/modules/pulsar/README.md) begins -reporting a suspiciously low messages rate. You can create a War Room called `$year-$month-$day-pulsar-rate`, add all -your Pulsar nodes in addition to nodes they connect to, and begin diagnosing the root cause in a War Room optimized for -getting to resolution as fast as possible. +- **Incident response** + You can also create new War Rooms as one of the first steps in your incident response process. + For example, you have a user-facing web app that relies on Apache Pulsar for a message queue, and one of your nodes using the [Pulsar collector](https://github.com/netdata/go.d.plugin/blob/master/modules/pulsar/README.md) begins reporting a suspiciously low messages rate. + You can create a War Room called `$year-$month-$day-pulsar-rate`, add all your Pulsar nodes in addition to nodes they connect to, and begin diagnosing the root cause in a War Room optimized for getting to resolution as fast as possible. ## Add War Rooms -To add new War Rooms to any Space, click on the green plus icon **+** next the **War Rooms** heading. on the left ( -space's) sidebar. +To add new War Rooms to any Space, click on the green plus icon **+** next the **War Rooms** heading on the left (Space's) sidebar. -In the panel, give the War Room a name and description, and choose whether it's public or private. Anyone in your Space -can join public War Rooms, but can only join private War Rooms with an invitation. +In the panel, give the War Room a name and description, and choose whether it's public or private. +Anyone in your Space can join public War Rooms, but can only join private War Rooms with an invitation. ## Manage War Rooms -All the users and nodes involved in a particular space can potential be part of a War Room. +All the users and nodes involved in a particular Space can be part of a War Room. -Any user can change simple settings of a War room, like the name or the users participating in it. Click on the gear -icon of the War Room's name in the top of the page to do that. A sidebar will open with options for this War Room: +Any user can change simple settings of a War room, like the name or the users participating in it. +Click on the gear icon of the War Room's name in the top of the page to do that. A sidebar will open with options for this War Room: -1. To _change a War Room's name, description, or public/private status_, click on **War Room** tab of the sidebar. +1. To **change a War Room's name, description, or public/private status**, click on **War Room** tab. -2. To _include an existing node_ to a War Room or _connect a new node*_ click on **Nodes** tab of the sidebar. Choose - any - connected node you want to add to this War Room by clicking on the checkbox next to its hostname, then click **+ Add - ** - at the top of the panel. +2. To **include an existing node** to a War Room or **connect a new node\*** click on **Nodes** tab. Choose any connected node you want to add to this War Room by clicking on the checkbox next to its hostname, then click **+ Add** at the top of the panel. -3. To _add existing users to a War Room_, click on **Add Users**. See - our [invite doc](https://github.com/netdata/netdata/blob/master/docs/cloud/manage/invite-your-team.md) - for details on inviting new users to your Space in Netdata Cloud. +3. To **add existing users to a War Room**, click on **Add Users**. + See our [invite doc](https://github.com/netdata/netdata/blob/master/docs/cloud/manage/invite-your-team.md) for details on inviting new users to your Space in Netdata Cloud. -:::note -\* This action requires admin rights for this space -::: +> ### Note +> +>\* This action requires **admin** rights for this Space ### More actions -To _view or remove nodes_ in a War Room, click on **Nodes view**. To remove a node from the current War Room, click on +To **view or remove nodes** in a War Room, click on the **Nodes tab**. To remove a node from the current War Room, click on the **🗑** icon. -:::info -Removing a node from a War Room does not remove it from your Space. -::: - -## What's next? - -Once you've figured out an organizational structure that works for your team, learn more about how you can use Netdata -Cloud to monitor distributed nodes -using [real-time composite charts](https://github.com/netdata/netdata/blob/master/docs/cloud/visualize/overview.md). +> ### Info +> +> Removing a node from a War Room does not remove it from your Space. |