
diff options
Diffstat (limited to 'docs/cloud')
| -rw-r--r-- | docs/cloud/alerts-configuration-manager.md | 71 | ||||
| -rw-r--r-- | docs/cloud/alerts-notifications/manage-notification-methods.md | 2 | ||||
| -rw-r--r-- | docs/cloud/alerts-notifications/notifications.md | 6 | ||||
| -rw-r--r-- | docs/cloud/cheatsheet.md | 6 | ||||
| -rw-r--r-- | docs/cloud/insights/anomaly-advisor.md | 8 | ||||
| -rw-r--r-- | docs/cloud/insights/metric-correlations.md | 4 | ||||
| -rw-r--r-- | docs/cloud/manage/organize-your-infrastrucutre-invite-your-team.md | 4 | ||||
| -rw-r--r-- | docs/cloud/manage/plans.md | 2 | ||||
| -rw-r--r-- | docs/cloud/manage/role-based-access.md | 2 | ||||
| -rw-r--r-- | docs/cloud/manage/themes.md | 17 | ||||
| -rw-r--r-- | docs/cloud/netdata-functions.md | 37 | ||||
| -rw-r--r-- | docs/cloud/runtime-troubleshooting-with-functions.md | 2 | ||||
| -rw-r--r-- | docs/cloud/visualize/interact-new-charts.md | 10 | ||||
| -rw-r--r-- | docs/cloud/visualize/node-filter.md | 2 | ||||
| -rw-r--r-- | docs/cloud/visualize/nodes.md | 2 | ||||
| -rw-r--r-- | docs/cloud/visualize/overview.md | 2 |
16 files changed, 125 insertions, 52 deletions
diff --git a/docs/cloud/alerts-configuration-manager.md b/docs/cloud/alerts-configuration-manager.md new file mode 100644 index 000000000..cedae0eb4 --- /dev/null +++ b/docs/cloud/alerts-configuration-manager.md @@ -0,0 +1,71 @@ +# Creating Alerts with Netdata Alerts Configuration Manager + +The Netdata Alerts Configuration Manager enables users with [Business subscriptions](https://www.netdata.cloud/pricing/) to create alerts from the Netdata Dashboard with an intuitive user interface. + +## Using Alerts Configuration Manager + +1. Go to the **Metrics** tab and navigate to the chart you want to configure an alert for. + +2. Click the **Alert icon** on the top right corner of the chart. + <!--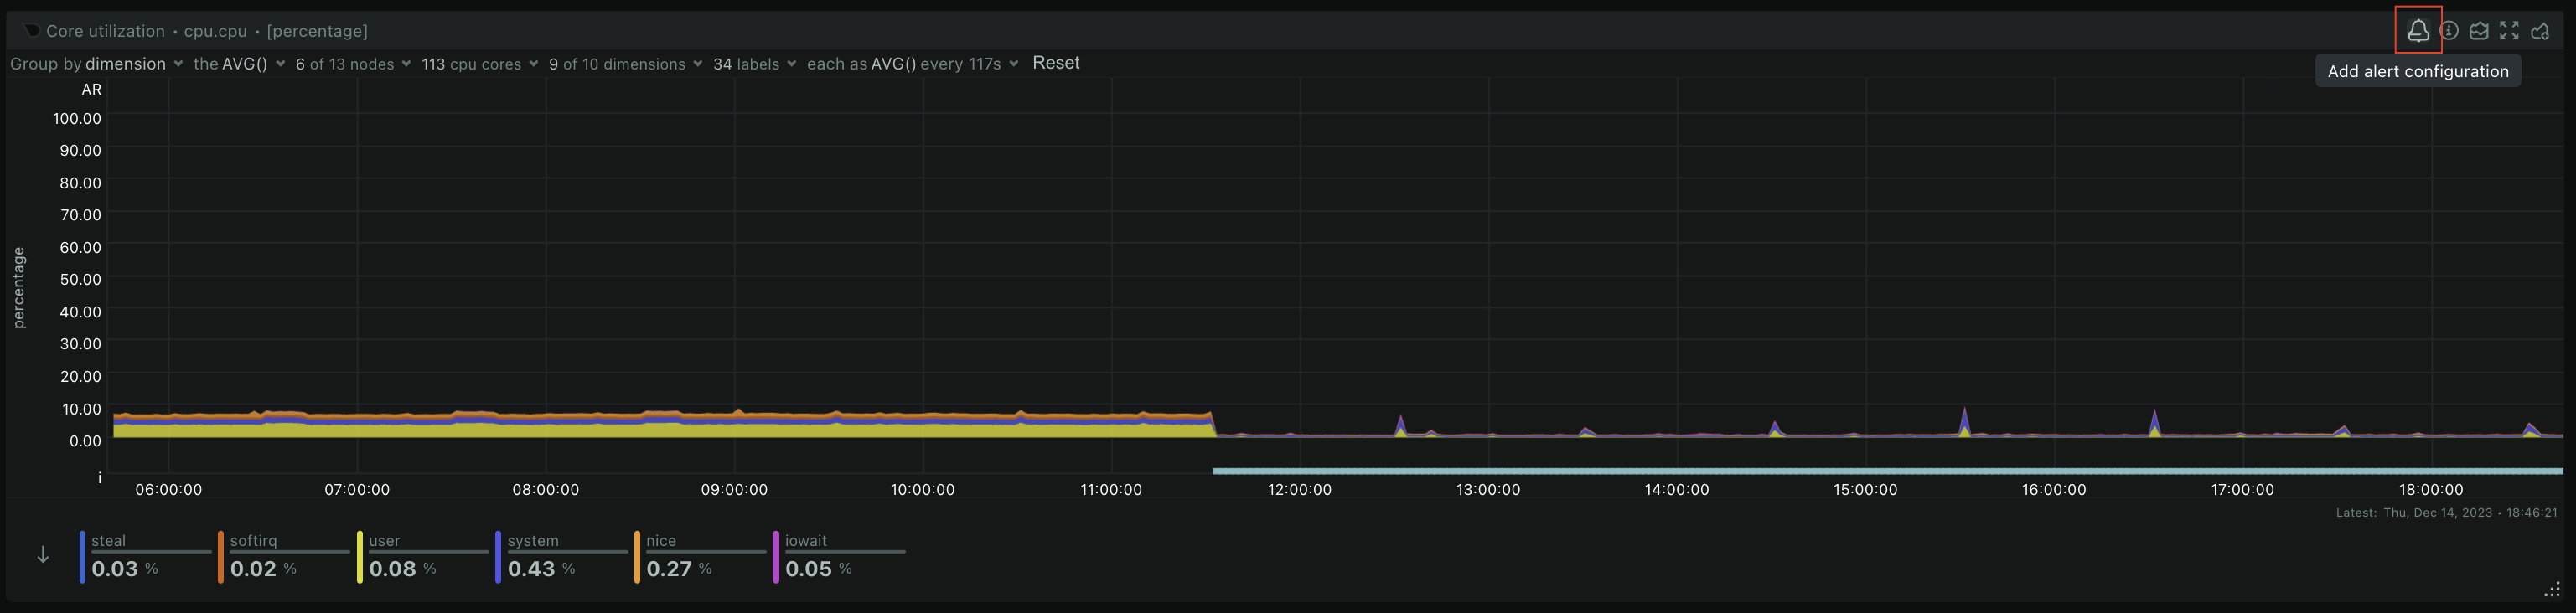--> + +3. The Alert Configuration Manager will open up with the default thresholds. You can modify the configuration as required and the alert definition on the right will be updated dynamically. + <!--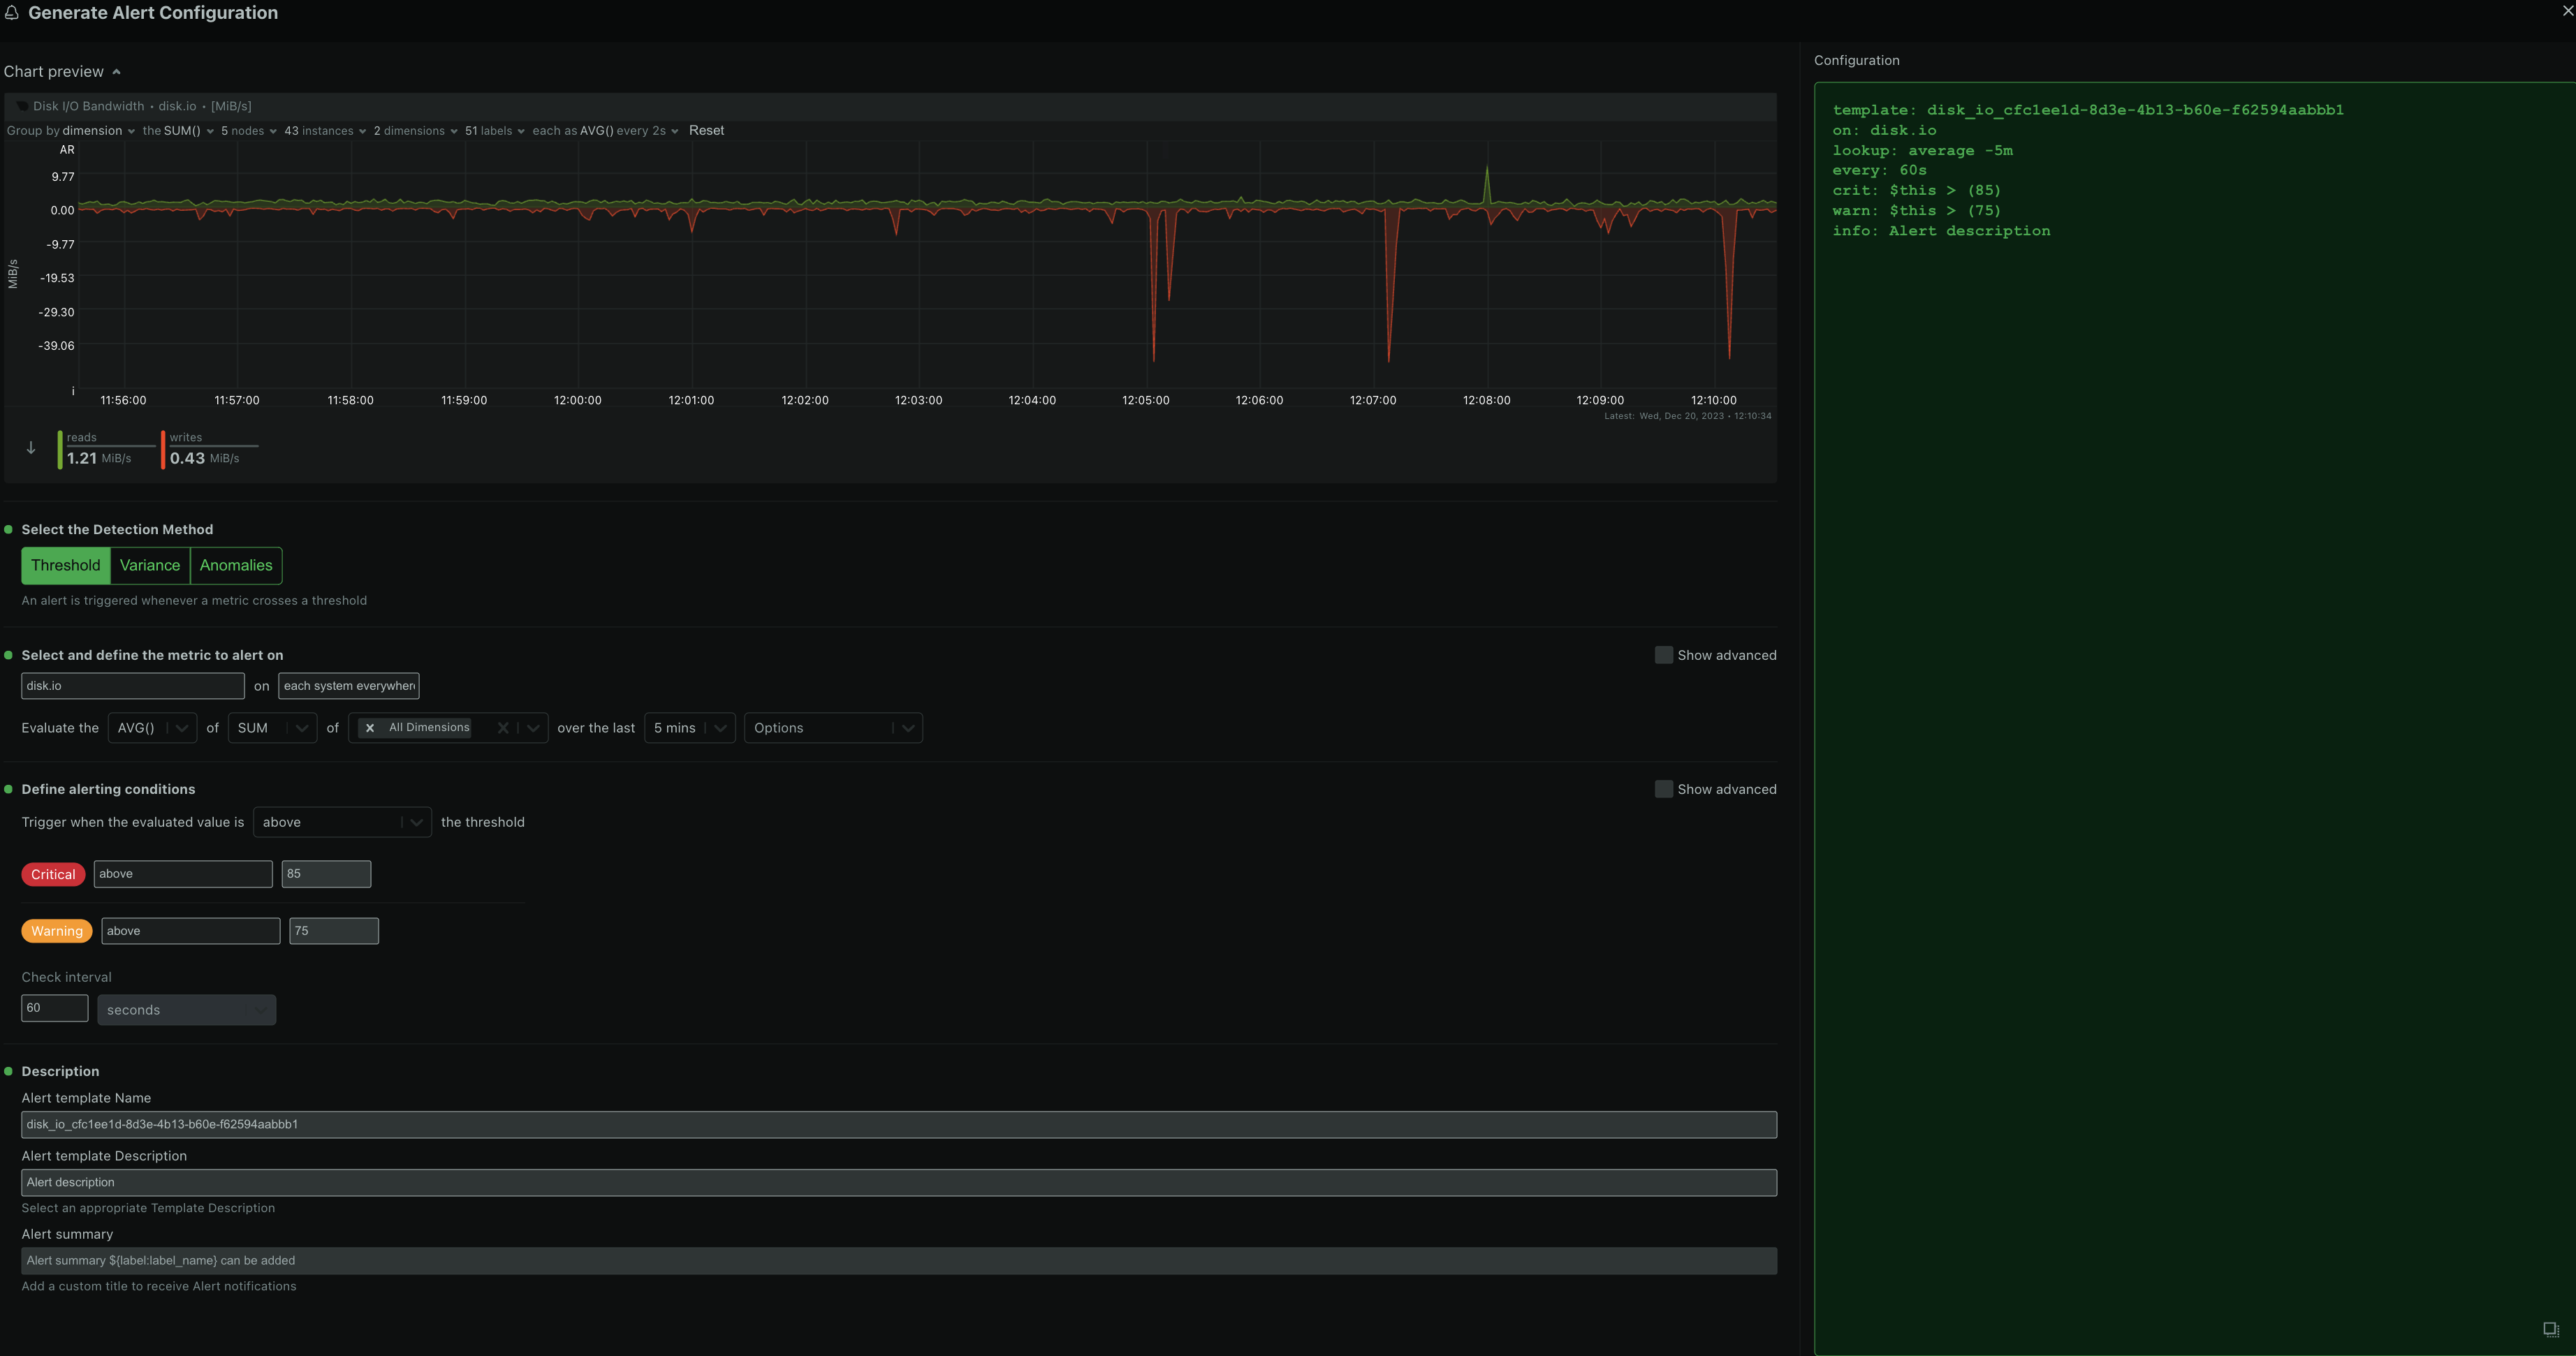--> + +4. If you want more fine-grained control or access to more advanced settings, enable **Show advanced** + <!--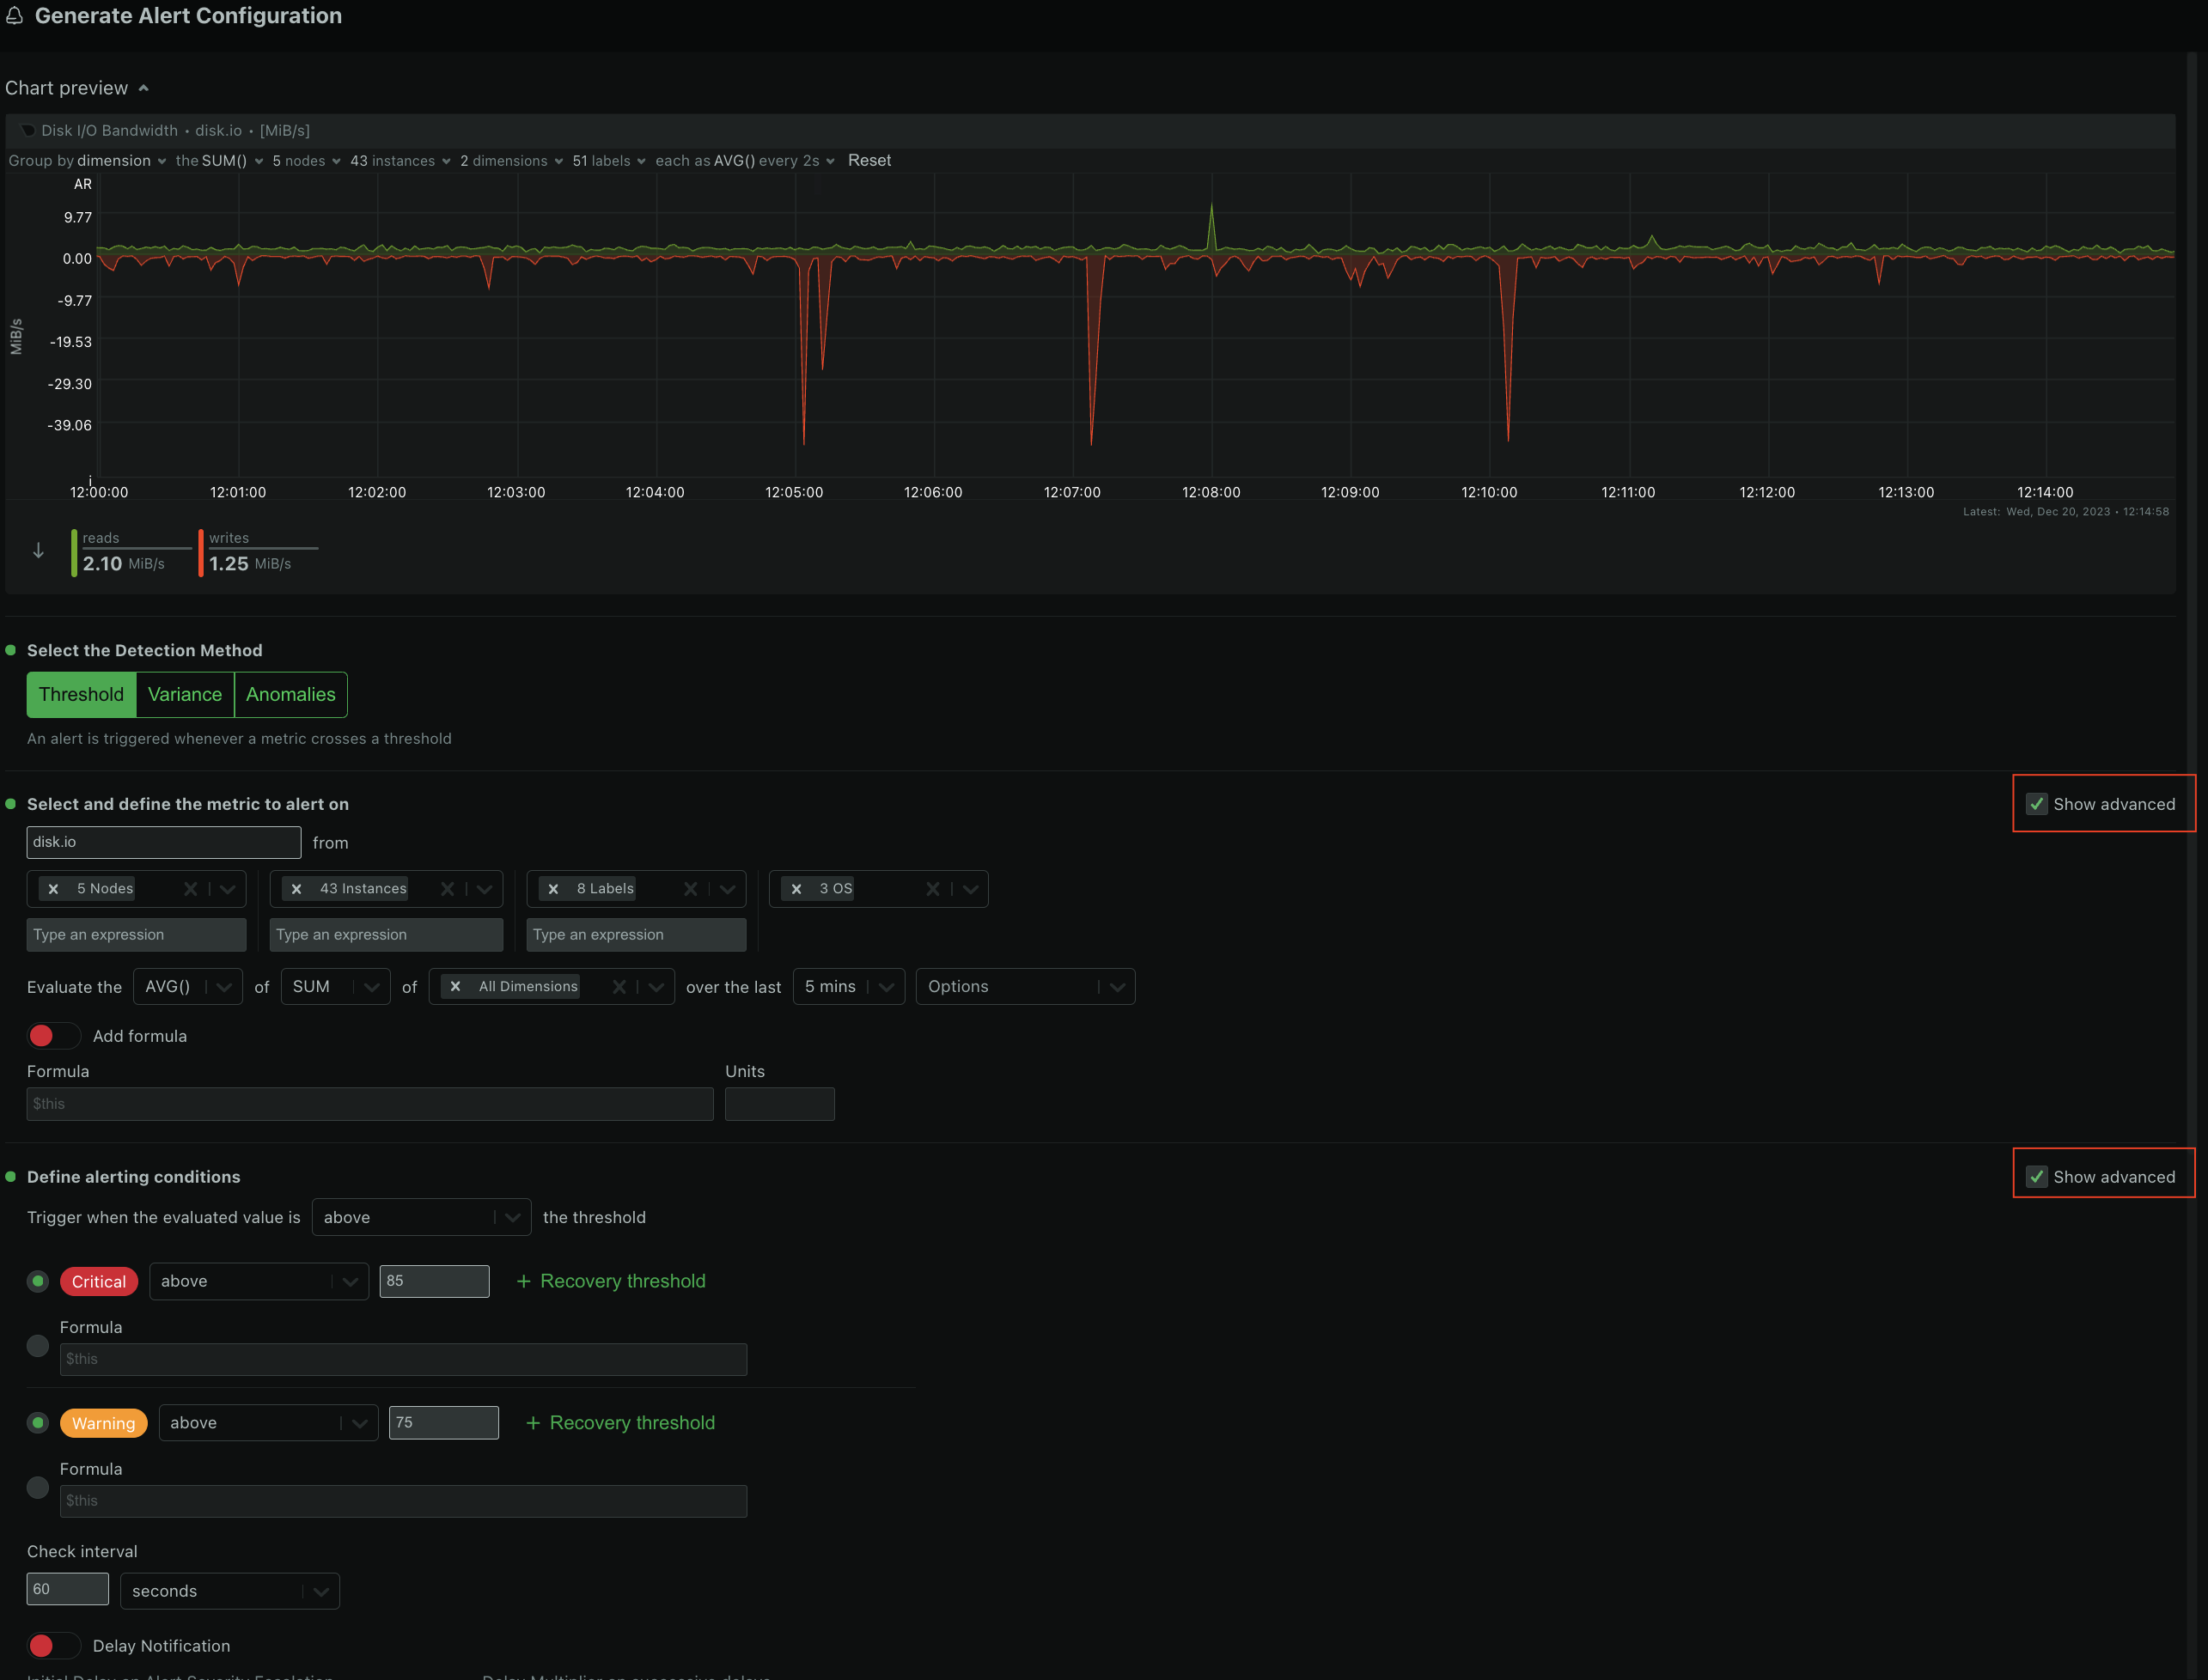--> + +5. Copy the alert definition that is generated in the code box and add it to an existing [health configuration file](https://github.com/netdata/netdata/blob/master/src/health/REFERENCE.md#edit-health-configuration-files) or a new custom file under `<path to netdata install>/etc/netdata/health.d/` on a Parent Agent or a Standalone Child Agent. + <!----> + +6. Reload Netdata Alert Health checks `<path to netdata install>/usr/sbin/netdatacli reload-health` and the new alert is now configured. + + +## Alerts Configuration Manager Sections + +- **Alert Detection Method** + <!----> + An alert is triggered whenever a metric crosses a threshold: + - Based on a standard `threshold` + - Based on metric `variance` + - Based on the `anomaly rate` of the metric + + +- **Metrics Lookup, Filtering and Formula Section** + <!----> + + - **Metrics Lookup**: This is the **Evaluate** line of fields in the modal and it defines the parameters for the database lookup that is needed to get the value that will be compared against the alert definition. It corresponds to the [`lookup`](https://github.com/netdata/netdata/blob/master/src/health/REFERENCE.md#alert-line-lookup) line of the Alert configuration file. The Alerts Configuration Manager provides a default selection for the lookup and can be modified to suit your requirements. The parameters that can be modified are: + - METHOD (`avg`, `sum`, `min`, `max`, `cv`, `stddev`) + - COMPUTATION (sum of all dimensions or individually for each dimension) + - DIMENSIONS (All dimensions, or a selection of dimensions) + - DURATION (the period in time to run the lookup) + - OPTIONS (`absolute`, `unaligned`, `percentage`, `min2max`) + + - **Alert Filtering**: This functionality can be accessed through the **Show advanced** checkbox and it allows for filtering the alert health checks to be run only for specific components of the infrastructure. It helps in achieving a fine-grained configuration for any given alert. + - `HOSTS` / `NODES` - By default all hosts are selected. You can pick nodes from the dropdown list, or enter a wildcard matching a list of hosts that you want the alert health check to run on. This field corresponds to the [`hosts`](https://github.com/netdata/netdata/blob/master/src/health/REFERENCE.md#alert-line-hosts) line of the Alert configuration file. + - `INSTANCES` - All instances are selected by default. You can pick instances from the dropdown list, or enter a wildcard matching a list of instances that you want the alert health check to run on. This field corresponds to the [`charts`](https://github.com/netdata/netdata/blob/master/src/health/REFERENCE.md#alert-line-charts) line of the Alert configuration file. + - `CHART LABELS` - All chart labels are selected by default. You can pick a chart label from the dropdown list or enter a wildcard matching a list of chart labels that you want the alert health check to run on. This field corresponds to the [`chart labels`](https://github.com/netdata/netdata/blob/master/src/health/REFERENCE.md#alert-line-chart-labels) line of the Alert configuration file. + - `OS` - All Operating Systems are selected by default. You can choose which OS(s) an alert health check should run on. This field corresponds to the [`os`](https://github.com/netdata/netdata/blob/master/src/health/REFERENCE.md#alert-line-os) line of the Alert configuration file. + + - **Formula / Calculation**: This field is available through the **Show advanced** checkbox and it is used to define a formula to be run on top of the `lookup` value. The result of the lookup is available in the `$this` variable, and after the formula is run, the result is also stored in `$this` and can be accessed while setting the alert thresholds. This field corresponds to the [`calc`](https://github.com/netdata/netdata/blob/master/src/health/REFERENCE.md#alert-line-calc) line of the Alert configuration file. + +- **Alerting conditions** + <!----> + - **Warning and Critical Thresholds**: These fields are used to set the thresholds for the `Warning` and `Critical` alert states, while also having the option to set the condition for the alert to be raised if it is `above` or `below` the given threshold. If the advanced settings are selected, a **formula** option can also be used, to define a custom formula instead of a threshold. These fields correspond to the [`warn` and `crit`](https://github.com/netdata/netdata/blob/master/src/health/REFERENCE.md#alert-lines-warn-and-crit) lines of the Alert configuration file. + - **Recovery Thresholds**: This field is available through the **Show advanced** checkbox, and it is used to set the threshold that the metric value needs to meet to de-escalate from a given severity status, like `Critical to Warning` and from `Warning to Clear`. The logic is appended to the `warn` and `crit` lines of the Alert configuration file and resembles a one-line `IF-THEN-ELSE` clause. + - **Check Interval**: This field is used to define the frequency of the health check for the alert and corresponds to the [`every`](https://github.com/netdata/netdata/blob/master/src/health/REFERENCE.md#alert-line-every) line of the Alert configuration file. + - **Delay Notifications**: This field is available through the **Show advanced** checkbox and it is used to set delay parameters on notifications for an alert severity `escalation` or `de-escalation`. It corresponds to the [`delay`](https://github.com/netdata/netdata/blob/master/src/health/REFERENCE.md#alert-line-delay) line of the Alert configuration file. + + - **Agent Specific Options**: These options are only available on the `Netdata Agent` and not honored on `Netdata Cloud`. They can be accessed through the **Show advanced** checkbox. + <!----> + - **Repeat Notifications**: This field defines the repeat frequency for the alert notification when the alert is in either `warning` or `critical` status and corresponds to the [`repeat`](https://github.com/netdata/netdata/blob/master/src/health/REFERENCE.md#alert-line-repeat) line of the Alert configuration file. + - **Send to**: This field is used to define a user role to which the alert notifications will be sent. If set to `silent`, then the alert won't be sent to any role. It corresponds to the [`to`](https://github.com/netdata/netdata/blob/master/src/health/REFERENCE.md#alert-line-to) line of the Alert configuration file. + - **Custom Exec Script**: This field is used to define a custom script that will be executed when the alert is triggered (but needs to be carefully designed as it needs to call the `health_alarm_notify.sh` module) and corresponds to the [`exec`](https://github.com/netdata/netdata/blob/master/src/health/REFERENCE.md#alert-line-exec) line of the Alert configuration file. + +- **Alert Name, Description and Summary Section** + <!----> + + - **Alert Template Name**: This field uniquely identifies an alert and corresponds to the [`template`](https://github.com/netdata/netdata/blob/master/src/health/REFERENCE.md#alert-line-alarm-or-template) field of the Alert configuration file. + The Alerts Configuration Manager provides a default name for an Alert template but we recommend you modify this to have a meaningful name for your configured alert. + - **Alert Template Description**: This field provides a brief explanation of the alert and corresponds to the [`info`](https://github.com/netdata/netdata/blob/master/src/health/REFERENCE.md#alert-line-info) line of the Alert configuration file. + - **Alert Summary**: This field enables the users to create a custom title for the alert notification (via [Notification integrations](https://learn.netdata.cloud/docs/alerting/notifications/centralized-cloud-notifications)) and corresponds to the [`summary`](https://github.com/netdata/netdata/blob/master/src/health/REFERENCE.md#alert-line-summary) line of the Alert configuration file. diff --git a/docs/cloud/alerts-notifications/manage-notification-methods.md b/docs/cloud/alerts-notifications/manage-notification-methods.md index f61b6bf6f..87271bd6a 100644 --- a/docs/cloud/alerts-notifications/manage-notification-methods.md +++ b/docs/cloud/alerts-notifications/manage-notification-methods.md @@ -66,7 +66,7 @@ Note: If an administrator has disabled a Personal [service level](https://github - If you're an administrator, Manager or Troubleshooter you'll also see the Rooms from a space you don't have access to on **All Rooms** tab and you can activate notifications for them by joining the room 1. On this modal you will be able to: 1. **Enable/Disable** the notification method for you, this applies accross all spaces and rooms - - Use the the toggle enable or disable the notification method + - Use the toggle enable or disable the notification method 1. **Define what notifications you want** to per space/room: All Alerts and unreachable, All Alerts, Critical only or No notifications 1. **Activate notifications** for a room you aren't a member of - From the **All Rooms** tab click on the Join button for the room(s) you want diff --git a/docs/cloud/alerts-notifications/notifications.md b/docs/cloud/alerts-notifications/notifications.md index cde30a2b4..822fef01a 100644 --- a/docs/cloud/alerts-notifications/notifications.md +++ b/docs/cloud/alerts-notifications/notifications.md @@ -27,7 +27,7 @@ Centralized alert notifications from Netdata Cloud is a independent process from Netdata](https://github.com/netdata/netdata/blob/master/docs/monitor/enable-notifications.md). You can enable one or the other, or both, based on your needs. However, the alerts you see in Netdata Cloud are based on those streamed from your Netdata-monitoring nodes. If you want to tweak or add new alert that you see in Netdata Cloud, and receive via centralized alert notifications, you must -[configure](https://github.com/netdata/netdata/blob/master/health/REFERENCE.md) each node's alert watchdog. +[configure](https://github.com/netdata/netdata/blob/master/src/health/REFERENCE.md) each node's alert watchdog. </Callout> @@ -104,8 +104,8 @@ if the node should be silenced for the entire space or just for specific rooms ( ### Scope definition for Alerts * **Alert name:** silencing a specific alert name silences all alert state transitions for that specific alert. -* **Alert context:** silencing a specific alert context will silence all alert state transitions for alerts targeting that chart context, for more details check [alert configuration docs](https://github.com/netdata/netdata/blob/master/health/REFERENCE.md#alert-line-on). -* **Alert role:** silencing a specific alert role will silence all the alert state transitions for alerts that are configured to be specific role recipients, for more details check [alert configuration docs](https://github.com/netdata/netdata/blob/master/health/REFERENCE.md#alert-line-to). +* **Alert context:** silencing a specific alert context will silence all alert state transitions for alerts targeting that chart context, for more details check [alert configuration docs](https://github.com/netdata/netdata/blob/master/src/health/REFERENCE.md#alert-line-on). +* **Alert role:** silencing a specific alert role will silence all the alert state transitions for alerts that are configured to be specific role recipients, for more details check [alert configuration docs](https://github.com/netdata/netdata/blob/master/src/health/REFERENCE.md#alert-line-to). Beside the above two main entities there are another two important settings that you can define on a silencing rule: * Who does the rule affect? **All user** in the space or **Myself** diff --git a/docs/cloud/cheatsheet.md b/docs/cloud/cheatsheet.md index a3d2f0285..460b03ea0 100644 --- a/docs/cloud/cheatsheet.md +++ b/docs/cloud/cheatsheet.md @@ -5,10 +5,10 @@ Below you will find some of the most common actions that one can take while usin ### Install Netdata ```bash -wget -O /tmp/netdata-kickstart.sh https://my-netdata.io/kickstart.sh && sh /tmp/netdata-kickstart.sh +wget -O /tmp/netdata-kickstart.sh https://get.netdata.cloud/kickstart.sh && sh /tmp/netdata-kickstart.sh # Or, if you have cURL but not wget (such as on macOS): -curl https://my-netdata.io/kickstart.sh > /tmp/netdata-kickstart.sh && sh /tmp/netdata-kickstart.sh +curl https://get.netdata.cloud/kickstart.sh > /tmp/netdata-kickstart.sh && sh /tmp/netdata-kickstart.sh ``` #### Connect a node to Netdata Cloud @@ -39,7 +39,7 @@ You are expected to use this method in all following configuration changes. ## Metrics collection & retention You can tweak your settings in the netdata.conf file. -📄 [Find your netdata.conf file](https://github.com/netdata/netdata/blob/master/daemon/config/README.md) +📄 [Find your netdata.conf file](https://github.com/netdata/netdata/blob/master/src/daemon/config/README.md) Open a new terminal and navigate to the netdata.conf file. Use the edit-config script to make changes: `sudo ./edit-config netdata.conf` diff --git a/docs/cloud/insights/anomaly-advisor.md b/docs/cloud/insights/anomaly-advisor.md index 4804dbc16..611ddc5e9 100644 --- a/docs/cloud/insights/anomaly-advisor.md +++ b/docs/cloud/insights/anomaly-advisor.md @@ -32,9 +32,9 @@ To enable ML on your Netdata Agent, you need to edit the `[ml]` section in your enabled = yes ``` -At a minimum you just need to set `enabled = yes` to enable ML with default params. More details about configuration can be found in the [Netdata Agent ML docs](https://github.com/netdata/netdata/blob/master/ml/README.md#configuration). +At a minimum you just need to set `enabled = yes` to enable ML with default params. More details about configuration can be found in the [Netdata Agent ML docs](https://github.com/netdata/netdata/blob/master/src/ml/README.md#configuration). -When you have finished your configuration, restart Netdata with a command like `sudo systemctl restart netdata` for the config changes to take effect. You can find more info on restarting Netdata [here](https://github.com/netdata/netdata/blob/master/docs/configure/start-stop-restart.md). +When you have finished your configuration, restart Netdata with a command like `sudo systemctl restart netdata` for the config changes to take effect. You can find more info on restarting Netdata [here](https://github.com/netdata/netdata/blob/master/packaging/installer/README.md#maintaining-a-netdata-agent-installation). After a brief delay, you should see the number of `trained` dimensions start to increase on the "dimensions" chart of the "Anomaly Detection" menu on the Overview page. By default the `minimum num samples to train = 3600` parameter means at least 1 hour of data is required to train initial models, but you could set this to `900` if you want to train initial models quicker but on less data. Over time, they will retrain on up to `maximum num samples to train = 14400` (4 hours by default), but you could increase this is you wanted to train on more data. @@ -52,7 +52,7 @@ The aim here is to surface the most anomalous metrics in the space or room for t The "Anomaly Rate" chart shows the percentage of anomalous metrics over time per node. For example, in the following image, 3.21% of the metrics on the "ml-demo-ml-disabled" node were considered anomalous. This elevated anomaly rate could be a sign of something worth investigating. -**Note**: in this example the anomaly rates for this node are actually being calculated on the parent it streams to, you can run ml on the Agent itselt or on a parent the Agent stream to. Read more about the various configuration options in the [Agent docs](https://github.com/netdata/netdata/blob/master/ml/README.md). +**Note**: in this example the anomaly rates for this node are actually being calculated on the parent it streams to, you can run ml on the Agent itselt or on a parent the Agent stream to. Read more about the various configuration options in the [Agent docs](https://github.com/netdata/netdata/blob/master/src/ml/README.md). 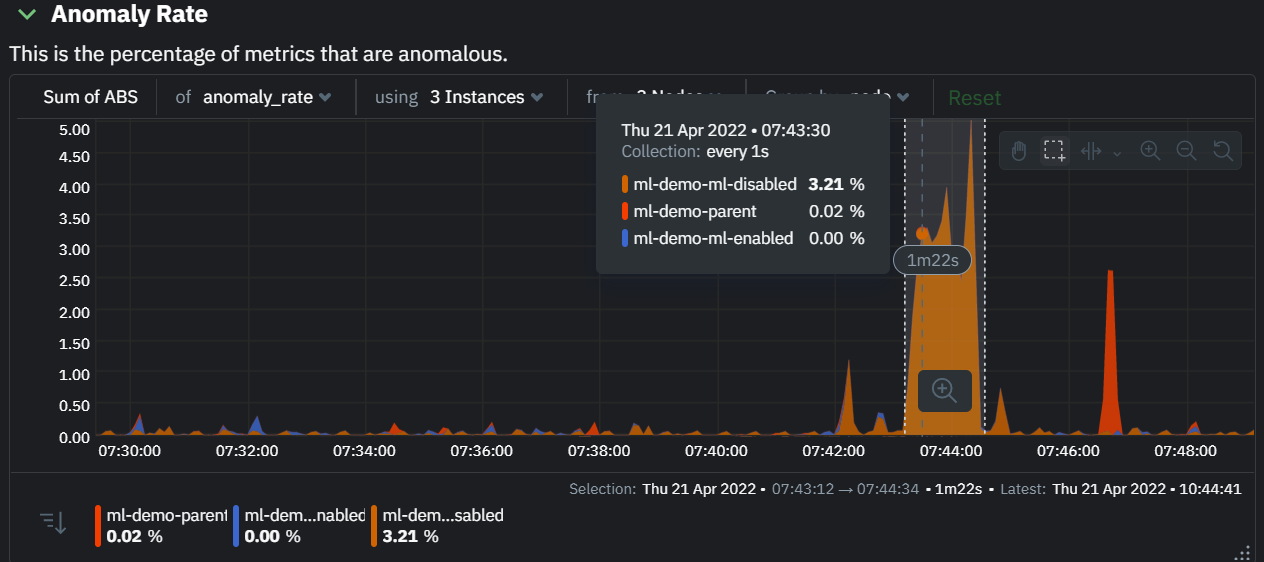 @@ -77,7 +77,7 @@ On the lower right hand side of the page an index of anomaly rates is displayed - If you are interested in a subset of specific nodes then filtering to just those nodes before highlighting tends to give better results. This is because when you highlight a region, Netdata Cloud will ask the Agents for a ranking over all metrics so if you can filter this early to just the subset of nodes you are interested in, less 'averaging' will occur and so you might be a less noisy ranking. - Ideally try and highlight close to a spike or window of interest so that the resulting ranking can narrow in more easily on the timeline you are interested in. -You can read more detail on how anomaly detection in the Netdata Agent works in our [Agent docs](https://github.com/netdata/netdata/blob/master/ml/README.md). +You can read more detail on how anomaly detection in the Netdata Agent works in our [Agent docs](https://github.com/netdata/netdata/blob/master/src/ml/README.md). 🚧 **Note**: This functionality is still **under active development** and considered experimental. We dogfood it internally and among early adopters within the Netdata community to build the feature. If you would like to get involved and help us with feedback, you can reach us through any of the following channels: diff --git a/docs/cloud/insights/metric-correlations.md b/docs/cloud/insights/metric-correlations.md index c8ead9be3..7dc50c59c 100644 --- a/docs/cloud/insights/metric-correlations.md +++ b/docs/cloud/insights/metric-correlations.md @@ -53,9 +53,9 @@ Behind the scenes, Netdata will aggregate the raw data as needed such that arbit ### Data -Netdata is different from typical observability agents since, in addition to just collecting raw metric values, it will by default also assign an "[Anomaly Bit](https://github.com/netdata/netdata/tree/master/ml#anomaly-bit---100--anomalous-0--normal)" related to each collected metric each second. This bit will be 0 for "normal" and 1 for "anomalous". This means that each metric also natively has an "[Anomaly Rate](https://github.com/netdata/netdata/tree/master/ml#anomaly-rate---averageanomaly-bit)" associated with it and, as such, MC can be run against the raw metric values or their corresponding anomaly rates. +Netdata is different from typical observability agents since, in addition to just collecting raw metric values, it will by default also assign an "[Anomaly Bit](https://github.com/netdata/netdata/tree/master/src/ml#anomaly-bit---100--anomalous-0--normal)" related to each collected metric each second. This bit will be 0 for "normal" and 1 for "anomalous". This means that each metric also natively has an "[Anomaly Rate](https://github.com/netdata/netdata/tree/master/src/ml#anomaly-rate---averageanomaly-bit)" associated with it and, as such, MC can be run against the raw metric values or their corresponding anomaly rates. -**Note**: Read more [here](https://github.com/netdata/netdata/blob/master/ml/README.md) to learn more about the native anomaly detection features within netdata. +**Note**: Read more [here](https://github.com/netdata/netdata/blob/master/src/ml/README.md) to learn more about the native anomaly detection features within netdata. - `Metrics` - Run MC on the raw metric values. - `Anomaly Rate` - Run MC on the corresponding anomaly rate for each metric. diff --git a/docs/cloud/manage/organize-your-infrastrucutre-invite-your-team.md b/docs/cloud/manage/organize-your-infrastrucutre-invite-your-team.md index b36e0806b..1f3828556 100644 --- a/docs/cloud/manage/organize-your-infrastrucutre-invite-your-team.md +++ b/docs/cloud/manage/organize-your-infrastrucutre-invite-your-team.md @@ -56,7 +56,7 @@ will open a side tab in which you can: 2. _Edit the War Rooms*_, click on the **War rooms** tab to add or remove War Rooms. 3. _Connect nodes*_, click on **Nodes** tab. Copy the claiming script to your node and run it. See the - [connect to Cloud doc](https://github.com/netdata/netdata/blob/master/claim/README.md) for details. + [connect to Cloud doc](https://github.com/netdata/netdata/blob/master/src/claim/README.md) for details. 4. _Manage the users*_, click on **Users**. The [invitation doc](#invite-your-team) @@ -106,7 +106,7 @@ We recommend a few strategies for organizing your War Rooms. - **Incident response** You can also create new War Rooms as one of the first steps in your incident response process. - For example, you have a user-facing web app that relies on Apache Pulsar for a message queue, and one of your nodes using the [Pulsar collector](https://github.com/netdata/go.d.plugin/blob/master/modules/pulsar/README.md) begins reporting a suspiciously low messages rate. + For example, you have a user-facing web app that relies on Apache Pulsar for a message queue, and one of your nodes using the [Pulsar collector](https://github.com/netdata/netdata/blob/master/src/go/collectors/go.d.plugin/modules/pulsar/README.md) begins reporting a suspiciously low messages rate. You can create a War Room called `$year-$month-$day-pulsar-rate`, add all your Pulsar nodes in addition to nodes they connect to, and begin diagnosing the root cause in a War Room optimized for getting to resolution as fast as possible. ### Add War Rooms diff --git a/docs/cloud/manage/plans.md b/docs/cloud/manage/plans.md index f84adaa8e..9b21575fc 100644 --- a/docs/cloud/manage/plans.md +++ b/docs/cloud/manage/plans.md @@ -62,7 +62,7 @@ To achieve this you can check the [Update plan](https://github.com/netdata/netda > ⚠️ Downgrade or cancellation may affect users in your Space. Please check what roles are available on the [each plans](https://github.com/netdata/netdata/blob/master/docs/cloud/manage/plans.md#areas-impacted-by-plans). Users with unavailable roles on the new plan will immediately have restricted access to the Space. -> ⚠️ Any credit given to you will be available to use on future paid subscriptions with us. It will be available until the the **end of the following year**. +> ⚠️ Any credit given to you will be available to use on future paid subscriptions with us. It will be available until the **end of the following year**. ### Areas impacted by plans diff --git a/docs/cloud/manage/role-based-access.md b/docs/cloud/manage/role-based-access.md index a0b387749..4bfb65f2e 100644 --- a/docs/cloud/manage/role-based-access.md +++ b/docs/cloud/manage/role-based-access.md @@ -33,6 +33,8 @@ In more detail, you can find on the following tables which functionalities are a | Delete Space | :heavy_check_mark: | - | - | - | - | - | | Change name | :heavy_check_mark: | - | - | - | - | - | | Change description | :heavy_check_mark: | - | - | - | - | - | +| Change slug | :heavy_check_mark: | - | - | - | - | - | +| Change preferred nodes | :heavy_check_mark: | - | - | - | - | - | ### Node Management diff --git a/docs/cloud/manage/themes.md b/docs/cloud/manage/themes.md index aaf193a87..0ca7425ae 100644 --- a/docs/cloud/manage/themes.md +++ b/docs/cloud/manage/themes.md @@ -1,14 +1,15 @@ -# Choose your Netdata Cloud theme +# Choose your Netdata UI theme -The Dark theme is the default for all new Netdata Cloud accounts. +The Dark theme is the default in the Netdata UI. -To change your theme across Netdata Cloud, click on your profile picture, then **Profile**. Click on the **Settings** -tab, then choose your preferred theme: Light or Dark. +To change your theme across the Netdata UI, click on your profile picture, click on the **Settings** +tab, and then choose your preferred theme: **Light** or **Dark**. -**Light**: +**Dark**: + + -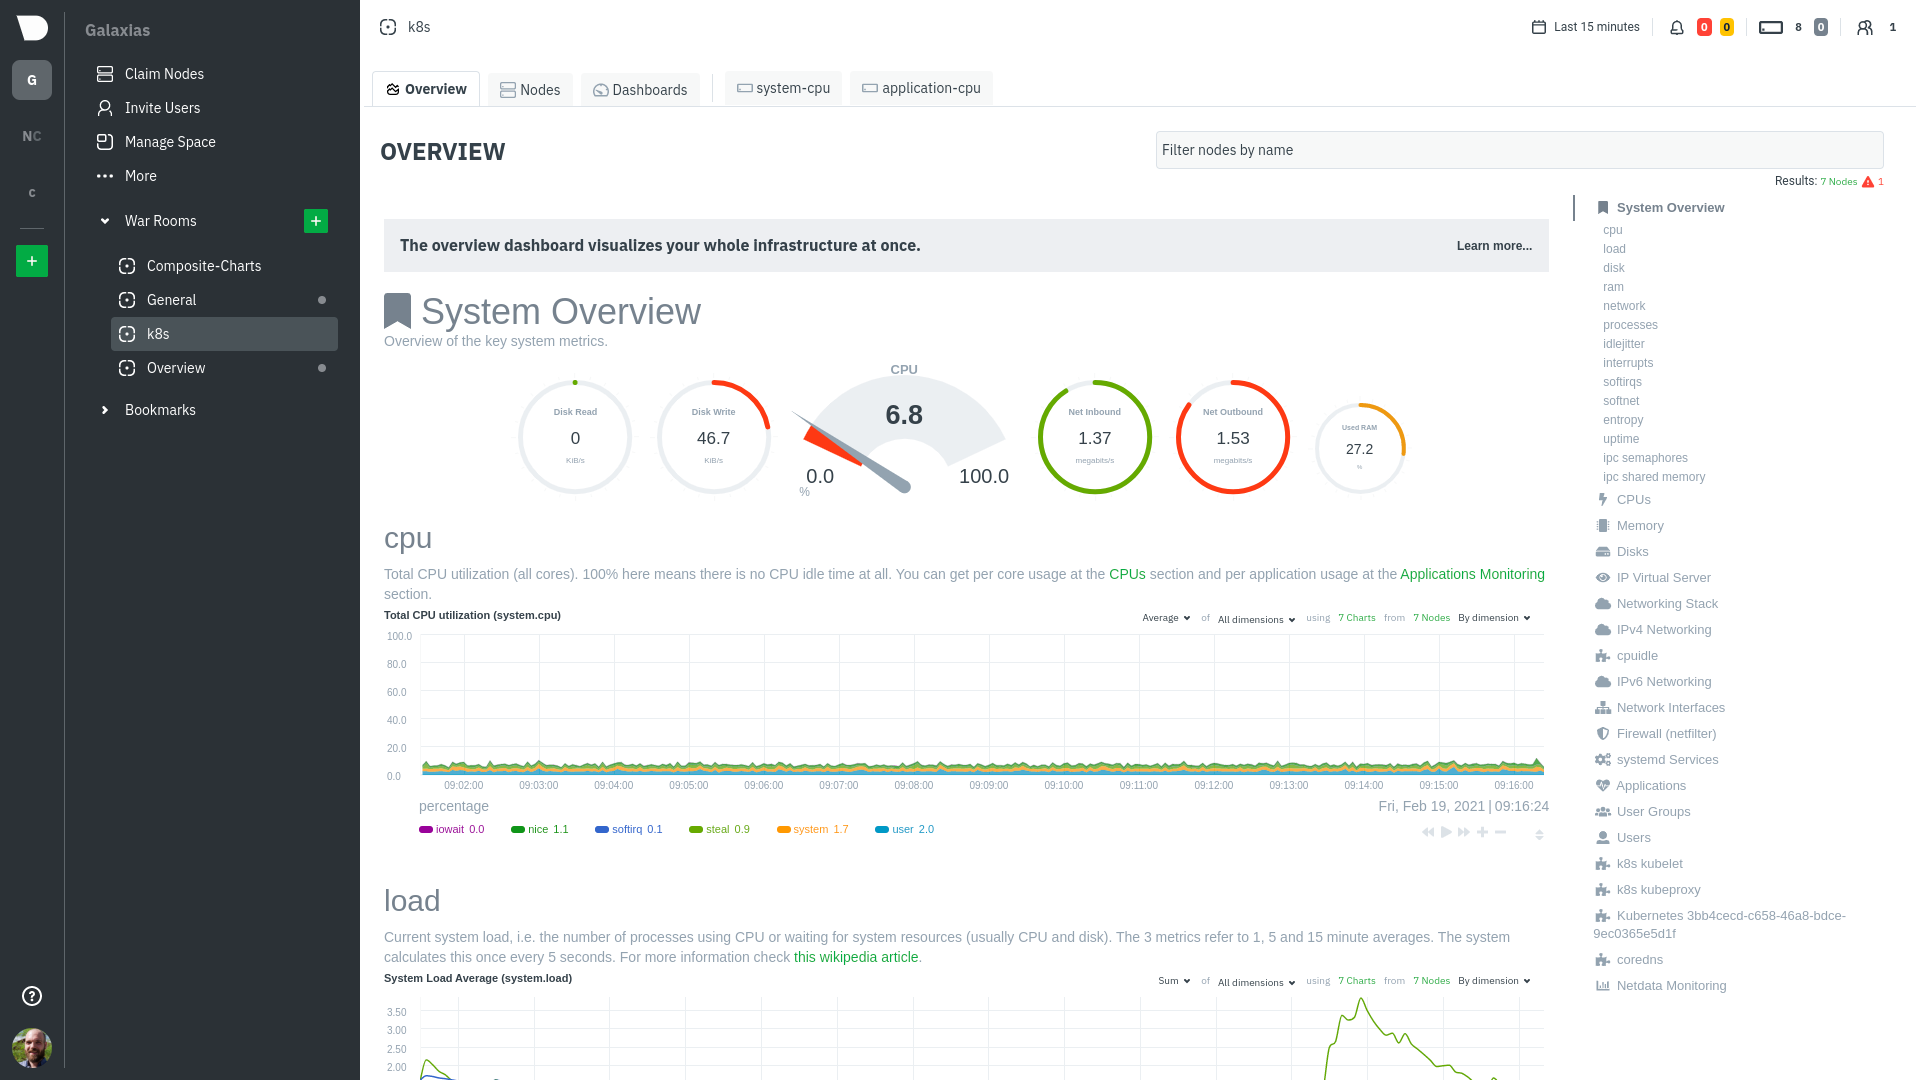 +**Light**: -**Dark (default)**: + -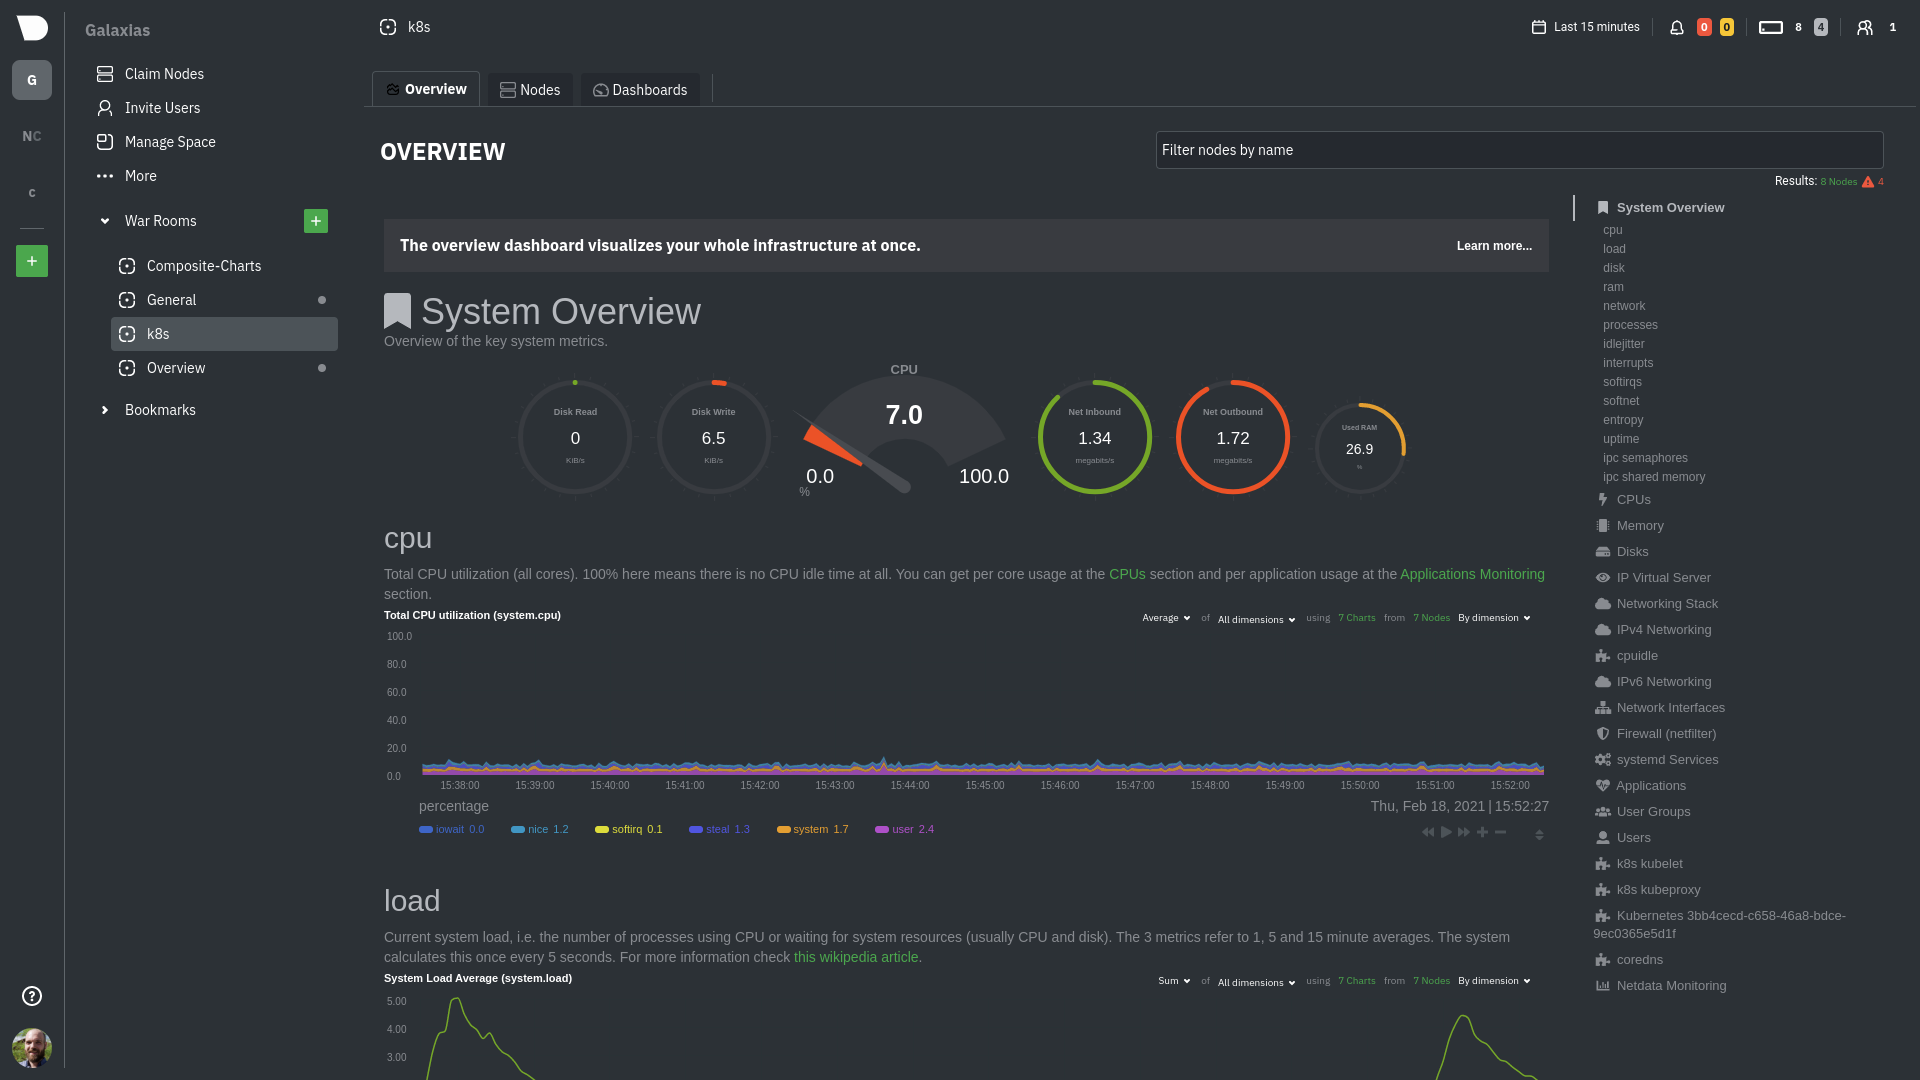 diff --git a/docs/cloud/netdata-functions.md b/docs/cloud/netdata-functions.md index caff9b35d..f86096d45 100644 --- a/docs/cloud/netdata-functions.md +++ b/docs/cloud/netdata-functions.md @@ -26,22 +26,22 @@ function (i.e. code) to be run by a data collector when the function is invoked. For more details please check out documentation on how we use our internal collector to get this from the first collector that exposes -functions - [plugins.d](https://github.com/netdata/netdata/blob/master/collectors/plugins.d/README.md#function). +functions - [plugins.d](https://github.com/netdata/netdata/blob/master/src/collectors/plugins.d/README.md#function). #### What functions are currently available? -| Function | Description | Alternative to CLI tools | plugin - module | -|:-------------------|:---------------------------------------------------------------------------------------------------------------------------------------------------------------|---------------------------------|:-----------------------------------------------------------------------------------------------------------| -| block-devices | Disk I/O activity for all block devices, offering insights into both data transfer volume and operation performance. | `iostat` | [proc](https://github.com/netdata/netdata/tree/master/collectors/proc.plugin#readme) | -| containers-vms | Insights into the resource utilization of containers and QEMU virtual machines: CPU usage, memory consumption, disk I/O, and network traffic. | `docker stats`, `systemd-cgtop` | [cgroups](https://github.com/netdata/netdata/tree/master/collectors/cgroups.plugin#readme) | -| ipmi-sensors | Readings and status of IPMI sensors. | `ipmi-sensors` | [freeipmi](https://github.com/netdata/netdata/tree/master/collectors/freeipmi.plugin#readme) | -| mount-points | Disk usage for each mount point, including used and available space, both in terms of percentage and actual bytes, as well as used and available inode counts. | `df` | [diskspace](https://github.com/netdata/netdata/tree/master/collectors/diskspace.plugin#readme) | -| network interfaces | Network traffic, packet drop rates, interface states, MTU, speed, and duplex mode for all network interfaces. | `bmon`, `bwm-ng` | [proc](https://github.com/netdata/netdata/tree/master/collectors/proc.plugin#readme) | -| processes | Real-time information about the system's resource usage, including CPU utilization, memory consumption, and disk IO for every running process. | `top`, `htop` | [apps](https://github.com/netdata/netdata/blob/master/collectors/apps.plugin/README.md) | -| systemd-journal | Viewing, exploring and analyzing systemd journal logs. | `journalctl` | [systemd-journal](https://github.com/netdata/netdata/tree/master/collectors/systemd-journal.plugin#readme) | -| systemd-list-units | Information about all systemd units, including their active state, description, whether or not they are enabled, and more. | `systemctl list-units` | [systemd-journal](https://github.com/netdata/netdata/tree/master/collectors/systemd-journal.plugin#readme) | -| systemd-services | System resource utilization for all running systemd services: CPU, memory, and disk IO. | `systemd-cgtop` | [cgroups](https://github.com/netdata/netdata/tree/master/collectors/cgroups.plugin#readme) | -| streaming | Comprehensive overview of all Netdata children instances, offering detailed information about their status, replication completion time, and many more. | | | +| Function | Description | Alternative to CLI tools | Require Cloud | plugin - module | +|:-------------------|:---------------------------------------------------------------------------------------------------------------------------------------------------------------|---------------------------------|:--------------|:-----------------------------------------------------------------------------------------------------------| +| Block-devices | Disk I/O activity for all block devices, offering insights into both data transfer volume and operation performance. | `iostat` | no | [proc](https://github.com/netdata/netdata/tree/master/src/collectors/proc.plugin#readme) | +| Containers-vms | Insights into the resource utilization of containers and QEMU virtual machines: CPU usage, memory consumption, disk I/O, and network traffic. | `docker stats`, `systemd-cgtop` | no | [cgroups](https://github.com/netdata/netdata/tree/master/src/collectors/cgroups.plugin#readme) | +| Ipmi-sensors | Readings and status of IPMI sensors. | `ipmi-sensors` | no | [freeipmi](https://github.com/netdata/netdata/tree/master/src/collectors/freeipmi.plugin#readme) | +| Mount-points | Disk usage for each mount point, including used and available space, both in terms of percentage and actual bytes, as well as used and available inode counts. | `df` | no | [diskspace](https://github.com/netdata/netdata/tree/master/src/collectors/diskspace.plugin#readme) | +| Network-interfaces | Network traffic, packet drop rates, interface states, MTU, speed, and duplex mode for all network interfaces. | `bmon`, `bwm-ng` | no | [proc](https://github.com/netdata/netdata/tree/master/src/collectors/proc.plugin#readme) | +| Processes | Real-time information about the system's resource usage, including CPU utilization, memory consumption, and disk IO for every running process. | `top`, `htop` | yes | [apps](https://github.com/netdata/netdata/blob/master/src/collectors/apps.plugin/README.md) | +| Systemd-journal | Viewing, exploring and analyzing systemd journal logs. | `journalctl` | yes | [systemd-journal](https://github.com/netdata/netdata/tree/master/src/collectors/systemd-journal.plugin#readme) | +| Systemd-list-units | Information about all systemd units, including their active state, description, whether or not they are enabled, and more. | `systemctl list-units` | yes | [systemd-journal](https://github.com/netdata/netdata/tree/master/src/collectors/systemd-journal.plugin#readme) | +| Systemd-services | System resource utilization for all running systemd services: CPU, memory, and disk IO. | `systemd-cgtop` | no | [cgroups](https://github.com/netdata/netdata/tree/master/src/collectors/cgroups.plugin#readme) | +| Streaming | Comprehensive overview of all Netdata children instances, offering detailed information about their status, replication completion time, and many more. | | yes | | If you have ideas or requests for other functions: @@ -57,22 +57,21 @@ any children connected to it. If the parent node is the one connected to Netdata Cloud it is capable of triggering the call to the respective children node to run the function. -#### Why are they available only on Netdata Cloud? +#### Why are some functions only available on Netdata Cloud? Since these functions are able to execute routines on the node and due to the potential use cases that they can cover, our -concern is to ensure no sensitive -information or disruptive actions are exposed through the Agent's API. +concern is to ensure no sensitive information or disruptive actions are exposed through the Agent's API. With the communication between the Netdata Agent and Netdata Cloud being -through [ACLK](https://github.com/netdata/netdata/blob/master/aclk/README.md) this +through [ACLK](https://github.com/netdata/netdata/blob/master/src/aclk/README.md) this concern is addressed. ## Related Topics ### **Related Concepts** -- [ACLK](https://github.com/netdata/netdata/blob/master/aclk/README.md) -- [plugins.d](https://github.com/netdata/netdata/blob/master/collectors/plugins.d/README.md) +- [ACLK](https://github.com/netdata/netdata/blob/master/src/aclk/README.md) +- [plugins.d](https://github.com/netdata/netdata/blob/master/src/collectors/plugins.d/README.md) ### Related Tasks diff --git a/docs/cloud/runtime-troubleshooting-with-functions.md b/docs/cloud/runtime-troubleshooting-with-functions.md index 839b8c9ed..193ba33ca 100644 --- a/docs/cloud/runtime-troubleshooting-with-functions.md +++ b/docs/cloud/runtime-troubleshooting-with-functions.md @@ -31,4 +31,4 @@ The following is required to be able to run Functions from Netdata Cloud. - [Netdata Functions](https://github.com/netdata/netdata/blob/master/docs/cloud/netdata-functions.md) #### Related References documentation -- [External plugins overview](https://github.com/netdata/netdata/blob/master/collectors/plugins.d/README.md#function) +- [External plugins overview](https://github.com/netdata/netdata/blob/master/src/collectors/plugins.d/README.md#function) diff --git a/docs/cloud/visualize/interact-new-charts.md b/docs/cloud/visualize/interact-new-charts.md index 16db927a8..57b4c253d 100644 --- a/docs/cloud/visualize/interact-new-charts.md +++ b/docs/cloud/visualize/interact-new-charts.md @@ -42,8 +42,8 @@ With a quick glance you have immediate information available at your disposal: While Netdata's charts require no configuration and are easy to interact with, they have a lot of underlying complexity. To meaningfully organize charts out of the box based on what's happening in your nodes, Netdata uses the concepts of [dimensions](#dimensions), [contexts](#contexts), and [families](#families). Understanding how these work will help you more easily navigate the dashboard, -[write new alerts](https://github.com/netdata/netdata/blob/master/health/REFERENCE.md), or play around -with the [API](https://github.com/netdata/netdata/blob/master/web/api/README.md). +[write new alerts](https://github.com/netdata/netdata/blob/master/src/health/REFERENCE.md), or play around +with the [API](https://github.com/netdata/netdata/blob/master/src/web/api/README.md). ### Dimensions @@ -71,7 +71,7 @@ whereas anything after the `.` is specified either by the chart's developer or b By default, a chart's type affects where it fits in the menu, while its family creates submenus. -Netdata also relies on contexts for [alert configuration](https://github.com/netdata/netdata/blob/master/health/REFERENCE.md) (the [`on` line](https://github.com/netdata/netdata/blob/master/health/REFERENCE.md#alert-line-on)). +Netdata also relies on contexts for [alert configuration](https://github.com/netdata/netdata/blob/master/src/health/REFERENCE.md) (the [`on` line](https://github.com/netdata/netdata/blob/master/src/health/REFERENCE.md#alert-line-on)). ### Families @@ -262,7 +262,7 @@ By default the aggregation applied is _average_ but the user can choose differen - Delta - Single or Double exponential smoothing -For more details on each, you can refer to our Agent's HTTP API details on [Data Queries - Data Grouping](https://github.com/netdata/netdata/blob/master/web/api/queries/README.md#data-grouping). +For more details on each, you can refer to our Agent's HTTP API details on [Data Queries - Data Grouping](https://github.com/netdata/netdata/blob/master/src/web/api/queries/README.md#data-grouping). ### Reset to defaults @@ -283,7 +283,7 @@ The Anomaly Rate ribbon on top of each chart visualizes the combined anomaly rat Hovering over the Anomaly Rate ribbon provides a histogram of the anomaly rates per presented dimension, for the specific point in time. -Anomaly Rate visualization does not make Netdata slower. Anomaly rate is saved in the the Netdata database, together with metric values, and due to the smart design of Netdata, it does not even incur a disk footprint penalty. +Anomaly Rate visualization does not make Netdata slower. Anomaly rate is saved in the Netdata database, together with metric values, and due to the smart design of Netdata, it does not even incur a disk footprint penalty. ## Hover over the chart diff --git a/docs/cloud/visualize/node-filter.md b/docs/cloud/visualize/node-filter.md index 0dd0ef5a6..1b3979ff4 100644 --- a/docs/cloud/visualize/node-filter.md +++ b/docs/cloud/visualize/node-filter.md @@ -6,7 +6,7 @@ Inside the filter, the nodes get categorized into three groups: | Group | Description | |---------|-----------------------------------------------------------------------------------------------------------------------------------------------------------------------------------------------------------------------------------------------------------------------------------------------------------------------------------------------------------------------------------------------------------------------| -| Live | Nodes that are currently online, collecting and streaming metrics to Cloud. Live nodes display raised [Alert](https://github.com/netdata/netdata/blob/master/docs/monitor/view-active-alerts.md) counters, [Machine Learning](https://github.com/netdata/netdata/blob/master/ml/README.md) availability, and [Functions](https://github.com/netdata/netdata/blob/master/docs/cloud/netdata-functions.md) availability | +| Live | Nodes that are currently online, collecting and streaming metrics to Cloud. Live nodes display raised [Alert](https://github.com/netdata/netdata/blob/master/docs/monitor/view-active-alerts.md) counters, [Machine Learning](https://github.com/netdata/netdata/blob/master/src/ml/README.md) availability, and [Functions](https://github.com/netdata/netdata/blob/master/docs/cloud/netdata-functions.md) availability | | Stale | Nodes that are offline and not streaming metrics to Cloud. Only historical data can be presented from a parent node. For these nodes you can only see their ML status, as they are not online to provide more information | | Offline | Nodes that are offline, not streaming metrics to Cloud and not available in any parent node. Offline nodes are automatically deleted after 30 days and can also be deleted manually. | diff --git a/docs/cloud/visualize/nodes.md b/docs/cloud/visualize/nodes.md index 3ecf76ca5..ee29d247a 100644 --- a/docs/cloud/visualize/nodes.md +++ b/docs/cloud/visualize/nodes.md @@ -31,7 +31,7 @@ These customizations appear for anyone else with access to that War Room. ## See more metrics in Netdata Cloud If you want to add more metrics to your War Rooms and they don't show up when you add new metrics to Nodes, you likely -need to configure those nodes to collect from additional data sources. See our [collectors configuration reference](https://github.com/netdata/netdata/blob/master/collectors/REFERENCE.md) +need to configure those nodes to collect from additional data sources. See our [collectors configuration reference](https://github.com/netdata/netdata/blob/master/src/collectors/REFERENCE.md) to learn how to use dozens of pre-installed collectors that can instantly collect from your favorite services and applications. If you want to see up to 30 days of historical metrics in Cloud (and more on individual node dashboards), read about [changing how long Netdata stores metrics](https://github.com/netdata/netdata/blob/master/docs/store/change-metrics-storage.md). Also, see our diff --git a/docs/cloud/visualize/overview.md b/docs/cloud/visualize/overview.md index 84638f058..a2935d624 100644 --- a/docs/cloud/visualize/overview.md +++ b/docs/cloud/visualize/overview.md @@ -31,7 +31,7 @@ monitor an Apache web server, the **Apache** section still appears and displays One difference between the Netdata Cloud menu and those found in local Agent dashboards is that the Overview condenses multiple services, families, or instances into single sections, sub-menus, and associated charts. -For services, let's say you have two concurrent jobs with the [web_log collector](https://github.com/netdata/go.d.plugin/blob/master/modules/weblog/README.md), one for Apache and another for Nginx. +For services, let's say you have two concurrent jobs with the [web_log collector](https://github.com/netdata/netdata/blob/master/src/go/collectors/go.d.plugin/modules/weblog/README.md), one for Apache and another for Nginx. A single-node or local dashboard shows two section, **web_log apache** and **web_log nginx**, whereas the Overview condenses these into a single **web_log** section containing composite charts from both jobs. |