
diff options
Diffstat (limited to 'docs/cloud')
| -rw-r--r-- | docs/cloud/alerts-notifications/add-webhook-notification-configuration.md | 40 | ||||
| -rw-r--r-- | docs/cloud/alerts-notifications/notifications.md | 26 | ||||
| -rw-r--r-- | docs/cloud/cheatsheet.md | 34 | ||||
| -rw-r--r-- | docs/cloud/manage/sign-in.md | 6 | ||||
| -rw-r--r-- | docs/cloud/netdata-functions.md | 3 | ||||
| -rw-r--r-- | docs/cloud/visualize/interact-new-charts.md | 67 | ||||
| -rw-r--r-- | docs/cloud/visualize/node-filter.md | 14 | ||||
| -rw-r--r-- | docs/cloud/visualize/nodes.md | 2 |
8 files changed, 121 insertions, 71 deletions
diff --git a/docs/cloud/alerts-notifications/add-webhook-notification-configuration.md b/docs/cloud/alerts-notifications/add-webhook-notification-configuration.md index 012b0478f..4fb518f63 100644 --- a/docs/cloud/alerts-notifications/add-webhook-notification-configuration.md +++ b/docs/cloud/alerts-notifications/add-webhook-notification-configuration.md @@ -42,23 +42,23 @@ Netdata webhook integration service will send alert notifications to the destina The notification content sent to the destination service will be a JSON object having these properties: -| field | type | description | -| :-- | :-- | :-- | -| message | string | A summary message of the alert. | -| alarm | string | The alarm the notification is about. | -| info | string | Additional info related with the alert. | -| chart | string | The chart associated with the alert. | -| context | string | The chart context. | -| space | string | The space where the node that raised the alert is assigned. | -| rooms | object[object(string,string)] | Object with list of rooms names and urls where the node belongs to. | -| family | string | Context family. | -| class | string | Classification of the alert, e.g. "Error". | -| severity | string | Alert severity, can be one of "warning", "critical" or "clear". | -| date | string | Date of the alert in ISO8601 format. | -| duration | string | Duration the alert has been raised. | -| additional_active_critical_alerts | integer | Number of additional critical alerts currently existing on the same node. | -| additional_active_warning_alerts | integer | Number of additional warning alerts currently existing on the same node. | -| alarm_url | string | Netdata Cloud URL for this alarm. | +| field | type | description | +|:----------------------------------|:------------------------------|:--------------------------------------------------------------------------| +| message | string | A summary message of the alert. | +| alarm | string | The alert the notification is about. | +| info | string | Additional info related with the alert. | +| chart | string | The chart associated with the alert. | +| context | string | The chart context. | +| space | string | The space where the node that raised the alert is assigned. | +| rooms | object[object(string,string)] | Object with list of rooms names and urls where the node belongs to. | +| family | string | Context family. | +| class | string | Classification of the alert, e.g. "Error". | +| severity | string | Alert severity, can be one of "warning", "critical" or "clear". | +| date | string | Date of the alert in ISO8601 format. | +| duration | string | Duration the alert has been raised. | +| additional_active_critical_alerts | integer | Number of additional critical alerts currently existing on the same node. | +| additional_active_warning_alerts | integer | Number of additional warning alerts currently existing on the same node. | +| alarm_url | string | Netdata Cloud URL for this alert. | ### Extra headers @@ -66,9 +66,9 @@ When setting up a webhook integration, the user can specify a set of headers to By default, the following headers will be sent in the HTTP request -| **Header** | **Value** | -|:-------------------------------:|-----------------------------| -| Content-Type | application/json | +| **Header** | **Value** | +|:------------:|------------------| +| Content-Type | application/json | ### Authentication mechanisms diff --git a/docs/cloud/alerts-notifications/notifications.md b/docs/cloud/alerts-notifications/notifications.md index ad115d43f..cde30a2b4 100644 --- a/docs/cloud/alerts-notifications/notifications.md +++ b/docs/cloud/alerts-notifications/notifications.md @@ -8,7 +8,7 @@ you or your team. Having this information centralized helps you: * Have a clear view of the health across your infrastructure, seeing all alerts in one place. -* Easily [setup your alert notification process](https://github.com/netdata/netdata/blob/master/docs/cloud/alerts-notifications/manage-notification-methods.md): +* Easily [set up your alert notification process](https://github.com/netdata/netdata/blob/master/docs/cloud/alerts-notifications/manage-notification-methods.md): methods to use and where to use them, filtering rules, etc. * Quickly troubleshoot using [Metric Correlations](https://github.com/netdata/netdata/blob/master/docs/cloud/insights/metric-correlations.md) or [Anomaly Advisor](https://github.com/netdata/netdata/blob/master/docs/cloud/insights/anomaly-advisor.md) @@ -104,8 +104,8 @@ if the node should be silenced for the entire space or just for specific rooms ( ### Scope definition for Alerts * **Alert name:** silencing a specific alert name silences all alert state transitions for that specific alert. -* **Alert context:** silencing a specific alert context will silence all alert state transitions for alerts targeting that chart context, for more details check [alert configuration docs](https://github.com/netdata/netdata/blob/master/health/REFERENCE.md#alarm-line-on). -* **Alert role:** silencing a specific alert role will silence all the alert state transitions for alerts that are configured to be specific role recipients, for more details check [alert configuration docs](https://github.com/netdata/netdata/blob/master/health/REFERENCE.md#alarm-line-to). +* **Alert context:** silencing a specific alert context will silence all alert state transitions for alerts targeting that chart context, for more details check [alert configuration docs](https://github.com/netdata/netdata/blob/master/health/REFERENCE.md#alert-line-on). +* **Alert role:** silencing a specific alert role will silence all the alert state transitions for alerts that are configured to be specific role recipients, for more details check [alert configuration docs](https://github.com/netdata/netdata/blob/master/health/REFERENCE.md#alert-line-to). Beside the above two main entities there are another two important settings that you can define on a silencing rule: * Who does the rule affect? **All user** in the space or **Myself** @@ -124,24 +124,24 @@ the local Agent dashboard at `http://NODE:19999`. ## Anatomy of an alert notification -Email alarm notifications show the following information: +Email alert notifications show the following information: - The Space's name - The node's name -- Alarm status: critical, warning, cleared -- Previous alarm status -- Time at which the alarm triggered -- Chart context that triggered the alarm -- Name and information about the triggered alarm -- Alarm value +- Alert status: critical, warning, cleared +- Previous alert status +- Time at which the alert triggered +- Chart context that triggered the alert +- Name and information about the triggered alert +- Alert value - Total number of warning and critical alerts on that node -- Threshold for triggering the given alarm state +- Threshold for triggering the given alert state - Calculation or database lookups that Netdata uses to compute the value -- Source of the alarm, including which file you can edit to configure this alarm on an individual node +- Source of the alert, including which file you can edit to configure this alert on an individual node Email notifications also feature a **Go to Node** button, which takes you directly to the offending chart for that node within Cloud's embedded dashboards. Here's an example email notification for the `ram_available` chart, which is in a critical state: -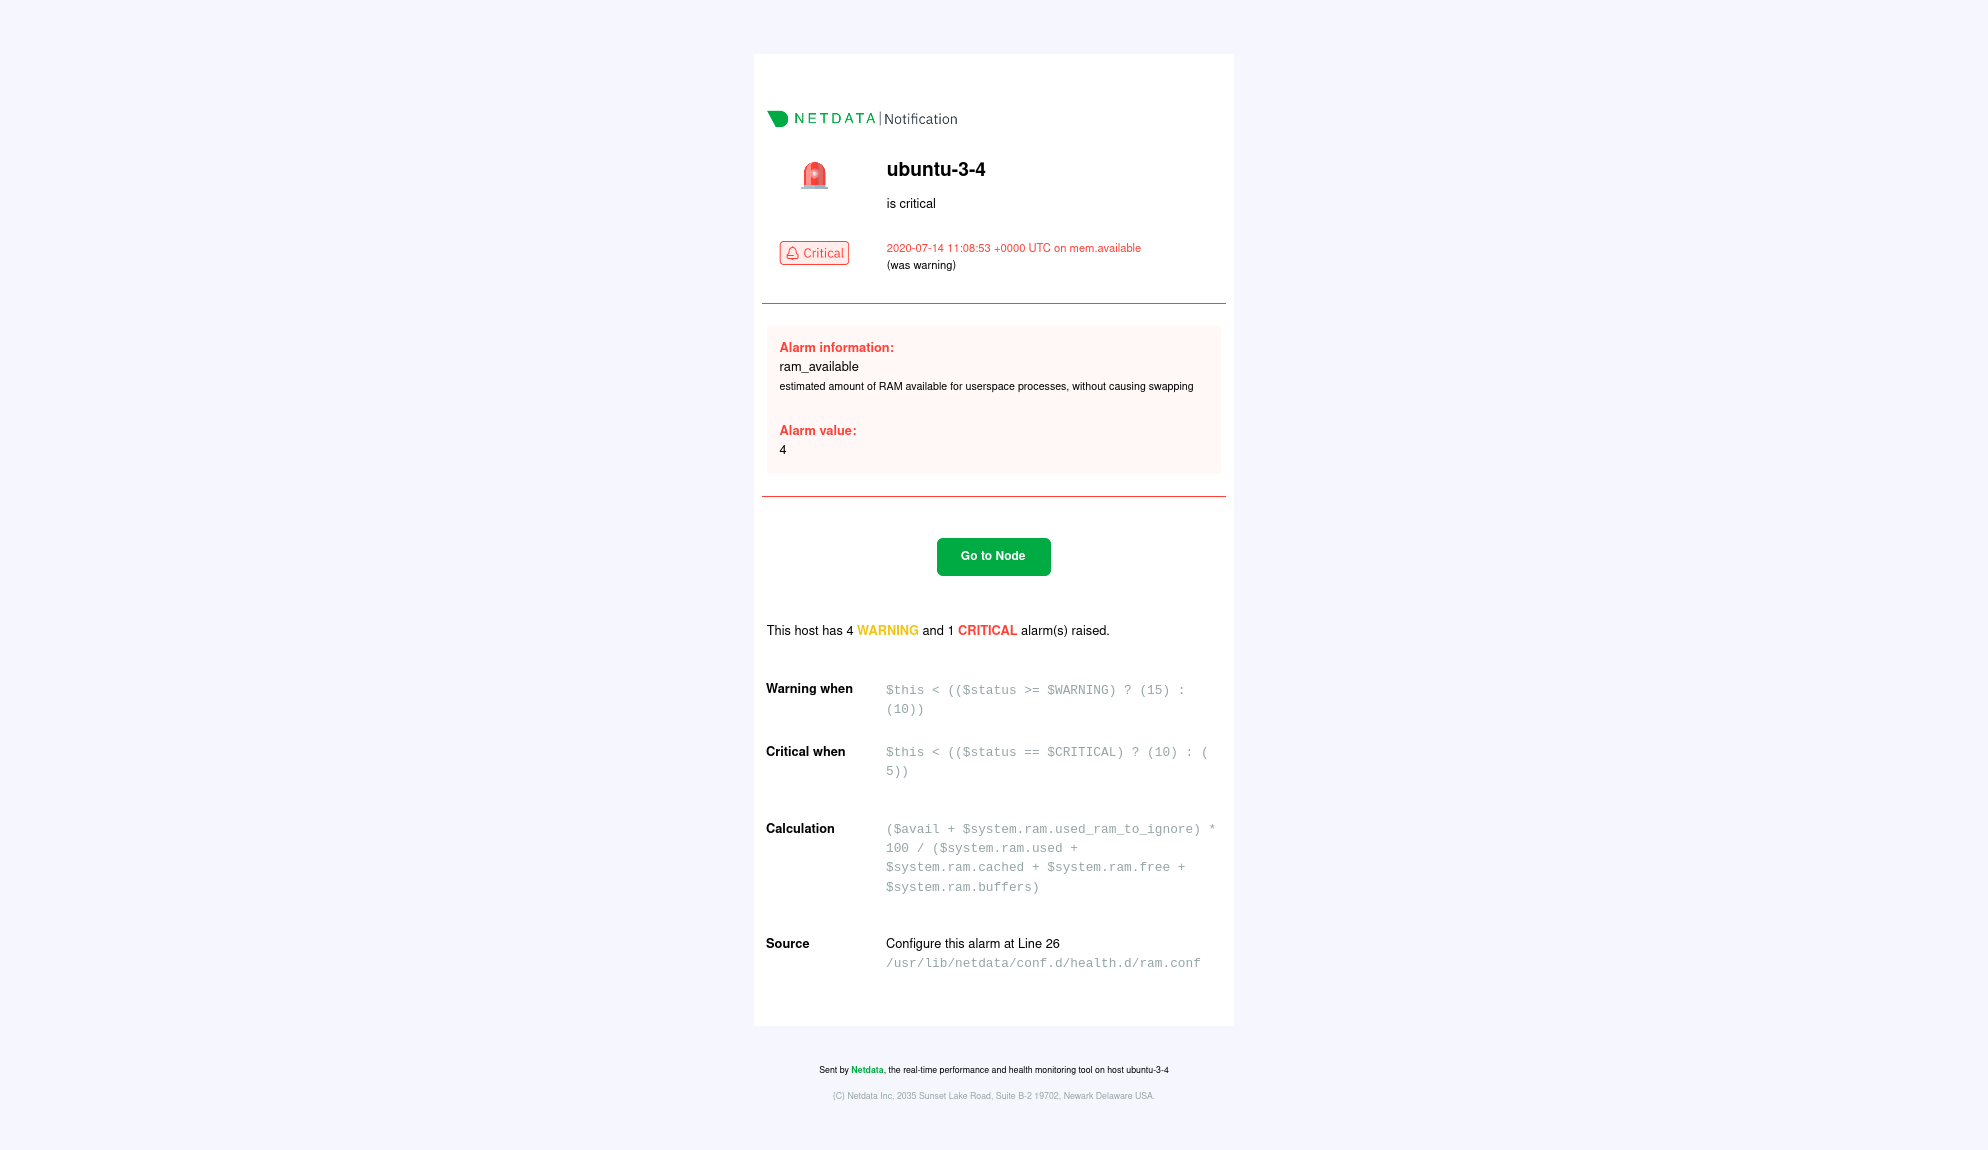 + diff --git a/docs/cloud/cheatsheet.md b/docs/cloud/cheatsheet.md index 35a6a2c99..a3d2f0285 100644 --- a/docs/cloud/cheatsheet.md +++ b/docs/cloud/cheatsheet.md @@ -99,13 +99,13 @@ modules: sudo ./edit-config go.d/mysql.conf ``` -### Alarms & notifications +### Alerts & notifications -<!-- #### Add a new alarm +<!-- #### Add a new alert ``` -sudo touch health.d/example-alarm.conf -sudo ./edit-config health.d/example-alarm.conf +sudo touch health.d/example-alert.conf +sudo ./edit-config health.d/example-alert.conf ``` --> After any change, reload the Netdata health configuration: @@ -115,23 +115,23 @@ netdatacli reload-health killall -USR2 netdata ``` -#### Configure a specific alarm +#### Configure a specific alert ```bash -sudo ./edit-config health.d/example-alarm.conf +sudo ./edit-config health.d/example-alert.conf ``` -#### Silence a specific alarm +#### Silence a specific alert ```bash -sudo ./edit-config health.d/example-alarm.conf +sudo ./edit-config health.d/example-alert.conf ``` ``` to: silent ``` -<!-- #### Disable alarms and notifications +<!-- #### Disable alerts and notifications ```conf [health] @@ -142,14 +142,14 @@ sudo ./edit-config health.d/example-alarm.conf ### Manage the daemon -| Intent | Action | -| :-------------------------- | --------------------------------------------------------------------: | -| Start Netdata | `$ sudo service netdata start` | -| Stop Netdata | `$ sudo service netdata stop` | -| Restart Netdata | `$ sudo service netdata restart` | -| Reload health configuration | `$ sudo netdatacli reload-health` `$ killall -USR2 netdata` | -| View error logs | `less /var/log/netdata/error.log` | -| View collectors logs | `less /var/log/netdata/collector.log` | +| Intent | Action | +|:----------------------------|------------------------------------------------------------:| +| Start Netdata | `$ sudo service netdata start` | +| Stop Netdata | `$ sudo service netdata stop` | +| Restart Netdata | `$ sudo service netdata restart` | +| Reload health configuration | `$ sudo netdatacli reload-health` `$ killall -USR2 netdata` | +| View error logs | `less /var/log/netdata/error.log` | +| View collectors logs | `less /var/log/netdata/collector.log` | #### Change the port Netdata listens to (example, set it to port 39999) diff --git a/docs/cloud/manage/sign-in.md b/docs/cloud/manage/sign-in.md index 96275f573..53ea3a22a 100644 --- a/docs/cloud/manage/sign-in.md +++ b/docs/cloud/manage/sign-in.md @@ -23,7 +23,7 @@ device, and sign in. ### Don't have a Netdata Cloud account yet? -If you don't have a Netdata Cloud account yet you won't need to worry about it. During the sign in process we will create one for you and make the process seamless to you. +If you don't already have a Netdata Cloud account, you don't need to worry about this. During the sign-in process we will create one for you and make the process seamless to you. After your account is created and you sign in to Netdata, you first are asked to agree to Netdata Cloud's [Privacy Policy](https://www.netdata.cloud/privacy/) and [Terms of Use](https://www.netdata.cloud/terms/). Once you agree with these you are directed @@ -40,14 +40,14 @@ If you don't see the email, try the following: - Check your spam folder. - In Gmail, check the **Updates** category. - Check [Netdata Cloud status](https://status.netdata.cloud) for ongoing issues with our infrastructure. -- Request another sign in email via the [sign in page](https://app.netdata.cloud/sign-in?cloudRoute=spaces?utm_source=docs&utm_content=sign_in_button_troubleshooting_section). +- Request another sign in email via the [sign-in page](https://app.netdata.cloud/sign-in?cloudRoute=spaces?utm_source=docs&utm_content=sign_in_button_troubleshooting_section). You may also want to add `no-reply@netdata.cloud` to your address book or contacts list, especially if you're using a public email service, such as Gmail. You may also want to whitelist/allowlist either the specific email or the entire `netdata.cloud` domain. In some cases, temporary issues with your mail server or email account may result in your email address being added to a Bounce list by Sendgrid. -If you are added to that list, no Netdata cloud email can reach you, including alarm notifications. Let us know in Discord that you have trouble receiving +If you are added to that list, no Netdata cloud email can reach you, including alert notifications. Let us know in Discord that you have trouble receiving any email from us and someone will ask you to provide your email address privately, so we can check if you are on the Bounce list. ## Google and GitHub OAuth diff --git a/docs/cloud/netdata-functions.md b/docs/cloud/netdata-functions.md index 949c8b4cc..80616ca41 100644 --- a/docs/cloud/netdata-functions.md +++ b/docs/cloud/netdata-functions.md @@ -33,7 +33,8 @@ functions - [plugins.d](https://github.com/netdata/netdata/blob/master/collector | Function | Description | plugin - module | | :-- | :-- | :-- | | processes | Detailed information on the currently running processes on the node. | [apps.plugin](https://github.com/netdata/netdata/blob/master/collectors/apps.plugin/README.md) | -| ebpf_thread | Controller for eBPF threads. | [ebpf.plugin](https://github.com/netdata/netdata/blob/master/collectors/ebpf.plugin/README.md) | +| ebpf_socket | Detailed socket information. | [ebpf.plugin](https://github.com/netdata/netdata/blob/master/collectors/ebpf.plugin/README.md#ebpf_thread) | +| ebpf_thread | Controller for eBPF threads. | [ebpf.plugin](https://github.com/netdata/netdata/blob/master/collectors/ebpf.plugin/README.md#ebpf_socket) | If you have ideas or requests for other functions: * Participate in the relevant [GitHub discussion](https://github.com/netdata/netdata/discussions/14412) diff --git a/docs/cloud/visualize/interact-new-charts.md b/docs/cloud/visualize/interact-new-charts.md index 3707e945f..16db927a8 100644 --- a/docs/cloud/visualize/interact-new-charts.md +++ b/docs/cloud/visualize/interact-new-charts.md @@ -1,4 +1,4 @@ -# Interact with charts +# Netdata Charts Learn how to use Netdata's powerful charts to troubleshoot with real-time, per-second metric data. @@ -37,6 +37,65 @@ With a quick glance you have immediate information available at your disposal: - [Chart area](#hover-over-the-chart) - [Legend with dimensions](#dimensions-bar) +## Fundemental elements + +While Netdata's charts require no configuration and are easy to interact with, they have a lot of underlying complexity. To meaningfully organize charts out of the box based on what's happening in your nodes, Netdata uses the concepts of [dimensions](#dimensions), [contexts](#contexts), and [families](#families). + +Understanding how these work will help you more easily navigate the dashboard, +[write new alerts](https://github.com/netdata/netdata/blob/master/health/REFERENCE.md), or play around +with the [API](https://github.com/netdata/netdata/blob/master/web/api/README.md). + +### Dimensions + +A **dimension** is a value that gets shown on a chart. The value can be raw data or calculated values, such as the +average (the default), minimum, or maximum. These values can then be given any type of unit. For example, CPU +utilization is represented as a percentage, disk I/O as `MiB/s`, and available RAM as an absolute value in `MiB` or +`GiB`. + +Beneath every chart (or on the right-side if you configure the dashboard) is a legend of dimensions. When there are +multiple dimensions, you'll see a different entry in the legend for each dimension. + +The **Apps CPU Time** chart (with the [context](#contexts) `apps.cpu`), which visualizes CPU utilization of +different types of processes/services/applications on your node, always provides a vibrant example of a chart with +multiple dimensions. + +Dimensions can be [hidden](#show-and-hide-dimensions) to help you focus your attention. + +### Contexts + +A **context** is a way of grouping charts by the types of metrics collected and dimensions displayed. It's like a machine-readable naming and organization scheme. + +For example, the **Apps CPU Time** has the context `apps.cpu`. A little further down on the dashboard is a similar +chart, **Apps Real Memory (w/o shared)** with the context `apps.mem`. The `apps` portion of the context is the **type**, +whereas anything after the `.` is specified either by the chart's developer or by the [family](#families). + +By default, a chart's type affects where it fits in the menu, while its family creates submenus. + +Netdata also relies on contexts for [alert configuration](https://github.com/netdata/netdata/blob/master/health/REFERENCE.md) (the [`on` line](https://github.com/netdata/netdata/blob/master/health/REFERENCE.md#alert-line-on)). + +### Families + +**Families** are a _single instance_ of a hardware or software resource that needs to be displayed separately from +similar instances. + +For example, let's look at the **Disks** section, which contains a number of charts with contexts like `disk.io`, +`disk.ops`, `disk.backlog`, and `disk.util`. If your node has multiple disk drives at `sda` and `sdb`, Netdata creates +a separate family for each. + +Netdata now merges the contexts and families to create charts that are grouped by family, following a +`[context].[family]` naming scheme, so that you can see the `disk.io` and `disk.ops` charts for `sda` right next to each +other. + +Given the four example contexts, and two families of `sda` and `sdb`, Netdata will create the following charts and their +names: + +| Context | `sda` family | `sdb` family | +|:---------------|--------------------|--------------------| +| `disk.io` | `disk_io.sda` | `disk_io.sdb` | +| `disk.ops` | `disk_ops.sda` | `disk_ops.sdb` | +| `disk.backlog` | `disk_backlog.sda` | `disk_backlog.sdb` | +| `disk.util` | `disk_util.sda` | `disk_util.sdb` | + ## Title bar When you start interacting with a chart, you'll notice valuable information on the top bar: @@ -77,7 +136,6 @@ Each composite chart has a definition bar to provide information and options abo To help users instantly understand and validate the data they see on charts, we developed the NIDL (Nodes, Instances, Dimensions, Labels) framework. This information is visualized on all charts. - > You can explore the in-depth infographic, by clicking on this image and opening it in a new tab, > allowing you to zoom in to the different parts of it. > @@ -85,7 +143,6 @@ To help users instantly understand and validate the data they see on charts, we > <img src="https://user-images.githubusercontent.com/2662304/235475061-44628011-3b1f-4c44-9528-34452018eb89.png" width="400" border="0" align="center"/> > </a> - You can rapidly access condensed information for collected metrics, grouped by node, monitored instances, dimension, or any key/value label pair. At the Definition bar of each chart, there are a few dropdown menus: @@ -176,7 +233,6 @@ This menu also presents the contribution of each original dimensions on the char <img src="https://user-images.githubusercontent.com/70198089/236138796-08dc6ac6-9a50-4913-a46d-d9bbcedd48f6.png" width="900"/> - ### Labels dropdown In this dropdown, you can view or filter the contributing time-series labels of the chart. @@ -293,7 +349,6 @@ The available manipulation tools you can select are: - Chart zoom - Reset zoom - ### Pan Drag your mouse/finger to the right to pan backward through time, or drag to the left to pan forward in time. Think of @@ -340,10 +395,8 @@ Zooming out lets you see metrics within the larger context, such as the last hou The bottom legend where you can see the dimensions of the chart can be ordered by: - <img src="https://user-images.githubusercontent.com/70198089/236144658-6c3d0e31-9bcb-45f3-bb95-4eafdcbb0a58.png" width="300" /> - - Dimension name (Ascending or Descending) - Dimension value (Ascending or Descending) - Dimension Anomaly Rate (Ascending or Descending) diff --git a/docs/cloud/visualize/node-filter.md b/docs/cloud/visualize/node-filter.md index 889caaf87..0dd0ef5a6 100644 --- a/docs/cloud/visualize/node-filter.md +++ b/docs/cloud/visualize/node-filter.md @@ -4,15 +4,11 @@ The node filter allows you to quickly filter the nodes visualized in a War Room' Inside the filter, the nodes get categorized into three groups: -- Live nodes - Nodes that are currently online, collecting and streaming metrics to Cloud. - - Live nodes display raised [Alert](https://github.com/netdata/netdata/blob/master/docs/monitor/view-active-alarms.md) counters, [Machine Learning](https://github.com/netdata/netdata/blob/master/ml/README.md) availability, and [Functions](https://github.com/netdata/netdata/blob/master/docs/cloud/netdata-functions.md) availability -- Stale nodes - Nodes that are offline and not streaming metrics to Cloud. Only historical data can be presented from a parent node. - - For these nodes you can only see their ML status, as they are not online to provide more information -- Offline nodes - Nodes that are offline, not streaming metrics to Cloud and not available in any parent node. - Offline nodes are automatically deleted after 30 days and can also be deleted manually. +| Group | Description | +|---------|-----------------------------------------------------------------------------------------------------------------------------------------------------------------------------------------------------------------------------------------------------------------------------------------------------------------------------------------------------------------------------------------------------------------------| +| Live | Nodes that are currently online, collecting and streaming metrics to Cloud. Live nodes display raised [Alert](https://github.com/netdata/netdata/blob/master/docs/monitor/view-active-alerts.md) counters, [Machine Learning](https://github.com/netdata/netdata/blob/master/ml/README.md) availability, and [Functions](https://github.com/netdata/netdata/blob/master/docs/cloud/netdata-functions.md) availability | +| Stale | Nodes that are offline and not streaming metrics to Cloud. Only historical data can be presented from a parent node. For these nodes you can only see their ML status, as they are not online to provide more information | +| Offline | Nodes that are offline, not streaming metrics to Cloud and not available in any parent node. Offline nodes are automatically deleted after 30 days and can also be deleted manually. | By using the search bar, you can narrow down to specific nodes based on their name. diff --git a/docs/cloud/visualize/nodes.md b/docs/cloud/visualize/nodes.md index b770c1b8e..3ecf76ca5 100644 --- a/docs/cloud/visualize/nodes.md +++ b/docs/cloud/visualize/nodes.md @@ -7,7 +7,7 @@ to any node's dashboard for troubleshooting performance issues or anomalies usin Cloud](https://user-images.githubusercontent.com/1153921/119035218-2eebb700-b964-11eb-8b74-4ec2df0e457c.png) Each War Room's Nodes tab is populated based on the nodes you added to that specific War Room. Each node occupies a -single row, first featuring that node's alarm status (yellow for warnings, red for critical alarms) and operating +single row, first featuring that node's alert status (yellow for warnings, red for critical alerts) and operating system, some essential information about the node, followed by columns of user-defined key metrics represented in real-time charts. |