
diff options
Diffstat (limited to 'docs/dashboard/dimensions-contexts-families.md')
| -rw-r--r-- | docs/dashboard/dimensions-contexts-families.md | 69 |
1 files changed, 69 insertions, 0 deletions
diff --git a/docs/dashboard/dimensions-contexts-families.md b/docs/dashboard/dimensions-contexts-families.md new file mode 100644 index 00000000..41e839c8 --- /dev/null +++ b/docs/dashboard/dimensions-contexts-families.md @@ -0,0 +1,69 @@ +# Chart dimensions, contexts, and families + +While Netdata's charts require no configuration and are [easy to interact with](https://github.com/netdata/netdata/blob/master/docs/cloud/visualize/interact-new-charts.md), +they have a lot of underlying complexity. To meaningfully organize charts out of the box based on what's happening in +your nodes, Netdata uses the concepts of **dimensions**, **contexts**, and **families**. + +Understanding how these work will help you more easily navigate the dashboard, +[write new alarms](https://github.com/netdata/netdata/blob/master/health/REFERENCE.md), or play around +with the [API](https://github.com/netdata/netdata/blob/master/web/api/README.md). + +## Dimension + +A **dimension** is a value that gets shown on a chart. The value can be raw data or calculated values, such as the +average (the default), minimum, or maximum. These values can then be given any type of unit. For example, CPU +utilization is represented as a percentage, disk I/O as `MiB/s`, and available RAM as an absolute value in `MiB` or +`GiB`. + +Beneath every chart (or on the right-side if you configure the dashboard) is a legend of dimensions. When there are +multiple dimensions, you'll see a different entry in the legend for each dimension. + +The **Apps CPU Time** chart (with the [context](#context) `apps.cpu`), which visualizes CPU utilization of +different types of processes/services/applications on your node, always provides a vibrant example of a chart with +multiple dimensions. + +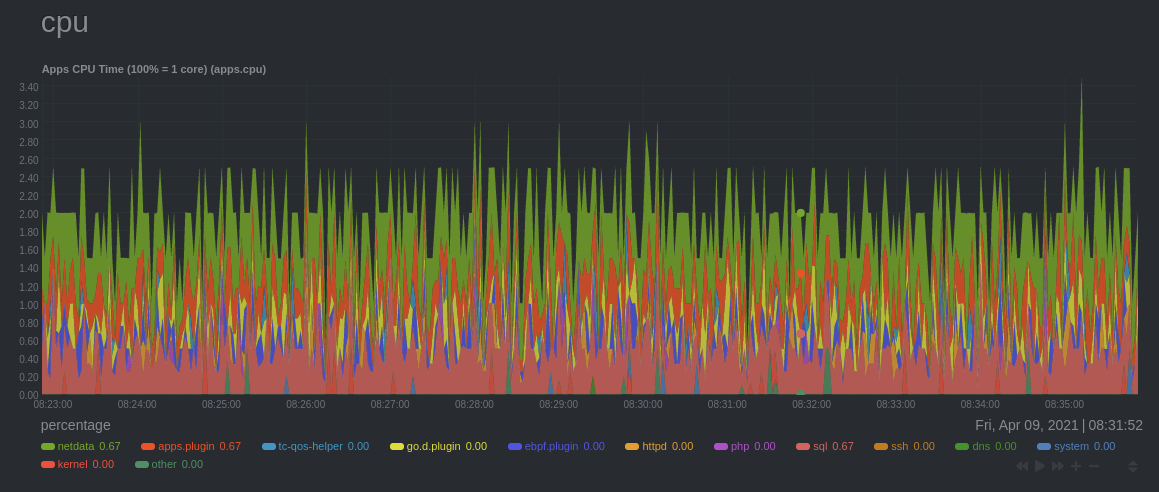 + +The chart shows 13 unique dimensions, such as `httpd` for the CPU utilization for web servers, `kernel` for anything +related to the Linux kernel, and so on. In your dashboard, these specific dimensions will almost certainly be different. + +Dimensions can be [hidden](https://github.com/netdata/netdata/blob/master/docs/cloud/visualize/interact-new-charts.md#show-and-hide-dimensions) to help you focus your +attention. + +## Context + +A **context** is a way of grouping charts by the types of metrics collected and dimensions displayed. It's kind of like +a machine-readable naming and organization scheme. + +For example, the **Apps CPU Time** has the context `apps.cpu`. A little further down on the dashboard is a similar +chart, **Apps Real Memory (w/o shared)** with the context `apps.mem`. The `apps` portion of the context is the **type**, +whereas anything after the `.` is specified either by the chart's developer or by the [**family**](#family). + +By default, a chart's type affects where it fits in the menu, while its family creates submenus. + +Netdata also relies on contexts for [alarm configuration](https://github.com/netdata/netdata/blob/master/health/REFERENCE.md) (the [`on` +line](https://github.com/netdata/netdata/blob/master/health/REFERENCE.md#alarm-line-on)). + +## Family + +**Families** are a _single instance_ of a hardware or software resource that needs to be displayed separately from +similar instances. + +For example, let's look at the **Disks** section, which contains a number of charts with contexts like `disk.io`, +`disk.ops`, `disk.backlog`, and `disk.util`. If your node has multiple disk drives at `sda` and `sdb`, Netdata creates +a separate family for each. + +Netdata now merges the contexts and families to create charts that are grouped by family, following a +`[context].[family]` naming scheme, so that you can see the `disk.io` and `disk.ops` charts for `sda` right next to each +other. + +Given the four example contexts, and two families of `sda` and `sdb`, Netdata will create the following charts and their +names: + +| Context | `sda` family | `sdb` family | +| :------------- | ------------------ | ------------------ | +| `disk.io` | `disk_io.sda` | `disk_io.sdb` | +| `disk.ops` | `disk_ops.sda` | `disk_ops.sdb` | +| `disk.backlog` | `disk_backlog.sda` | `disk_backlog.sdb` | +| `disk.util` | `disk_util.sda` | `disk_util.sdb` | |