
diff options
Diffstat (limited to 'docs/dashboard/visualization-date-and-time-controls.mdx')
| -rw-r--r-- | docs/dashboard/visualization-date-and-time-controls.mdx | 32 |
1 files changed, 18 insertions, 14 deletions
diff --git a/docs/dashboard/visualization-date-and-time-controls.mdx b/docs/dashboard/visualization-date-and-time-controls.mdx index fe3e51091..a59a1f066 100644 --- a/docs/dashboard/visualization-date-and-time-controls.mdx +++ b/docs/dashboard/visualization-date-and-time-controls.mdx @@ -1,9 +1,13 @@ ---- +<!-- title: "Visualization date and time controls" description: "Netdata's dashboard features powerful date visualization controls that include a time control (play, pause, force play), a timezone selector and a rich date and timeframe selector, with useful defaults and rich customization, to help you narrow your focus when troubleshooting issues or anomalies." -type: how-to -custom_edit_url: https://github.com/netdata/netdata/edit/master/docs/dashboard/visualization-date-and-time-controls.mdx ---- +type: "how-to" +custom_edit_url: "https://github.com/netdata/netdata/edit/master/docs/dashboard/visualization-date-and-time-controls.mdx" +sidebar_label: "Visualization date and time controls" +learn_status: "Published" +learn_topic_type: "Concepts" +learn_rel_path: "Concepts" +--> # Visualization date and time controls @@ -11,7 +15,7 @@ custom_edit_url: https://github.com/netdata/netdata/edit/master/docs/dashboard/v ### Pick timeframes to visualize -While [panning through time and zooming in/out](/docs/dashboard/interact-charts.mdx) from charts it is helpful when +While [panning through time and zooming in/out](https://github.com/netdata/netdata/blob/master/docs/dashboard/interact-charts.mdx) from charts it is helpful when you're looking a recent history, or want to do granular troubleshooting, what if you want to see metrics from 6 hours ago? Or 6 days? @@ -80,7 +84,7 @@ distributed in different timezones and they need to collaborate. Our goal is to make it easier for you and your teams to troubleshoot based on your timezone preference and communicate easily with varying timezones and timeframes without the need to be concerned about their specificity. -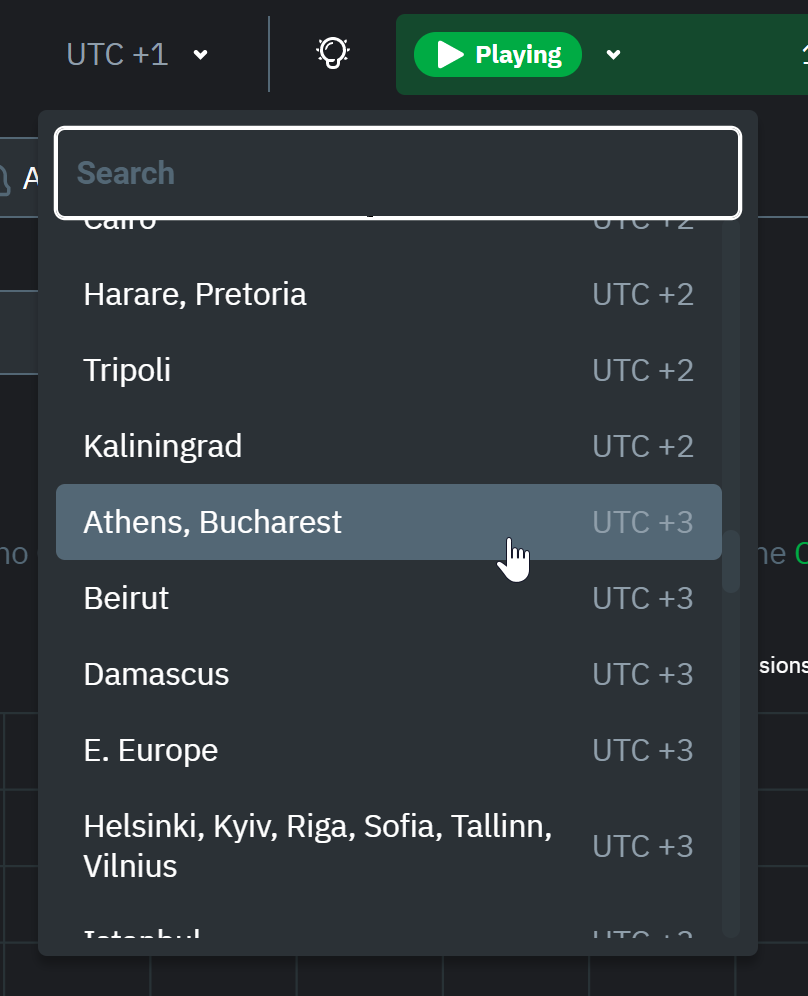 +<img width="437" alt="Untitled1" src="https://user-images.githubusercontent.com/43294513/216628390-c3bd1cd2-349d-4523-b8d3-c7e68395f670.png"> When you change the timezone all the date and time fields will be updated to be displayed according to the specified timezone, this goes from charts to alerts information and across the Netdata Cloud. @@ -99,23 +103,23 @@ beyond stored historical metrics, you'll see this message: 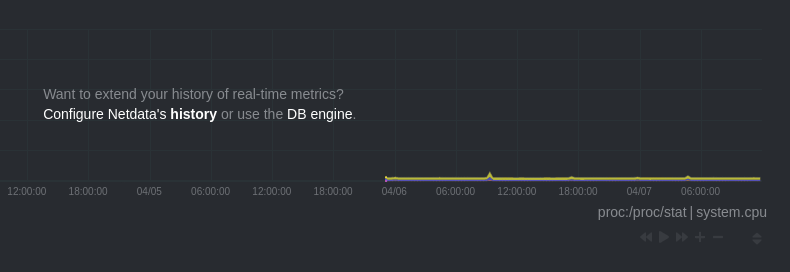 -At any time, [configure the internal TSDB's storage capacity](/docs/store/change-metrics-storage.md) to expand your +At any time, [configure the internal TSDB's storage capacity](https://github.com/netdata/netdata/blob/master/docs/store/change-metrics-storage.md) to expand your depth of historical metrics. ## What's next? One useful next step after selecting a timeframe is [exporting the -metrics](/docs/dashboard/import-export-print-snapshot.mdx) into a snapshot file, which can then be shared and imported +metrics](https://github.com/netdata/netdata/blob/master/docs/dashboard/import-export-print-snapshot.mdx) into a snapshot file, which can then be shared and imported into any other Netdata dashboard. -There are also many ways to [customize](/docs/dashboard/customize.mdx) the standard dashboard experience, from changing +There are also many ways to [customize](https://github.com/netdata/netdata/blob/master/docs/dashboard/customize.mdx) the standard dashboard experience, from changing the theme to editing the text that accompanies every section of charts. ## Further reading & related information - Dashboard - - [How the dashboard works](/docs/dashboard/how-dashboard-works.mdx) - - [Interact with charts](/docs/dashboard/interact-charts.mdx) - - [Chart dimensions, contexts, and families](/docs/dashboard/dimensions-contexts-families.mdx) - - [Import, export, and print a snapshot](/docs/dashboard/import-export-print-snapshot.mdx) - - [Customize the standard dashboard](/docs/dashboard/customize.mdx) + - [How the dashboard works](https://github.com/netdata/netdata/blob/master/docs/dashboard/how-dashboard-works.mdx) + - [Interact with charts](https://github.com/netdata/netdata/blob/master/docs/dashboard/interact-charts.mdx) + - [Chart dimensions, contexts, and families](https://github.com/netdata/netdata/blob/master/docs/dashboard/dimensions-contexts-families.mdx) + - [Import, export, and print a snapshot](https://github.com/netdata/netdata/blob/master/docs/dashboard/import-export-print-snapshot.mdx) + - [Customize the standard dashboard](https://github.com/netdata/netdata/blob/master/docs/dashboard/customize.mdx) |