
diff options
Diffstat (limited to 'docs/guides/monitor/anomaly-detection.md')
| -rw-r--r-- | docs/guides/monitor/anomaly-detection.md | 19 |
1 files changed, 10 insertions, 9 deletions
diff --git a/docs/guides/monitor/anomaly-detection.md b/docs/guides/monitor/anomaly-detection.md index ce819d93..4552e7a7 100644 --- a/docs/guides/monitor/anomaly-detection.md +++ b/docs/guides/monitor/anomaly-detection.md @@ -1,13 +1,14 @@ <!-- title: "Machine learning (ML) powered anomaly detection" +sidebar_label: "Machine learning (ML) powered anomaly detection" description: "Detect anomalies in any system, container, or application in your infrastructure with machine learning and the open-source Netdata Agent." image: /img/seo/guides/monitor/anomaly-detection.png -author: "Andrew Maguire" -author_title: "Analytics & ML Lead" -author_img: "/img/authors/andy-maguire.jpg" custom_edit_url: https://github.com/netdata/netdata/edit/master/docs/guides/monitor/anomaly-detection.md +learn_status: "Published" +learn_rel_path: "Operations" --> +# Machine learning (ML) powered anomaly detection ## Overview @@ -34,7 +35,7 @@ This guide will explain how to get started using these ML based anomaly detectio ## Anomaly Advisor -The [Anomaly Advisor](https://github.com/netdata/netdata/blob/master/docs/cloud/insights/anomaly-advisor.mdx) is the flagship anomaly detection feature within Netdata. In the "Anomalies" tab of Netdata you will see an overall "Anomaly Rate" chart that aggregates node level anomaly rate for all nodes in a space. The aim of this chart is to make it easy to quickly spot periods of time where the overall "[node anomaly rate](https://github.com/netdata/netdata/blob/master/ml/README.md#node-anomaly-rate)" is elevated in some unusual way and for what node or nodes this relates to. +The [Anomaly Advisor](https://github.com/netdata/netdata/blob/master/docs/cloud/insights/anomaly-advisor.md) is the flagship anomaly detection feature within Netdata. In the "Anomalies" tab of Netdata you will see an overall "Anomaly Rate" chart that aggregates node level anomaly rate for all nodes in a space. The aim of this chart is to make it easy to quickly spot periods of time where the overall "[node anomaly rate](https://github.com/netdata/netdata/blob/master/ml/README.md#node-anomaly-rate)" is elevated in some unusual way and for what node or nodes this relates to. 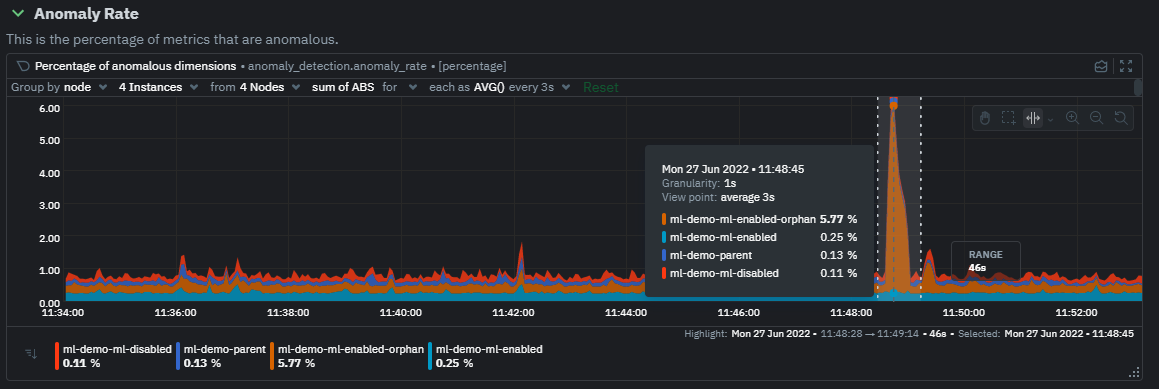 @@ -52,13 +53,13 @@ Pressing the anomalies icon (next to the information icon in the chart header) w ## Anomaly Rate Based Alerts -It is possible to use the `anomaly-bit` when defining traditional Alerts within netdata. The `anomaly-bit` is just another `options` parameter that can be passed as part of an [alarm line lookup](https://learn.netdata.cloud/docs/agent/health/reference#alarm-line-lookup). +It is possible to use the `anomaly-bit` when defining traditional Alerts within netdata. The `anomaly-bit` is just another `options` parameter that can be passed as part of an [alarm line lookup](https://github.com/netdata/netdata/blob/master/docs/configure/start-stop-restart.md#alarm-line-lookup). You can see some example ML based alert configurations below: -- [Anomaly rate based CPU dimensions alarm](https://learn.netdata.cloud/docs/agent/health/reference#example-8---anomaly-rate-based-cpu-dimensions-alarm) -- [Anomaly rate based CPU chart alarm](https://learn.netdata.cloud/docs/agent/health/reference#example-9---anomaly-rate-based-cpu-chart-alarm) -- [Anomaly rate based node level alarm](https://learn.netdata.cloud/docs/agent/health/reference#example-10---anomaly-rate-based-node-level-alarm) +- [Anomaly rate based CPU dimensions alarm](https://github.com/netdata/netdata/blob/master/docs/configure/start-stop-restart.md#example-8---anomaly-rate-based-cpu-dimensions-alarm) +- [Anomaly rate based CPU chart alarm](https://github.com/netdata/netdata/blob/master/docs/configure/start-stop-restart.md#example-9---anomaly-rate-based-cpu-chart-alarm) +- [Anomaly rate based node level alarm](https://github.com/netdata/netdata/blob/master/docs/configure/start-stop-restart.md#example-10---anomaly-rate-based-node-level-alarm) - More examples in the [`/health/health.d/ml.conf`](https://github.com/netdata/netdata/blob/master/health/health.d/ml.conf) file that ships with the agent. ## Learn More @@ -66,7 +67,7 @@ You can see some example ML based alert configurations below: Check out the resources below to learn more about how Netdata is approaching ML: - [Agent ML documentation](https://github.com/netdata/netdata/blob/master/ml/README.md). -- [Anomaly Advisor documentation](https://github.com/netdata/netdata/blob/master/docs/cloud/insights/anomaly-advisor.mdx). +- [Anomaly Advisor documentation](https://github.com/netdata/netdata/blob/master/docs/cloud/insights/anomaly-advisor.md). - [Metric Correlations documentation](https://github.com/netdata/netdata/blob/master/docs/cloud/insights/metric-correlations.md). - Anomaly Advisor [launch blog post](https://www.netdata.cloud/blog/introducing-anomaly-advisor-unsupervised-anomaly-detection-in-netdata/). - Netdata Approach to ML [blog post](https://www.netdata.cloud/blog/our-approach-to-machine-learning/). |