
diff options
Diffstat (limited to 'docs/guides/monitor/lamp-stack.md')
| -rw-r--r-- | docs/guides/monitor/lamp-stack.md | 249 |
1 files changed, 249 insertions, 0 deletions
diff --git a/docs/guides/monitor/lamp-stack.md b/docs/guides/monitor/lamp-stack.md new file mode 100644 index 000000000..f11dfe5bd --- /dev/null +++ b/docs/guides/monitor/lamp-stack.md @@ -0,0 +1,249 @@ +<!-- +title: "LAMP stack monitoring (Linux, Apache, MySQL, PHP) with Netdata" +description: "Set up robust LAMP stack monitoring (Linux, Apache, MySQL, PHP) in just a few minutes using a free, open-source monitoring tool that collects metrics every second." +image: /img/seo/guides/monitor/lamp-stack.png +author: "Joel Hans" +author_title: "Editorial Director, Technical & Educational Resources" +author_img: "/img/authors/joel-hans.jpg" +custom_edit_url: https://github.com/netdata/netdata/edit/master/docs/guides/monitor/lamp-stack.md +--> + +# LAMP stack monitoring (Linux, Apache, MySQL, PHP) with Netdata + +The LAMP stack is the "hello world" for deploying dynamic web applications. It's fast, flexible, and reliable, which +means a developer or sysadmin won't go far in their career without interacting with the stack and its services. + +_LAMP_ is an acronym of the core services that make up the web application: **L**inux, **A**pache, **M**ySQL, and +**P**HP. + +- [Linux](https://en.wikipedia.org/wiki/Linux) is the operating system running the whole stack. +- [Apache](https://httpd.apache.org/) is a web server that responds to HTTP requests from users and returns web pages. +- [MySQL](https://www.mysql.com/) is a database that stores and returns information based on queries from the web + application. +- [PHP](https://www.php.net/) is a scripting language used to query the MySQL database and build new pages. + +LAMP stacks are the foundation for tons of end-user applications, with [Wordpress](https://wordpress.org/) being the +most popular. + +## Challenge + +You've already deployed a LAMP stack, either in testing or production. You want to monitor every service's performance +and availability to ensure the best possible experience for your end-users. You might also be particularly interested in +using a free, open-source monitoring tool. + +Depending on your monitoring experience, you may not even know what metrics you're looking for, much less how to build +dashboards using a query language. You need a robust monitoring experience that has the metrics you need without a ton +of required setup. + +## Solution + +In this tutorial, you'll set up robust LAMP stack monitoring with Netdata in just a few minutes. When you're done, +you'll have one dashboard to monitor every part of your web application, including each essential LAMP stack service. + +This dashboard updates every second with new metrics, and pairs those metrics up with preconfigured alarms to keep you +informed of any errors or odd behavior. + +## What you need to get started + +To follow this tutorial, you need: + +- A physical or virtual Linux system, which we'll call a _node_. +- A functional LAMP stack. There's plenty of tutorials for installing a LAMP stack, like [this + one](https://www.digitalocean.com/community/tutorials/how-to-install-linux-apache-mysql-php-lamp-stack-ubuntu-18-04) + from Digital Ocean. +- Optionally, a [Netdata Cloud](https://app.netdata.cloud/sign-up?cloudRoute=/spaces) account, which you can use to view + metrics from multiple nodes in one dashboard, and a whole lot more, for free. + +## Install the Netdata Agent + +If you don't have the free, open-source [Netdata Agent](/docs/get/README.md) installed on your node yet, get started +with a [single kickstart command](/packaging/installer/methods/kickstart.md): + +```bash +bash <(curl -Ss https://my-netdata.io/kickstart.sh) +``` + +The Netdata Agent is now collecting metrics from your node every second. You don't need to jump into the dashboard yet, +but if you're curious, open your favorite browser and navigate to `http://localhost:19999` or `http://NODE:19999`, +replacing `NODE` with the hostname or IP address of your system. + +## Enable hardware and Linux system monitoring + +There's nothing you need to do to enable [system monitoring](/docs/collect/system-metrics.md) and Linux monitoring with +the Netdata Agent, which autodetects metrics from CPUs, memory, disks, networking devices, and Linux processes like +systemd without any configuration. If you're using containers, Netdata automatically collects resource utilization +metrics from each using the [cgroups data collector](/collectors/cgroups.plugin/README.md). + +## Enable Apache monitoring + +Let's begin by configuring Apache to work with Netdata's [Apache data +collector](https://learn.netdata.cloud/docs/agent/collectors/go.d.plugin/modules/apache). + +Actually, there's nothing for you to do to enable Apache monitoring with Netdata. + +Apache comes with `mod_status` enabled by default these days, and Netdata is smart enough to look for metrics at that +endpoint without you configuring it. Netdata is already collecting [`mod_status` +metrics](https://httpd.apache.org/docs/2.4/mod/mod_status.html), which is just _part_ of your web server monitoring. + +## Enable web log monitoring + +The Netdata Agent also comes with a [web log +collector](https://learn.netdata.cloud/docs/agent/collectors/go.d.plugin/modules/weblog), which reads Apache's access +log file, procesess each line, and converts them into per-second metrics. On Debian systems, it reads the file at +`/var/log/apache2/access.log`. + +At installation, the Netdata Agent adds itself to the [`adm` +group](https://wiki.debian.org/SystemGroups#Groups_without_an_associated_user), which gives the `netdata` process the +right privileges to read Apache's log files. In other words, you don't need to do anything to enable Apache web log +monitoring. + +## Enable MySQL monitoring + +Because your MySQL database is password-protected, you do need to tell MySQL to allow the `netdata` user to connect to +without a password. Netdata's [MySQL data +collector](https://learn.netdata.cloud/docs/agent/collectors/go.d.plugin/modules/mysql) collects metrics in _read-only_ +mode, without being able to alter or affect operations in any way. + +First, log into the MySQL shell. Then, run the following three commands, one at a time: + +```mysql +CREATE USER 'netdata'@'localhost'; +GRANT USAGE, REPLICATION CLIENT, PROCESS ON *.* TO 'netdata'@'localhost'; +FLUSH PRIVILEGES; +``` + +Run `sudo systemctl restart netdata`, or the [appropriate alternative for your +system](/docs/configure/start-stop-restart.md), to collect dozens of metrics every second for robust MySQL monitoring. + +## Enable PHP monitoring + +Unlike Apache or MySQL, PHP isn't a service that you can monitor directly, unless you instrument a PHP-based application +with [StatsD](/collectors/statsd.plugin/README.md). + +However, if you use [PHP-FPM](https://php-fpm.org/) in your LAMP stack, you can monitor that process with our [PHP-FPM +data collector](https://learn.netdata.cloud/docs/agent/collectors/go.d.plugin/modules/phpfpm). + +Open your PHP-FPM configuration for editing, replacing `7.4` with your version of PHP: + +```bash +sudo nano /etc/php/7.4/fpm/pool.d/www.conf +``` + +> Not sure what version of PHP you're using? Run `php -v`. + +Find the line that reads `;pm.status_path = /status` and remove the `;` so it looks like this: + +```conf +pm.status_path = /status +``` + +Next, add a new `/status` endpoint to Apache. Open the Apache configuration file you're using for your LAMP stack. + +```bash +sudo nano /etc/apache2/sites-available/your_lamp_stack.conf +``` + +Add the following to the end of the file, again replacing `7.4` with your version of PHP: + +```apache +ProxyPass "/status" "unix:/run/php/php7.4-fpm.sock|fcgi://localhost" +``` + +Save and close the file. Finally, restart the PHP-FPM, Apache, and Netdata processes. + +```bash +sudo systemctl restart php7.4-fpm.service +sudo systemctl restart apache2 +sudo systemctl restart netdata +``` + +As the Netdata Agent starts up again, it automatically connects to the new `127.0.0.1/status` page and collects +per-second PHP-FPM metrics to get you started with PHP monitoring. + +## View LAMP stack metrics + +If the Netdata Agent isn't already open in your browser, open a new tab and navigate to `http://localhost:19999` or +`http://NODE:19999`, replacing `NODE` with the hostname or IP address of your system. + +> If you [signed up](https://app.netdata.cloud/sign-up?cloudRoute=/spaces) for Netdata Cloud earlier, you can also view +> the exact same LAMP stack metrics there, plus additional features, like drag-and-drop custom dashboards. Be sure to +> [claim your node](/docs/get/README.md#claim-your-node-to-netdata-cloud) to start streaming metrics to your browser +> through Netdata Cloud. + +Netdata automatically organizes all metrics and charts onto a single page for easy navigation. Peek at gauges to see +overall system performance, then scroll down to see more. Click-and-drag with your mouse to pan _all_ charts back and +forth through different time intervals, or hold `SHIFT` and use the scrollwheel (or two-finger scroll) to zoom in and +out. Check out our doc on [interacting with charts](/docs/visualize/interact-dashboards-charts.md) for all the details. + + + +The **System Overview** section, which you can also see in the right-hand menu, contains key hardware monitoring charts, +including CPU utilization, memory page faults, network monitoring, and much more. The **Applications** section shows you +exactly which Linux processes are using the most system resources. + +Next, let's check out LAMP-specific metrics. You should see four relevant sections: **Apache local**, **MySQL local**, +**PHP-FPM local**, and **web log apache**. Click on any of these to see metrics from each service in your LAMP stack. + +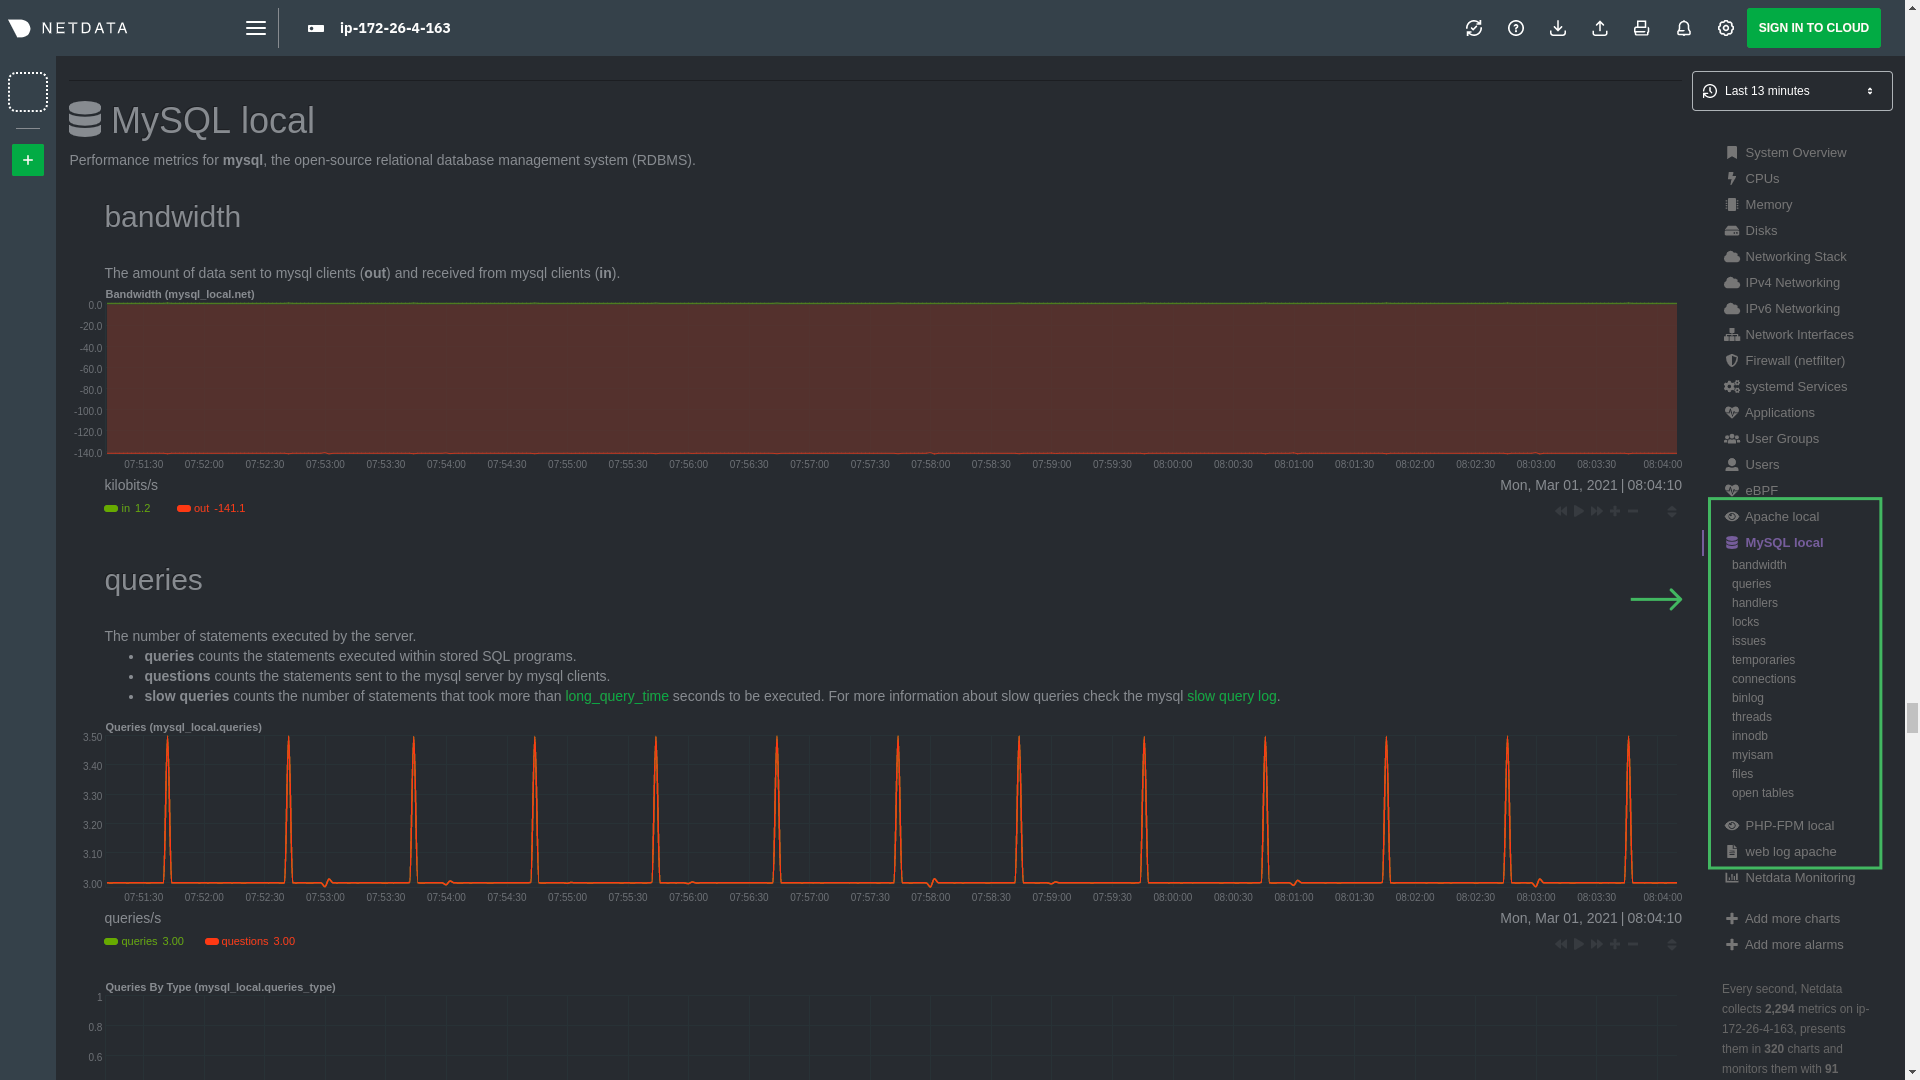 + +### Key LAMP stack monitoring charts + +Here's a quick reference for what charts you might want to focus on after setting up Netdata. + +| Chart name / context | Type | Why? | +|-------------------------------------------------------|---------------------|-----------------------------------------------------------------------------------------------------------------------------------------------------------------------------------------------------------------| +| System Load Average (`system.load`) | Hardware monitoring | A good baseline load average is `0.7`, while `1` (on a 1-core system, `2` on a 2-core system, and so on) means resources are "perfectly" utilized. Higher load indicates a bottleneck somewhere in your system. | +| System RAM (`system.ram`) | Hardware monitoring | Look at the `free` dimension. If that drops to `0`, your system will use swap memory and slow down. | +| Uptime (`apache_local.uptime`) | Apache monitoring | This chart should always be "climbing," indicating a continuous uptime. Investigate any drops back to `0`. | +| Requests By Type (`web_log_apache.requests_by_type`) | Apache monitoring | Check for increases in the `error` or `bad` dimensions, which could indicate users arriving at broken pages or PHP returning errors. | +| Queries (`mysql_local.queries`) | MySQL monitoring | Queries is the total number of queries (queries per second, QPS). Check this chart for sudden spikes or drops, which indicate either increases in traffic/demand or bottlenecks in hardware performance. | +| Active Connections (`mysql_local.connections_active`) | MySQL monitoring | If the `active` dimension nears the `limit`, your MySQL database will bottleneck responses. | +| Performance (phpfpm_local.performance) | PHP monitoring | The `slow requests` dimension lets you know if any requests exceed the configured `request_slowlog_timeout`. If so, users might be having a less-than-ideal experience. | + +## Get alarms for LAMP stack errors + +The Netdata Agent comes with hundreds of pre-configured alarms to help you keep tabs on your system, including 19 alarms +designed for smarter LAMP stack monitoring. + +Click the 🔔 icon in the top navigation to [see active alarms](/docs/monitor/view-active-alarms.md). The **Active** tabs +shows any alarms currently triggered, while the **All** tab displays a list of _every_ pre-configured alarm. The + + + +[Tweak alarms](/docs/monitor/configure-alarms.md) based on your infrastructure monitoring needs, and to see these alarms +in other places, like your inbox or a Slack channel, [enable a notification +method](/docs/monitor/enable-notifications.md). + +## What's next? + +You've now set up robust monitoring for your entire LAMP stack: Linux, Apache, MySQL, and PHP (-FPM, to be exact). These +metrics will help you keep tabs on the performance and availability of your web application and all its essential +services. The per-second metrics granularity means you have the most accurate information possible for troubleshooting +any LAMP-related issues. + +Another powerful way to monitor the availability of a LAMP stack is the [`httpcheck` +collector](https://learn.netdata.cloud/docs/agent/collectors/go.d.plugin/modules/httpcheck), which pings a web server at +a regular interval and tells you whether if and how quickly it's responding. The `response_match` option also lets you +monitor when the web server's response isn't what you expect it to be, which might happen if PHP-FPM crashes, for +example. + +The best way to use the `httpcheck` collector is from a separate node from the one running your LAMP stack, which is why +we're not covering it here, but it _does_ work in a single-node setup. Just don't expect it to tell you if your whole +node crashed. + +If you're planning on managing more than one node, or want to take advantage of advanced features, like finding the +source of issues faster with [Metric Correlations](https://learn.netdata.cloud/docs/cloud/insights/metric-correlations), +[sign up](https://app.netdata.cloud/sign-up?cloudRoute=/spaces) for a free Netdata Cloud account. + +### Related reference documentation + +- [Netdata Agent · Get Netdata](/docs/get/README.md) +- [Netdata Agent · Apache data collector](https://learn.netdata.cloud/docs/agent/collectors/go.d.plugin/modules/apache) +- [Netdata Agent · Web log collector](https://learn.netdata.cloud/docs/agent/collectors/go.d.plugin/modules/weblog) +- [Netdata Agent · MySQL data collector](https://learn.netdata.cloud/docs/agent/collectors/go.d.plugin/modules/mysql) +- [Netdata Agent · PHP-FPM data collector](https://learn.netdata.cloud/docs/agent/collectors/go.d.plugin/modules/phpfpm) + +[](<>)
\ No newline at end of file |