
diff options
Diffstat (limited to 'docs/guides/monitor')
| -rw-r--r-- | docs/guides/monitor/anomaly-detection.md | 191 | ||||
| -rw-r--r-- | docs/guides/monitor/dimension-templates.md | 176 | ||||
| -rw-r--r-- | docs/guides/monitor/kubernetes-k8s-netdata.md | 278 | ||||
| -rw-r--r-- | docs/guides/monitor/pi-hole-raspberry-pi.md | 163 | ||||
| -rw-r--r-- | docs/guides/monitor/process.md | 299 | ||||
| -rw-r--r-- | docs/guides/monitor/stop-notifications-alarms.md | 92 | ||||
| -rw-r--r-- | docs/guides/monitor/visualize-monitor-anomalies.md | 147 |
7 files changed, 1346 insertions, 0 deletions
diff --git a/docs/guides/monitor/anomaly-detection.md b/docs/guides/monitor/anomaly-detection.md new file mode 100644 index 000000000..bb9dbc829 --- /dev/null +++ b/docs/guides/monitor/anomaly-detection.md @@ -0,0 +1,191 @@ +<!-- +title: "Detect anomalies in systems and applications" +description: "Detect anomalies in any system, container, or application in your infrastructure with machine learning and the open-source Netdata Agent." +image: /img/seo/guides/monitor/anomaly-detection.png +author: "Joel Hans" +author_title: "Editorial Director, Technical & Educational Resources" +author_img: "/img/authors/joel-hans.jpg" +custom_edit_url: https://github.com/netdata/netdata/edit/master/docs/guides/monitor/anomaly-detection.md +--> + +# Detect anomalies in systems and applications + +Beginning with v1.27, the [open-source Netdata Agent](https://github.com/netdata/netdata) is capable of unsupervised +[anomaly detection](https://en.wikipedia.org/wiki/Anomaly_detection) with machine learning (ML). As with all things +Netdata, the anomalies collector comes with preconfigured alarms and instant visualizations that require no query +languages or organizing metrics. You configure the collector to look at specific charts, and it handles the rest. + +Netdata's implementation uses a handful of functions in the [Python Outlier Detection (PyOD) +library](https://github.com/yzhao062/pyod/tree/master), which periodically runs a `train` function that learns what +"normal" looks like on your node and creates an ML model for each chart, then utilizes the +[`predict_proba()`](https://pyod.readthedocs.io/en/latest/api_cc.html#pyod.models.base.BaseDetector.predict_proba) and +[`predict()`](https://pyod.readthedocs.io/en/latest/api_cc.html#pyod.models.base.BaseDetector.predict) PyOD functions to +quantify how anomalous certain charts are. + +All these metrics and alarms are available for centralized monitoring in [Netdata Cloud](https://app.netdata.cloud). If +you choose to sign up for Netdata Cloud and [claim your nodes](/claim/README.md), you will have the ability to run +tailored anomaly detection on every node in your infrastructure, regardless of its purpose or workload. + +In this guide, you'll learn how to set up the anomalies collector to instantly detect anomalies in an Nginx web server +and/or the node that hosts it, which will give you the tools to configure parallel unsupervised monitors for any +application in your infrastructure. Let's get started. + +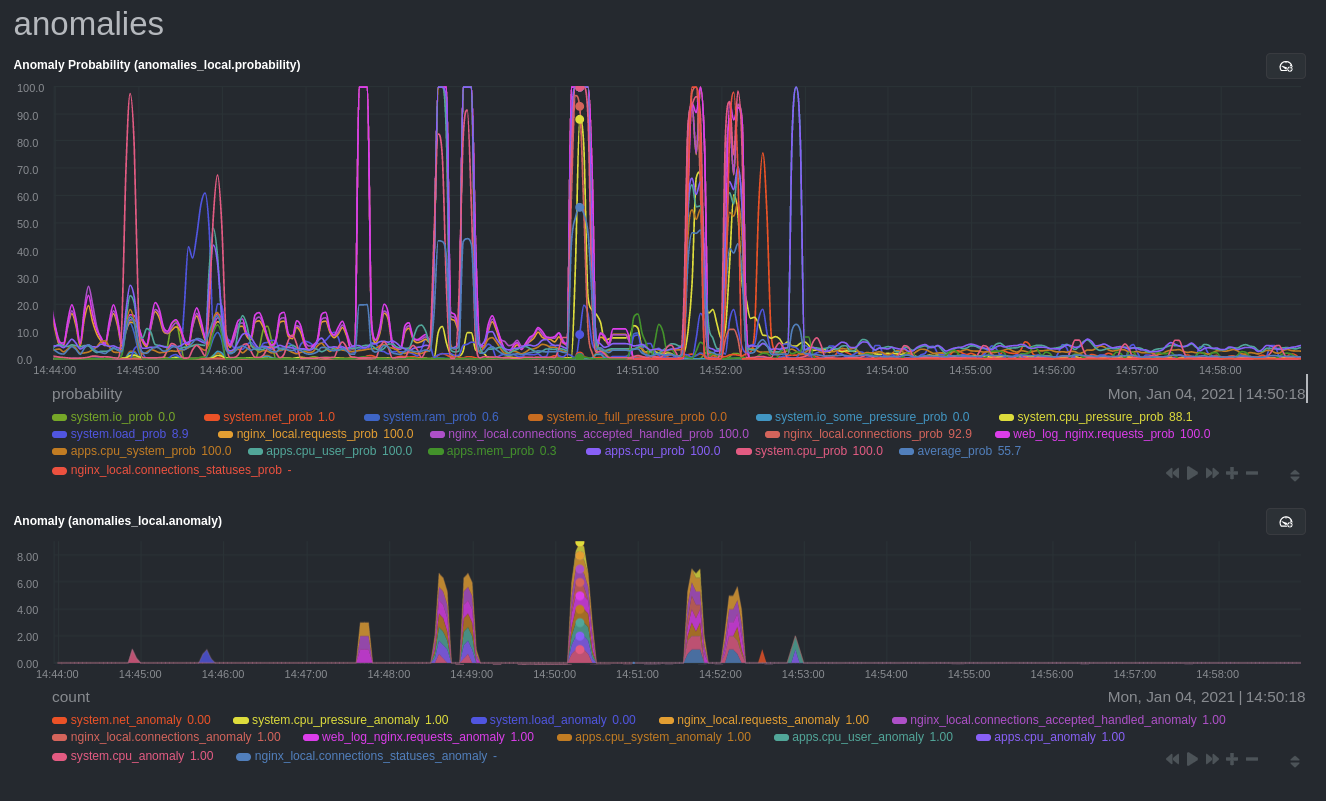 + +## Prerequisites + +- A node running the Netdata Agent. If you don't yet have that, [get Netdata](/docs/get/README.md). +- A Netdata Cloud account. [Sign up](https://app.netdata.cloud) if you don't have one already. +- Familiarity with configuring the Netdata Agent with [`edit-config`](/docs/configure/nodes.md). +- _Optional_: An Nginx web server running on the same node to follow the example configuration steps. + +## Install required Python packages + +The anomalies collector uses a few Python packages, available with `pip3`, to run ML training. It requires +[`numba`](http://numba.pydata.org/), [`scikit-learn`](https://scikit-learn.org/stable/), +[`pyod`](https://pyod.readthedocs.io/en/latest/), in addition to +[`netdata-pandas`](https://github.com/netdata/netdata-pandas), which is a package built by the Netdata team to pull data +from a Netdata Agent's API into a [Pandas](https://pandas.pydata.org/). Read more about `netdata-pandas` on its [package +repo](https://github.com/netdata/netdata-pandas) or in Netdata's [community +repo](https://github.com/netdata/community/tree/main/netdata-agent-api/netdata-pandas). + +```bash +# Become the netdata user +sudo su -s /bin/bash netdata + +# Install required packages for the netdata user +pip3 install --user netdata-pandas==0.0.32 numba==0.50.1 scikit-learn==0.23.2 pyod==0.8.3 +``` + +> If the `pip3` command fails, you need to install it. For example, on an Ubuntu system, use `sudo apt install +> python3-pip`. + +Use `exit` to become your normal user again. + +## Enable the anomalies collector + +Navigate to your [Netdata config directory](/docs/configure/nodes.md#the-netdata-config-directory) and use `edit-config` +to open the `python.d.conf` file. + +```bash +sudo ./edit-config python.d.conf +``` + +In `python.d.conf` file, search for the `anomalies` line. If the line exists, set the value to `yes`. Add the line +yourself if it doesn't already exist. Either way, the final result should look like: + +```conf +anomalies: yes +``` + +[Restart the Agent](/docs/configure/start-stop-restart.md) with `sudo systemctl restart netdata` to start up the +anomalies collector. By default, the model training process runs every 30 minutes, and uses the previous 4 hours of +metrics to establish a baseline for health and performance across the default included charts. + +> 💡 The anomaly collector may need 30-60 seconds to finish its initial training and have enough data to start +> generating anomaly scores. You may need to refresh your browser tab for the **Anomalies** section to appear in menus +> on both the local Agent dashboard or Netdata Cloud. + +## Configure the anomalies collector + +Open `python.d/anomalies.conf` with `edit-conf`. + +```bash +sudo ./edit-config python.d/anomalies.conf +``` + +The file contains many user-configurable settings with sane defaults. Here are some important settings that don't +involve tweaking the behavior of the ML training itself. + +- `charts_regex`: Which charts to train models for and run anomaly detection on, with each chart getting a separate + model. +- `charts_to_exclude`: Specific charts, selected by the regex in `charts_regex`, to exclude. +- `train_every_n`: How often to train the ML models. +- `train_n_secs`: The number of historical observations to train each model on. The default is 4 hours, but if your node + doesn't have historical metrics going back that far, consider [changing the metrics retention + policy](/docs/store/change-metrics-storage.md) or reducing this window. +- `custom_models`: A way to define custom models that you want anomaly probabilities for, including multi-node or + streaming setups. More on custom models in part 3 of this guide series. + +> ⚠️ Setting `charts_regex` with many charts or `train_n_secs` to a very large number will have an impact on the +> resources and time required to train a model for every chart. The actual performance implications depend on the +> resources available on your node. If you plan on changing these settings beyond the default, or what's mentioned in +> this guide, make incremental changes to observe the performance impact. Considering `train_max_n` to cap the number of +> observations actually used to train on. + +### Run anomaly detection on Nginx and log file metrics + +As mentioned above, this guide uses an Nginx web server to demonstrate how the anomalies collector works. You must +configure the collector to monitor charts from the +[Nginx](https://learn.netdata.cloud/docs/agent/collectors/go.d.plugin/modules/nginx) and [web +log](https://learn.netdata.cloud/docs/agent/collectors/go.d.plugin/modules/weblog) collectors. + +`charts_regex` allows for some basic regex, such as wildcards (`*`) to match all contexts with a certain pattern. For +example, `system\..*` matches with any chart wit ha context that begins with `system.`, and ends in any number of other +characters (`.*`). Note the escape character (`\`) around the first period to capture a period character exactly, and +not any character. + +Change `charts_regex` in `anomalies.conf` to the following: + +```conf + charts_regex: 'system\..*|nginx_local\..*|web_log_nginx\..*|apps.cpu|apps.mem' +``` + +This value tells the anomaly collector to train against every `system.` chart, every `nginx_local` chart, every +`web_log_nginx` chart, and specifically the `apps.cpu` and `apps.mem` charts. + + + +### Remove some metrics from anomaly detection + +As you can see in the above screenshot, this node is now looking for anomalies in many places. The result is a single +`anomalies_local.probability` chart with more than twenty dimensions, some of which the dashboard hides at the bottom of +a scroll-able area. In addition, training and analyzing the anomaly collector on many charts might require more CPU +utilization that you're willing to give. + +First, explicitly declare which `system.` charts to monitor rather than of all of them using regex (`system\..*`). + +```conf + charts_regex: 'system\.cpu|system\.load|system\.io|system\.net|system\.ram|nginx_local\..*|web_log_nginx\..*|apps.cpu|apps.mem' +``` + +Next, remove some charts with the `charts_to_exclude` setting. For this example, using an Nginx web server, focus on the +volume of requests/responses, not, for example, which type of 4xx response a user might receive. + +```conf + charts_to_exclude: 'web_log_nginx.excluded_requests,web_log_nginx.responses_by_status_code_class,web_log_nginx.status_code_class_2xx_responses,web_log_nginx.status_code_class_4xx_responses,web_log_nginx.current_poll_uniq_clients,web_log_nginx.requests_by_http_method,web_log_nginx.requests_by_http_version,web_log_nginx.requests_by_ip_proto' +``` + + + +Apply the ideas behind the collector's regex and exclude settings to any other +[system](/docs/collect/system-metrics.md), [container](/docs/collect/container-metrics.md), or +[application](/docs/collect/application-metrics.md) metrics you want to detect anomalies for. + +## What's next? + +Now that you know how to set up unsupervised anomaly detection in the Netdata Agent, using an Nginx web server as an +example, it's time to apply that knowledge to other mission-critical parts of your infrastructure. If you're not sure +what to monitor next, check out our list of [collectors](/collectors/COLLECTORS.md) to see what kind of metrics Netdata +can collect from your systems, containers, and applications. + +For a more user-friendly anomaly detection experience, try out the [Metric +Correlations](https://learn.netdata.cloud/docs/cloud/insights/metric-correlations) feature in Netdata Cloud. Metric +Correlations runs only at your requests, removing unrelated charts from the dashboard to help you focus on root cause +analysis. + +Stay tuned for the next two parts of this guide, which provide more real-world context for the anomalies collector. +First, maximize the immediate value you get from anomaly detection by tracking preconfigured alarms, visualizing +anomalies in charts, and building a new dashboard tailored to your applications. Then, learn about creating custom ML +models, which help you holistically monitor an application or service by monitoring anomalies across a _cluster of +charts_. + +### Related reference documentation + +- [Netdata Agent · Anomalies collector](/collectors/python.d.plugin/anomalies/README.md) +- [Netdata Cloud · Metric Correlations](https://learn.netdata.cloud/docs/cloud/insights/metric-correlations) + +[](<>) diff --git a/docs/guides/monitor/dimension-templates.md b/docs/guides/monitor/dimension-templates.md new file mode 100644 index 000000000..da1faed8b --- /dev/null +++ b/docs/guides/monitor/dimension-templates.md @@ -0,0 +1,176 @@ +<!-- +title: "Use dimension templates to create dynamic alarms" +custom_edit_url: https://github.com/netdata/netdata/edit/master/docs/monitor/health/dimension-templates.md +--> + +# Use dimension templates to create dynamic alarms + +Your ability to monitor the health of your systems and applications relies on your ability to create and maintain +the best set of alarms for your particular needs. + +In v1.18 of Netdata, we introduced **dimension templates** for alarms, which simplifies the process of writing [alarm +entities](/health/REFERENCE.md#health-entity-reference) for charts with many dimensions. + +Dimension templates can condense many individual entities into one—no more copy-pasting one entity and changing the +`alarm`/`template` and `lookup` lines for each dimension you'd like to monitor. + +They are, however, an advanced health monitoring feature. For more basic instructions on creating your first alarm, +check out our [health monitoring documentation](/health/README.md), which also includes +[examples](/health/REFERENCE.md#example-alarms). + +## The fundamentals of `foreach` + +Our dimension templates update creates a new `foreach` parameter to the existing [`lookup` +line](/health/REFERENCE.md#alarm-line-lookup). This is where the magic happens. + +You use the `foreach` parameter to specify which dimensions you want to monitor with this single alarm. You can separate +them with a comma (`,`) or a pipe (`|`). You can also use a [Netdata simple pattern](/libnetdata/simple_pattern/README.md) +to create many alarms with a regex-like syntax. + +The `foreach` parameter _has_ to be the last parameter in your `lookup` line, and if you have both `of` and `foreach` in +the same `lookup` line, Netdata will ignore the `of` parameter and use `foreach` instead. + +Let's get into some examples so you can see how the new parameter works. + +> ⚠️ The following entities are examples to showcase the functionality and syntax of dimension templates. They are not +> meant to be run as-is on production systems. + +## Condensing entities with `foreach` + +Let's say you want to monitor the `system`, `user`, and `nice` dimensions in your system's overall CPU utilization. +Before dimension templates, you would need the following three entities: + +```yaml + alarm: cpu_system + on: system.cpu +lookup: average -10m percentage of system + every: 1m + warn: $this > 50 + crit: $this > 80 + + alarm: cpu_user + on: system.cpu +lookup: average -10m percentage of user + every: 1m + warn: $this > 50 + crit: $this > 80 + + alarm: cpu_nice + on: system.cpu +lookup: average -10m percentage of nice + every: 1m + warn: $this > 50 + crit: $this > 80 +``` + +With dimension templates, you can condense these into a single alarm. Take note of the `alarm` and `lookup` lines. + +```yaml + alarm: cpu_template + on: system.cpu +lookup: average -10m percentage foreach system,user,nice + every: 1m + warn: $this > 50 + crit: $this > 80 +``` + +The `alarm` line specifies the naming scheme Netdata will use. You can use whatever naming scheme you'd like, with `.` +and `_` being the only allowed symbols. + +The `lookup` line has changed from `of` to `foreach`, and we're now passing three dimensions. + +In this example, Netdata will create three alarms with the names `cpu_template_system`, `cpu_template_user`, and +`cpu_template_nice`. Every minute, each alarm will use the same database query to calculate the average CPU usage for +the `system`, `user`, and `nice` dimensions over the last 10 minutes and send out alarms if necessary. + +You can find these three alarms active by clicking on the **Alarms** button in the top navigation, and then clicking on +the **All** tab and scrolling to the **system - cpu** collapsible section. + +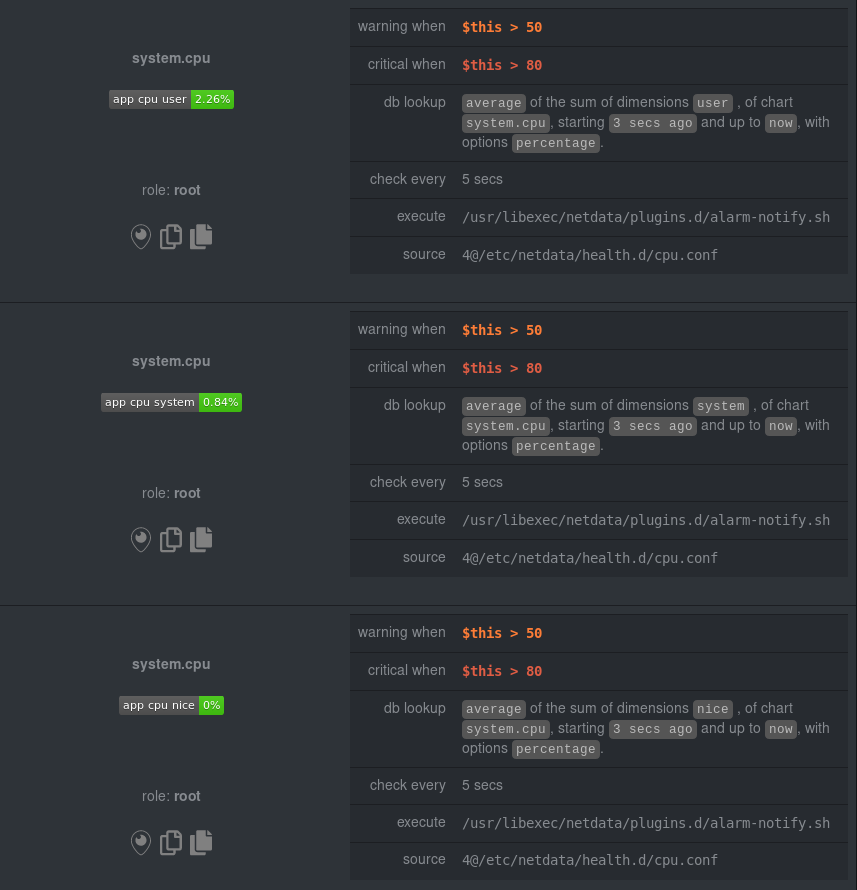 + +Let's look at some other examples of how `foreach` works so you can best apply it in your configurations. + +### Using a Netdata simple pattern in `foreach` + +In the last example, we used `foreach system,user,nice` to create three distinct alarms using dimension templates. But +what if you want to quickly create alarms for _all_ the dimensions of a given chart? + +Use a [simple pattern](/libnetdata/simple_pattern/README.md)! One example of a simple pattern is a single wildcard +(`*`). + +Instead of monitoring system CPU usage, let's monitor per-application CPU usage using the `apps.cpu` chart. Passing a +wildcard as the simple pattern tells Netdata to create a separate alarm for _every_ process on your system: + +```yaml + alarm: app_cpu + on: apps.cpu +lookup: average -10m percentage foreach * + every: 1m + warn: $this > 50 + crit: $this > 80 +``` + +This entity will now create alarms for every dimension in the `apps.cpu` chart. Given that most `apps.cpu` charts have +10 or more dimensions, using the wildcard ensures you catch every CPU-hogging process. + +To learn more about how to use simple patterns with dimension templates, see our [simple patterns +documentation](/libnetdata/simple_pattern/README.md). + +## Using `foreach` with alarm templates + +Dimension templates also work with [alarm templates](/health/REFERENCE.md#alarm-line-alarm-or-template). Alarm +templates help you create alarms for all the charts with a given context—for example, all the cores of your system's +CPU. + +By combining the two, you can create dozens of individual alarms with a single template entity. Here's how you would +create alarms for the `system`, `user`, and `nice` dimensions for every chart in the `cpu.cpu` context—or, in other +words, every CPU core. + +```yaml +template: cpu_template + on: cpu.cpu + lookup: average -10m percentage foreach system,user,nice + every: 1m + warn: $this > 50 + crit: $this > 80 +``` + +On a system with a 6-core, 12-thread Ryzen 5 1600 CPU, this one entity creates alarms on the following charts and +dimensions: + +- `cpu.cpu0` + - `cpu_template_user` + - `cpu_template_system` + - `cpu_template_nice` +- `cpu.cpu1` + - `cpu_template_user` + - `cpu_template_system` + - `cpu_template_nice` +- `cpu.cpu2` + - `cpu_template_user` + - `cpu_template_system` + - `cpu_template_nice` +- ... +- `cpu.cpu11` + - `cpu_template_user` + - `cpu_template_system` + - `cpu_template_nice` + +And how just a few of those dimension template-generated alarms look like in the Netdata dashboard. + +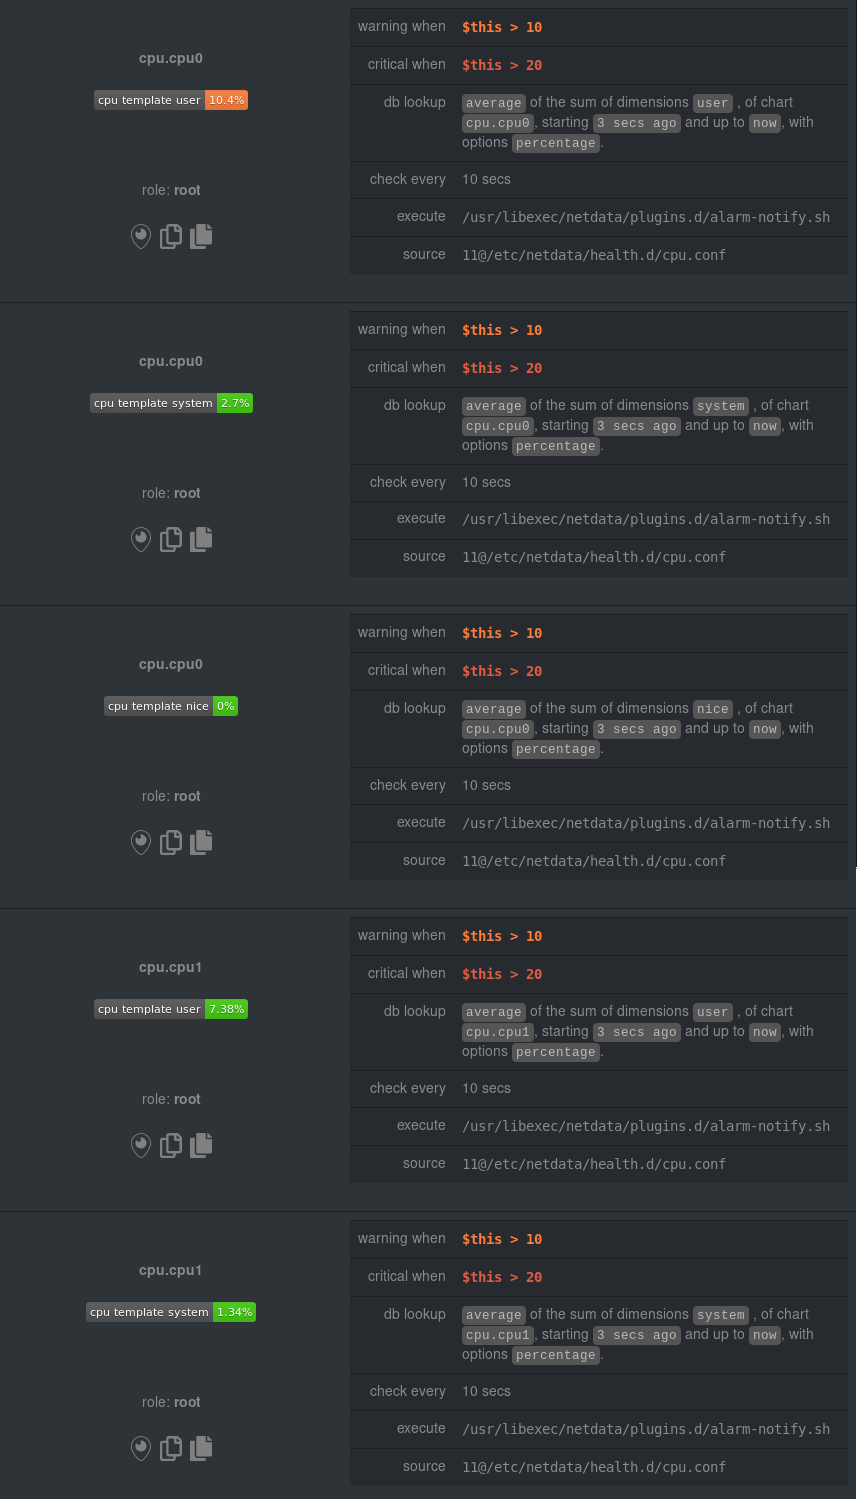 + +All in all, this single entity creates 36 individual alarms. Much easier than writing 36 separate entities in your +health configuration files! + +## What's next? + +We hope you're excited about the possibilities of using dimension templates! Maybe they'll inspire you to build new +alarms that will help you better monitor the health of your systems. + +Or, at the very least, simplify your configuration files. + +For information about other advanced features in Netdata's health monitoring toolkit, check out our [health +documentation](/health/README.md). And if you have some cool alarms you built using dimension templates, + +[](<>) diff --git a/docs/guides/monitor/kubernetes-k8s-netdata.md b/docs/guides/monitor/kubernetes-k8s-netdata.md new file mode 100644 index 000000000..40af0e94e --- /dev/null +++ b/docs/guides/monitor/kubernetes-k8s-netdata.md @@ -0,0 +1,278 @@ +<!-- +title: "Monitor a Kubernetes (k8s) cluster with Netdata" +description: "Use Netdata's helmchart, service discovery plugin, and Kubelet/kube-proxy collectors for real-time visibility into your Kubernetes cluster." +image: /img/seo/guides/monitor/kubernetes-k8s-netdata.png +custom_edit_url: https://github.com/netdata/netdata/edit/master/docs/guides/monitor/kubernetes-k8s-netdata.md +--> + +# Monitor a Kubernetes cluster with Netdata + +While Kubernetes (k8s) might simplify the way you deploy, scale, and load-balance your applications, not all clusters +come with "batteries included" when it comes to monitoring. Doubly so for a monitoring stack that helps you actively +troubleshoot issues with your cluster. + +Some k8s providers, like GKE (Google Kubernetes Engine), do deploy clusters bundled with monitoring capabilities, such +as Google Stackdriver Monitoring. However, these pre-configured solutions might not offer the depth of metrics, +customization, or integration with your preferred alerting methods. + +Without this visibility, it's like you built an entire house and _then_ smashed your way through the finished walls to +add windows. + +At Netdata, we're working to build Kubernetes monitoring tools that add visibility without complexity while also helping +you actively troubleshoot anomalies or outages. Better yet, this toolkit includes a few complementary collectors that +let you monitor the many layers of a Kubernetes cluster entirely for free. + +We already have a few complementary tools and collectors for monitoring the many layers of a Kubernetes cluster, +_entirely for free_. These methods work together to help you troubleshoot performance or availability issues across +your k8s infrastructure. + +- A [Helm chart](https://github.com/netdata/helmchart), which bootstraps a Netdata Agent pod on every node in your + cluster, plus an additional parent pod for storing metrics and managing alarm notifications. +- A [service discovery plugin](https://github.com/netdata/agent-service-discovery), which discovers and creates + configuration files for [compatible + applications](https://github.com/netdata/helmchart#service-discovery-and-supported-services) and any endpoints + covered by our [generic Prometheus + collector](https://learn.netdata.cloud/docs/agent/collectors/go.d.plugin/modules/prometheus). With these + configuration files, Netdata collects metrics from any compatible applications as they run _inside_ of a pod. + Service discovery happens without manual intervention as pods are created, destroyed, or moved between nodes. +- A [Kubelet collector](https://learn.netdata.cloud/docs/agent/collectors/go.d.plugin/modules/k8s_kubelet), which runs + on each node in a k8s cluster to monitor the number of pods/containers, the volume of operations on each container, + and more. +- A [kube-proxy collector](https://learn.netdata.cloud/docs/agent/collectors/go.d.plugin/modules/k8s_kubeproxy), which + also runs on each node and monitors latency and the volume of HTTP requests to the proxy. +- A [cgroups collector](/collectors/cgroups.plugin/README.md), which collects CPU, memory, and bandwidth metrics for + each container running on your k8s cluster. + +By following this guide, you'll learn how to discover, explore, and take away insights from each of these layers in your +Kubernetes cluster. Let's get started. + +## Prerequisites + +To follow this guide, you need: + +- A working cluster running Kubernetes v1.9 or newer. +- The [kubectl](https://kubernetes.io/docs/reference/kubectl/overview/) command line tool, within [one minor version + difference](https://kubernetes.io/docs/tasks/tools/install-kubectl/#before-you-begin) of your cluster, on an + administrative system. +- The [Helm package manager](https://helm.sh/) v3.0.0 or newer on the same administrative system. + +**You need to install the Netdata Helm chart on your cluster** before you proceed. See our [Kubernetes installation +process](/packaging/installer/methods/kubernetes.md) for details. + +This guide uses a 3-node cluster, running on Digital Ocean, as an example. This cluster runs CockroachDB, Redis, and +Apache, which we'll use as examples of how to monitor a Kubernetes cluster with Netdata. + +```bash +kubectl get nodes +NAME STATUS ROLES AGE VERSION +pool-0z7557lfb-3fnbf Ready <none> 51m v1.17.5 +pool-0z7557lfb-3fnbx Ready <none> 51m v1.17.5 +pool-0z7557lfb-3fnby Ready <none> 51m v1.17.5 + +kubectl get pods +NAME READY STATUS RESTARTS AGE +cockroachdb-0 1/1 Running 0 44h +cockroachdb-1 1/1 Running 0 44h +cockroachdb-2 1/1 Running 1 44h +cockroachdb-init-q7mp6 0/1 Completed 0 44h +httpd-6f6cb96d77-4zlc9 1/1 Running 0 2m47s +httpd-6f6cb96d77-d9gs6 1/1 Running 0 2m47s +httpd-6f6cb96d77-xtpwn 1/1 Running 0 11m +netdata-child-5p2m9 2/2 Running 0 42h +netdata-child-92qvf 2/2 Running 0 42h +netdata-child-djc6w 2/2 Running 0 42h +netdata-parent-0 1/1 Running 0 42h +redis-6bb94d4689-6nn6v 1/1 Running 0 73s +redis-6bb94d4689-c2fk2 1/1 Running 0 73s +redis-6bb94d4689-tjcz5 1/1 Running 0 88s +``` + +## Explore Netdata's Kubernetes charts + +The Helm chart installs and enables everything you need for visibility into your k8s cluster, including the service +discovery plugin, Kubelet collector, kube-proxy collector, and cgroups collector. + +To get started, open your browser and navigate to your cluster's Netdata dashboard. See our [Kubernetes installation +instructions](/packaging/installer/methods/kubernetes.md) for how to access the dashboard based on your cluster's +configuration. + +You'll see metrics from the parent pod as soon as you navigate to the dashboard: + +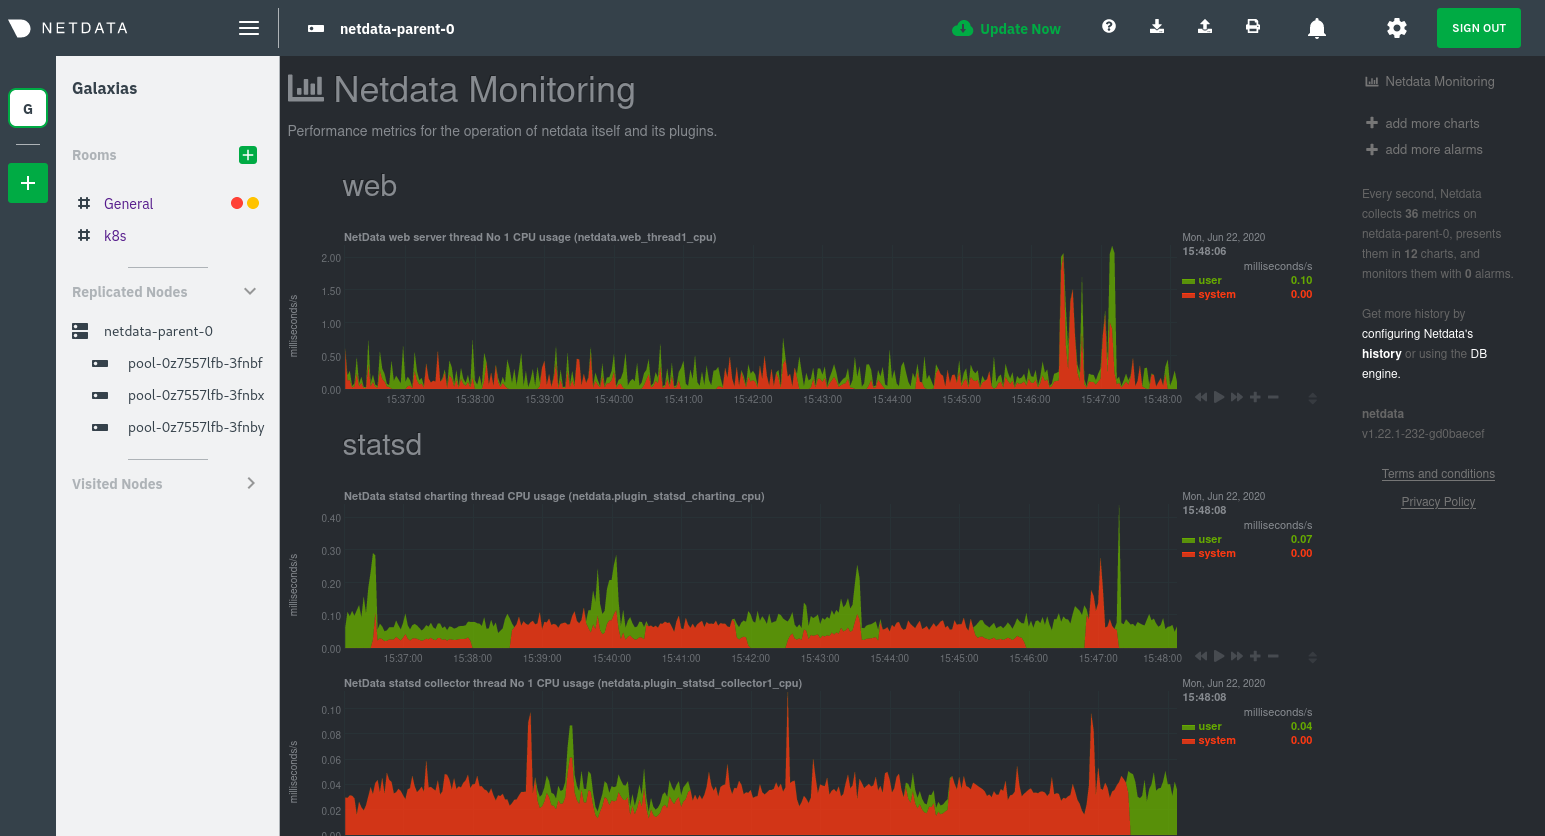 + +Remember that the parent pod is responsible for storing metrics from all the child pods and sending alarms. + +Take note of the **Replicated Nodes** menu, which shows not only the parent pod, but also the three child pods. This +example cluster has three child pods, but the number of child pods depends entirely on the number of nodes in your +cluster. + +You'll use the links in the **Replicated Nodes** menu to navigate between the various pods in your cluster. Let's do +that now to explore the pod-level Kubernetes monitoring Netdata delivers. + +### Pods + +Click on any of the nodes under **netdata-parent-0**. Netdata redirects you to a separate instance of the Netdata +dashboard, run by the Netdata child pod, which visualizes thousands of metrics from that node. + +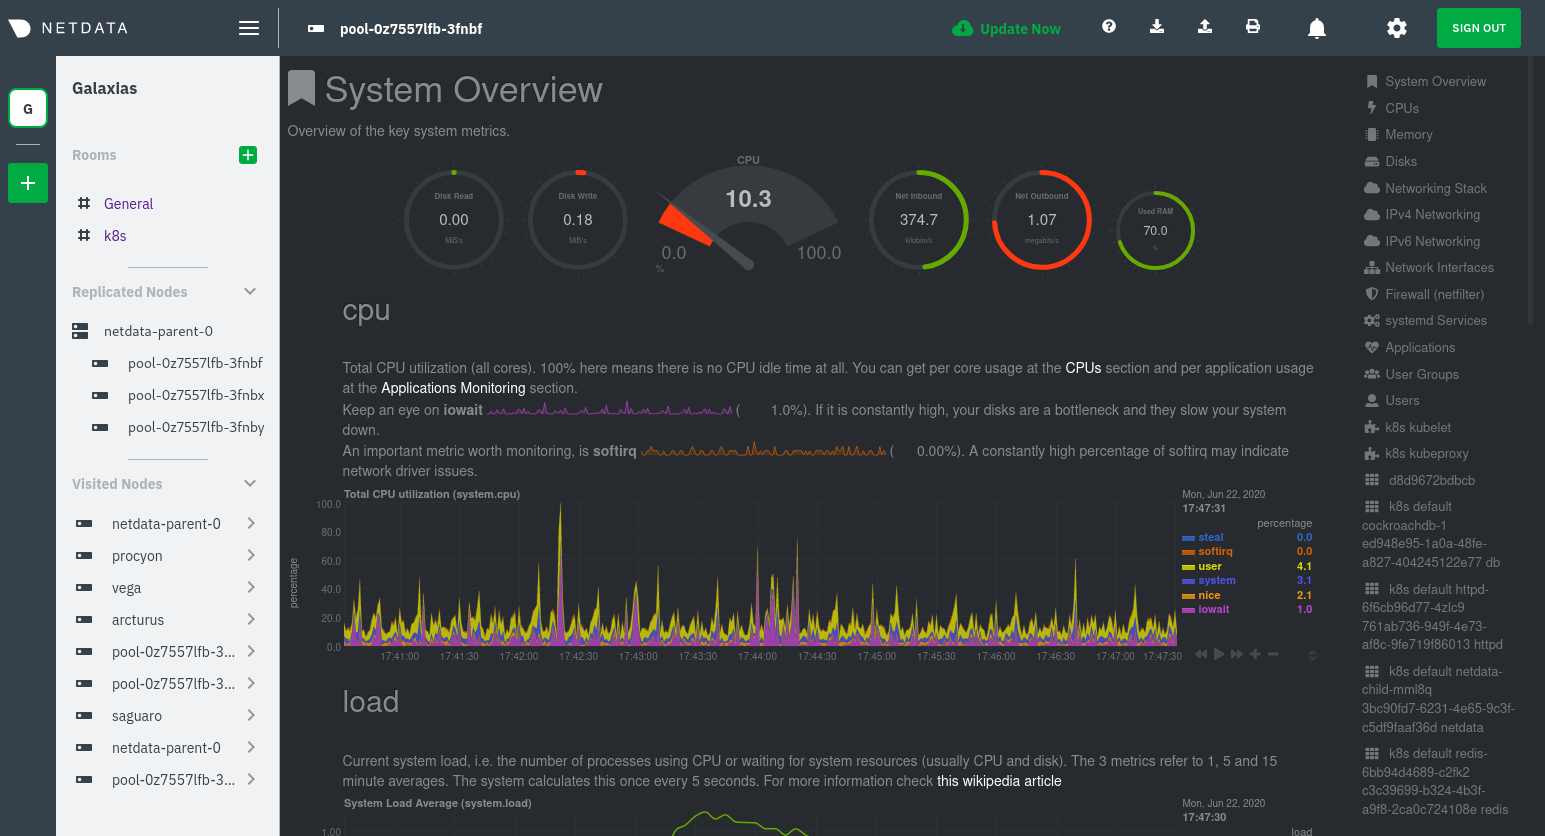 + +From this dashboard, you can see all the familiar charts showing the health and performance of an individual node, just +like you would if you installed Netdata on a single physical system. Explore CPU, memory, bandwidth, networking, and +more. + +You can use the menus on the right-hand side of the dashboard to navigate between different sections of charts and +metrics. + +For example, click on the **Applications** section to view per-application metrics, collected by +[apps.plugin](/collectors/apps.plugin/README.md). The first chart you see is **Apps CPU Time (100% = 1 core) +(apps.cpu)**, which shows the CPU utilization of various applications running on the node. You shouldn't be surprised to +find Netdata processes (`netdata`, `sd-agent`, and more) alongside Kubernetes processes (`kubelet`, `kube-proxy`, and +`containers`). + +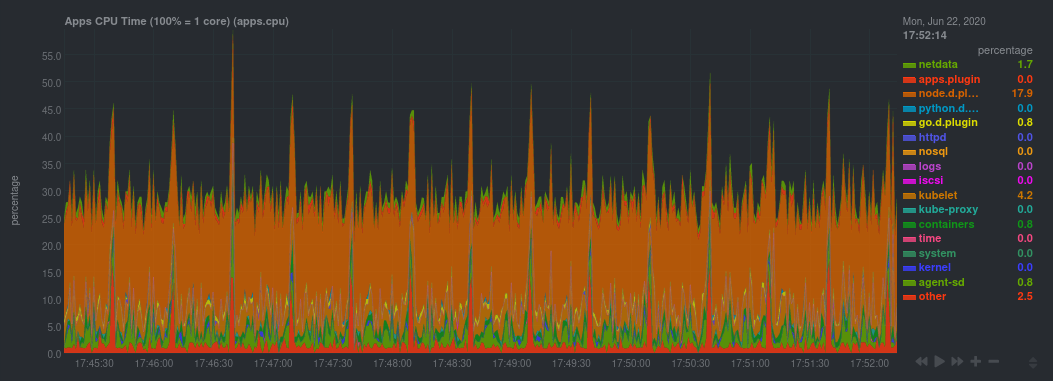 + +Beneath the **Applications** section, you'll begin to see sections for **k8s kubelet**, **k8s kubeproxy**, and long +strings that start with **k8s**, which are sections for metrics collected by +[`cgroups.plugin`](/collectors/cgroups.plugin/README.md). Let's skip over those for now and head further down to see +Netdata's service discovery in action. + +### Service discovery (services running inside of pods) + +Thanks to Netdata's service discovery feature, you monitor containerized applications running in k8s pods with zero +configuration or manual intervention. Service discovery is like a watchdog for created or deleted pods, recognizing the +service they run based on the image name and port and immediately attempting to apply a logical default configuration. + +Service configuration supports [popular +applications](https://github.com/netdata/helmchart#service-discovery-and-supported-services), plus any endpoints covered +by our [generic Prometheus collector](https://learn.netdata.cloud/docs/agent/collectors/go.d.plugin/modules/prometheus), +which are automatically added or removed from Netdata as soon as the pods are created or destroyed. + +You can find these service discovery sections near the bottom of the menu. The names for these sections follow a +pattern: the name of the detected service, followed by a string of the module name, pod TUID, service type, port +protocol, and port number. See the graphic below to help you identify service discovery sections. + + + +For example, the first service discovery section shows metrics for a pod running an Apache web server running on port 80 +in a pod named `httpd-6f6cb96d77-xtpwn`. + +> If you don't see any service discovery sections, it's either because your services are not compatible with service +> discovery or you changed their default configuration, such as the listening port. See the [list of supported +> services](https://github.com/netdata/helmchart#service-discovery-and-supported-services) for details about whether +> your installed services are compatible with service discovery, or read the [configuration +> instructions](/packaging/installer/methods/kubernetes.md#configure-service-discovery) to change how it discovers the +> supported services. + +Click on any of these service discovery sections to see metrics from that particular service. For example, click on the +**Apache apache-default httpd-6f6cb96d77-xtpwn httpd tcp 80** section brings you to a series of charts populated by the +[Apache collector](https://learn.netdata.cloud/docs/agent/collectors/go.d.plugin/modules/apache) itself. + +With service discovery, you can now see valuable metrics like requests, bandwidth, workers, and more for this pod. + + + +The same goes for metrics coming from the CockroachDB pod running on this same node. + + + +Service discovery helps you monitor the health of specific applications running on your Kubernetes cluster, which in +turn gives you a complete resource when troubleshooting your infrastructure's health and performance. + +### Kubelet + +Let's head back up the menu to the **k8s kubelet** section. Kubelet is an agent that runs on every node in a cluster. It +receives a set of PodSpecs from the Kubernetes Control Plane and ensures the pods described there are both running and +healthy. Think of it as a manager for the various pods on that node. + +Monitoring each node's Kubelet can be invaluable when diagnosing issues with your Kubernetes cluster. For example, you +can see when the volume of running containers/pods has dropped. + + + +This drop might signal a fault or crash in a particular Kubernetes service or deployment (see `kubectl get services` or +`kubectl get deployments` for more details). If the number of pods increases, it may be because of something more +benign, like another member of your team scaling up a service with `kubectl scale`. + +You can also view charts for the Kubelet API server, the volume of runtime/Docker operations by type, +configuration-related errors, and the actual vs. desired numbers of volumes, plus a lot more. + +Kubelet metrics are collected and visualized thanks to the [kubelet +collector](https://learn.netdata.cloud/docs/agent/collectors/go.d.plugin/modules/k8s_kubelet), which is enabled with +zero configuration on most Kubernetes clusters with standard configurations. + +### kube-proxy + +Scroll down into the **k8s kubeproxy** section to see metrics about the network proxy that runs on each node in your +Kubernetes cluster. kube-proxy allows for pods to communicate with each other and accept sessions from outside your +cluster. + +With Netdata, you can monitor how often your k8s proxies are syncing proxy rules between nodes. Dramatic changes in +these figures could indicate an anomaly in your cluster that's worthy of further investigation. + +kube-proxy metrics are collected and visualized thanks to the [kube-proxy +collector](https://learn.netdata.cloud/docs/agent/collectors/go.d.plugin/modules/k8s_kubeproxy), which is enabled with +zero configuration on most Kubernetes clusters with standard configurations. + +### Containers + +We can finally talk about the final piece of Kubernetes monitoring: containers. Each Kubernetes pod is a set of one or +more cooperating containers, sharing the same namespace, all of which are resourced and tracked by the cgroups feature +of the Linux kernel. Netdata automatically detects and monitors each running container by interfacing with the cgroups +feature itself. + +You can find these sections beneath **Users**, **k8s kubelet**, and **k8s kubeproxy**. Below, a number of containers +devoted to running services like CockroachDB, Apache, Redis, and more. + + + +Let's look at the section devoted to the container that runs the Apache pod named `httpd-6f6cb96d77-xtpwn`, as described +in the previous part on [service discovery](#service-discovery-services-running-inside-of-pods). + +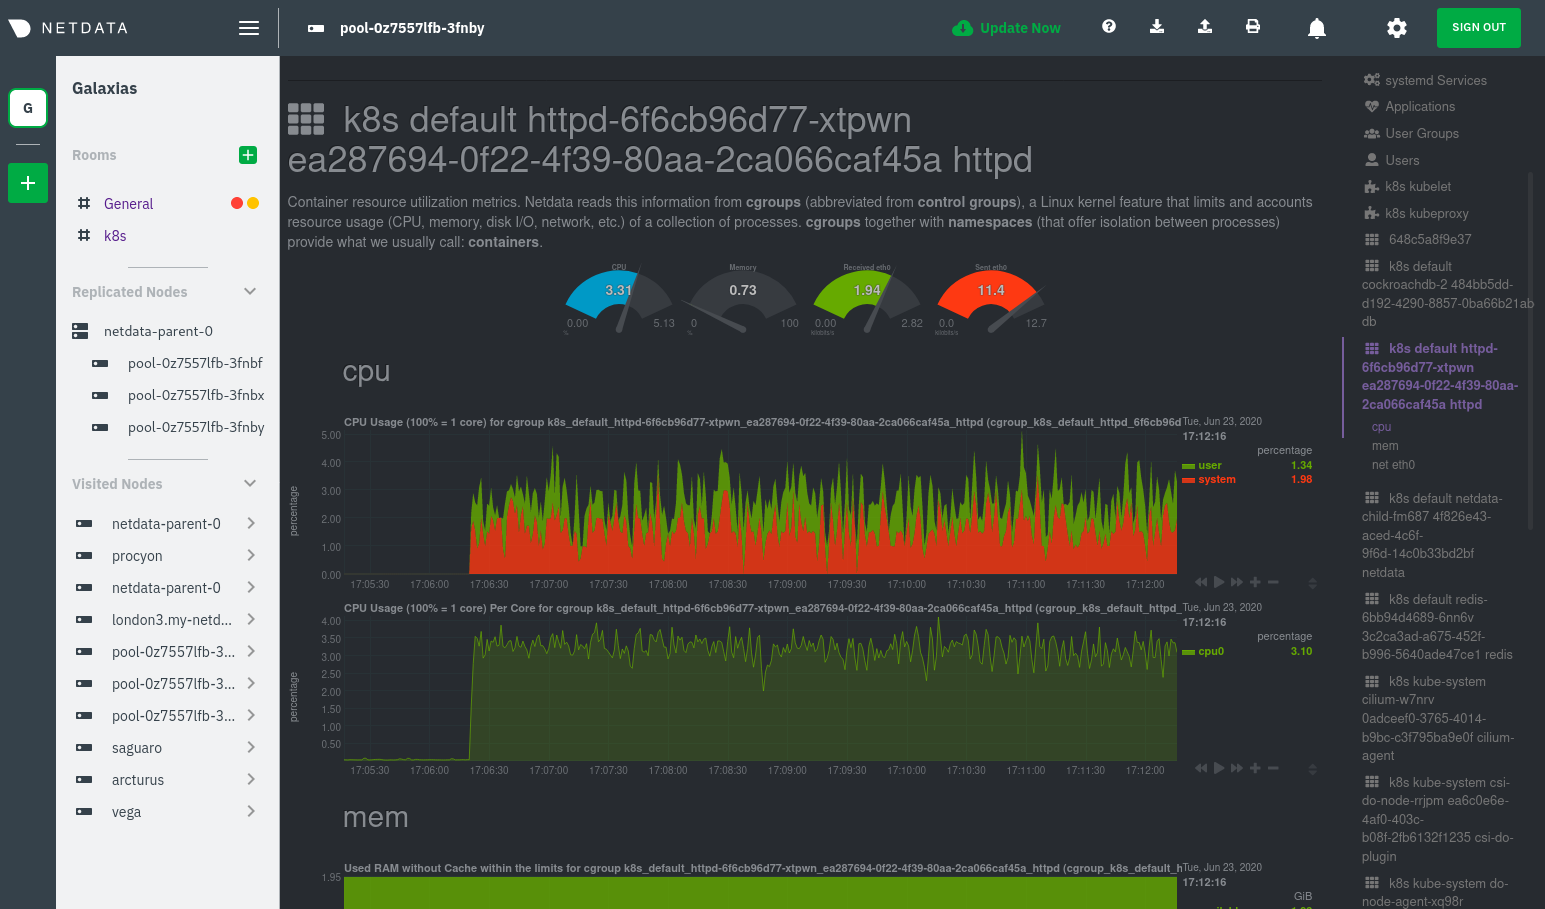 + +At first glance, these sections might seem redundant. You might ask, "Why do I need both a service discovery section +_and_ a container section? It's just one pod, after all!" + +The difference is that while the service discovery section shows _Apache_ metrics, the equivalent cgroups section shows +that container's CPU, memory, and bandwidth usage. You can use the two sections in conjunction to monitor the health and +performance of your pods and the services they run. + +For example, let's say you get an alarm notification from `netdata-parent-0` saying the +`ea287694-0f22-4f39-80aa-2ca066caf45a` container (also known as the `httpd-6f6cb96d77-xtpwn` pod) is using 99% of its +available RAM. You can then hop over to the **Apache apache-default httpd-6f6cb96d77-xtpwn httpd tcp 80** section to +further investigate why Apache is using an unexpected amount of RAM. + +All container metrics, whether they're managed by Kubernetes or the Docker service directly, are collected by the +[cgroups collector](/collectors/cgroups.plugin/README.md). Because this collector integrates with the cgroups Linux +kernel feature itself, monitoring containers requires zero configuration on most Kubernetes clusters. + +## What's next? + +After following this guide, you should have a more comprehensive understanding of how to monitor your Kubernetes cluster +with Netdata. With this setup, you can monitor the health and performance of all your nodes, pods, services, and k8s +agents. Pre-configured alarms will tell you when something goes awry, and this setup gives you every per-second metric +you need to make informed decisions about your cluster. + +The best part of monitoring a Kubernetes cluster with Netdata is that you don't have to worry about constantly running +complex `kubectl` commands to see hundreds of highly granular metrics from your nodes. And forget about using `kubectl +exec -it pod bash` to start up a shell on a pod to find and diagnose an issue with any given pod on your cluster. + +And with service discovery, all your compatible pods will automatically appear and disappear as they scale up, move, or +scale down across your cluster. + +To monitor your Kubernetes cluster with Netdata, start by [installing the Helm +chart](/packaging/installer/methods/kubernetes.md) if you haven't already. The Netdata Agent is open source and entirely +free for every cluster and every organization, whether you have 10 or 10,000 pods. A few minutes and one `helm install` +later and you'll have started on the path of building an effective platform for troubleshooting the next performance or +availability issue on your Kubernetes cluster. + +[](<>) diff --git a/docs/guides/monitor/pi-hole-raspberry-pi.md b/docs/guides/monitor/pi-hole-raspberry-pi.md new file mode 100644 index 000000000..a180466fb --- /dev/null +++ b/docs/guides/monitor/pi-hole-raspberry-pi.md @@ -0,0 +1,163 @@ +<!-- +title: "Monitor Pi-hole (and a Raspberry Pi) with Netdata" +description: "Monitor Pi-hole metrics, plus Raspberry Pi system metrics, in minutes and completely for free with Netdata's open-source monitoring agent." +image: /img/seo/guides/monitor/netdata-pi-hole-raspberry-pi.png +custom_edit_url: https://github.com/netdata/netdata/edit/master/docs/guides/monitor/pi-hole-raspberry-pi.md +--> + +# Monitor Pi-hole (and a Raspberry Pi) with Netdata + +Between intrusive ads, invasive trackers, and vicious malware, many techies and homelab enthusiasts are advancing their +networks' security and speed with a tiny computer and a powerful piece of software: [Pi-hole](https://pi-hole.net/). + +Pi-hole is a DNS sinkhole that prevents unwanted content from even reaching devices on your home network. It blocks ads +and malware at the network, instead of using extensions/add-ons for individual browsers, so you'll stop seeing ads in +some of the most intrusive places, like your smart TV. Pi-hole can even [improve your network's speed and reduce +bandwidth](https://discourse.pi-hole.net/t/will-pi-hole-slow-down-my-network/2048). + +Most Pi-hole users run it on a [Raspberry Pi](https://www.raspberrypi.org/products/raspberry-pi-4-model-b/) (hence the +name), a credit card-sized, super-capable computer that costs about $35. + +And to keep tabs on how both Pi-hole and the Raspberry Pi are working to protect your network, you can use the +open-source [Netdata monitoring agent](https://github.com/netdata/netdata). + +To get started, all you need is a [Raspberry Pi](https://www.raspberrypi.org/products/raspberry-pi-4-model-b/) with +Raspbian installed. This guide uses a Raspberry Pi 4 Model B and Raspbian GNU/Linux 10 (buster). This guide assumes +you're connecting to a Raspberry Pi remotely over SSH, but you could also complete all these steps on the system +directly using a keyboard, mouse, and monitor. + +## Why monitor Pi-hole and a Raspberry Pi with Netdata? + +Netdata helps you monitor and troubleshoot all kinds of devices and the applications they run, including IoT devices +like the Raspberry Pi and applications like Pi-hole. + +After a two-minute installation and with zero configuration, you'll be able to see all of Pi-hole's metrics, including +the volume of queries, connected clients, DNS queries per type, top clients, top blocked domains, and more. + +With Netdata installed, you can also monitor system metrics and any other applications you might be running. By default, +Netdata collects metrics on CPU usage, disk IO, bandwidth, per-application resource usage, and a ton more. With the +Raspberry Pi used for this guide, Netdata automatically collects about 1,500 metrics every second! + + + +## Install Netdata + +Let's start by installing Netdata first so that it can start collecting system metrics as soon as possible for the most +possible historic data. + +> ⚠️ Don't install Netdata using `apt` and the default package available in Raspbian. The Netdata team does not maintain +> this package, and can't guarantee it works properly. + +On Raspberry Pis running Raspbian, the best way to install Netdata is our one-line kickstart script. This script asks +you to install dependencies, then compiles Netdata from source via [GitHub](https://github.com/netdata/netdata). + +```bash +bash <(curl -Ss https://my-netdata.io/kickstart.sh) +``` + +Once installed on a Raspberry Pi 4 with no accessories, Netdata starts collecting roughly 1,500 metrics every second and +populates its dashboard with more than 250 charts. + +Open your browser of choice and navigate to `http://NODE:19999/`, replacing `NODE` with the IP address of your Raspberry +Pi. Not sure what that IP is? Try running `hostname -I | awk '{print $1}'` from the Pi itself. + +You'll see Netdata's dashboard and a few hundred real-time, +[interactive](https://learn.netdata.cloud/guides/step-by-step/step-02#interact-with-charts) charts. Feel free to +explore, but let's turn our attention to installing Pi-hole. + +## Install Pi-Hole + +Like Netdata, Pi-hole has a one-line script for simple installation. From your Raspberry Pi, run the following: + +```bash +curl -sSL https://install.pi-hole.net | bash +``` + +The installer will help you set up Pi-hole based on the topology of your network. Once finished, you should set up your +devices—or your router for system-wide sinkhole protection—to [use Pi-hole as their DNS +service](https://discourse.pi-hole.net/t/how-do-i-configure-my-devices-to-use-pi-hole-as-their-dns-server/245). You've +finished setting up Pi-hole at this point. + +As far as configuring Netdata to monitor Pi-hole metrics, there's nothing you actually need to do. Netdata's [Pi-hole +collector](https://learn.netdata.cloud/docs/agent/collectors/go.d.plugin/modules/pihole) will autodetect the new service +running on your Raspberry Pi and immediately start collecting metrics every second. + +Restart Netdata with `sudo service netdata restart` to start Netdata, which will then recognize that Pi-hole is running +and start a per-second collection job. When you refresh your Netdata dashboard or load it up again in a new tab, you'll +see a new entry in the menu for **Pi-hole** metrics. + +## Use Netdata to explore and monitor your Raspberry Pi and Pi-hole + +By the time you've reached this point in the guide, Netdata has already collected a ton of valuable data about your +Raspberry Pi, Pi-hole, and any other apps/services you might be running. Even a few minutes of collecting 1,500 metrics +per second adds up quickly. + +You can now use Netdata's synchronized charts to zoom, highlight, scrub through time, and discern how an anomaly in one +part of your system might affect another. + + + +If you're completely new to Netdata, look at our [step-by-step guide](/docs/guides/step-by-step/step-00.md) for a +walkthrough of all its features. For a more expedited tour, see the [get started guide](/docs/getting-started.md). + +### Enable temperature sensor monitoring + +You need to manually enable Netdata's built-in [temperature sensor +collector](https://learn.netdata.cloud/docs/agent/collectors/charts.d.plugin/sensors) to start collecting metrics. + +> Netdata uses a few plugins to manage its [collectors](/collectors/REFERENCE.md), each using a different language: Go, +> Python, Node.js, and Bash. While our Go collectors are undergoing the most active development, we still support the +> other languages. In this case, you need to enable a temperature sensor collector that's written in Bash. + +First, open the `charts.d.conf` file for editing. You should always use the `edit-config` script to edit Netdata's +configuration files, as it ensures your settings persist across updates to the Netdata Agent. + +```bash +cd /etc/netdata +sudo ./edit-config charts.d.conf +``` + +Uncomment the `sensors=force` line and save the file. Restart Netdata with `sudo service netdata restart` to enable +Raspberry Pi temperature sensor monitoring. + +### Storing historical metrics on your Raspberry Pi + +By default, Netdata allocates 256 MiB in disk space to store historical metrics inside the [database +engine](/database/engine/README.md). On the Raspberry Pi used for this guide, Netdata collects 1,500 metrics every +second, which equates to storing 3.5 days worth of historical metrics. + +You can increase this allocation by editing `netdata.conf` and increasing the `dbengine multihost disk space` setting to +more than 256. + +```yaml +[global] + dbengine multihost disk space = 512 +``` + +Use our [database sizing +calculator](/docs/store/change-metrics-storage.md#calculate-the-system-resources-RAM-disk-space-needed-to-store-metrics) +and [guide on storing historical metrics](/docs/guides/longer-metrics-storage.md) to help you determine the right +setting for your Raspberry Pi. + +## What's next? + +Now that you're monitoring Pi-hole and your Raspberry Pi with Netdata, you can extend its capabilities even further, or +configure Netdata to more specific goals. + +Most importantly, you can always install additional services and instantly collect metrics from many of them with our +[300+ integrations](/collectors/COLLECTORS.md). + +- [Optimize performance](/docs/guides/configure/performance.md) using tweaks developed for IoT devices. +- [Stream Raspberry Pi metrics](/streaming/README.md) to a parent host for easy access or longer-term storage. +- [Tweak alarms](/health/QUICKSTART.md) for either Pi-hole or the health of your Raspberry Pi. +- [Export metrics to external databases](/exporting/README.md) with the exporting engine. + +Or, head over to [our guides](https://learn.netdata.cloud/guides/) for even more experiments and insights into +troubleshooting the health of your systems and services. + +If you have any questions about using Netdata to monitor your Raspberry Pi, Pi-hole, or any other applications, head on +over to our [community forum](https://community.netdata.cloud/). + +[](<>) diff --git a/docs/guides/monitor/process.md b/docs/guides/monitor/process.md new file mode 100644 index 000000000..893e6b704 --- /dev/null +++ b/docs/guides/monitor/process.md @@ -0,0 +1,299 @@ +<!-- +title: Monitor any process in real-time with Netdata +description: "Tap into Netdata's powerful collectors, with per-second utilization metrics for every process, to troubleshoot faster and make data-informed decisions." +image: /img/seo/guides/monitor/process.png +custom_edit_url: https://github.com/netdata/netdata/edit/master/docs/guides/monitor/process.md +--> + +# Monitor any process in real-time with Netdata + +Netdata is more than a multitude of generic system-level metrics and visualizations. Instead of providing only a bird's +eye view of your system, leaving you to wonder exactly _what_ is taking up 99% CPU, Netdata also gives you visibility +into _every layer_ of your node. These additional layers give you context, and meaningful insights, into the true health +and performance of your infrastructure. + +One of these layers is the _process_. Every time a Linux system runs a program, it creates an independent process that +executes the program's instructions in parallel with anything else happening on the system. Linux systems track the +state and resource utilization of processes using the [`/proc` filesystem](https://en.wikipedia.org/wiki/Procfs), and +Netdata is designed to hook into those metrics to create meaningful visualizations out of the box. + +While there are a lot of existing command-line tools for tracking processes on Linux systems, such as `ps` or `top`, +only Netdata provides dozens of real-time charts, at both per-second and event frequency, without you having to write +SQL queries or know a bunch of arbitrary command-line flags. + +With Netdata's process monitoring, you can: + +- Benchmark/optimize performance of standard applications, like web servers or databases +- Benchmark/optimize performance of custom applications +- Troubleshoot CPU/memory/disk utilization issues (why is my system's CPU spiking right now?) +- Perform granular capacity planning based on the specific needs of your infrastructure +- Search for leaking file descriptors +- Investigate zombie processes + +... and much more. Let's get started. + +## Prerequisites + +- One or more Linux nodes running the [Netdata Agent](/docs/get/README.md). If you need more time to understand + Netdata before following this guide, see the [infrastructure](/docs/quickstart/infrastructure.md) or + [single-node](/docs/quickstart/single-node.md) monitoring quickstarts. +- A general understanding of how to [configure the Netdata Agent](/docs/configure/nodes.md) using `edit-config`. +- A Netdata Cloud account. [Sign up](https://app.netdata.cloud) if you don't have one already. + +## How does Netdata do process monitoring? + +The Netdata Agent already knows to look for hundreds of [standard applications that we support via +collectors](/collectors/COLLECTORS.md), and groups them based on their purpose. Let's say you want to monitor a MySQL +database using its process. The Netdata Agent already knows to look for processes with the string `mysqld` in their +name, along with a few others, and puts them into the `sql` group. This `sql` group then becomes a dimension in all +process-specific charts. + +The process and groups settings are used by two unique and powerful collectors. + +[**`apps.plugin`**](/collectors/apps.plugin/README.md) looks at the Linux process tree every second, much like `top` or +`ps fax`, and collects resource utilization information on every running process. It then automatically adds a layer of +meaningful visualization on top of these metrics, and creates per-process/application charts. + +[**`ebpf.plugin`**](/collectors/ebpf.plugin/README.md): Netdata's extended Berkeley Packet Filter (eBPF) collector +monitors Linux kernel-level metrics for file descriptors, virtual filesystem IO, and process management, and then hands +process-specific metrics over to `apps.plugin` for visualization. The eBPF collector also collects and visualizes +metrics on an _event frequency_, which means it captures every kernel interaction, and not just the volume of +interaction at every second in time. That's even more precise than Netdata's standard per-second granularity. + +### Per-process metrics and charts in Netdata + +With these collectors working in parallel, Netdata visualizes the following per-second metrics for _any_ process on your +Linux systems: + +- CPU utilization (`apps.cpu`) + - Total CPU usage + - User/system CPU usage (`apps.cpu_user`/`apps.cpu_system`) +- Disk I/O + - Physical reads/writes (`apps.preads`/`apps.pwrites`) + - Logical reads/writes (`apps.lreads`/`apps.lwrites`) + - Open unique files (if a file is found open multiple times, it is counted just once, `apps.files`) +- Memory + - Real Memory Used (non-shared, `apps.mem`) + - Virtual Memory Allocated (`apps.vmem`) + - Minor page faults (i.e. memory activity, `apps.minor_faults`) +- Processes + - Threads running (`apps.threads`) + - Processes running (`apps.processes`) + - Carried over uptime (since the last Netdata Agent restart, `apps.uptime`) + - Minimum uptime (`apps.uptime_min`) + - Average uptime (`apps.uptime_average`) + - Maximum uptime (`apps.uptime_max`) + - Pipes open (`apps.pipes`) +- Swap memory + - Swap memory used (`apps.swap`) + - Major page faults (i.e. swap activity, `apps.major_faults`) +- Network + - Sockets open (`apps.sockets`) +- eBPF file + - Number of calls to open files. (`apps.file_open`) + - Number of files closed. (`apps.file_closed`) + - Number of calls to open files that returned errors. + - Number of calls to close files that returned errors. +- eBPF syscall + - Number of calls to delete files. (`apps.file_deleted`) + - Number of calls to `vfs_write`. (`apps.vfs_write_call`) + - Number of calls to `vfs_read`. (`apps.vfs_read_call`) + - Number of bytes written with `vfs_write`. (`apps.vfs_write_bytes`) + - Number of bytes read with `vfs_read`. (`apps.vfs_read_bytes`) + - Number of calls to write a file that returned errors. + - Number of calls to read a file that returned errors. +- eBPF process + - Number of process created with `do_fork`. (`apps.process_create`) + - Number of threads created with `do_fork` or `__x86_64_sys_clone`, depending on your system's kernel version. (`apps.thread_create`) + - Number of times that a process called `do_exit`. (`apps.task_close`) +- eBPF net + - Number of bytes sent. (`apps.bandwidth_sent`) + - Number of bytes received. (`apps.bandwidth_recv`) + +As an example, here's the per-process CPU utilization chart, including a `sql` group/dimension. + + + +## Configure the Netdata Agent to recognize a specific process + +To monitor any process, you need to make sure the Netdata Agent is aware of it. As mentioned above, the Agent is already +aware of hundreds of processes, and collects metrics from them automatically. + +But, if you want to change the grouping behavior, add an application that isn't yet supported in the Netdata Agent, or +monitor a custom application, you need to edit the `apps_groups.conf` configuration file. + +Navigate to your [Netdata config directory](/docs/configure/nodes.md) and use `edit-config` to edit the file. + +```bash +cd /etc/netdata # Replace this with your Netdata config directory if not at /etc/netdata. +sudo ./edit-config apps_groups.conf +``` + +Inside the file are lists of process names, oftentimes using wildcards (`*`), that the Netdata Agent looks for and +groups together. For example, the Netdata Agent looks for processes starting with `mysqld`, `mariad`, `postgres`, and +others, and groups them into `sql`. That makes sense, since all these processes are for SQL databases. + +```conf +sql: mysqld* mariad* postgres* postmaster* oracle_* ora_* sqlservr +``` + +These groups are then reflected as [dimensions](/web/README.md#dimensions) within Netdata's charts. + + + +See the following two sections for details based on your needs. If you don't need to configure `apps_groups.conf`, jump +down to [visualizing process metrics](#visualize-process-metrics). + +### Standard applications (web servers, databases, containers, and more) + +As explained above, the Netdata Agent is already aware of most standard applications you run on Linux nodes, and you +shouldn't need to configure it to discover them. + +However, if you're using multiple applications that the Netdata Agent groups together you may want to separate them for +more precise monitoring. If you're not running any other types of SQL databases on that node, you don't need to change +the grouping, since you know that any MySQL is the only process contributing to the `sql` group. + +Let's say you're using both MySQL and PostgreSQL databases on a single node, and want to monitor their processes +independently. Open the `apps_groups.conf` file as explained in the [section +above](#configure-the-netdata-agent-to-recognize-a-specific-process) and scroll down until you find the `database +servers` section. Create new groups for MySQL and PostgreSQL, and move their process queries into the unique groups. + +```conf +# ----------------------------------------------------------------------------- +# database servers + +mysql: mysqld* +postgres: postgres* +sql: mariad* postmaster* oracle_* ora_* sqlservr +``` + +Restart Netdata with `service netdata restart`, or the appropriate method for your system, to start collecting +utilization metrics from your application. Time to [visualize your process metrics](#visualize-process-metrics). + +### Custom applications + +Let's assume you have an application that runs on the process `custom-app`. To monitor eBPF metrics for that application +separate from any others, you need to create a new group in `apps_groups.conf` and associate that process name with it. + +Open the `apps_groups.conf` file as explained in the [section +above](#configure-the-netdata-agent-to-recognize-a-specific-process). Scroll down to `# NETDATA processes accounting`. +Above that, paste in the following text, which creates a new `custom-app` group with the `custom-app` process. Replace +`custom-app` with the name of your application's Linux process. `apps_groups.conf` should now look like this: + +```conf +... +# ----------------------------------------------------------------------------- +# Custom applications to monitor with apps.plugin and ebpf.plugin + +custom-app: custom-app + +# ----------------------------------------------------------------------------- +# NETDATA processes accounting +... +``` + +Restart Netdata with `service netdata restart`, or the appropriate method for your system, to start collecting +utilization metrics from your application. + +## Visualize process metrics + +Now that you're collecting metrics for your process, you'll want to visualize them using Netdata's real-time, +interactive charts. Find these visualizations in the same section regardless of whether you use [Netdata +Cloud](https://app.netdata.cloud) for infrastructure monitoring, or single-node monitoring with the local Agent's +dashboard at `http://localhost:19999`. + +If you need a refresher on all the available per-process charts, see the [above +list](#per-process-metrics-and-charts-in-netdata). + +### Using Netdata's application collector (`apps.plugin`) + +`apps.plugin` puts all of its charts under the **Applications** section of any Netdata dashboard. + + + +Let's continue with the MySQL example. We can create a [test +database](https://www.digitalocean.com/community/tutorials/how-to-measure-mysql-query-performance-with-mysqlslap) in +MySQL to generate load on the `mysql` process. + +`apps.plugin` immediately collects and visualizes this activity `apps.cpu` chart, which shows an increase in CPU +utilization from the `sql` group. There is a parallel increase in `apps.pwrites`, which visualizes writes to disk. + + + + + +Next, the `mysqlslap` utility queries the database to provide some benchmarking load on the MySQL database. It won't +look exactly like a production database executing lots of user queries, but it gives you an idea into the possibility of +these visualizations. + +```bash +sudo mysqlslap --user=sysadmin --password --host=localhost --concurrency=50 --iterations=10 --create-schema=employees --query="SELECT * FROM dept_emp;" --verbose +``` + +The following per-process disk utilization charts show spikes under the `sql` group at the same time `mysqlslap` was run +numerous times, with slightly different concurrency and query options. + + + +> 💡 Click on any dimension below a chart in Netdata Cloud (or to the right of a chart on a local Agent dashboard), to +> visualize only that dimension. This can be particularly useful in process monitoring to separate one process' +> utilization from the rest of the system. + +### Using Netdata's eBPF collector (`ebpf.plugin`) + +Netdata's eBPF collector puts its charts in two places. Of most importance to process monitoring are the **ebpf file**, +**ebpf syscall**, **ebpf process**, and **ebpf net** sub-sections under **Applications**, shown in the above screenshot. + +For example, running the above workload shows the entire "story" how MySQL interacts with the Linux kernel to open +processes/threads to handle a large number of SQL queries, then subsequently close the tasks as each query returns the +relevant data. + + + +`ebpf.plugin` visualizes additional eBPF metrics, which are system-wide and not per-process, under the **eBPF** section. + +## What's next? + +Now that you have `apps_groups.conf` configured correctly, and know where to find per-process visualizations throughout +Netdata's ecosystem, you can precisely monitor the health and performance of any process on your node using per-second +metrics. + +For even more in-depth troubleshooting, see our guide on [monitoring and debugging applications with +eBPF](/docs/guides/troubleshoot/monitor-debug-applications-ebpf.md). + +If the process you're monitoring also has a [supported collector](/collectors/COLLECTORS.md), now is a great time to set +that up if it wasn't autodetected. With both process utilization and application-specific metrics, you should have every +piece of data needed to discover the root cause of an incident. See our [collector +setup](/docs/collect/enable-configure.md) doc for details. + +[Create new dashboards](/docs/visualize/create-dashboards.md) in Netdata Cloud using charts from `apps.plugin`, +`ebpf.plugin`, and application-specific collectors to build targeted dashboards for monitoring key processes across your +infrastructure. + +Try running [Metric Correlations](https://learn.netdata.cloud/docs/cloud/insights/metric-correlations) on a node that's +running the process(es) you're monitoring. Even if nothing is going wrong at the moment, Netdata Cloud's embedded +intelligence helps you better understand how a MySQL database, for example, might influence a system's volume of memory +page faults. And when an incident is afoot, use Metric Correlations to reduce mean time to resolution (MTTR) and +cognitive load. + +If you want more specific metrics from your custom application, check out Netdata's [statsd +support](/collectors/statsd.plugin/README.md). With statd, you can send detailed metrics from your application to +Netdata and visualize them with per-second granularity. Netdata's statsd collector works with dozens of [statsd server +implementations](https://github.com/etsy/statsd/wiki#client-implementations), which work with most application +frameworks. + +### Related reference documentation + +- [Netdata Agent · `apps.plugin`](/collectors/apps.plugin/README.md) +- [Netdata Agent · `ebpf.plugin`](/collectors/ebpf.plugin/README.md) +- [Netdata Agent · Dashboards](/web/README.md#dimensions) +- [Netdata Agent · MySQL collector](https://learn.netdata.cloud/docs/agent/collectors/go.d.plugin/modules/mysql) + +[](<>) diff --git a/docs/guides/monitor/stop-notifications-alarms.md b/docs/guides/monitor/stop-notifications-alarms.md new file mode 100644 index 000000000..587880ab1 --- /dev/null +++ b/docs/guides/monitor/stop-notifications-alarms.md @@ -0,0 +1,92 @@ +<!-- +title: "Stop notifications for individual alarms" +custom_edit_url: https://github.com/netdata/netdata/edit/master/docs/guides/monitor/stop-notifications-alarms.md +--> + +# Stop notifications for individual alarms + +In this short tutorial, you'll learn how to stop notifications for individual alarms in Netdata's health +monitoring system. We also refer to this process as _silencing_ the alarm. + +Why silence alarms? We designed Netdata's pre-configured alarms for production systems, so they might not be +relevant if you run Netdata on your laptop or a small virtual server. If they're not helpful, they can be a distraction +to real issues with health and performance. + +Silencing individual alarms is an excellent solution for situations where you're not interested in seeing a specific +alarm but don't want to disable a [notification system](/health/notifications/README.md) entirely. + +## Find the alarm configuration file + +To silence an alarm, you need to know where to find its configuration file. + +Let's use the `system.cpu` chart as an example. It's the first chart you'll see on most Netdata dashboards. + +To figure out which file you need to edit, open up Netdata's dashboard and, click the **Alarms** button at the top +of the dashboard, followed by clicking on the **All** tab. + +In this example, we're looking for the `system - cpu` entity, which, when opened, looks like this: + + + +In the `source` row, you see that this chart is getting its configuration from +`4@/usr/lib/netdata/conf.d/health.d/cpu.conf`. The relevant part of begins at `health.d`: `health.d/cpu.conf`. That's +the file you need to edit if you want to silence this alarm. + +For more information about editing or referencing health configuration files on your system, see the [health +quickstart](/health/QUICKSTART.md#edit-health-configuration-files). + +## Edit the file to enable silencing + +To edit `health.d/cpu.conf`, use `edit-config` from inside of your Netdata configuration directory. + +```bash +cd /etc/netdata/ # Replace with your Netdata configuration directory, if not /etc/netdata/ +./edit-config health.d/cpu.conf +``` + +> You may need to use `sudo` or another method of elevating your privileges. + +The beginning of the file looks like this: + +```yaml +template: 10min_cpu_usage + on: system.cpu + os: linux + hosts: * + lookup: average -10m unaligned of user,system,softirq,irq,guest + units: % + every: 1m + warn: $this > (($status >= $WARNING) ? (75) : (85)) + crit: $this > (($status == $CRITICAL) ? (85) : (95)) + delay: down 15m multiplier 1.5 max 1h + info: average cpu utilization for the last 10 minutes (excluding iowait, nice and steal) + to: sysadmin +``` + +To silence this alarm, change `sysadmin` to `silent`. + +```yaml + to: silent +``` + +Use one of the available [methods](/health/QUICKSTART.md#reload-health-configuration) to reload your health configuration + and ensure you get no more notifications about that alarm**. + +You can add `to: silent` to any alarm you'd rather not bother you with notifications. + +## What's next? + +You should now know the fundamentals behind silencing any individual alarm in Netdata. + +To learn about _all_ of Netdata's health configuration possibilities, visit the [health reference +guide](/health/REFERENCE.md), or check out other [tutorials on health monitoring](/health/README.md#tutorials). + +Or, take better control over how you get notified about alarms via the [notification +system](/health/notifications/README.md). + +You can also use Netdata's [Health Management API](/web/api/health/README.md#health-management-api) to control health +checks and notifications while Netdata runs. With this API, you can disable health checks during a maintenance window or +backup process, for example. + +[](<>) diff --git a/docs/guides/monitor/visualize-monitor-anomalies.md b/docs/guides/monitor/visualize-monitor-anomalies.md new file mode 100644 index 000000000..f37dadc62 --- /dev/null +++ b/docs/guides/monitor/visualize-monitor-anomalies.md @@ -0,0 +1,147 @@ +<!-- +title: "Monitor and visualize anomalies with Netdata (part 2)" +description: "Using unsupervised anomaly detection and machine learning, get notified " +image: /img/seo/guides/monitor/visualize-monitor-anomalies.png +author: "Joel Hans" +author_title: "Editorial Director, Technical & Educational Resources" +author_img: "/img/authors/joel-hans.jpg" +custom_edit_url: https://github.com/netdata/netdata/edit/master/docs/guides/monitor/visualize-monitor-anomalies.md +--> + +# Monitor and visualize anomalies with Netdata (part 2) + +Welcome to part 2 of our series of guides on using _unsupervised anomaly detection_ to detect issues with your systems, +containers, and applications using the open-source Netdata Agent. For an introduction to detecting anomalies and +monitoring associated metrics, see [part 1](/docs/guides/monitor/anomaly-detection.md), which covers prerequisites and +configuration basics. + +With anomaly detection in the Netdata Agent set up, you will now want to visualize and monitor which charts have +anomalous data, when, and where to look next. + +> 💡 In certain cases, the anomalies collector doesn't start immediately after restarting the Netdata Agent. If this +> happens, you won't see the dashboard section or the relevant [charts](#visualize-anomalies-in-charts) right away. Wait +> a minute or two, refresh, and look again. If the anomalies charts and alarms are still not present, investigate the +> error log with `less /var/log/netdata/error.log | grep anomalies`. + +## Test anomaly detection + +Time to see the Netdata Agent's unsupervised anomaly detection in action. To trigger anomalies on the Nginx web server, +use `ab`, otherwise known as [Apache Bench](https://httpd.apache.org/docs/2.4/programs/ab.html). Despite its name, it +works just as well with Nginx web servers. Install it on Ubuntu/Debian systems with `sudo apt install apache2-utils`. + +> 💡 If you haven't followed the guide's example of using Nginx, an easy way to test anomaly detection on your node is +> to use the `stress-ng` command, which is available on most Linux distributions. Run `stress-ng --cpu 0` to create CPU +> stress or `stress-ng --vm 0` for RAM stress. Each test will cause some "collateral damage," in that you may see CPU +> utilization rise when running the RAM test, and vice versa. + +The following test creates a minimum of 10,000,000 requests for Nginx to handle, with a maximum of 10 at any given time, +with a run time of 60 seconds. If your system can handle those 10,000,000 in less than 60 seconds, `ab` will keep +sending requests until the timer runs out. + +```bash +ab -k -c 10 -t 60 -n 10000000 http://127.0.0.1/ +``` + +Let's see how Netdata detects this anomalous behavior and propagates information to you through preconfigured alarms and +dashboards that automatically organize anomaly detection metrics into meaningful charts to help you begin root cause +analysis (RCA). + +## Monitor anomalies with alarms + +The anomalies collector creates two "classes" of alarms for each chart captured by the `charts_regex` setting. All these +alarms are preconfigured based on your [configuration in +`anomalies.conf`](/docs/guides/monitor/anomaly-detection.md#configure-the-anomalies-collector). With the `charts_regex` +and `charts_to_exclude` settings from [part 1](/docs/guides/monitor/anomaly-detection.md) of this guide series, the +Netdata Agent creates 32 alarms driven by unsupervised anomaly detection. + +The first class triggers warning alarms when the average anomaly probability for a given chart has stayed above 50% for +at least the last two minutes. + + + +The second class triggers warning alarms when the number of anomalies in the last two minutes hits 10 or higher. + + + +If you see either of these alarms in Netdata Cloud, the local Agent dashboard, or on your preferred notification +platform, it's a safe bet that the node's current metrics have deviated from normal. That doesn't necessarily mean +there's a full-blown incident, depending on what application/service you're using anomaly detection on, but it's worth +further investigation. + +As you use the anomalies collector, you may find that the default settings provide too many or too few genuine alarms. +In this case, [configure the alarm](/docs/monitor/configure-alarms.md) with `sudo ./edit-config +health.d/anomalies.conf`. Take a look at the `lookup` line syntax in the [health +reference](/health/REFERENCE.md#alarm-line-lookup) to understand how the anomalies collector automatically creates +alarms for any dimension on the `anomalies_local.probability` and `anomalies_local.anomaly` charts. + +## Visualize anomalies in charts + +In either [Netdata Cloud](https://app.netdata.cloud) or the local Agent dashboard at `http://NODE:19999`, click on the +**Anomalies** [section](/web/gui/README.md#sections) to see the pair of anomaly detection charts, which are +preconfigured to visualize per-second anomaly metrics based on your [configuration in +`anomalies.conf`](/docs/guides/monitor/anomaly-detection.md#configure-the-anomalies-collector). + +These charts have the contexts `anomalies.probability` and `anomalies.anomaly`. Together, these charts +create meaningful visualizations for immediately recognizing not only that something is going wrong on your node, but +give context as to where to look next. + +The `anomalies_local.probability` chart shows the probability that the latest observed data is anomalous, based on the +trained model. The `anomalies_local.anomaly` chart visualizes 0→1 predictions based on whether the latest observed +data is anomalous based on the trained model. Both charts share the same dimensions, which you configured via +`charts_regex` and `charts_to_exclude` in [part 1](/docs/guides/monitor/anomaly-detection.md). + +In other words, the `probability` chart shows the amplitude of the anomaly, whereas the `anomaly` chart provides quick +yes/no context. + +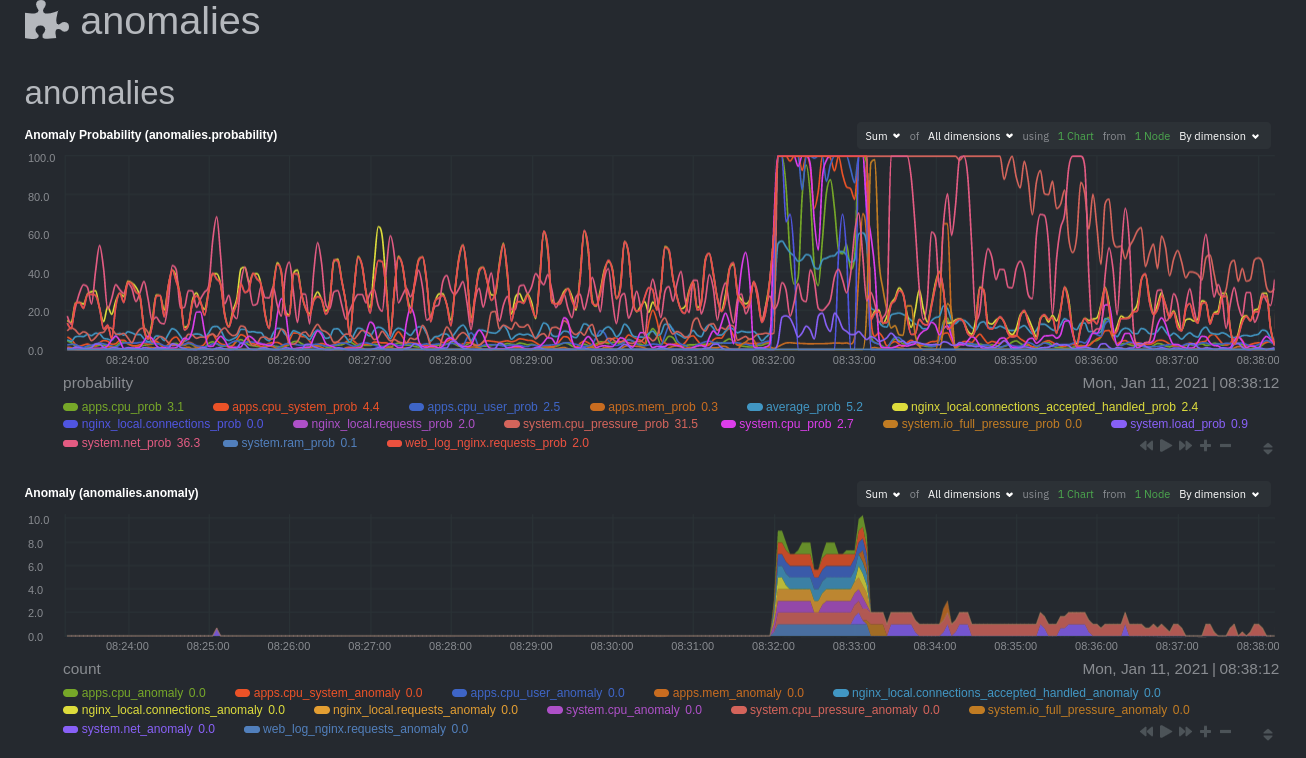 + +Before `08:32:00`, both charts show little in the way of verified anomalies. Based on the metrics the anomalies +collector has trained on, a certain percentage of anomaly probability score is normal, as seen in the +`web_log_nginx_requests_prob` dimension and a few others. What you're looking for is large deviations from the "noise" +in the `anomalies.probability` chart, or any increments to the `anomalies.anomaly` chart. + +Unsurprisingly, the stress test that began at `08:32:00` caused significant changes to these charts. The three +dimensions that immediately shot to 100% anomaly probability, and remained there during the test, were +`web_log_nginx.requests_prob`, `nginx_local.connections_accepted_handled_prob`, and `system.cpu_pressure_prob`. + +## Build an anomaly detection dashboard + +[Netdata Cloud](https://app.netdata.cloud) features a drag-and-drop [dashboard +editor](/docs/visualize/create-dashboards.md) that helps you create entirely new dashboards with charts targeted for +your specific applications. + +For example, here's a dashboard designed for visualizing anomalies present in an Nginx web server, including +documentation about why the dashboard exists and where to look next based on what you're seeing: + +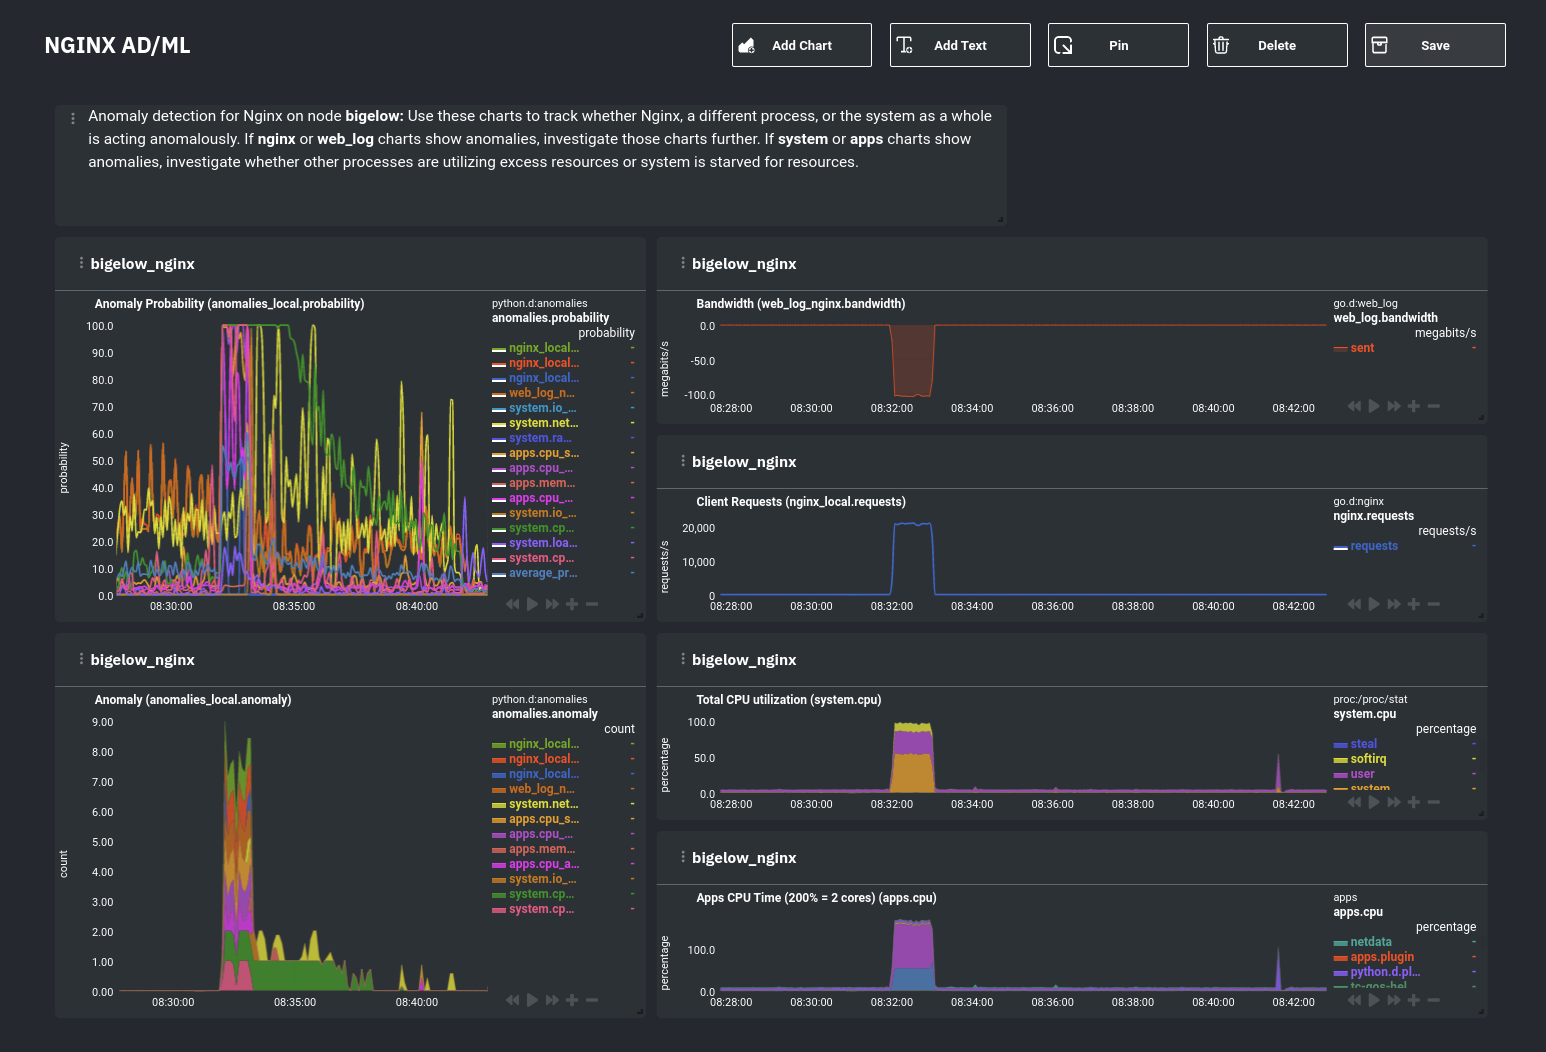 + +Use the anomaly charts for instant visual identification of potential anomalies, and then Nginx-specific charts, in the +right column, to validate whether the probability and anomaly counters are showing a valid incident worth further +investigation using [Metric Correlations](https://learn.netdata.cloud/docs/cloud/insights/metric-correlations) to narrow +the dashboard into only the charts relevant to what you're seeing from the anomalies collector. + +## What's next? + +Between this guide and [part 1](/docs/guides/monitor/anomaly-detection.md), which covered setup and configuration, you +now have a fundamental understanding of how unsupervised anomaly detection in Netdata works, from root cause to alarms +to preconfigured or custom dashboards. + +We'd love to hear your feedback on the anomalies collector. Hop over to the [community +forum](https://community.netdata.cloud/t/anomalies-collector-feedback-megathread/767), and let us know if you're already getting value from +unsupervised anomaly detection, or would like to see something added to it. You might even post a custom configuration +that works well for monitoring some other popular application, like MySQL, PostgreSQL, Redis, or anything else we +[support through collectors](/collectors/COLLECTORS.md). + +In part 3 of this series on unsupervised anomaly detection using Netdata, we'll create a custom model to apply +unsupervised anomaly detection to an entire mission-critical application. Stay tuned! + +### Related reference documentation + +- [Netdata Agent · Anomalies collector](/collectors/python.d.plugin/anomalies/README.md) +- [Netdata Cloud · Build new dashboards](https://learn.netdata.cloud/docs/cloud/visualize/dashboards) + +[](<>) |