
diff options
Diffstat (limited to 'docs/guides/step-by-step/step-01.md')
| -rw-r--r-- | docs/guides/step-by-step/step-01.md | 156 |
1 files changed, 0 insertions, 156 deletions
diff --git a/docs/guides/step-by-step/step-01.md b/docs/guides/step-by-step/step-01.md deleted file mode 100644 index e60bb076..00000000 --- a/docs/guides/step-by-step/step-01.md +++ /dev/null @@ -1,156 +0,0 @@ -<!-- -title: "Step 1. Netdata's building blocks" -custom_edit_url: https://github.com/netdata/netdata/edit/master/docs/guides/step-by-step/step-01.md ---> - -# Step 1. Netdata's building blocks - -Netdata is a distributed and real-time _health monitoring and performance troubleshooting toolkit_ for monitoring your -systems and applications. - -Because the monitoring agent is highly-optimized, you can install it all your physical systems, containers, IoT devices, -and edge devices without disrupting their core function. - -By default, and without configuration, Netdata delivers real-time insights into everything happening on the system, from -CPU utilization to packet loss on every network device. Netdata can also auto-detect metrics from hundreds of your -favorite services and applications, like MySQL/MariaDB, Docker, Nginx, Apache, MongoDB, and more. - -All metrics are automatically-updated, providing interactive dashboards that allow you to dive in, discover anomalies, -and figure out the root cause analysis of any issue. - -Best of all, Netdata is entirely free, open-source software! Solo developers and enterprises with thousands of systems -can both use it free of charge. We're hosted on [GitHub](https://github.com/netdata/netdata). - -Want to learn about the history of Netdata, and what inspired our CEO to build it in the first place, and where we're -headed? Read Costa's comprehensive blog post: _[Redefining monitoring with Netdata (and how it came to -be)](https://blog.netdata.cloud/posts/redefining-monitoring-netdata/)_. - -## What you'll learn in this step - -In the first step of the Netdata guide, you'll learn about: - -- [Netdata's core features](#netdatas-core-features) -- [Why you should use Netdata](#why-you-should-use-netdata) -- [How Netdata has complementary systems, not competitors](#how-netdata-has-complementary-systems-not-competitors) - -Let's get started! - -## Netdata's core features - -Netdata has only been around for a few years, but it's a complex piece of software. Here are just some of the features -we'll cover throughout this guide. - -- A sophisticated **dashboard**, which we'll cover in [step 2](step-02.md). The real-time, highly-granular dashboard, - with hundreds of charts, is your main source of information about the health and performance of your systems/ - applications. We designed the dashboard with anomaly detection and quick analysis in mind. We'll return to - dashboard-related topics in both [step 7](step-07.md) and [step 8](step-08.md). -- **Long-term metrics storage** by default. With our new database engine, you can store days, weeks, or months of - per-second historical metrics. Or you can archive metrics to another database, like MongoDB or Prometheus. We'll - cover all these options in [step 9](step-09.md). -- **No configuration necessary**. Without any configuration, you'll get thousands of real-time metrics and hundreds of - alarms designed by our community of sysadmin experts. But you _can_ configure Netdata in a lot of ways, some of - which we'll cover in [step 4](step-04.md). -- **Distributed, per-system installation**. Instead of centralizing metrics in one location, you install Netdata on - _every_ system, and each system is responsible for its metrics. Having distributed agents reduces cost and lets - Netdata run on devices with little available resources, such as IoT and edge devices, without affecting their core - purpose. -- **Sophisticated health monitoring** to ensure you always know when an anomaly hits. In [step 5](step-05.md), we dive - into how you can tune alarms, write your own alarm, and enable two types of notifications. -- **High-speed, low-resource collectors** that allow you to collect thousands of metrics every second while using only - a fraction of your system's CPU resources and a few MiB of RAM. -- **Netdata Cloud** is our SaaS toolkit that helps Netdata users monitor the health and performance of entire - infrastructures, whether they are two or two thousand (or more!) systems. We'll cover Netdata Cloud in [step - 3](step-03.md). - -## Why you should use Netdata - -Because you care about the health and performance of your systems and applications, and all of the awesome features we -just mentioned. And it's free! - -All these may be valid reasons, but let's step back and talk about Netdata's _principles_ for health monitoring and -performance troubleshooting. We have a lot of [complementary -systems](#how-netdata-has-complementary-systems-not-competitors), and we think there's a good reason why Netdata should -always be your first choice when troubleshooting an anomaly. - -We built Netdata on four principles. - -### Per-second data collection - -Our first principle is per-second data collection for all metrics. - -That matters because you can't monitor a 2-second service-level agreement (SLA) with 10-second metrics. You can't detect -quick anomalies if your metrics don't show them. - -How do we solve this? By decentralizing monitoring. Each node is responsible for collecting metrics, triggering alarms, -and building dashboards locally, and we work hard to ensure it does each step (and others) with remarkable efficiency. -For example, Netdata can [collect 100,000 metrics](https://github.com/netdata/netdata/issues/1323) every second while -using only 9% of a single server-grade CPU core! - -By decentralizing monitoring and emphasizing speed at every turn, Netdata helps you scale your health monitoring and -performance troubleshooting to an infrastructure of every size. _And_ you get to keep per-second metrics in long-term -storage thanks to the database engine. - -### Unlimited metrics - -We believe all metrics are fundamentally important, and all metrics should be available to the user. - -If you don't collect _all_ the metrics a system creates, you're only seeing part of the story. It's like saying you've -read a book after skipping all but the last ten pages. You only know the ending, not everything that leads to it. - -Most monitoring solutions exist to poke you when there's a problem, and then tell you to use a dozen different console -tools to find the root cause. Netdata prefers to give you every piece of information you might need to understand why an -anomaly happened. - -### Meaningful presentation - -We want every piece of Netdata's dashboard not only to look good and update every second, but also provide context as to -what you're looking at and why it matters. - -The principle of meaningful presentation is fundamental to our dashboard's user experience (UX). We could have put -charts in a grid or hidden some behind tabs or buttons. We instead chose to stack them vertically, on a single page, so -you can visually see how, for example, a jump in disk usage can also increase system load. - -Here's an example of a system undergoing a disk stress test: - -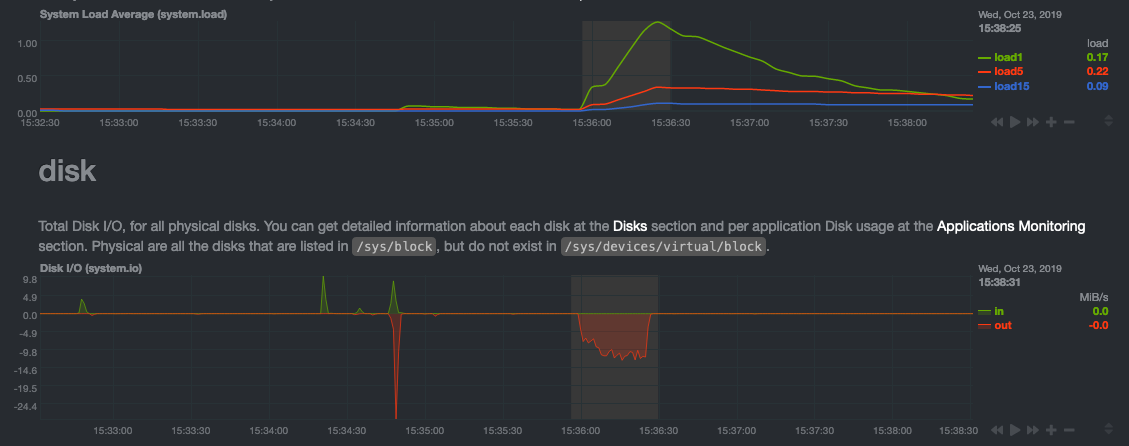 - -> For the curious, here's the command: `stress-ng --fallocate 4 --fallocate-bytes 4g --timeout 1m --metrics --verify -> --times`! - -### Immediate results - -Finally, Netdata should be usable from the moment you install it. - -As we've talked about, and as you'll learn in the following nine steps, Netdata comes installed with: - -- Auto-detected metrics -- Human-readable units -- Metrics that are structured into charts, families, and contexts -- Automatically generated dashboards -- Charts designed for visual anomaly detection -- Hundreds of pre-configured alarms - -By standardizing your monitoring infrastructure, Netdata tries to make at least one part of your administrative tasks -easy! - -## How Netdata has complementary systems, not competitors - -We'll cover this quickly, as you're probably eager to get on with using Netdata itself. - -We don't want to lock you in to using Netdata by itself, and forever. By supporting [archiving to -external databases](https://github.com/netdata/netdata/blob/master/exporting/README.md) like Graphite, Prometheus, OpenTSDB, MongoDB, and others, you can use Netdata _in -conjunction_ with software that might seem like our competitors. - -We don't want to "wage war" with another monitoring solution, whether it's commercial, open-source, or anything in -between. We just want to give you all the metrics every second, and what you do with them next is your business, not -ours. Our mission is helping people create more extraordinary infrastructures! - -## What's next? - -We think it's imperative you understand why we built Netdata the way we did. But now that we have that behind us, let's -get right into that dashboard you've heard so much about. - -[Next: Get to know Netdata's dashboard →](step-02.md) - - |