diff options
Diffstat (limited to '')
| -rw-r--r-- | docs/guides/step-by-step/step-07.md | 114 |
1 files changed, 0 insertions, 114 deletions
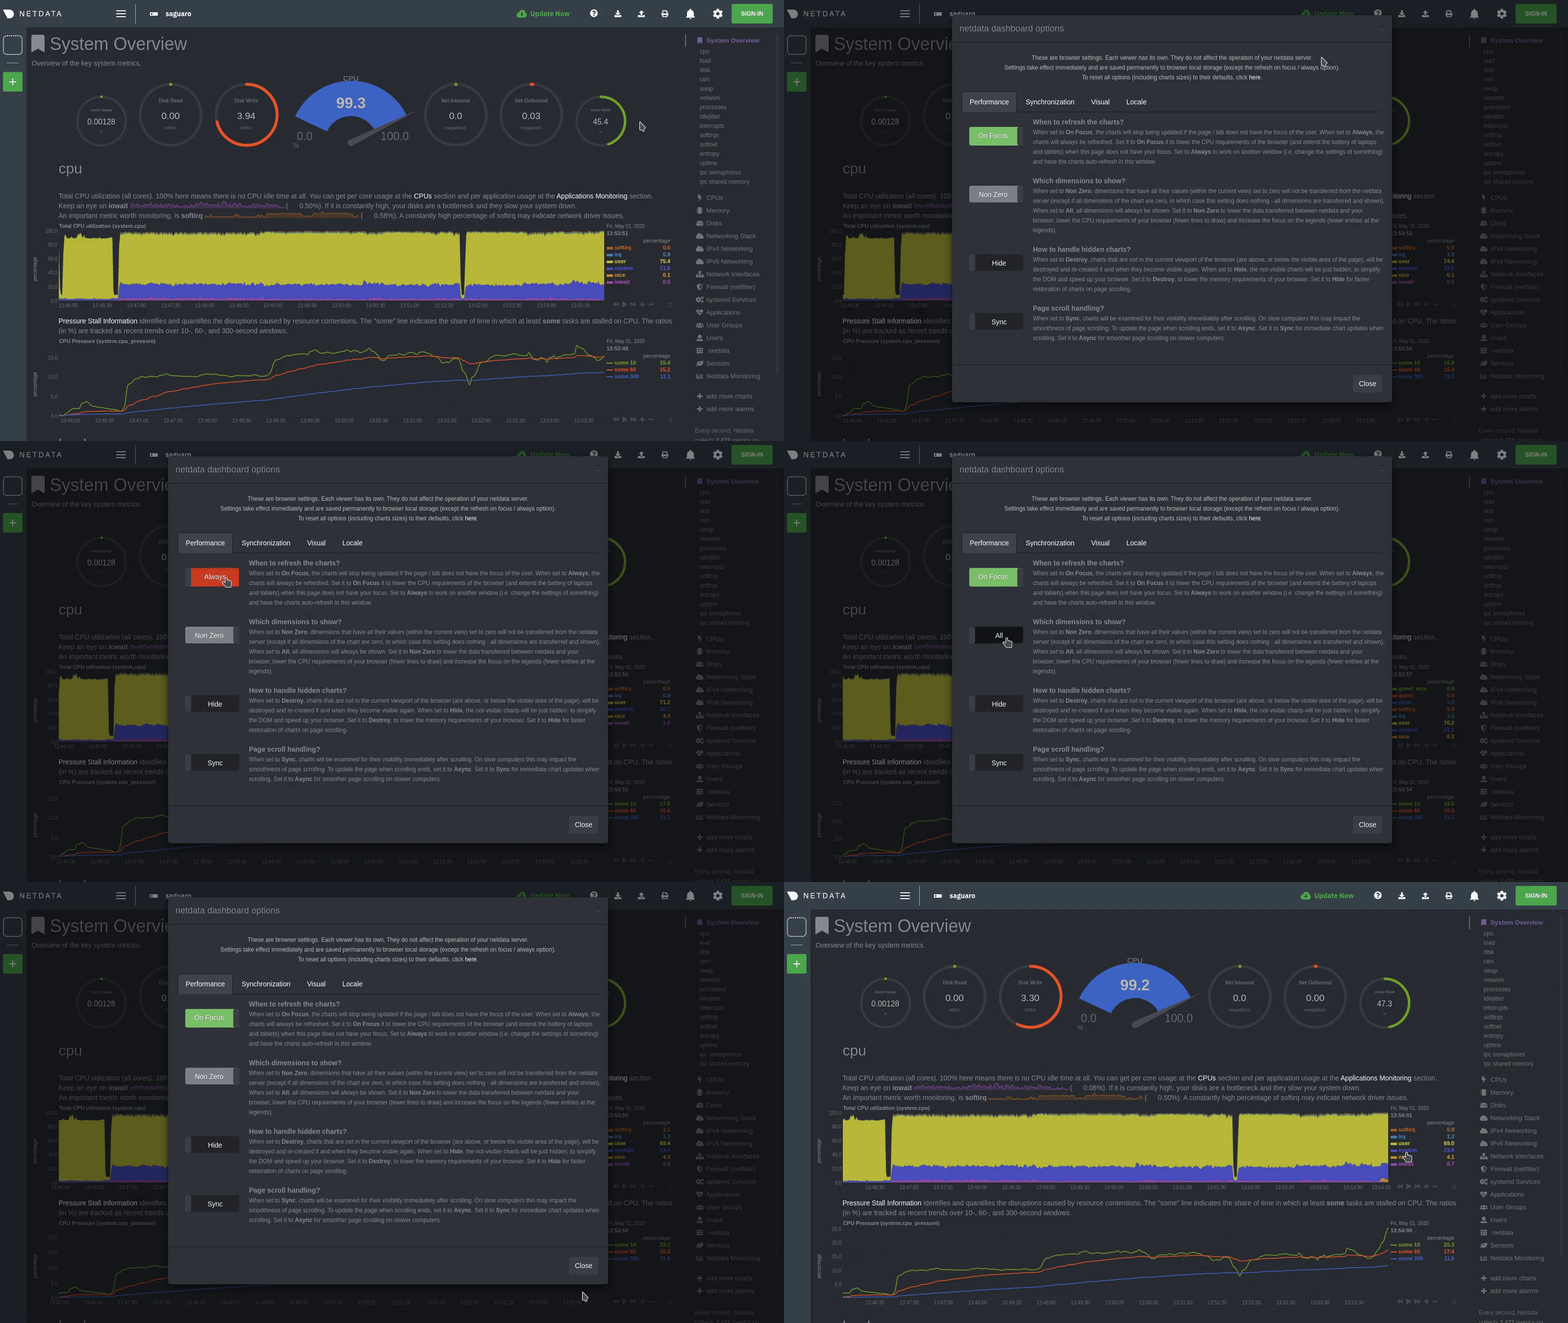
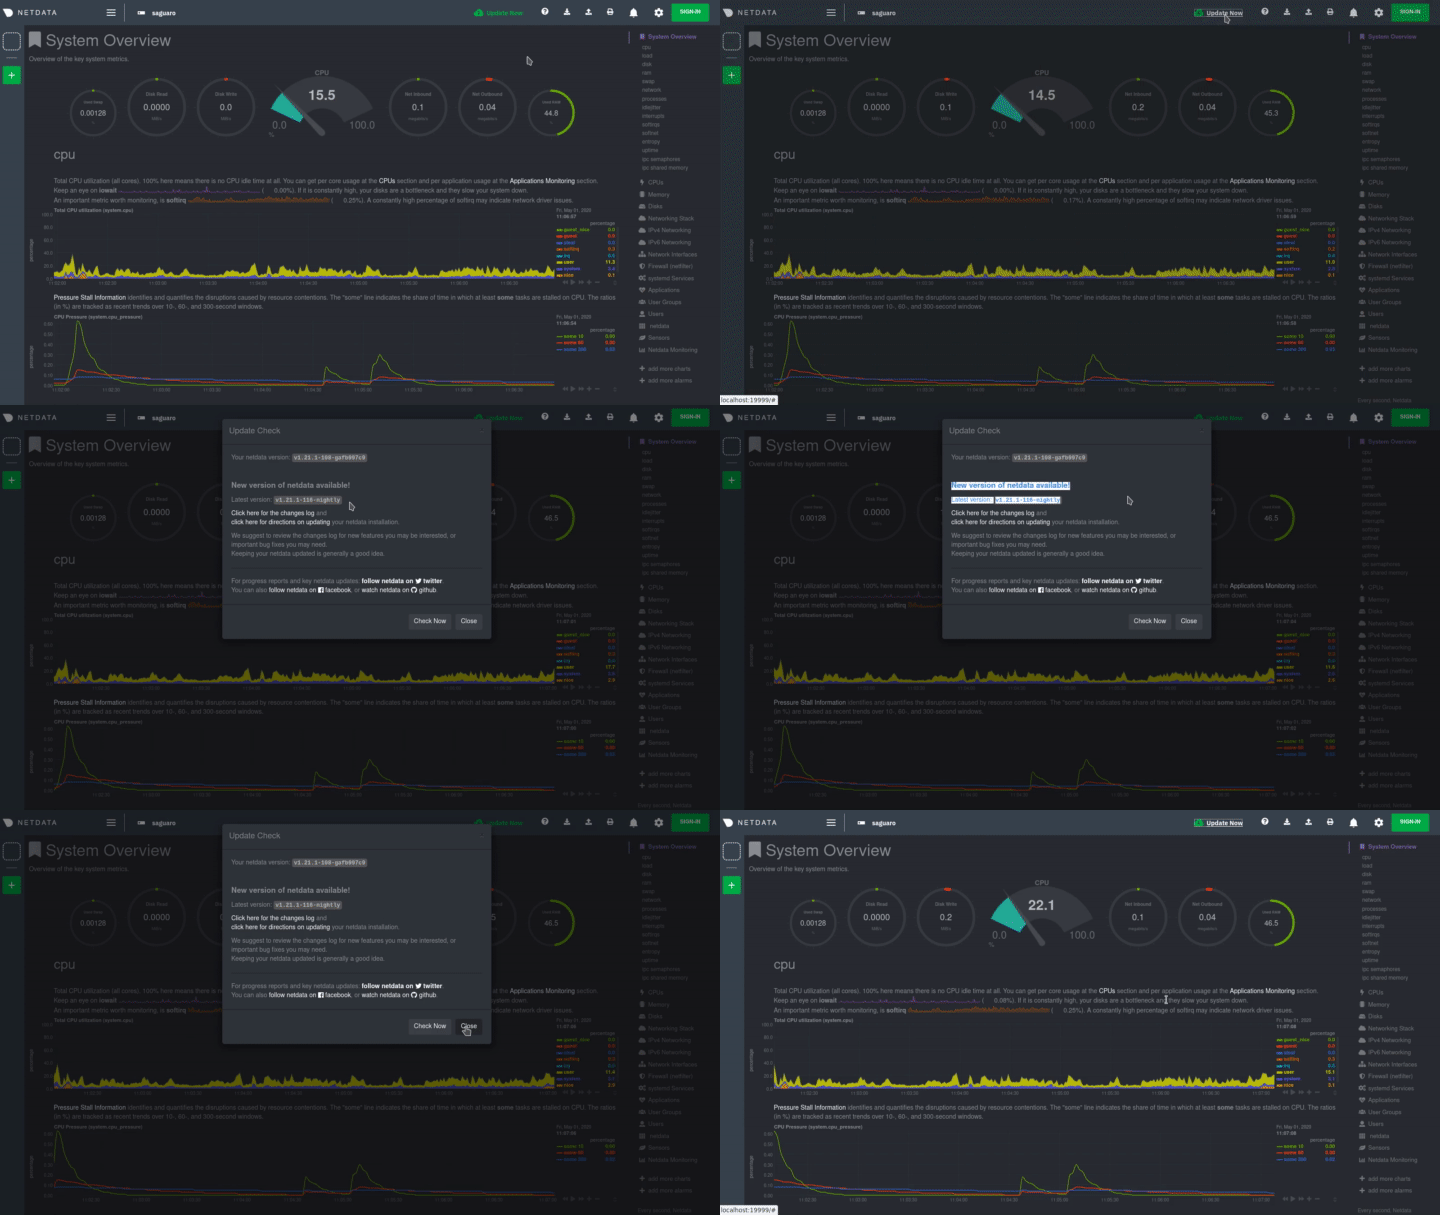
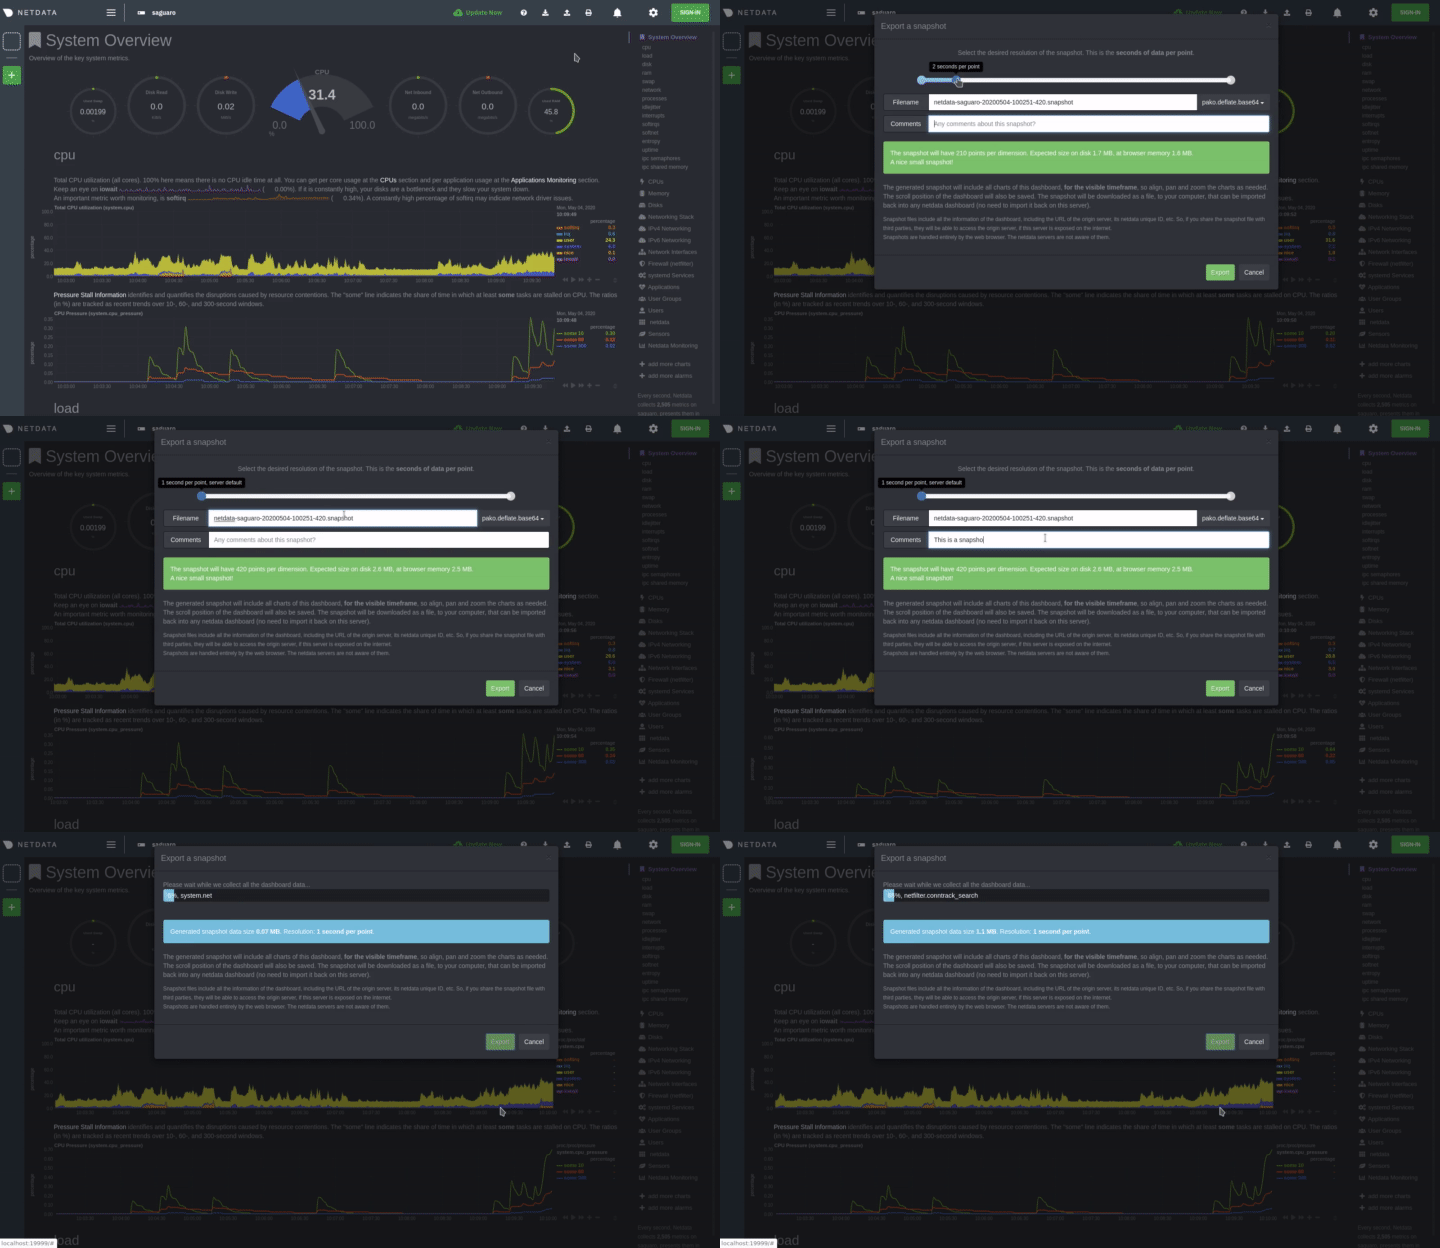
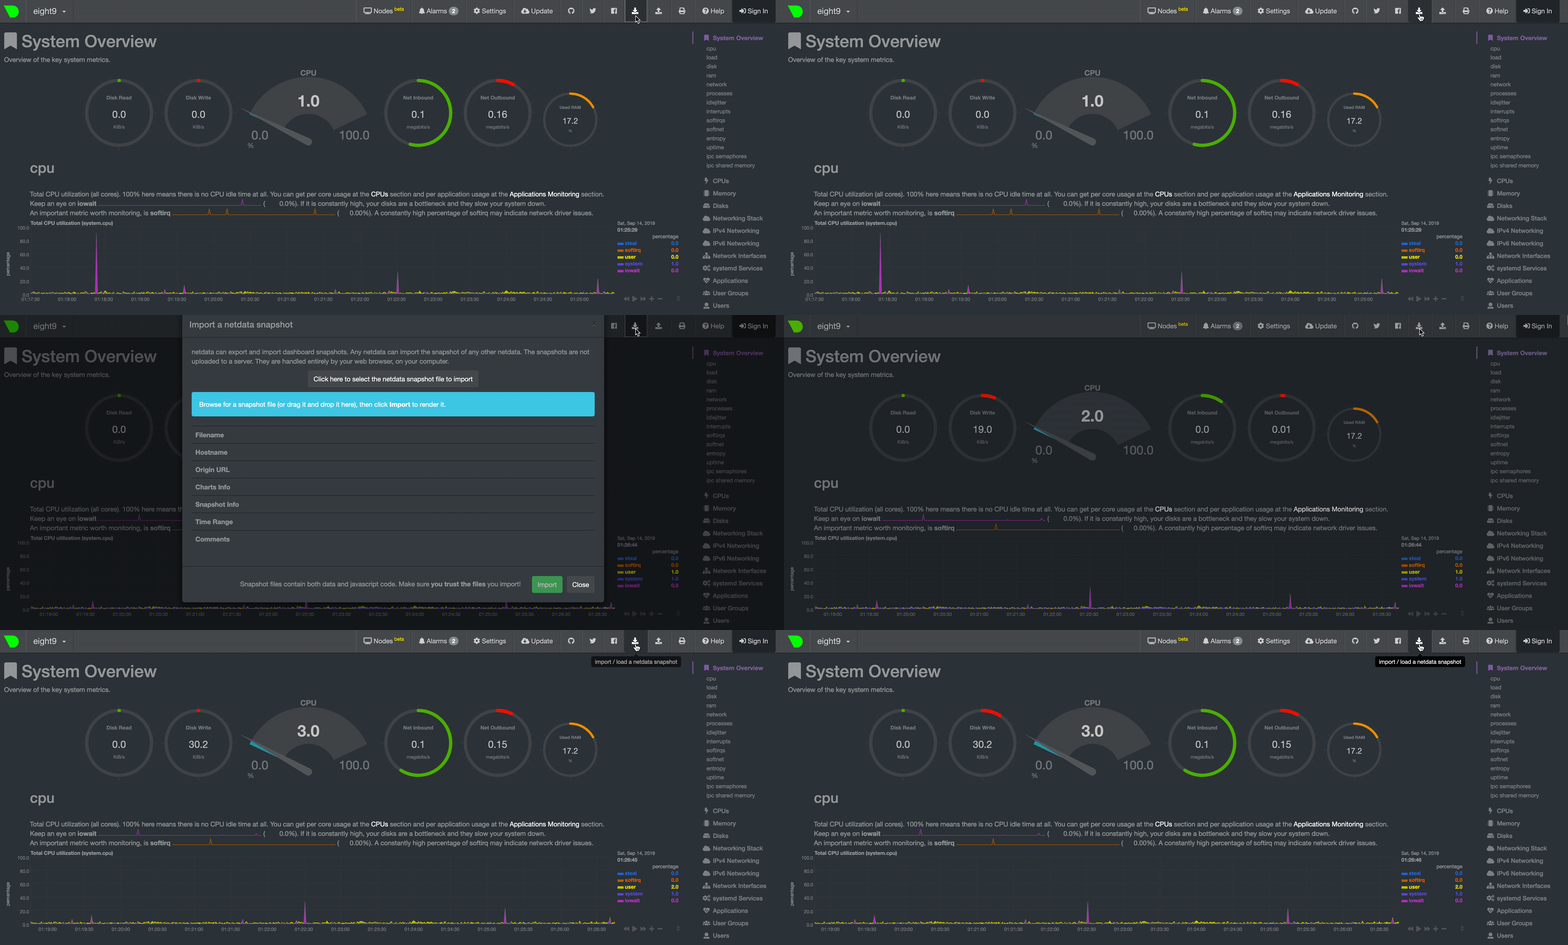
diff --git a/docs/guides/step-by-step/step-07.md b/docs/guides/step-by-step/step-07.md deleted file mode 100644 index 8c5c21bee..000000000 --- a/docs/guides/step-by-step/step-07.md +++ /dev/null @@ -1,114 +0,0 @@ -<!-- -title: "Step 7. Netdata's dashboard in depth" -date: 2020-05-04 -custom_edit_url: https://github.com/netdata/netdata/edit/master/docs/guides/step-by-step/step-07.md ---> - -# Step 7. Netdata's dashboard in depth - -Welcome to the seventh step of the Netdata guide! - -This step of the guide aims to get you more familiar with the features of the dashboard not previously mentioned in -[step 2](https://github.com/netdata/netdata/blob/master/docs/guides/step-by-step/step-02.md). - -## What you'll learn in this step - -In this step of the Netdata guide, you'll learn how to: - -- [Change the dashboard's settings](#change-the-dashboards-settings) -- [Check if there's an update to Netdata](#check-if-theres-an-update-to-netdata) -- [Export and import a snapshot](#export-and-import-a-snapshot) - -Let's get started! - -## Change the dashboard's settings - -The settings area at the top of your Netdata dashboard houses browser settings. These settings do not affect the -operation of your Netdata server/daemon. They take effect immediately and are permanently saved to browser local storage -(except the refresh on focus / always option). - -You can see the **Performance**, **Synchronization**, **Visual**, and **Locale** tabs on the dashboard settings modal. - - - -To change any setting, click on the toggle button. We recommend you spend some time reading the descriptions for each setting to understand them before making changes. - -Pay particular attention to the following settings, as they have dramatic impacts on the performance and appearance of -your Netdata dashboard: - -- When to refresh the charts? -- How to handle hidden charts? -- Which chart refresh policy to use? -- Which theme to use? -- Do you need help? - -Some settings are applied immediately, and others are only reflected after you refresh the page. - -## Check if there's an update to Netdata - -You can always check if there is an update available from the **Update** area of your Netdata dashboard. - - - -If an update is available, you'll see a modal similar to the one above. - -When you use the [automatic one-line installer script](https://github.com/netdata/netdata/blob/master/packaging/installer/README.md) attempt to update every day. If -you choose to update it manually, there are [several well-documented methods](https://github.com/netdata/netdata/blob/master/packaging/installer/UPDATE.md) to achieve -that. However, it is best practice for you to first go over the [changelog](https://github.com/netdata/netdata/blob/master/CHANGELOG.md). - -## Export and import a snapshot - -Netdata can export and import snapshots of the contents of your dashboard at a given time. Any Netdata agent can import -a snapshot created by any other Netdata agent. - -Snapshot files include all the information of the dashboard, including the URL of the origin server, its unique ID, and -chart data queries for the visible timeframe. While snapshots are not in real-time, and thus won't update with new -metrics, you can still pan, zoom, and highlight charts as you see fit. - -Snapshots can be incredibly useful for diagnosing anomalies after they've already happened. Let's say Netdata triggered -an alarm while you were sleeping. In the morning, you can look up the exact moment the alarm was raised, export a -snapshot, and send it to a colleague for further analysis. - -> ❗ Know how you shouldn't go around downloading software from suspicious-looking websites? Same policy goes for loading -> snapshots from untrusted or anonymous sources. Importing a snapshot loads quite a bit of data into your web browser, -> and so you should always err on the side of protecting your system. - -To export a snapshot, click on the **export** icon. - - - -Edit the snapshot file name and select your desired compression method. Click on **Export**. - -When the export is complete, your browser will prompt you to save the `.snapshot` file to your machine. You can now -share this file with any other Netdata user via email, Slack, or even to help describe your Netdata experience when -[filing an issue](https://github.com/netdata/netdata/issues/new/choose) on GitHub. - -To import a snapshot, click on the **import** icon. - - - -Select the Netdata snapshot file to import. Once the file is loaded, the dashboard will update with critical information -about the snapshot and the system from which it was taken. Click **import** to render it. - -Your Netdata dashboard will load data contained in the snapshot into charts. Because the snapshot only covers a certain -period, it won't update with new metrics. - -An imported snapshot is also temporary. If you reload your browser tab, Netdata will remove the snapshot data and -restore your real-time dashboard for your machine. - -## What's next? - -In this step of the Netdata guide, you learned how to: - -- Change the dashboard's settings -- Check if there's an update to Netdata -- Export or import a snapshot - -Next, you'll learn how to build your first custom dashboard! - -[Next: Build your first custom dashboard →](step-08.md) - - |
