1
2
3
4
5
6
7
8
9
10
11
12
13
14
15
16
17
18
19
20
21
22
23
24
25
26
27
28
29
30
31
32
33
34
35
36
37
38
39
40
41
42
43
44
45
46
47
48
49
50
51
52
53
54
55
56
57
58
59
60
61
62
63
64
65
66
67
68
69
70
71
72
73
74
75
76
77
78
79
80
81
82
83
84
85
86
87
88
89
90
91
92
93
94
95
96
97
98
99
100
101
102
103
104
105
106
107
108
109
110
111
112
113
114
|
<!--
title: "Step 7. Netdata's dashboard in depth"
date: 2020-05-04
custom_edit_url: https://github.com/netdata/netdata/edit/master/docs/guides/step-by-step/step-07.md
-->
# Step 7. Netdata's dashboard in depth
Welcome to the seventh step of the Netdata guide!
This step of the guide aims to get you more familiar with the features of the dashboard not previously mentioned in
[step 2](https://github.com/netdata/netdata/blob/master/docs/guides/step-by-step/step-02.md).
## What you'll learn in this step
In this step of the Netdata guide, you'll learn how to:
- [Change the dashboard's settings](#change-the-dashboards-settings)
- [Check if there's an update to Netdata](#check-if-theres-an-update-to-netdata)
- [Export and import a snapshot](#export-and-import-a-snapshot)
Let's get started!
## Change the dashboard's settings
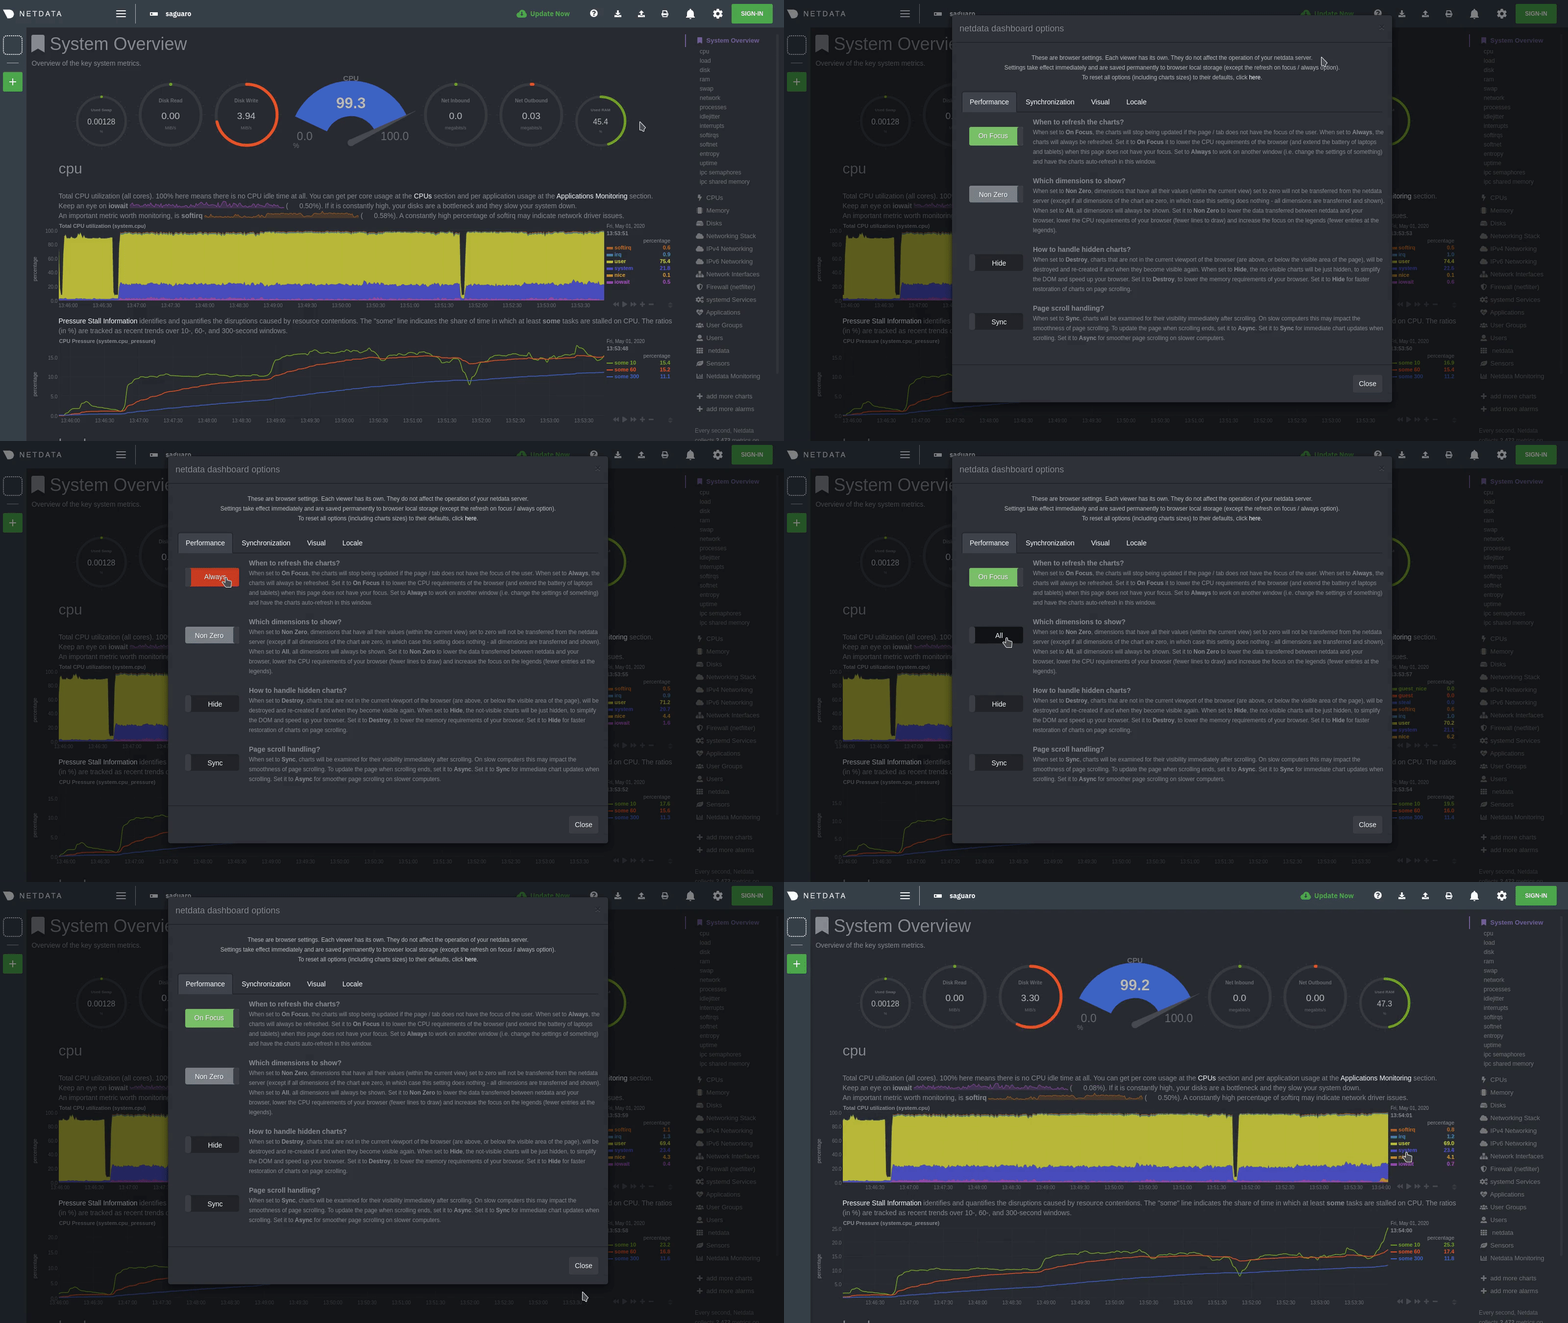
The settings area at the top of your Netdata dashboard houses browser settings. These settings do not affect the
operation of your Netdata server/daemon. They take effect immediately and are permanently saved to browser local storage
(except the refresh on focus / always option).
You can see the **Performance**, **Synchronization**, **Visual**, and **Locale** tabs on the dashboard settings modal.

To change any setting, click on the toggle button. We recommend you spend some time reading the descriptions for each setting to understand them before making changes.
Pay particular attention to the following settings, as they have dramatic impacts on the performance and appearance of
your Netdata dashboard:
- When to refresh the charts?
- How to handle hidden charts?
- Which chart refresh policy to use?
- Which theme to use?
- Do you need help?
Some settings are applied immediately, and others are only reflected after you refresh the page.
## Check if there's an update to Netdata
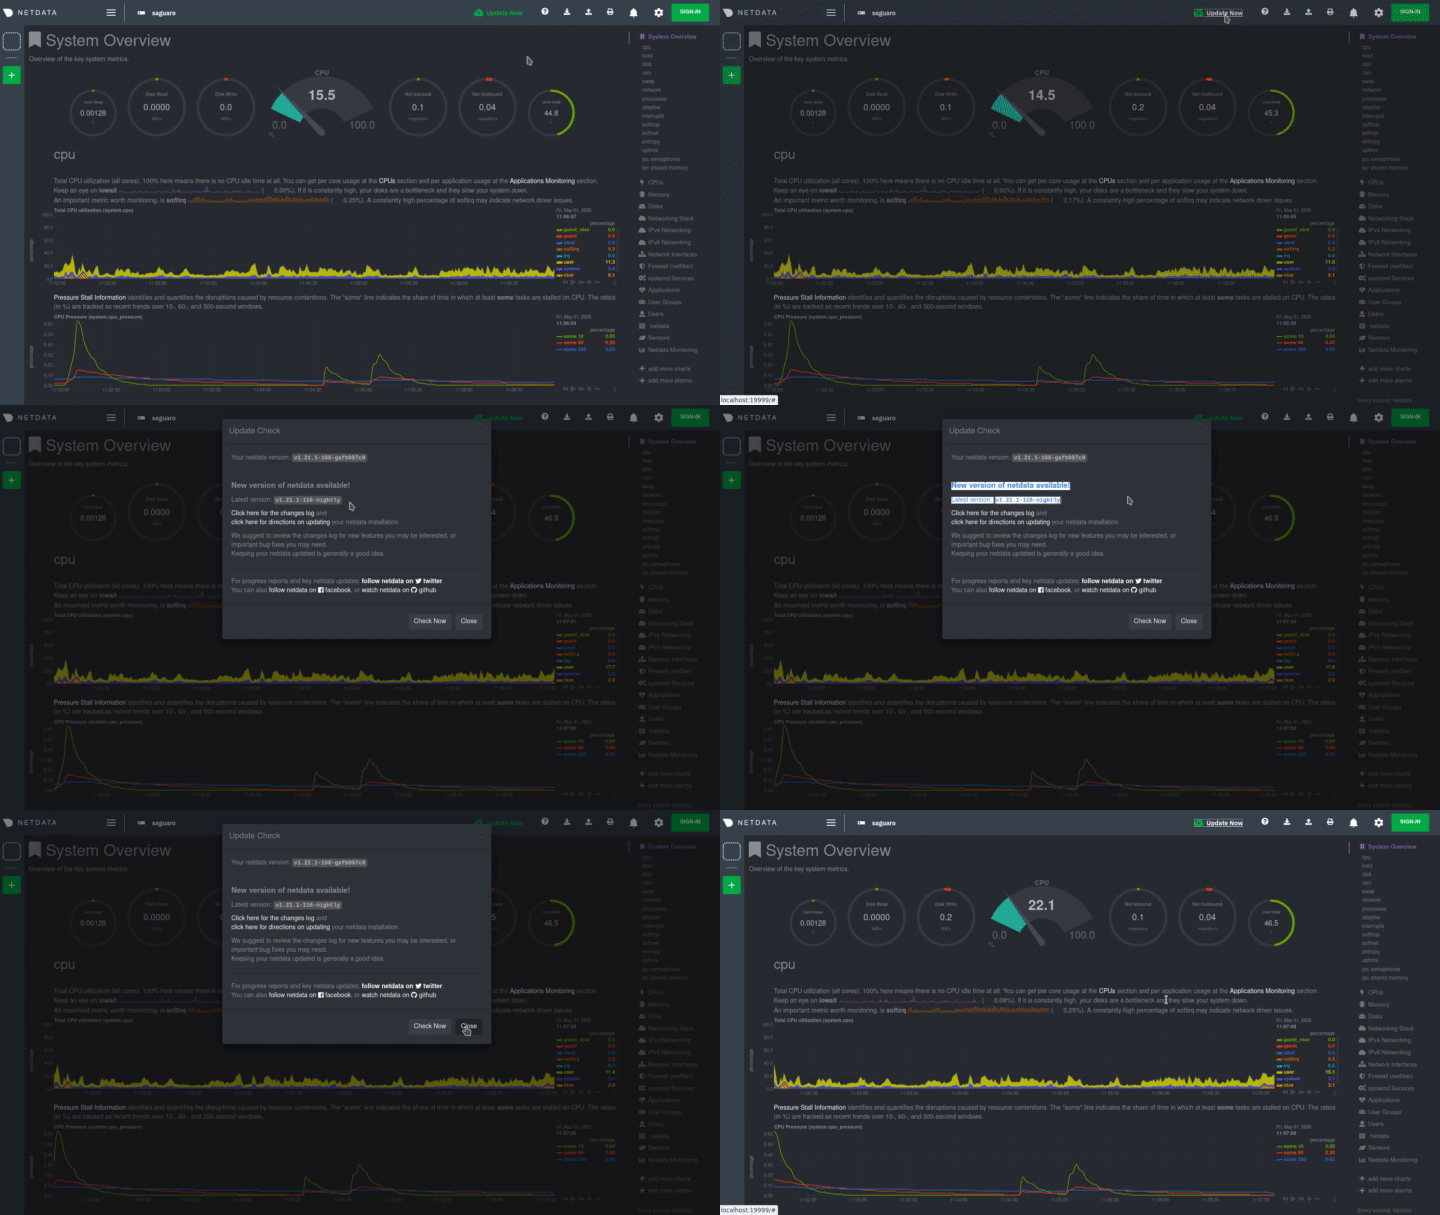
You can always check if there is an update available from the **Update** area of your Netdata dashboard.

If an update is available, you'll see a modal similar to the one above.
When you use the [automatic one-line installer script](https://github.com/netdata/netdata/blob/master/packaging/installer/README.md) attempt to update every day. If
you choose to update it manually, there are [several well-documented methods](https://github.com/netdata/netdata/blob/master/packaging/installer/UPDATE.md) to achieve
that. However, it is best practice for you to first go over the [changelog](https://github.com/netdata/netdata/blob/master/CHANGELOG.md).
## Export and import a snapshot
Netdata can export and import snapshots of the contents of your dashboard at a given time. Any Netdata agent can import
a snapshot created by any other Netdata agent.
Snapshot files include all the information of the dashboard, including the URL of the origin server, its unique ID, and
chart data queries for the visible timeframe. While snapshots are not in real-time, and thus won't update with new
metrics, you can still pan, zoom, and highlight charts as you see fit.
Snapshots can be incredibly useful for diagnosing anomalies after they've already happened. Let's say Netdata triggered
an alarm while you were sleeping. In the morning, you can look up the exact moment the alarm was raised, export a
snapshot, and send it to a colleague for further analysis.
> ❗ Know how you shouldn't go around downloading software from suspicious-looking websites? Same policy goes for loading
> snapshots from untrusted or anonymous sources. Importing a snapshot loads quite a bit of data into your web browser,
> and so you should always err on the side of protecting your system.
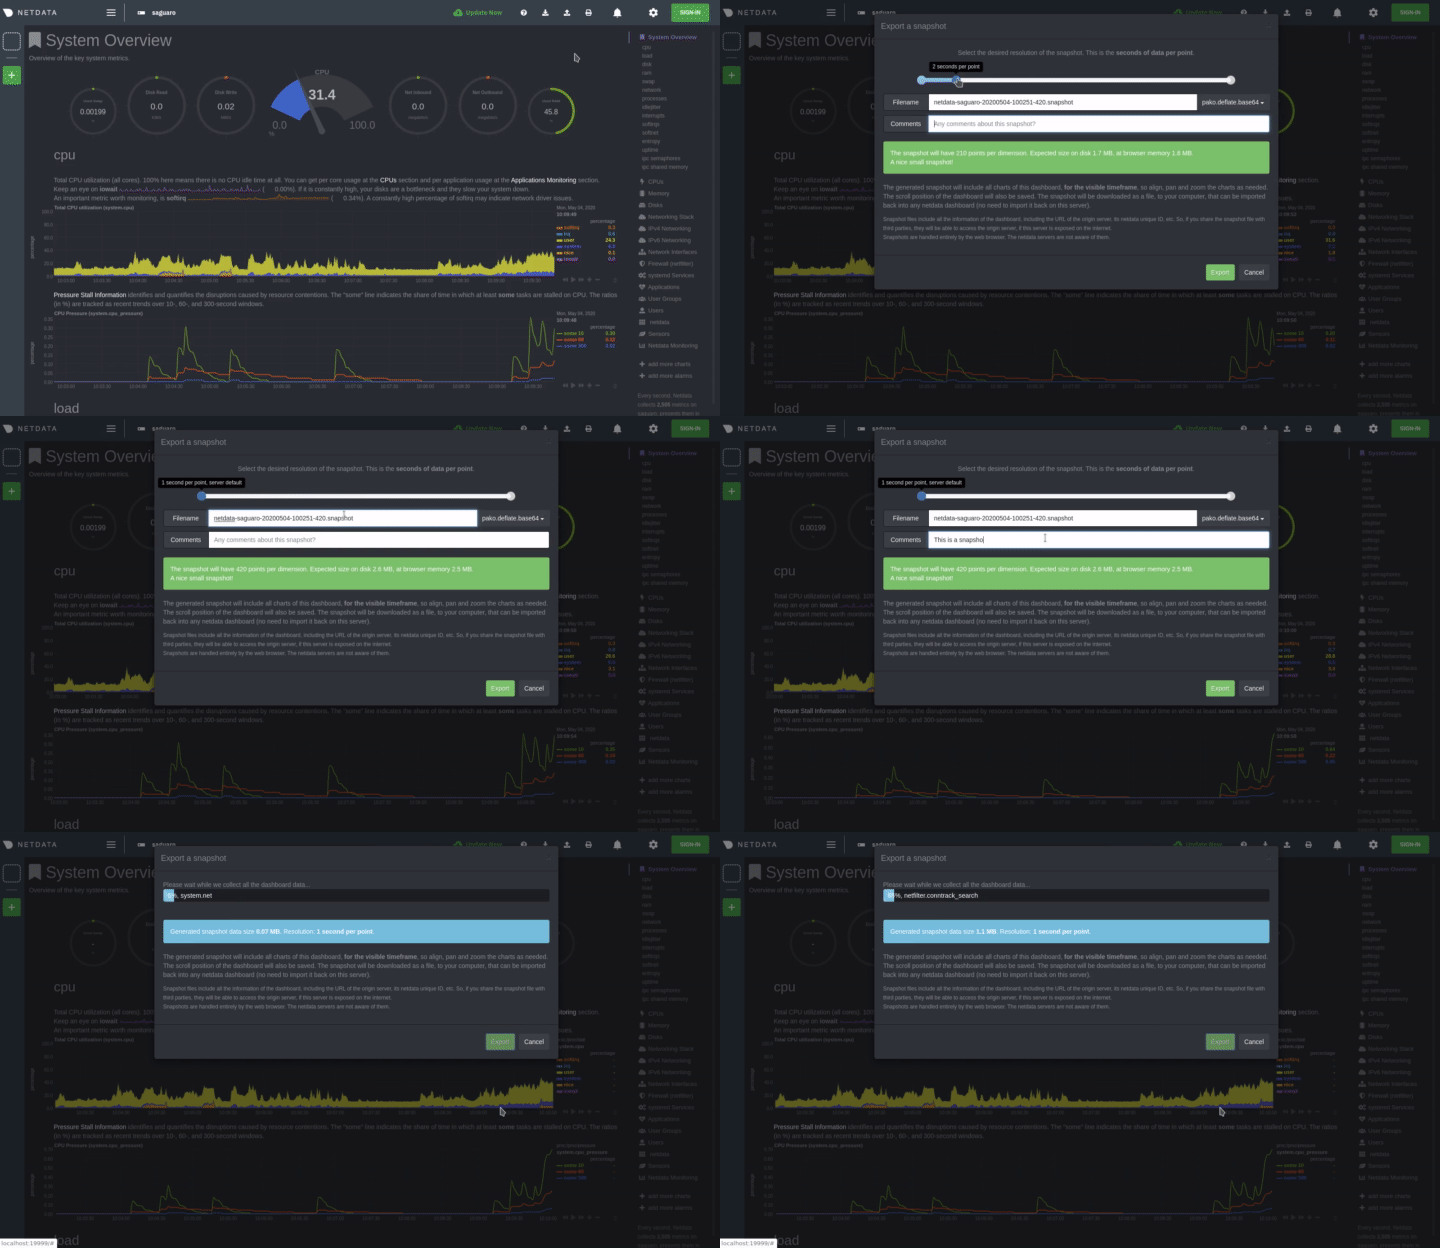
To export a snapshot, click on the **export** icon.

Edit the snapshot file name and select your desired compression method. Click on **Export**.
When the export is complete, your browser will prompt you to save the `.snapshot` file to your machine. You can now
share this file with any other Netdata user via email, Slack, or even to help describe your Netdata experience when
[filing an issue](https://github.com/netdata/netdata/issues/new/choose) on GitHub.
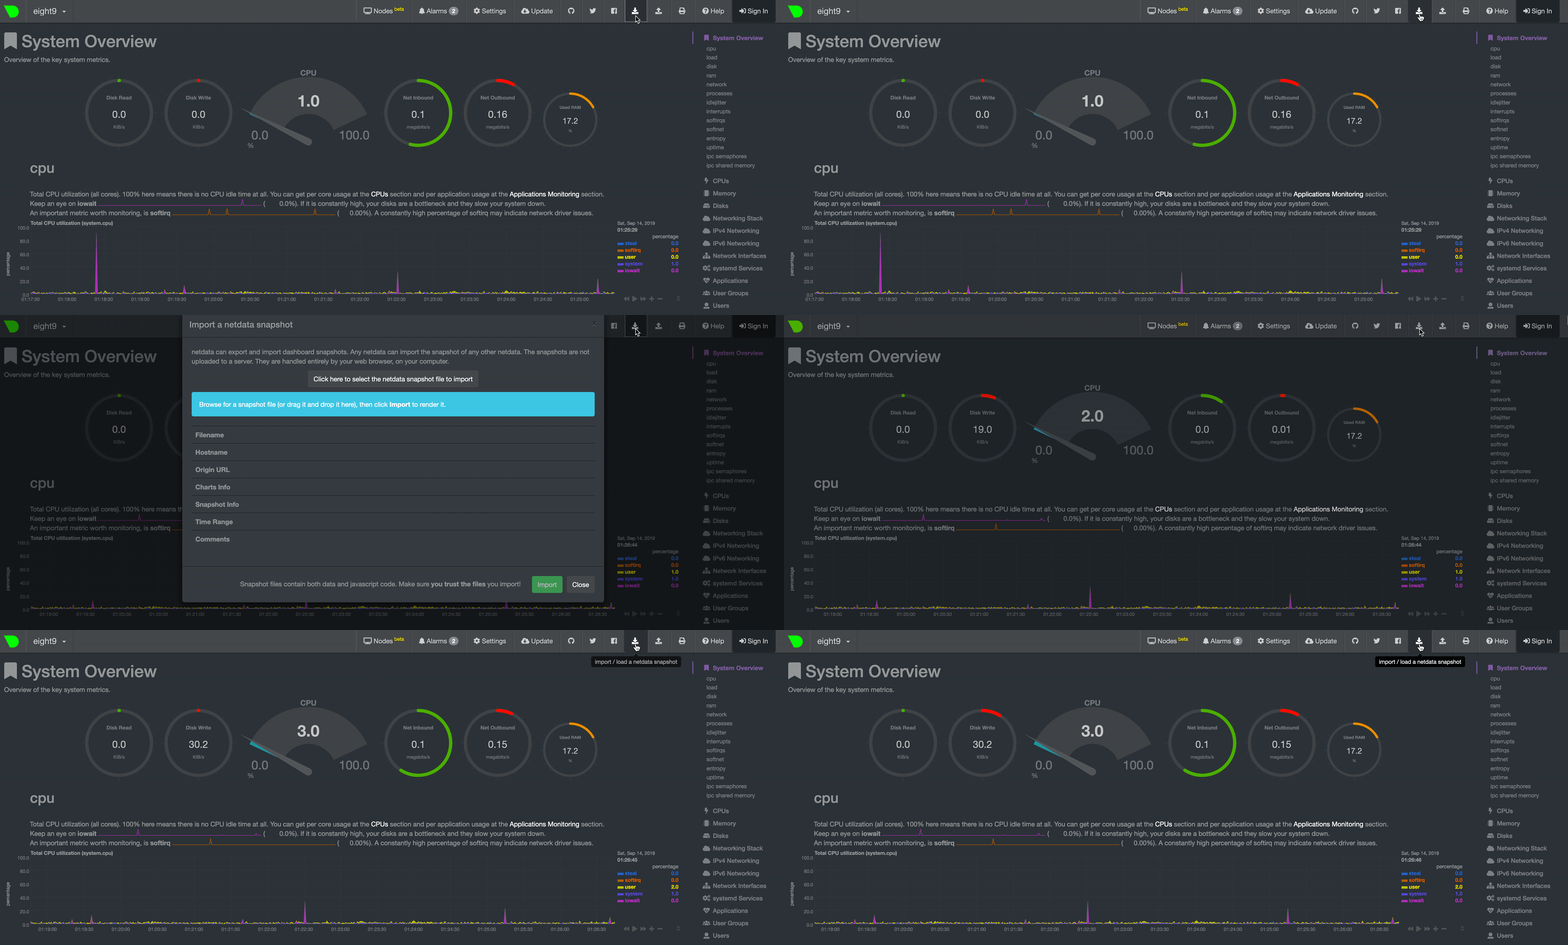
To import a snapshot, click on the **import** icon.

Select the Netdata snapshot file to import. Once the file is loaded, the dashboard will update with critical information
about the snapshot and the system from which it was taken. Click **import** to render it.
Your Netdata dashboard will load data contained in the snapshot into charts. Because the snapshot only covers a certain
period, it won't update with new metrics.
An imported snapshot is also temporary. If you reload your browser tab, Netdata will remove the snapshot data and
restore your real-time dashboard for your machine.
## What's next?
In this step of the Netdata guide, you learned how to:
- Change the dashboard's settings
- Check if there's an update to Netdata
- Export or import a snapshot
Next, you'll learn how to build your first custom dashboard!
[Next: Build your first custom dashboard →](step-08.md)
|
