
diff options
Diffstat (limited to 'docs/guides/step-by-step/step-09.md')
| -rw-r--r-- | docs/guides/step-by-step/step-09.md | 16 |
1 files changed, 8 insertions, 8 deletions
diff --git a/docs/guides/step-by-step/step-09.md b/docs/guides/step-by-step/step-09.md index 8aacd7514..839115a27 100644 --- a/docs/guides/step-by-step/step-09.md +++ b/docs/guides/step-by-step/step-09.md @@ -5,7 +5,7 @@ custom_edit_url: https://github.com/netdata/netdata/edit/master/docs/guides/step # Step 9. Long-term metrics storage -By default, Netdata stores metrics in a custom database we call the [database engine](/database/engine/README.md), which +By default, Netdata stores metrics in a custom database we call the [database engine](https://github.com/netdata/netdata/blob/master/database/engine/README.md), which stores recent metrics in your system's RAM and "spills" historical metrics to disk. By using both RAM and disk, the database engine helps you store a much larger dataset than the amount of RAM your system has. @@ -51,7 +51,7 @@ the database engine to use. The higher those values, the more metrics Netdata wi 512, respectively, the database engine should store about four day's worth of data on a system collecting 2,000 metrics every second. -[**See our database engine calculator**](/docs/store/change-metrics-storage.md) to help you correctly set `dbengine disk +[**See our database engine calculator**](https://github.com/netdata/netdata/blob/master/docs/store/change-metrics-storage.md) to help you correctly set `dbengine disk space` based on your needs. The calculator gives an accurate estimate based on how many child nodes you have, how many metrics your Agent collects, and more. @@ -63,7 +63,7 @@ metrics your Agent collects, and more. ``` After you've made your changes, restart Netdata using `sudo systemctl restart netdata`, or the [appropriate -method](/docs/configure/start-stop-restart.md) for your system. +method](https://github.com/netdata/netdata/blob/master/docs/configure/start-stop-restart.md) for your system. To confirm the database engine is working, go to your Netdata dashboard and click on the **Netdata Monitoring** menu on the right-hand side. You can find `dbengine` metrics after `queries`. @@ -77,7 +77,7 @@ You can archive all the metrics collected by Netdata to **external databases**. include Graphite, OpenTSDB, Prometheus, AWS Kinesis Data Streams, Google Cloud Pub/Sub, MongoDB, and the list is always growing. -As we said in [step 1](/docs/guides/step-by-step/step-01.md), we have only complimentary systems, not competitors! We're +As we said in [step 1](https://github.com/netdata/netdata/blob/master/docs/guides/step-by-step/step-01.md), we have only complimentary systems, not competitors! We're happy to support these archiving methods and are always working to improve them. A lot of Netdata users archive their metrics to one of these databases for long-term storage or further analysis. Since @@ -117,7 +117,7 @@ use netdata db.createCollection("netdata_metrics") ``` -Next, Netdata needs to be [reinstalled](/packaging/installer/REINSTALL.md) in order to detect that the required +Next, Netdata needs to be [reinstalled](https://github.com/netdata/netdata/blob/master/packaging/installer/REINSTALL.md) in order to detect that the required libraries to make this exporting connection exist. Since you most likely installed Netdata using the one-line installer script, all you have to do is run that script again. Don't worry—any configuration changes you made along the way will be retained! @@ -140,14 +140,14 @@ Add the following section to the file: ``` Restart Netdata using `sudo systemctl restart netdata`, or the [appropriate -method](/docs/configure/start-stop-restart.md) for your system, to enable the MongoDB exporting connector. Click on the +method](https://github.com/netdata/netdata/blob/master/docs/configure/start-stop-restart.md) for your system, to enable the MongoDB exporting connector. Click on the **Netdata Monitoring** menu and check out the **exporting my mongo instance** sub-menu. You should start seeing these charts fill up with data about the exporting process! 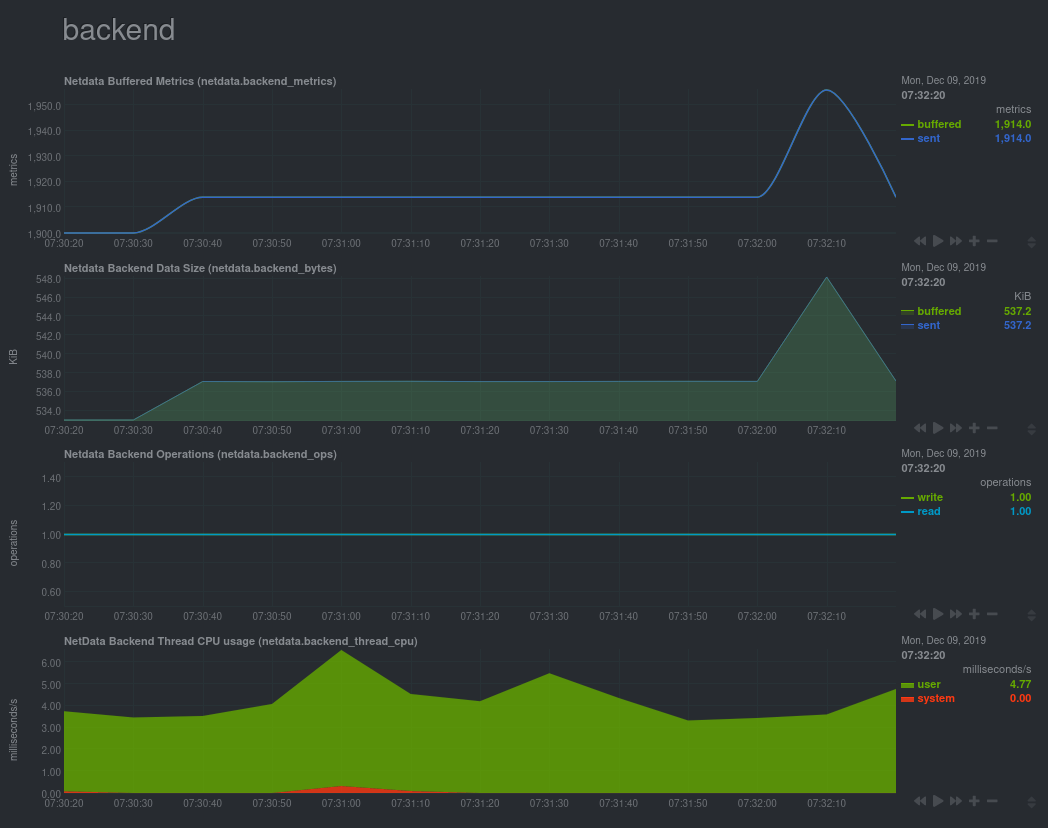 If you'd like to try connecting Netdata to another database, such as Prometheus or OpenTSDB, read our [exporting -documentation](/exporting/README.md). +documentation](https://github.com/netdata/netdata/blob/master/exporting/README.md). ## What's next? @@ -157,6 +157,6 @@ metrics to MongoDB for long-term storage. In the last step of this step-by-step guide, we'll put our sysadmin hat on and use Nginx to proxy traffic to and from our Netdata dashboard. -[Next: Set up a proxy →](/docs/guides/step-by-step/step-10.md) +[Next: Set up a proxy →](https://github.com/netdata/netdata/blob/master/docs/guides/step-by-step/step-10.md) |