
diff options
Diffstat (limited to 'docs/monitor/view-active-alarms.md')
| -rw-r--r-- | docs/monitor/view-active-alarms.md | 19 |
1 files changed, 8 insertions, 11 deletions
diff --git a/docs/monitor/view-active-alarms.md b/docs/monitor/view-active-alarms.md index 8837e48ad..63ddfdde1 100644 --- a/docs/monitor/view-active-alarms.md +++ b/docs/monitor/view-active-alarms.md @@ -9,17 +9,14 @@ custom_edit_url: https://github.com/netdata/netdata/edit/master/docs/monitor/vie Every Netdata Agent comes with hundreds of pre-installed health alarms designed to notify you when an anomaly or performance issue affects your node or the applications it runs. -As soon as you launch a Netdata Agent and [claim it](/docs/get/README.md#claim-your-node-on-netdata-cloud), you can view -active alarms in both the local dashboard and Netdata Cloud. +## Netdata Cloud -## View active alarms in Netdata Cloud - -You can see active alarms from any node in your infrastructure in two ways: Click on the bell 🔔 icon in the top -navigation, or click on the first column of any node's row in Nodes. This column's color changes based on the node's -[health status](/health/REFERENCE.md#alarm-statuses): gray is `CLEAR`, yellow is `WARNING`, and red is `CRITICAL`. +A War Room's [alarms indicator](https://learn.netdata.cloud/docs/cloud/war-rooms#indicators) displays the number of active `critical` (red) and +`warning` (yellow) alerts for the nodes in this War Room. Click on either the critical or warning badges to open a +pre-filtered modal displaying only those types of [active alarms](https://learn.netdata.cloud/docs/cloud/monitoring/alarms). 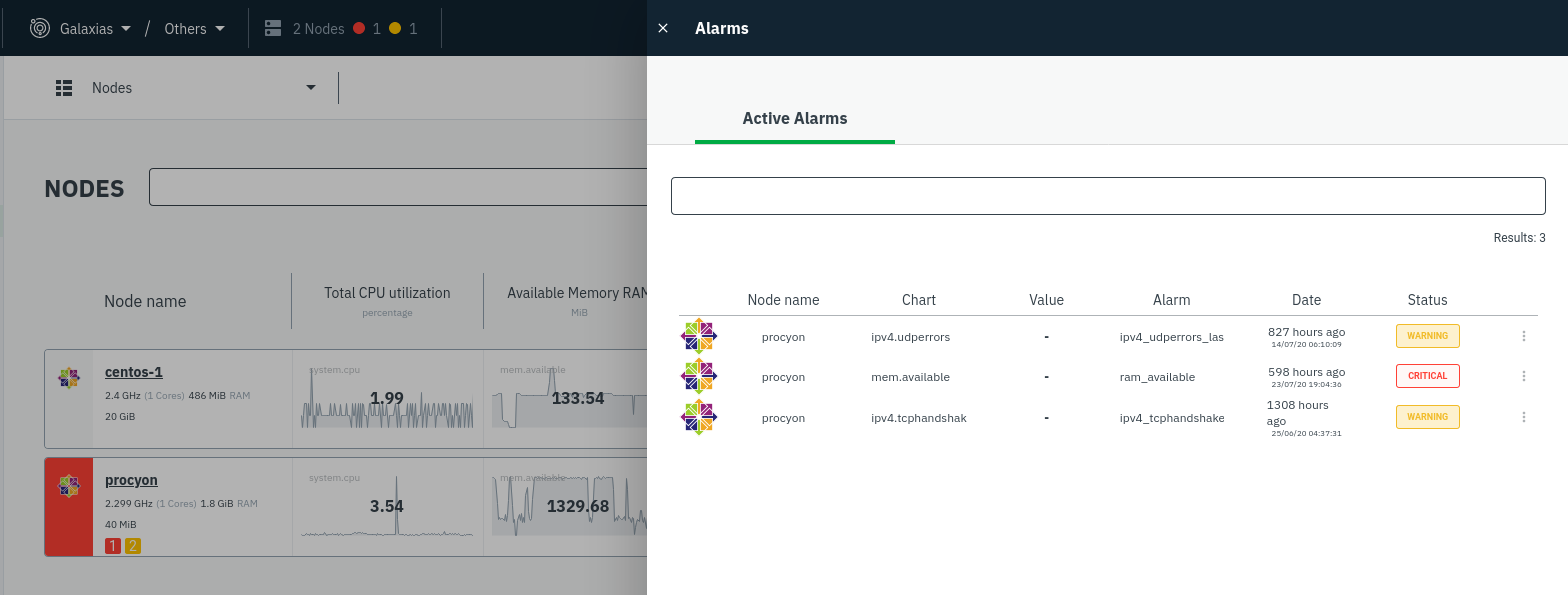 +Cloud](https://user-images.githubusercontent.com/1153921/108564747-d2bfbb00-72c0-11eb-97b9-5863ad3324eb.png) The Alarms panel lists all active alarms for nodes within that War Room, and tells you which chart triggered the alarm, what that chart's current value is, the alarm that triggered it, and when the alarm status first began. @@ -35,10 +32,10 @@ The active alarm information gives you details about the alarm that's been trigg configuration, how it calculates warning or critical alarms, and which configuration file you could edit on that node if you want to tweak or disable the alarm to better suit your needs. -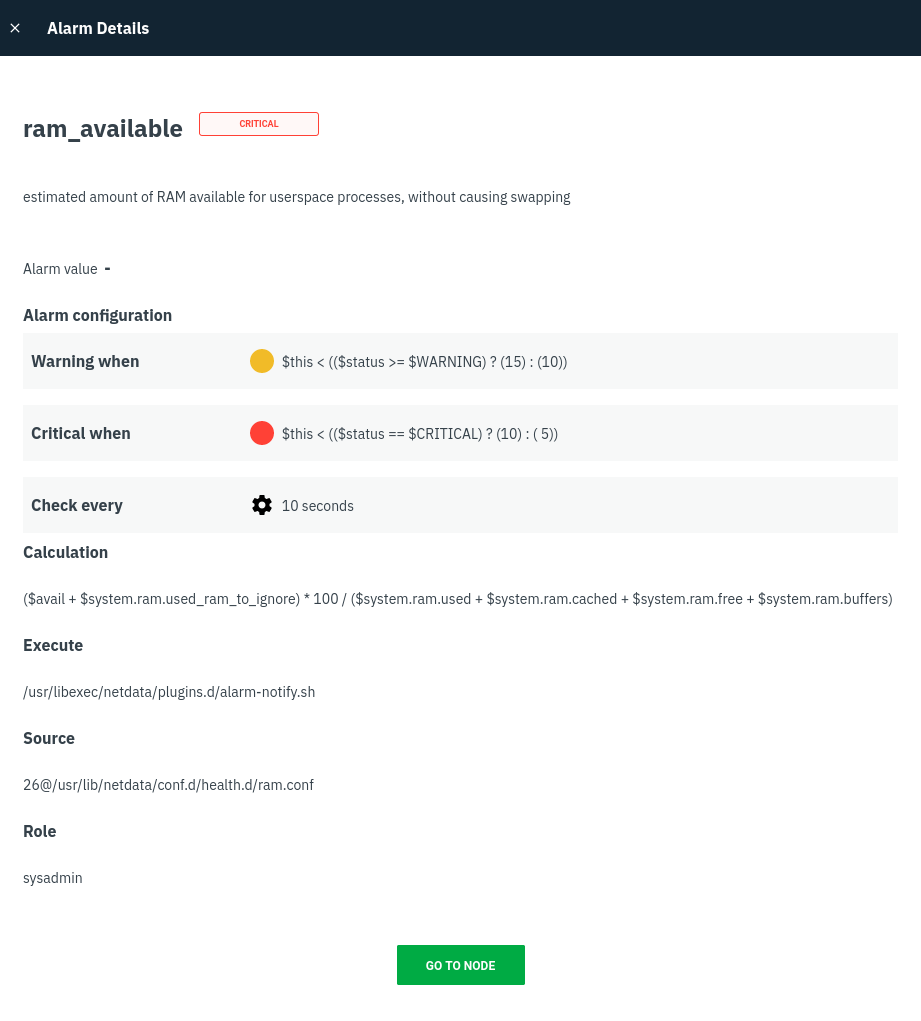 +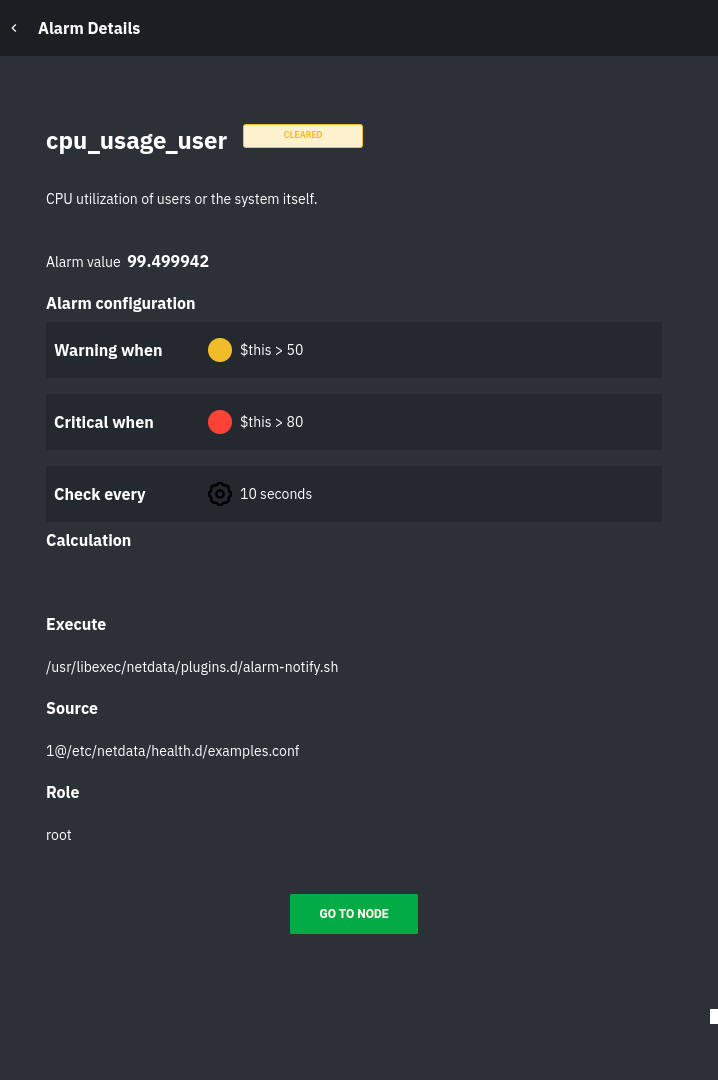 -## View active alarms in the Netdata Agent +## Local Netdata Agent dashboard Find the bell 🔔 icon in the top navigation to bring up a modal that shows currently raised alarms, all running alarms, and the alarms log. Here is an example of a raised `system.cpu` alarm, followed by the full list and alarm log: |