
diff options
Diffstat (limited to 'docs/monitor/view-active-alarms.md')
| -rw-r--r-- | docs/monitor/view-active-alarms.md | 14 |
1 files changed, 9 insertions, 5 deletions
diff --git a/docs/monitor/view-active-alarms.md b/docs/monitor/view-active-alarms.md index be218268..07c22fe1 100644 --- a/docs/monitor/view-active-alarms.md +++ b/docs/monitor/view-active-alarms.md @@ -1,7 +1,11 @@ <!-- title: "View active health alarms" description: "View active alarms and their rich data to discover and resolve anomalies and performance issues across your infrastructure." -custom_edit_url: https://github.com/netdata/netdata/edit/master/docs/monitor/view-active-alarms.md +custom_edit_url: "https://github.com/netdata/netdata/edit/master/docs/monitor/view-active-alarms.md" +sidebar_label: "View active health alarms" +learn_status: "Published" +learn_topic_type: "Concepts" +learn_rel_path: "Operations/Alerts" --> # View active health alarms @@ -14,7 +18,7 @@ performance issue affects your node or the applications it runs. A War Room's [alarms indicator](https://learn.netdata.cloud/docs/cloud/war-rooms#indicators) displays the number of active `critical` (red) and `warning` (yellow) alerts for the nodes in this War Room. Click on either the critical or warning badges to open a pre-filtered modal displaying only those types of [active -alarms](https://learn.netdata.cloud/docs/cloud/alerts-notifications/view-active-alerts). +alarms](https://github.com/netdata/netdata/blob/master/docs/cloud/alerts-notifications/view-active-alerts.mdx). 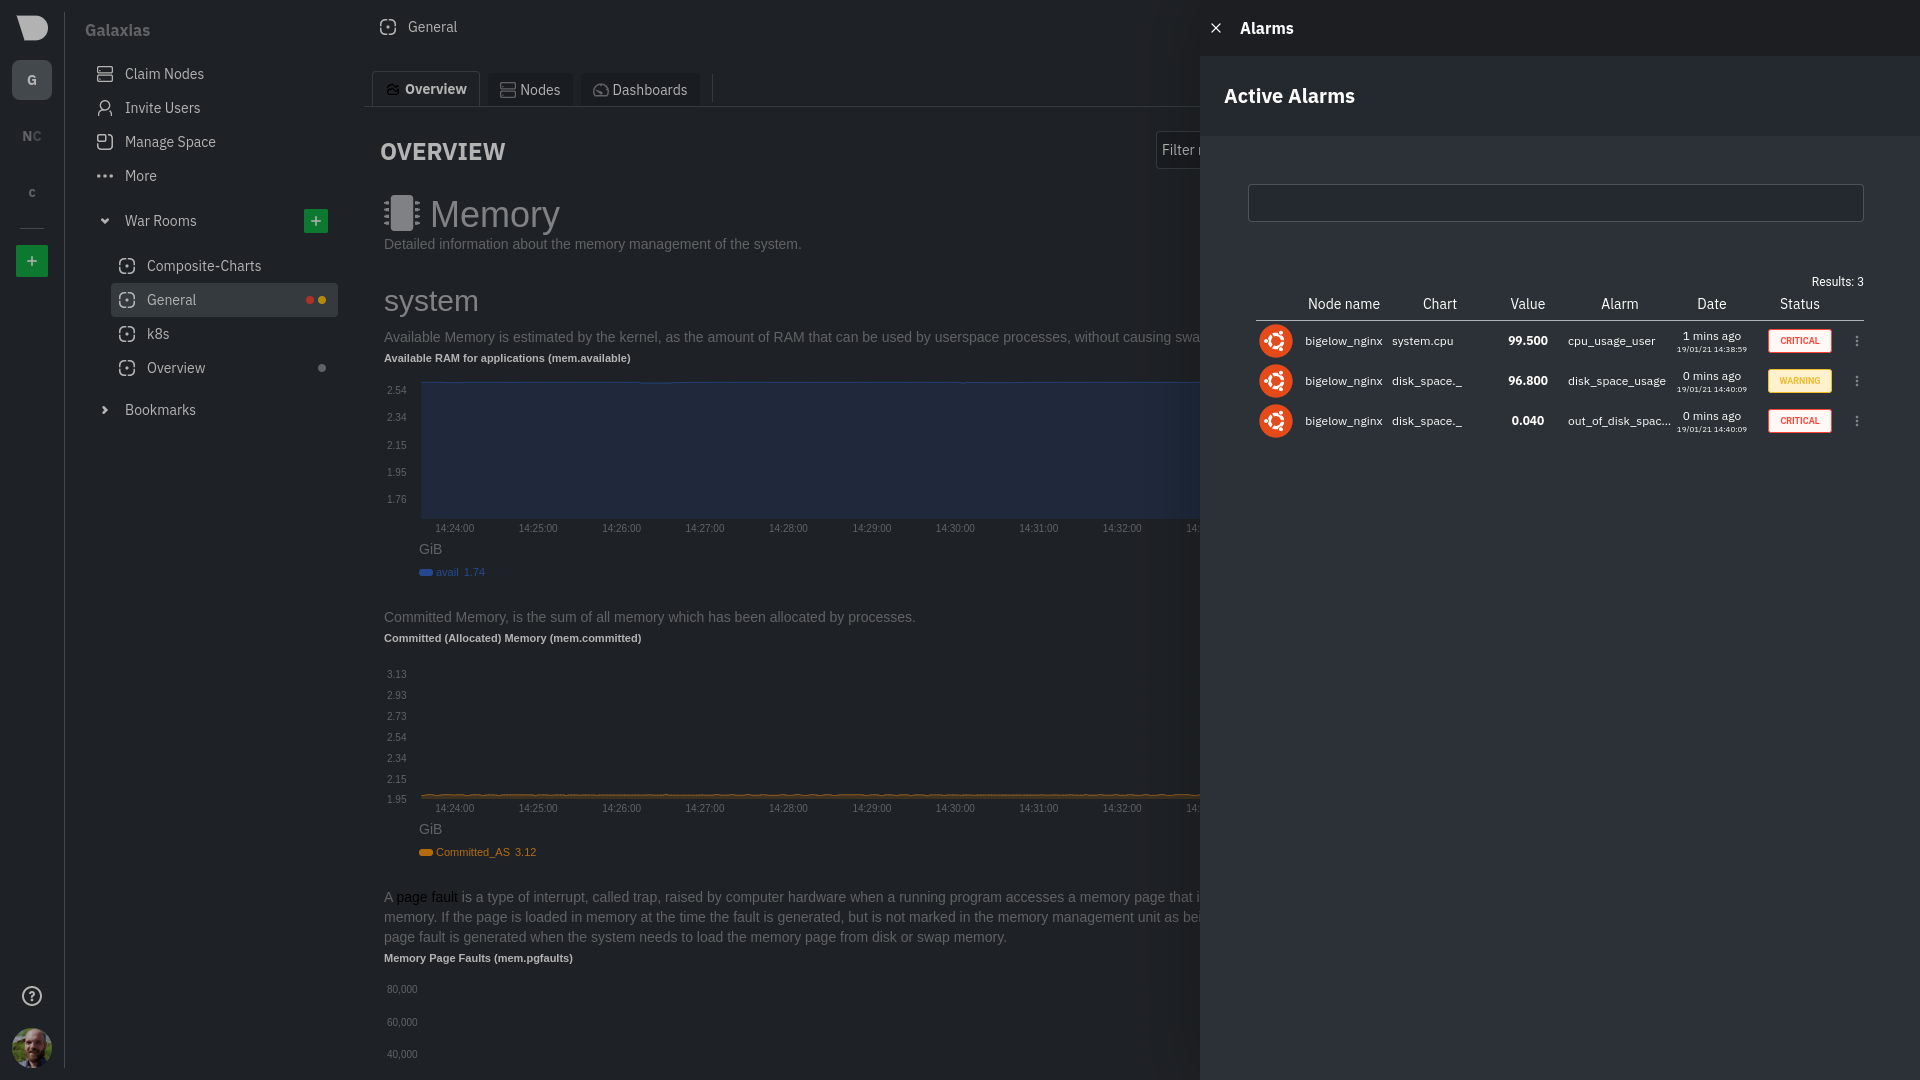 @@ -61,15 +65,15 @@ With the three icons beneath that and the **role** designation, you can: 3. Copy the code to embed the badge onto another web page using an `<embed>` element. The table on the right-hand side displays information about the health entity that triggered the alarm, which you can -use as a reference to [configure alarms](/docs/monitor/configure-alarms.md). +use as a reference to [configure alarms](https://github.com/netdata/netdata/blob/master/docs/monitor/configure-alarms.md). ## What's next? With the information that appears on Netdata Cloud and the local dashboard about active alarms, you can [configure -alarms](/docs/monitor/configure-alarms.md) to match your infrastructure's needs or your team's goals. +alarms](https://github.com/netdata/netdata/blob/master/docs/monitor/configure-alarms.md) to match your infrastructure's needs or your team's goals. If you're happy with the pre-configured alarms, skip ahead to [enable -notifications](/docs/monitor/enable-notifications.md) to use Netdata Cloud's centralized alarm notifications and/or +notifications](https://github.com/netdata/netdata/blob/master/docs/monitor/enable-notifications.md) to use Netdata Cloud's centralized alarm notifications and/or per-node notifications to endpoints like Slack, PagerDuty, Twilio, and more. |