
diff options
Diffstat (limited to 'docs/observability-centralization-points')
12 files changed, 974 insertions, 0 deletions
diff --git a/docs/observability-centralization-points/README.md b/docs/observability-centralization-points/README.md new file mode 100644 index 000000000..ede2037ad --- /dev/null +++ b/docs/observability-centralization-points/README.md @@ -0,0 +1,19 @@ +# Observability Centralization Points + +Netdata supports the creation of multiple independent **Observability Centralization Points**, aggregating metric samples, logs and metadata within an infrastructure. + +Observability Centralization Points are crucial for ensuring comprehensive monitoring and observability across an infrastructure, particularly under the following conditions: + +1. **Ephemeral Systems**: For systems like Kubernetes nodes or ephemeral VMs that may not be persistently available, centralization points ensure that metrics and logs are not lost when these systems go offline. This is essential for maintaining historical data for analysis and troubleshooting. + +2. **Resource Constraints**: In scenarios where the monitored systems lack sufficient resources (disk space or I/O bandwidth, CPU, RAM) to handle observability tasks effectively, centralization points offload these responsibilities, ensuring that production systems can operate efficiently without compromise. + +3. **Multi-node Dashboards without Netdata Cloud**: For environments requiring aggregated views across multiple nodes but without the use of Netdata Cloud, Netdata Parents can aggregate this data to provide comprehensive dashboards, similar to what Netdata Cloud offers. + +4. **Netdata Cloud Access Restrictions**: In cases where monitored systems cannot connect to Netdata Cloud (due to a firewall policy), a Netdata Parent can serve as a bridge, aggregating data and interfacing with Netdata Cloud on behalf of these restricted systems. + +When multiple independent centralization points are available: + +- Netdata Cloud queries all of them in parallel, to provide a unified infrastructure view. + +- Without Netdata Cloud, the dashboards of each of the Netdata Parents provide unified views of the infrastructure aggregated to each of them (metrics and logs). diff --git a/docs/observability-centralization-points/best-practices.md b/docs/observability-centralization-points/best-practices.md new file mode 100644 index 000000000..49bd3d6c3 --- /dev/null +++ b/docs/observability-centralization-points/best-practices.md @@ -0,0 +1,39 @@ +# Best Practices for Observability Centralization Points + +When planning the deployment of Observability Centralization Points, the following factors need consideration: + +1. **Volume of Monitored Systems**: The number of systems being monitored dictates the scaling and number of centralization points required. Larger infrastructures may necessitate multiple centralization points to manage the volume of data effectively and maintain performance. + +2. **Cost of Data Transfer**: Particularly in multi-cloud or hybrid environments, the location of centralization points can significantly impact egress bandwidth costs. Strategically placing centralization points in each data center or cloud region can minimize these costs by reducing the need for cross-network data transfer. + +3. **Usability without Netdata Cloud**: When not using Netdata Cloud, observability with Netdata is simpler when there are fewer centralization points, making it easier to remember where observability is and how to access it. + +4. When Netdata Cloud is used, infrastructure level views are provided independently of the centralization points, so it is preferable to centralize as required for security (e.g. internet access), cost control (e.g. egress bandwidth, dedicated resources) and operational efficiency (regions, services or teams isolation). + +## Cost Optimization + +Netdata has been designed for observability cost optimization. For optimal cost we recommend using Netdata Cloud and multiple independent observability centralization points: + +- **Scale out**: add more, smaller centralization points to distribute the load. This strategy provides the least resource consumption per unit of workload, maintaining optimal performance and resource efficiency across your observability infrastructure. + +- **Use existing infrastructure resources**: use spare capacities before allocating dedicated resources for observability. This approach minimizes additional costs and promotes an economically sustainable observability framework. + +- **Unified or separate centralization for logs and metrics**: Netdata allows centralizing metrics and logs together or separately. Consider factors such as access frequency, data retention policies, and compliance requirements to enhance performance and reduce costs. + +- **Decentralized configuration management**: each Netdata centralization point can have its own unique configuration for retention and alerts. This enables 1) finer control on infrastructure costs and 2) localized control for separate services or teams. + +## Pros and Cons + +Compared to other observability solutions, the design of Netdata offers: + +- **Enhanced Scalability and Flexibility**: Netdata's support for multiple independent observability centralization points allows for a more scalable and flexible architecture. This feature is particularly advantageous in distributed and complex environments, enabling tailored observability strategies that can vary by region, service, or team requirements. + +- **Resilience and Fault Tolerance**: The ability to deploy multiple centralization points also contributes to greater system resilience and fault tolerance. Replication is a native feature of Netdata centralization points, so in the event of a failure at one centralization point, others can continue to function, ensuring continuous observability. + +- **Optimized Cost and Performance**: By distributing the load across multiple centralization points, Netdata can optimize both performance and cost. This distribution allows for the efficient use of resources and help mitigate the bottlenecks associated with a single centralization point. + +- **Simplicity**: Netdata agents (Children and Parents) require minimal configuration and maintenance, usually less than the configuration and maintenance required for the agents and exporters of other monitoring solutions. This provides an observability pipeline that has less moving parts and is easier to manage and maintain. + +- **Always On-Prem**: Netdata centralization points are always on-prem. Even when Netdata Cloud is used, Netdata agents and parents are queried to provide the data required for the dashboards. + +- **Bottom-Up Observability**: Netdata is designed to monitor systems, containers and applications bottom-up, aiming to provide the maximum resolution, visibility, depth and insights possible. Its ability to segment the infrastructure into multiple independent observability centralization points with customized retention, machine learning and alerts on each of them, while providing unified infrastructure level dashboards at Netdata Cloud, provides a flexible environment that can be tailored per service or team, while still being one unified infrastructure. diff --git a/docs/observability-centralization-points/logs-centralization-points-with-systemd-journald/README.md b/docs/observability-centralization-points/logs-centralization-points-with-systemd-journald/README.md new file mode 100644 index 000000000..e40396a7e --- /dev/null +++ b/docs/observability-centralization-points/logs-centralization-points-with-systemd-journald/README.md @@ -0,0 +1,55 @@ +# Logs Centralization Points with systemd-journald + +```mermaid +stateDiagram-v2 + classDef userFeature fill:#f00,color:white,font-weight:bold,stroke-width:2px,stroke:orange + classDef usedByNC fill:#090,color:white,font-weight:bold,stroke-width:2px,stroke:orange + classDef log2journal fill:#040,color:white,font-weight:bold,stroke-width:2px,stroke:orange + + logsQuery:::usedByNC + logsDashboard:::userFeature + journald:::thirdparty + journalRemote:::thirdparty + journalUpload:::thirdparty + journalFiles:::thirdparty + logSources:::thirdparty + textFiles:::thirdparty + log2journal:::log2journal + + journalRemote: systemd-journal-remote + journalUpload: systemd-journal-upload + journalFiles: Store + journalFiles: systemd-journal files + journald: systemd-journald + logSources: Local Logs Sources + log2journal:log2journal + log2journal:Convert text, json, logfmt files + log2journal:to structured journal entries. + logsDashboard: Netdata Dashboards + logsQuery: Query Journal Files + textFiles: Text Log Files + + logSources --> journald: journald API + logSources --> textFiles: write to log files + textFiles --> log2journal: tail log files + log2journal --> journald: journald API + journald --> journalFiles + + journalFiles --> Netdata + journalFiles --> journalUpload + + journalRemote -->journalFiles + journalUpload --> [*]: to a remote journald + [*] --> journalRemote: from a remote journald + + state Netdata { + [*]-->logsQuery + logsQuery --> logsDashboard + } +``` + +Logs centralization points can be built using the `systemd-journald` methodologies, by configuring `systemd-journal-remote` (on the centralization point) and `systemd-journal-upload` (on the production system). + +The logs centralization points and the metrics centralization points do not need to be the same. For clarity and simplicity however, when not otherwise required for operational or regulatory reasons, we recommend to have unified centralization points for both metrics and logs. + +A Netdata running at the logs centralization point, will automatically detect and present the logs of all servers aggregated to it in a unified way (i.e. logs from all servers multiplexed in the same view). This Netdata may or may not be a Netdata Parent for metrics. diff --git a/docs/observability-centralization-points/logs-centralization-points-with-systemd-journald/active-journal-source-without-encryption.md b/docs/observability-centralization-points/logs-centralization-points-with-systemd-journald/active-journal-source-without-encryption.md new file mode 100644 index 000000000..cbed1e81e --- /dev/null +++ b/docs/observability-centralization-points/logs-centralization-points-with-systemd-journald/active-journal-source-without-encryption.md @@ -0,0 +1,126 @@ +# Active journal source without encryption + +This page will guide you through creating an active journal source without the use of encryption. + +Once you enable an active journal source on a server, `systemd-journal-gatewayd` will expose an REST API on TCP port 19531. This API can be used for querying the logs, exporting the logs, or monitoring new log entries, remotely. + +> ⚠️ **IMPORTANT**<br/> +> These instructions will expose your logs to the network, without any encryption or authorization.<br/> +> DO NOT USE THIS ON NON-TRUSTED NETWORKS. + +## Configuring an active journal source + +On the server you want to expose their logs, install `systemd-journal-gateway`. + +```bash +# change this according to your distro +sudo apt-get install systemd-journal-gateway +``` + +Optionally, if you want to change the port (the default is `19531`), edit `systemd-journal-gatewayd.socket` + +```bash +# edit the socket file +sudo systemctl edit systemd-journal-gatewayd.socket +``` + +and add the following lines into the instructed place, and choose your desired port; save and exit. + +```bash +[Socket] +ListenStream=<DESIRED_PORT> +``` + +Finally, enable it, so that it will start automatically upon receiving a connection: + +```bash +# enable systemd-journal-remote +sudo systemctl daemon-reload +sudo systemctl enable --now systemd-journal-gatewayd.socket +``` + +## Using the active journal source + +### Simple Logs Explorer + +`systemd-journal-gateway` provides a simple HTML5 application to browse the logs. + +To use it, open your web browser and navigate to: + +``` +http://server.ip:19531/browse +``` + +A simple page like this will be presented: + +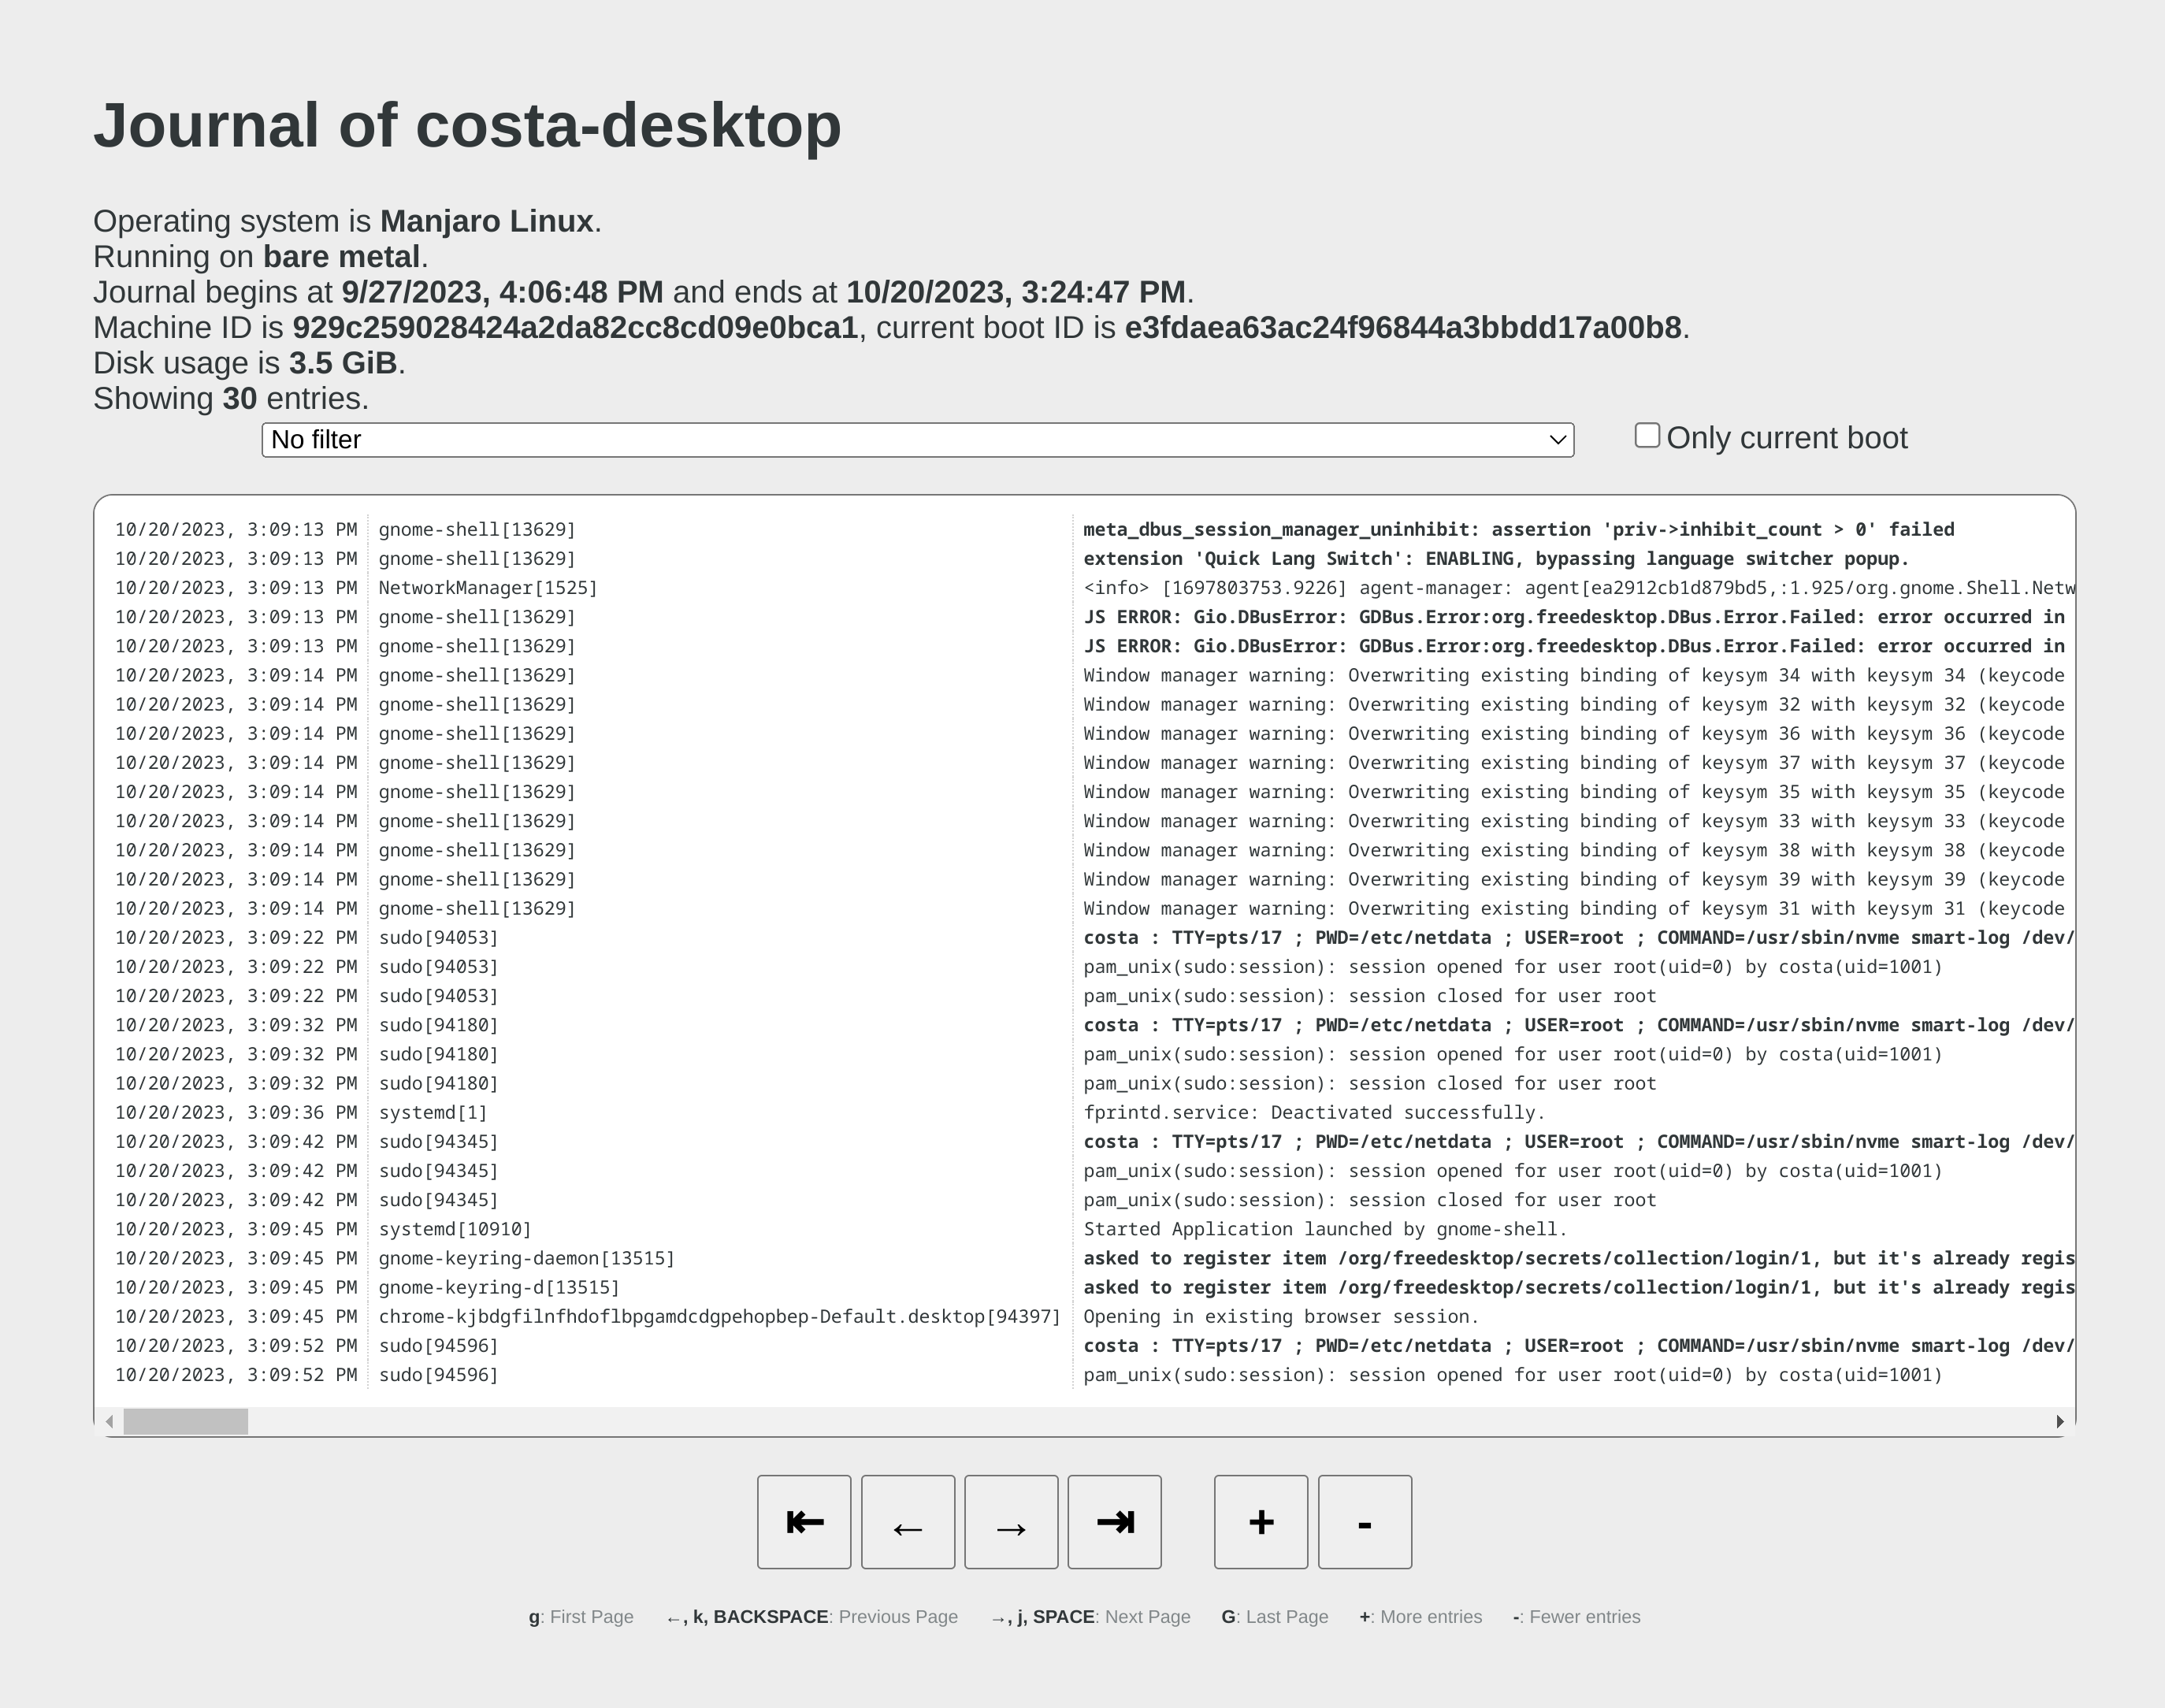 + +### Use it with `curl` + +`man systemd-journal-gatewayd` documents the supported API methods and provides examples to query the API using `curl` commands. + +### Copying the logs to a central journals server + +`systemd-journal-remote` has the ability to query instances of `systemd-journal-gatewayd` to fetch their logs, so that the central server fetches the logs, instead of waiting for the individual servers to push their logs to it. + +However, this kind of logs centralization has a key problem: **there is no guarantee that there will be no gaps in the logs replicated**. Theoretically, the REST API of `systemd-journal-gatewayd` supports querying past data, and `systemd-journal-remote` could keep track of the state of replication and automatically continue from the point it stopped last time. But it does not. So, currently the best logs centralization option is to use a **passive** centralization, where the clients push their logs to the server. + +Given these limitations, if you still want to configure an **active** journals centralization, this is what you need to do: + +On the centralization server install `systemd-journal-remote`: + +```bash +# change this according to your distro +sudo apt-get install systemd-journal-remote +``` + +Then, copy `systemd-journal-remote.service` to configure it for querying the active source: + +```bash +# replace "clientX" with the name of the active client node +sudo cp /lib/systemd/system/systemd-journal-remote.service /etc/systemd/system/systemd-journal-remote-clientX.service + +# edit it to make sure it the ExecStart line is like this: +# ExecStart=/usr/lib/systemd/systemd-journal-remote --url http://clientX:19531/entries?follow +sudo nano /etc/systemd/system/systemd-journal-remote-clientX.service + +# reload systemd +sudo systemctl daemon-reload +``` + +```bash +# enable systemd-journal-remote +sudo systemctl enable --now systemd-journal-remote-clientX.service +``` + +You can repeat this process to create as many `systemd-journal-remote` services, as the active source you have. + +## Verify it works + +To verify the central server is receiving logs, run this on the central server: + +```bash +sudo ls -l /var/log/journal/remote/ +``` + +You should see new files from the client's hostname or IP. + +Also, any of the new service files (`systemctl status systemd-journal-clientX`) should show something like this: + +```bash +● systemd-journal-clientX.service - Fetching systemd journal logs from 192.168.2.146 + Loaded: loaded (/etc/systemd/system/systemd-journal-clientX.service; enabled; preset: disabled) + Drop-In: /usr/lib/systemd/system/service.d + └─10-timeout-abort.conf + Active: active (running) since Wed 2023-10-18 07:35:52 EEST; 23min ago + Main PID: 77959 (systemd-journal) + Tasks: 2 (limit: 6928) + Memory: 7.7M + CPU: 518ms + CGroup: /system.slice/systemd-journal-clientX.service + ├─77959 /usr/lib/systemd/systemd-journal-remote --url "http://192.168.2.146:19531/entries?follow" + └─77962 curl "-HAccept: application/vnd.fdo.journal" --silent --show-error "http://192.168.2.146:19531/entries?follow" + +Oct 18 07:35:52 systemd-journal-server systemd[1]: Started systemd-journal-clientX.service - Fetching systemd journal logs from 192.168.2.146. +Oct 18 07:35:52 systemd-journal-server systemd-journal-remote[77959]: Spawning curl http://192.168.2.146:19531/entries?follow... +``` diff --git a/docs/observability-centralization-points/logs-centralization-points-with-systemd-journald/passive-journal-centralization-with-encryption-using-self-signed-certificates.md b/docs/observability-centralization-points/logs-centralization-points-with-systemd-journald/passive-journal-centralization-with-encryption-using-self-signed-certificates.md new file mode 100644 index 000000000..7f0b7152e --- /dev/null +++ b/docs/observability-centralization-points/logs-centralization-points-with-systemd-journald/passive-journal-centralization-with-encryption-using-self-signed-certificates.md @@ -0,0 +1,249 @@ +# Passive journal centralization with encryption using self-signed certificates + +This page will guide you through creating a **passive** journal centralization setup using **self-signed certificates** for encryption and authorization. + +Once you centralize your infrastructure logs to a server, Netdata will automatically detect all the logs from all servers and organize them in sources. With the setup described in this document, on recent systemd versions, Netdata will automatically name all remote sources using the names of the clients, as they are described at their certificates (on older versions, the names will be IPs or reverse DNS lookups of the IPs). + +A **passive** journal server waits for clients to push their metrics to it, so in this setup we will: + +1. configure a certificates authority and issue self-signed certificates for your servers. +2. configure `systemd-journal-remote` on the server, to listen for incoming connections. +3. configure `systemd-journal-upload` on the clients, to push their logs to the server. + +Keep in mind that the authorization involved works like this: + +1. The server (`systemd-journal-remote`) validates that the client (`systemd-journal-upload`) uses a trusted certificate (a certificate issued by the same certificate authority as its own). + So, **the server will accept logs from any client having a valid certificate**. +2. The client (`systemd-journal-upload`) validates that the receiver (`systemd-journal-remote`) uses a trusted certificate (like the server does) and it also checks that the hostname or IP of the URL specified to its configuration, matches one of the names or IPs of the server it gets connected to. So, **the client does a validation that it connected to the right server**, using the URL hostname against the names and IPs of the server on its certificate. + +This means, that if both certificates are issued by the same certificate authority, only the client can potentially reject the server. + +## Self-signed certificates + +To simplify the process of creating and managing self-signed certificates, we have created [this bash script](https://github.com/netdata/netdata/blob/master/src/collectors/systemd-journal.plugin/systemd-journal-self-signed-certs.sh). + +This helps to also automate the distribution of the certificates to your servers (it generates a new bash script for each of your servers, which includes everything required, including the certificates). + +We suggest to keep this script and all the involved certificates at the journals centralization server, in the directory `/etc/ssl/systemd-journal`, so that you can make future changes as required. If you prefer to keep the certificate authority and all the certificates at a more secure location, just use the script on that location. + +On the server that will issue the certificates (usually the centralizaton server), do the following: + +```bash +# install systemd-journal-remote to add the users and groups required and openssl for the certs +# change this according to your distro +sudo apt-get install systemd-journal-remote openssl + +# download the script and make it executable +curl >systemd-journal-self-signed-certs.sh "https://raw.githubusercontent.com/netdata/netdata/master/src/collectors/systemd-journal.plugin/systemd-journal-self-signed-certs.sh" +chmod 750 systemd-journal-self-signed-certs.sh +``` + +To create certificates for your servers, run this: + +```bash +sudo ./systemd-journal-self-signed-certs.sh "server1" "DNS:hostname1" "IP:10.0.0.1" +``` + +Where: + +- `server1` is the canonical name of the server. On newer systemd version, this name will be used by `systemd-journal-remote` and Netdata when you view the logs on the dashboard. +- `DNS:hostname1` is a DNS name that the server is reachable at. Add `"DNS:xyz"` multiple times to define multiple DNS names for the server. +- `IP:10.0.0.1` is an IP that the server is reachable at. Add `"IP:xyz"` multiple times to define multiple IPs for the server. + +Repeat this process to create the certificates for all your servers. You can add servers as required, at any time in the future. + +Existing certificates are never re-generated. Typically certificates need to be revoked and new ones to be issued. But `systemd-journal-remote` tools do not support handling revocations. So, the only option you have to re-issue a certificate is to delete its files in `/etc/ssl/systemd-journal` and run the script again to create a new one. + +Once you run the script of each of your servers, in `/etc/ssl/systemd-journal` you will find shell scripts named `runme-on-XXX.sh`, where `XXX` are the canonical names of your servers. + +These `runme-on-XXX.sh` include everything to install the certificates, fix their file permissions to be accessible by `systemd-journal-remote` and `systemd-journal-upload`, and update `/etc/systemd/journal-remote.conf` and `/etc/systemd/journal-upload.conf`. + +You can copy and paste (or `scp`) these scripts on your server and each of your clients: + +```bash +sudo scp /etc/ssl/systemd-journal/runme-on-XXX.sh XXX:/tmp/ +``` + +For the rest of this guide, we assume that you have copied the right `runme-on-XXX.sh` at the `/tmp` of all the servers for which you issued certificates. + +### note about certificates file permissions + +It is worth noting that `systemd-journal` certificates need to be owned by `systemd-journal-remote:systemd-journal`. + +Both the user `systemd-journal-remote` and the group `systemd-journal` are automatically added by the `systemd-journal-remote` package. However, `systemd-journal-upload` (and `systemd-journal-gatewayd` - that is not used in this guide) use dynamic users. Thankfully they are added to the `systemd-journal` remote group. + +So, by having the certificates owned by `systemd-journal-remote:systemd-journal`, satisfies both `systemd-journal-remote` which is not in the `systemd-journal` group, and `systemd-journal-upload` (and `systemd-journal-gatewayd`) which use dynamic users. + +You don't need to do anything about it (the scripts take care of everything), but it is worth noting how this works. + +## Server configuration + +On the centralization server install `systemd-journal-remote`: + +```bash +# change this according to your distro +sudo apt-get install systemd-journal-remote +``` + +Make sure the journal transfer protocol is `https`: + +```bash +sudo cp /lib/systemd/system/systemd-journal-remote.service /etc/systemd/system/ + +# edit it to make sure it says: +# --listen-https=-3 +# not: +# --listen-http=-3 +sudo nano /etc/systemd/system/systemd-journal-remote.service + +# reload systemd +sudo systemctl daemon-reload +``` + +Optionally, if you want to change the port (the default is `19532`), edit `systemd-journal-remote.socket` + +```bash +# edit the socket file +sudo systemctl edit systemd-journal-remote.socket +``` + +and add the following lines into the instructed place, and choose your desired port; save and exit. + +```bash +[Socket] +ListenStream=<DESIRED_PORT> +``` + +Next, run the `runme-on-XXX.sh` script on the server: + +```bash +# if you run the certificate authority on the server: +sudo /etc/ssl/systemd-journal/runme-on-XXX.sh + +# if you run the certificate authority elsewhere, +# assuming you have coped the runme-on-XXX.sh script (as described above): +sudo bash /tmp/runme-on-XXX.sh +``` + +This will install the certificates in `/etc/ssl/systemd-journal`, set the right file permissions, and update `/etc/systemd/journal-remote.conf` and `/etc/systemd/journal-upload.conf` to use the right certificate files. + +Finally, enable it, so that it will start automatically upon receiving a connection: + +```bash +# enable systemd-journal-remote +sudo systemctl enable --now systemd-journal-remote.socket +sudo systemctl enable systemd-journal-remote.service +``` + +`systemd-journal-remote` is now listening for incoming journals from remote hosts. + +> When done, remember to `rm /tmp/runme-on-*.sh` to make sure your certificates are secure. + +## Client configuration + +On the clients, install `systemd-journal-remote` (it includes `systemd-journal-upload`): + +```bash +# change this according to your distro +sudo apt-get install systemd-journal-remote +``` + +Edit `/etc/systemd/journal-upload.conf` and set the IP address and the port of the server, like so: + +```conf +[Upload] +URL=https://centralization.server.ip:19532 +``` + +Make sure that `centralization.server.ip` is one of the `DNS:` or `IP:` parameters you defined when you created the centralization server certificates. If it is not, the client may reject to connect. + +Next, edit `systemd-journal-upload.service`, and add `Restart=always` to make sure the client will keep trying to push logs, even if the server is temporarily not there, like this: + +```bash +sudo systemctl edit systemd-journal-upload.service +``` + +At the top, add: + +```conf +[Service] +Restart=always +``` + +Enable `systemd-journal-upload.service`, like this: + +```bash +sudo systemctl enable systemd-journal-upload.service +``` + +Assuming that you have in `/tmp` the relevant `runme-on-XXX.sh` script for this client, run: + +```bash +sudo bash /tmp/runme-on-XXX.sh +``` + +This will install the certificates in `/etc/ssl/systemd-journal`, set the right file permissions, and update `/etc/systemd/journal-remote.conf` and `/etc/systemd/journal-upload.conf` to use the right certificate files. + +Finally, restart `systemd-journal-upload.service`: + +```bash +sudo systemctl restart systemd-journal-upload.service +``` + +The client should now be pushing logs to the central server. + +> When done, remember to `rm /tmp/runme-on-*.sh` to make sure your certificates are secure. + +Here it is in action, in Netdata: + + + +## Verify it works + +To verify the central server is receiving logs, run this on the central server: + +```bash +sudo ls -l /var/log/journal/remote/ +``` + +Depending on the `systemd` version you use, you should see new files from the clients' canonical names (as defined at their certificates) or IPs. + +Also, `systemctl status systemd-journal-remote` should show something like this: + +```bash +systemd-journal-remote.service - Journal Remote Sink Service + Loaded: loaded (/etc/systemd/system/systemd-journal-remote.service; indirect; preset: disabled) + Active: active (running) since Sun 2023-10-15 14:29:46 EEST; 2h 24min ago +TriggeredBy: ● systemd-journal-remote.socket + Docs: man:systemd-journal-remote(8) + man:journal-remote.conf(5) + Main PID: 2118153 (systemd-journal) + Status: "Processing requests..." + Tasks: 1 (limit: 154152) + Memory: 2.2M + CPU: 71ms + CGroup: /system.slice/systemd-journal-remote.service + └─2118153 /usr/lib/systemd/systemd-journal-remote --listen-https=-3 --output=/var/log/journal/remote/ +``` + +Note the `status: "Processing requests..."` and the PID under `CGroup`. + +On the client `systemctl status systemd-journal-upload` should show something like this: + +```bash +● systemd-journal-upload.service - Journal Remote Upload Service + Loaded: loaded (/lib/systemd/system/systemd-journal-upload.service; enabled; vendor preset: disabled) + Drop-In: /etc/systemd/system/systemd-journal-upload.service.d + └─override.conf + Active: active (running) since Sun 2023-10-15 10:39:04 UTC; 3h 17min ago + Docs: man:systemd-journal-upload(8) + Main PID: 4169 (systemd-journal) + Status: "Processing input..." + Tasks: 1 (limit: 13868) + Memory: 3.5M + CPU: 1.081s + CGroup: /system.slice/systemd-journal-upload.service + └─4169 /lib/systemd/systemd-journal-upload --save-state +``` + +Note the `Status: "Processing input..."` and the PID under `CGroup`. diff --git a/docs/observability-centralization-points/logs-centralization-points-with-systemd-journald/passive-journal-centralization-without-encryption.md b/docs/observability-centralization-points/logs-centralization-points-with-systemd-journald/passive-journal-centralization-without-encryption.md new file mode 100644 index 000000000..b70c22033 --- /dev/null +++ b/docs/observability-centralization-points/logs-centralization-points-with-systemd-journald/passive-journal-centralization-without-encryption.md @@ -0,0 +1,150 @@ +# Passive journal centralization without encryption + +This page will guide you through creating a passive journal centralization setup without the use of encryption. + +Once you centralize your infrastructure logs to a server, Netdata will automatically detects all the logs from all servers and organize them in sources. +With the setup described in this document, journal files are identified by the IPs of the clients sending the logs. Netdata will automatically do +reverse DNS lookups to find the names of the server and name the sources on the dashboard accordingly. + +A _passive_ journal server waits for clients to push their metrics to it, so in this setup we will: + +1. configure `systemd-journal-remote` on the server, to listen for incoming connections. +2. configure `systemd-journal-upload` on the clients, to push their logs to the server. + +> ⚠️ **IMPORTANT**<br/> +> These instructions will copy your logs to a central server, without any encryption or authorization.<br/> +> DO NOT USE THIS ON NON-TRUSTED NETWORKS. + +## Server configuration + +On the centralization server install `systemd-journal-remote`: + +```bash +# change this according to your distro +sudo apt-get install systemd-journal-remote +``` + +Make sure the journal transfer protocol is `http`: + +```bash +sudo cp /lib/systemd/system/systemd-journal-remote.service /etc/systemd/system/ + +# edit it to make sure it says: +# --listen-http=-3 +# not: +# --listen-https=-3 +sudo nano /etc/systemd/system/systemd-journal-remote.service + +# reload systemd +sudo systemctl daemon-reload +``` + +Optionally, if you want to change the port (the default is `19532`), edit `systemd-journal-remote.socket` + +```bash +# edit the socket file +sudo systemctl edit systemd-journal-remote.socket +``` + +and add the following lines into the instructed place, and choose your desired port; save and exit. + +```bash +[Socket] +ListenStream=<DESIRED_PORT> +``` + +Finally, enable it, so that it will start automatically upon receiving a connection: + +```bash +# enable systemd-journal-remote +sudo systemctl enable --now systemd-journal-remote.socket +sudo systemctl enable systemd-journal-remote.service +``` + +`systemd-journal-remote` is now listening for incoming journals from remote hosts. + +## Client configuration + +On the clients, install `systemd-journal-remote` (it includes `systemd-journal-upload`): + +```bash +# change this according to your distro +sudo apt-get install systemd-journal-remote +``` + +Edit `/etc/systemd/journal-upload.conf` and set the IP address and the port of the server, like so: + +```conf +[Upload] +URL=http://centralization.server.ip:19532 +``` + +Edit `systemd-journal-upload`, and add `Restart=always` to make sure the client will keep trying to push logs, even if the server is temporarily not there, like this: + +```bash +sudo systemctl edit systemd-journal-upload +``` + +At the top, add: + +```conf +[Service] +Restart=always +``` + +Enable and start `systemd-journal-upload`, like this: + +```bash +sudo systemctl enable systemd-journal-upload +sudo systemctl start systemd-journal-upload +``` + +## Verify it works + +To verify the central server is receiving logs, run this on the central server: + +```bash +sudo ls -l /var/log/journal/remote/ +``` + +You should see new files from the client's IP. + +Also, `systemctl status systemd-journal-remote` should show something like this: + +```bash +systemd-journal-remote.service - Journal Remote Sink Service + Loaded: loaded (/etc/systemd/system/systemd-journal-remote.service; indirect; preset: disabled) + Active: active (running) since Sun 2023-10-15 14:29:46 EEST; 2h 24min ago +TriggeredBy: ● systemd-journal-remote.socket + Docs: man:systemd-journal-remote(8) + man:journal-remote.conf(5) + Main PID: 2118153 (systemd-journal) + Status: "Processing requests..." + Tasks: 1 (limit: 154152) + Memory: 2.2M + CPU: 71ms + CGroup: /system.slice/systemd-journal-remote.service + └─2118153 /usr/lib/systemd/systemd-journal-remote --listen-http=-3 --output=/var/log/journal/remote/ +``` + +Note the `status: "Processing requests..."` and the PID under `CGroup`. + +On the client `systemctl status systemd-journal-upload` should show something like this: + +```bash +● systemd-journal-upload.service - Journal Remote Upload Service + Loaded: loaded (/lib/systemd/system/systemd-journal-upload.service; enabled; vendor preset: disabled) + Drop-In: /etc/systemd/system/systemd-journal-upload.service.d + └─override.conf + Active: active (running) since Sun 2023-10-15 10:39:04 UTC; 3h 17min ago + Docs: man:systemd-journal-upload(8) + Main PID: 4169 (systemd-journal) + Status: "Processing input..." + Tasks: 1 (limit: 13868) + Memory: 3.5M + CPU: 1.081s + CGroup: /system.slice/systemd-journal-upload.service + └─4169 /lib/systemd/systemd-journal-upload --save-state +``` + +Note the `Status: "Processing input..."` and the PID under `CGroup`. diff --git a/docs/observability-centralization-points/metrics-centralization-points/README.md b/docs/observability-centralization-points/metrics-centralization-points/README.md new file mode 100644 index 000000000..0efdacd41 --- /dev/null +++ b/docs/observability-centralization-points/metrics-centralization-points/README.md @@ -0,0 +1,48 @@ + +# Metrics Centralization Points (Netdata Parents) + +```mermaid +flowchart BT + C1["Netdata Child 1"] + C2["Netdata Child 2"] + C3["Netdata Child N"] + P1["Netdata Parent 1"] + C1 -->|stream| P1 + C2 -->|stream| P1 + C3 -->|stream| P1 +``` + +Netdata **Streaming and Replication** copies the recent past samples (replication) and in real-time all new samples collected (streaming) from production systems (Netdata Children) to metrics centralization points (Netdata Parents). The Netdata Parents then maintain the database for these metrics, according to their retention settings. + +Each production system (Netdata Child) can stream to **only one** Netdata Parent at a time. The configuration allows configuring multiple Netdata Parents for high availability, but only the first found working will be used. + +Netdata Parents receive metric samples **from multiple** production systems (Netdata Children) and have the option to re-stream them to another Netdata Parent. This allows building an infinite hierarchy of Netdata Parents. It also enables the configuration of Netdata Parents Clusters, for high availability. + +| Feature | Netdata Child (production system) | Netdata Parent (centralization point) | +|:---------------------------:|:--------------------------------------------------------------------------------------------------------------------------------------------------:|:-------------------------------------------------------------------------------:| +| Metrics Retention | Can be minimized, or switched to mode `ram` or `alloc` to save resources. Some retention is required in case network errors introduce disconnects. | Common retention settings for all systems aggregated to it. | +| Machine Learning | Can be disabled (enabled by default). | Runs Anomaly Detection for all systems aggregated to it. | +| Alerts & Notifications | Can be disabled (enabled by default). | Runs health checks and sends notifications for all systems aggregated to it. | +| API and Dashboard | Can be disabled (enabled by default). | Serves the dashboard for all systems aggregated to it, using its own retention. | +| Exporting Metrics | Not required (enabled by default). | Exports the samples of all metrics collected by the systems aggregated to it. | +| Netdata Functions | Netdata Child must be online. | Forwards Functions requests to the Children connected to it. | +| Connection to Netdata Cloud | Not required. | Each Netdata Parent registers to Netdata Cloud all systems aggregated to it. | + +## Supported Configurations + +For Netdata Children: + +1. **Full**: Full Netdata functionality is available at the Children. This means running machine learning, alerts, notifications, having the local dashboard available, and generally all Netdata features enabled. This is the default. +2. **Thin**: The Children are only collecting and forwarding metrics to a Parent. Some local retention may exist to avoid missing samples in case of network issues or Parent maintenance, but everything else is disabled. + +For Netdata Parents: + +1. **Standalone**: The Parent is standalone, either the only Parent available in the infrastructure, or the top-most of an hierarchy of Parents. +2. **Cluster**: The Parent is part of a cluster of Parents, all having the same data, from the same Children. A Cluster of Parents offers high-availability. +3. **Proxy**: The Parent receives metrics and stores them locally, but it also forwards them to a Grand Parent. + +A Cluster is configured as a number of circular **Proxies**, ie. each of the nodes in a cluster has all the others configured as its Parents. So, if multiple levels of metrics centralization points (Netdata Parents) are required, only the top-most level can be a cluster. + +## Best Practices + +Refer to [Best Practices for Observability Centralization Points](https://github.com/netdata/netdata/blob/master/docs/observability-centralization-points/best-practices.md). diff --git a/docs/observability-centralization-points/metrics-centralization-points/clustering-and-high-availability-of-netdata-parents.md b/docs/observability-centralization-points/metrics-centralization-points/clustering-and-high-availability-of-netdata-parents.md new file mode 100644 index 000000000..d2202960f --- /dev/null +++ b/docs/observability-centralization-points/metrics-centralization-points/clustering-and-high-availability-of-netdata-parents.md @@ -0,0 +1,50 @@ +# Clustering and High Availability of Netdata Parents + +```mermaid +flowchart BT + C1["Netdata Child 1"] + C2["Netdata Child 2"] + C3["Netdata Child N"] + P1["Netdata Parent 1"] + P2["Netdata Parent 2"] + C1 & C2 & C3 -->|stream| P1 + P1 -->|stream| P2 + C1 & C2 & C3 .->|failover| P2 + P2 .->|failover| P1 +``` + +Netdata supports building Parent clusters of 2+ nodes. Clustering and high availability works like this: + +1. All Netdata Children are configured to stream to all Netdata Parents. The first one found working will be used by each Netdata Child and the others will be automatically used if and when this connection is interrupted. +2. The Netdata Parents are configured to stream to all other Netdata Parents. For each of them, the first found working will be used and the others will be automatically used if and when this connection is interrupted. + +All the Netdata Parents in such a cluster will receive all the metrics of all Netdata Children connected to any of them. They will also receive the metrics all the other Netdata Parents have. + +In case there is a failure on any of the Netdata Parents, the Netdata Children connected to it will automatically failover to another available Netdata Parent, which now will attempt to re-stream all the metrics it receives to the other available Netdata Parents. + +Netdata Cloud will receive registrations for all Netdata Children from all the Netdata Parents. As long as at least one of the Netdata Parents is connected to Netdata Cloud, all the Netdata Children will be available on Netdata Cloud. + +Netdata Children need to maintain a retention only for the time required to switch Netdata Parents. When Netdata Children connect to a Netdata Parent, they negotiate the available retention and any missing data on the Netdata Parent are replicated from the Netdata Children. + +## Restoring a Netdata Parent after maintenance + +Given the [replication limitations](https://github.com/netdata/netdata/blob/master/docs/observability-centralization-points/metrics-centralization-points/replication-of-past-samples.md#replication-limitations), special care is needed when restoring a Netdata Parent after some long maintenance work on it. + +If the Netdata Children do not have enough retention to replicate the missing data on this Netdata Parent, it is preferable to block access to this Netdata Parent from the Netdata Children, until it replicates the missing data from the other Netdata Parents. + +To block access from Netdata Children, and still allow access from other Netdata Parent siblings: + +1. Use `iptables` to block access to port 19999 from Netdata Children to the restored Netdata Parent, or +2. Use separate streaming API keys (in `stream.conf`) for Netdata Children and Netdata Parents, and disable the API key used by Netdata Children, until the restored Netdata Parent has been synchronized. + +## Duplicating a Parent + +The easiest way is to `rsync` the directory `/var/cache/netdata` from the existing Netdata Parent to the new Netdata Parent. + +> Important: Starting the new Netdata Parent with default settings, may delete the new files in `/var/cache/netdata` to apply the default disk size constraints. Therefore it is important to set the right retention settings in the new Netdata Parent before starting it up with the copied files. + +To configure retention at the new Netdata Parent, set in `netdata.conf` the following to at least the values the old Netdata Parent has: + +- `[db].dbengine multihost disk space MB`, this is the max disk size for `tier0`. The default is 256MiB. +- `[db].dbengine tier 1 multihost disk space MB`, this is the max disk space for `tier1`. The default is 50% of `tier0`. +- `[db].dbengine tier 2 multihost disk space MB`, this is the max disk space for `tier2`. The default is 50% of `tier1`. diff --git a/docs/observability-centralization-points/metrics-centralization-points/configuration.md b/docs/observability-centralization-points/metrics-centralization-points/configuration.md new file mode 100644 index 000000000..e52f7309f --- /dev/null +++ b/docs/observability-centralization-points/metrics-centralization-points/configuration.md @@ -0,0 +1,105 @@ +# Configuring Metrics Centralization Points + +Metrics streaming configuration for both Netdata Children and Parents is done via `stream.conf`. + +`netdata.conf` and `stream.conf` have the same `ini` format, but `netdata.conf` is considered a non-sensitive file, while `stream.conf` contains API keys, IPs and other sensitive information that enable communication between Netdata agents. + +`stream.conf` has 2 main sections: + +- The `[stream]` section includes options for the **sending Netdata** (ie Netdata Children, or Netdata Parents that stream to Grand Parents, or to other sibling Netdata Parents in a cluster). +- The rest includes multiple sections that define API keys for the **receiving Netdata** (ie. Netdata Parents). + +## Edit `stream.conf` + +To edit `stream.conf`, run this on your terminal: + +```bash +cd /etc/netdata 2>/dev/null || cd /opt/netdata/etc/netdata +sudo ./edit-config stream.conf +``` + +Your editor will open, with defaults and commented `stream.conf` options. + +## Configuring a Netdata Parent + +To enable the reception of metrics from Netdata Children, generate a random API key with this command: + +```bash +uuidgen +``` + +Then, copy the UUID generated, [edit `stream.conf`](#edit-stream.conf), find the section that reads like the following and replace `API_KEY` with the UUID you generated: + +```ini +[API_KEY] + # Accept metrics streaming from other Agents with the specified API key + enabled = yes +``` + +Save the file and restart Netdata. + +## Configuring Netdata Children + +To enable streaming metrics to a Netdata Parent, [edit `stream.conf`](#edit-stream.conf), and at the `[stream]` section at the top, set: + +```ini +[stream] + # Stream metrics to another Netdata + enabled = yes + # The IP and PORT of the parent + destination = PARENT_IP_ADDRESS:19999 + # The shared API key, generated by uuidgen + api key = API_KEY +``` + +Save the file and restart Netdata. + +## Enable TLS/SSL Communication + +While encrypting the connection between your parent and child nodes is recommended for security, it's not required to get started. + +This example uses self-signed certificates. + +> **Note** +> This section assumes you have read the documentation on [how to edit the Netdata configuration files](https://github.com/netdata/netdata/blob/master/docs/netdata-agent/configuration.md). +<!-- here we need link to the section that will contain the restarting instructions --> + +1. **Parent node** + To generate an SSL key and certificate using `openssl`, take a look at the related section around [Securing Netdata Agents](https://github.com/netdata/netdata/blob/master/src/web/server/README.md#enable-httpstls-support) in our Documentation. + +2. **Child node** + Update `stream.conf` to enable SSL/TLS and allow self-signed certificates. Append ':SSL' to the destination and uncomment 'ssl skip certificate verification'. + + ```conf + [stream] + enabled = yes + destination = 203.0.113.0:SSL + ssl skip certificate verification = yes + api key = 11111111-2222-3333-4444-555555555555 + ``` + +3. Restart the Netdata Agent on both the parent and child nodes, to stream encrypted metrics using TLS/SSL. + + + +## Troubleshooting Streaming Connections + +You can find any issues related to streaming at Netdata logs. + +### From the UI + +Netdata logs to systemd-journald by default, and its logs are available at the `Logs` tab of the UI. At the `MESSAGE_ID` field look for `Netdata connection from child` and `Netdata connection to parent`. + +### From the terminal + +On the Parents: + +```bash +journalctl -r --namespace=netdata MESSAGE_ID=ed4cdb8f1beb4ad3b57cb3cae2d162fa +``` + +On the Children: + +```bash +journalctl -r --namespace=netdata MESSAGE_ID=6e2e3839067648968b646045dbf28d66 +``` diff --git a/docs/observability-centralization-points/metrics-centralization-points/faq.md b/docs/observability-centralization-points/metrics-centralization-points/faq.md new file mode 100644 index 000000000..3c019108c --- /dev/null +++ b/docs/observability-centralization-points/metrics-centralization-points/faq.md @@ -0,0 +1,70 @@ +# FAQ on Metrics Centralization Points + +## How much can a Netdata Parent node scale? + +Netdata Parents generally scale well. According [to our tests](https://blog.netdata.cloud/netdata-vs-prometheus-performance-analysis/) Netdata Parents scale better than Prometheus for the same workload: -35% CPU utilization, -49% Memory Consumption, -12% Network Bandwidth, -98% Disk I/O, -75% Disk footprint. + +For more information, Check [Sizing Netdata Parents](https://github.com/netdata/netdata/blob/master/docs/observability-centralization-points/metrics-centralization-points/sizing-netdata-parents.md). + +## If I set up a parents cluster, will I be able to have more Child nodes stream to them? + +No. When you set up an active-active cluster, even if child nodes connect randomly to one or the other, all the parent nodes receive all the metrics of all the child nodes. So, all of them do all the work. + +## How much retention do the child nodes need? + +Child nodes need to have only the retention required in order to connect to another Parent if one fails or stops for maintenance. + +- If you have a cluster of parents, 5 to 10 minutes in `alloc` mode is usually enough. +- If you have only 1 parent, it would be better to run the child nodes with `dbengine` so that they will have enough retention to back-fill the parent node if it stops for maintenance. + +## Does streaming between child nodes and parents support encryption? + +Yes. You can configure your parent nodes to enable TLS at their web server and configure the child nodes to connect with TLS to it. The streaming connection is also compressed, on top of TLS. + +## Can I have an HTTP proxy between parent and child nodes? + +No. The streaming protocol works on the same port as the internal web server of Netdata Agents, but the protocol is not HTTP-friendly and cannot be understood by HTTP proxy servers. + +## Should I load balance multiple parents with a TCP load balancer? + +Although this can be done and for streaming between child and parent nodes it could work, we recommend not doing it. It can lead to several kinds of problems. + +It is better to configure all the parent nodes directly in the child nodes `stream.conf`. The child nodes will do everything in their power to find a parent node to connect and they will never give up. + +## When I have multiple parents for the same children, will I receive alert notifications from all of them? + +If all parents are configured to run health checks and trigger alerts, yes. + +We recommend using Netdata Cloud to avoid receiving duplicate alert notifications. Netdata Cloud deduplicates alert notifications so that you will receive them only once. + +## When I have only Parents connected to Netdata Cloud, will I be able to use the Functions feature on my child nodes? + +Yes. Function requests will be received by the Parents and forwarded to the Child via their streaming connection. Function requests are propagated between parents, so this will work even if multiple levels of Netdata Parents are involved. + +## If I have a cluster of parents and get one out for maintenance for a few hours, will it have missing data when it returns back online? + +Check [Restoring a Netdata Parent after maintenance](https://github.com/netdata/netdata/blob/master/docs/observability-centralization-points/metrics-centralization-points/clustering-and-high-availability-of-netdata-parents.md). + +## I have a cluster of parents. Which one is used by Netdata Cloud? + +When there are multiple data sources for the same node, Netdata Cloud follows this strategy: + +1. Netdata Cloud prefers Netdata agents having `live` data. +2. For time-series queries, when multiple Netdata agents have the retention required to answer the query, Netdata Cloud prefers the one that is further away from production systems. +3. For Functions, Netdata Cloud prefers Netdata agents that are closer to the production systems. + +## Is there a way to balance child nodes to the parent nodes of a cluster? + +Yes. When configuring the Parents at the Children `stream.conf`, configure them in different order. Children get connected to the first Parent they find available, so if the order given to them is different, they will spread the connections to the Parents available. + +## Is there a way to get notified when a child gets disconnected? + +It depends on the ephemerality setting of each Netdata Child. + +1. **Permanent nodes**: These are nodes that should be available permanently and if they disconnect an alert should be triggered to notify you. By default, all nodes are considered permanent (not ephemeral). + +2. **Ephemeral nodes**: These are nodes that are ephemeral by nature and they may shutdown at any point in time without any impact on the services you run. + +To set the ephemeral flag on a node, edit its netdata.conf and in the `[health]` section set `is ephemeral = yes`. This setting is propagated to parent nodes and Netdata Cloud. + +When using Netdata Cloud (via a parent or directly) and a permanent node gets disconnected, Netdata Cloud sends node disconnection notifications. diff --git a/docs/observability-centralization-points/metrics-centralization-points/replication-of-past-samples.md b/docs/observability-centralization-points/metrics-centralization-points/replication-of-past-samples.md new file mode 100644 index 000000000..5c776b860 --- /dev/null +++ b/docs/observability-centralization-points/metrics-centralization-points/replication-of-past-samples.md @@ -0,0 +1,60 @@ +# Replication of Past Samples + +Replication is triggered when a Netdata Child connects to a Netdata Parent. It replicates the latest samples of collected metrics a Netdata Parent may be missing. The goal of replication is to back-fill samples that were collected between disconnects and reconnects, so that the Netdata Parent does not have gaps on the charts for the time Netdata Children were disconnected. + +The same replication mechanism is used between Netdata Parents (the sending Netdata is treated as a Child and the receiving Netdata as a Parent). + +## Replication Limitations + +The current implementation is optimized to replicate small durations and have minimal impact during reconnects. As a result it has the following limitations: + +1. Replication can only append samples to metrics. Only missing samples at the end of each time-series are replicated. + +2. Only `tier0` samples are replicated. Samples of higher tiers in Netdata are derived from `tier0` samples, and therefore there is no mechanism for ingesting them directly. This means that the maximum retention that can be replicated across Netdata is limited by the samples available in `tier0` of the sending Netdata. + +3. Only samples of metrics that are currently being collected are replicated. Archived metrics (or even archived nodes) will be replicated when and if they are collected again. Netdata archives metrics 1 hour after they stop being collected, so Netdata Parents may miss data only if Netdata Children are disconnected for more than an hour from their Parents. + +When multiple Netdata Parents are available, the replication happens in sequence, like in the following diagram. + +```mermaid +sequenceDiagram + Child-->>Parent1: Connect + Parent1-->>Child: OK + Parent1-->>Parent2: Connect + Parent2-->>Parent1: OK + Child-->>Parent1: Metric M1 with retention up to Now + Parent1-->>Child: M1 stopped at -60sec, replicate up to Now + Child-->>Parent1: replicate M1 samples -60sec to Now + Child-->>Parent1: streaming M1 + Parent1-->>Parent2: Metric M1 with retention up to Now + Parent2-->>Parent1: M1 stopped at -63sec, replicate up to Now + Parent1-->>Parent2: replicate M1 samples -63sec to Now + Parent1-->>Parent2: streaming M1 +``` + +As shown in the diagram: + +1. All connections are established immediately after a Netdata child connects to any of the Netdata Parents. +2. Each pair of connections (Child->Parent1, Parent1->Parent2) complete replication on the receiving side and then initiate replication on the sending side. +3. Replication pushes data up to Now, and the sending side immediately enters streaming mode, without leaving any gaps on the samples of the receiving side. +4. On every pair of connections, replication negotiates the retention of the receiving party to back-fill as much data as necessary. + +## Configuration options for Replication + +The following `netdata.conf` configuration parameters affect replication. + +On the receiving side (Netdata Parent): + +- `[db].seconds to replicate` limits the maximum time to be replicated. The default is 1 day (86400 seconds). Keep in mind that replication is also limited by the `tier0` retention the sending side has. + +On the sending side (Netdata Children, or Netdata Parent when parents are clustered): + +- `[db].replication threads` controls how many concurrent threads will be replicating metrics. The default is 1. Usually the performance is about 2 million samples per second per thread, so increasing this number may allow replication to progress faster between Netdata Parents. + +- `[db].cleanup obsolete charts after secs` controls for how much time after metrics stop being collected will not be available for replication. The default is 1 hour (3600 seconds). If you plan to have scheduled maintenance on Netdata Parents of more than 1 hour, we recommend increasing this setting. Keep in mind however, that increasing this duration in highly ephemeral environments can have an impact on RAM utilization, since metrics will be considered as collected for longer durations. + +## Monitoring Replication Progress + +Inbound and outbound replication progress is reported at the dashboard using the Netdata Function `Streaming`, under the `Top` tab. + +The same information is exposed via the API endpoint `http://agent-ip:19999/api/v2/node_instances` of both Netdata Parents and Children. diff --git a/docs/observability-centralization-points/metrics-centralization-points/sizing-netdata-parents.md b/docs/observability-centralization-points/metrics-centralization-points/sizing-netdata-parents.md new file mode 100644 index 000000000..79b223348 --- /dev/null +++ b/docs/observability-centralization-points/metrics-centralization-points/sizing-netdata-parents.md @@ -0,0 +1,3 @@ +# Sizing Netdata Parents + +To estimate CPU, RAM, and disk requirements for your Netdata Parents, check [sizing Netdata agents](https://github.com/netdata/netdata/blob/master/docs/netdata-agent/sizing-netdata-agents/README.md). |