
diff options
Diffstat (limited to 'docs/overview/what-is-netdata.md')
| -rw-r--r-- | docs/overview/what-is-netdata.md | 76 |
1 files changed, 0 insertions, 76 deletions
diff --git a/docs/overview/what-is-netdata.md b/docs/overview/what-is-netdata.md deleted file mode 100644 index f8e67159..00000000 --- a/docs/overview/what-is-netdata.md +++ /dev/null @@ -1,76 +0,0 @@ -<!-- -title: "What is Netdata?" -description: "Netdata is distributed, real-time performance and health monitoring for systems and applications on a single node or an entire infrastructure." -custom_edit_url: https://github.com/netdata/netdata/edit/master/docs/overview/what-is-netdata.md ---> - -# What is Netdata? - -Netdata helps sysadmins, SREs, DevOps engineers, and IT professionals collect all possible metrics from systems and -applications, visualize these metrics in real-time, and troubleshoot complex performance problems. - -Netdata's solution uses two components, the Netdata Agent and Netdata Cloud, to deliver real-time performance and health -monitoring for both single nodes and entire infrastructure. - -## Netdata Agent - -Netdata's distributed monitoring Agent collects thousands of metrics from systems, hardware, and applications with zero -configuration. It runs permanently on all your physical/virtual servers, containers, cloud deployments, and edge/IoT -devices. - -You can [install](https://github.com/netdata/netdata/blob/master/docs/get-started.mdx) Netdata on most Linux -distributions (Ubuntu, Debian, CentOS, and more), -container/microservice platforms (Kubernetes clusters, Docker), and many other operating systems (FreeBSD, macOS), with -no `sudo` required. - -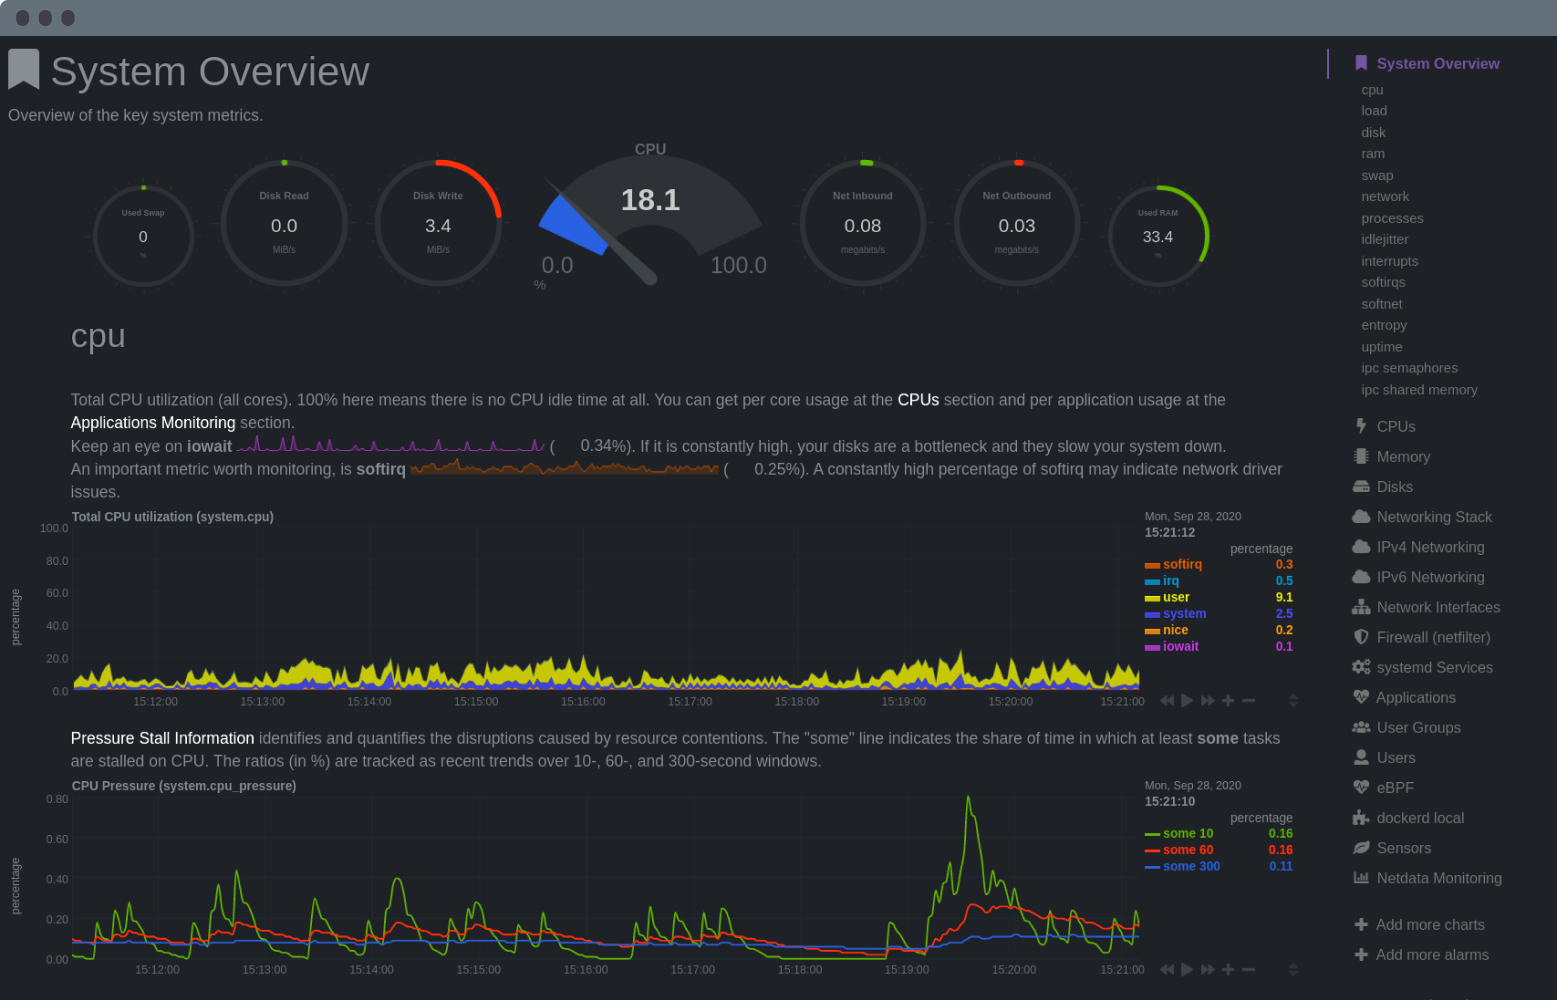 - -## Netdata Cloud - -Netdata Cloud is a web application that gives you real-time visibility for your entire infrastructure. With Netdata -Cloud, you can view key metrics, insightful charts, and active alarms from all your nodes in a single web interface. -When an anomaly strikes, seamlessly navigate to any node to troubleshoot and discover the root cause with the familiar -Netdata dashboard. - -**[Netdata Cloud is free](https://www.netdata.cloud/blog/why-netdata-is-free/)**! You can add an entire infrastructure -of nodes, invite all your colleagues, and visualize any number of metrics, charts, and alarms entirely for free. - -While Netdata Cloud offers a centralized method of monitoring your Agents, your metrics data is not stored or -centralized in any way. Metrics data remains with your nodes and is only streamed to your browser, through Cloud, when -you're viewing the Netdata Cloud interface. - -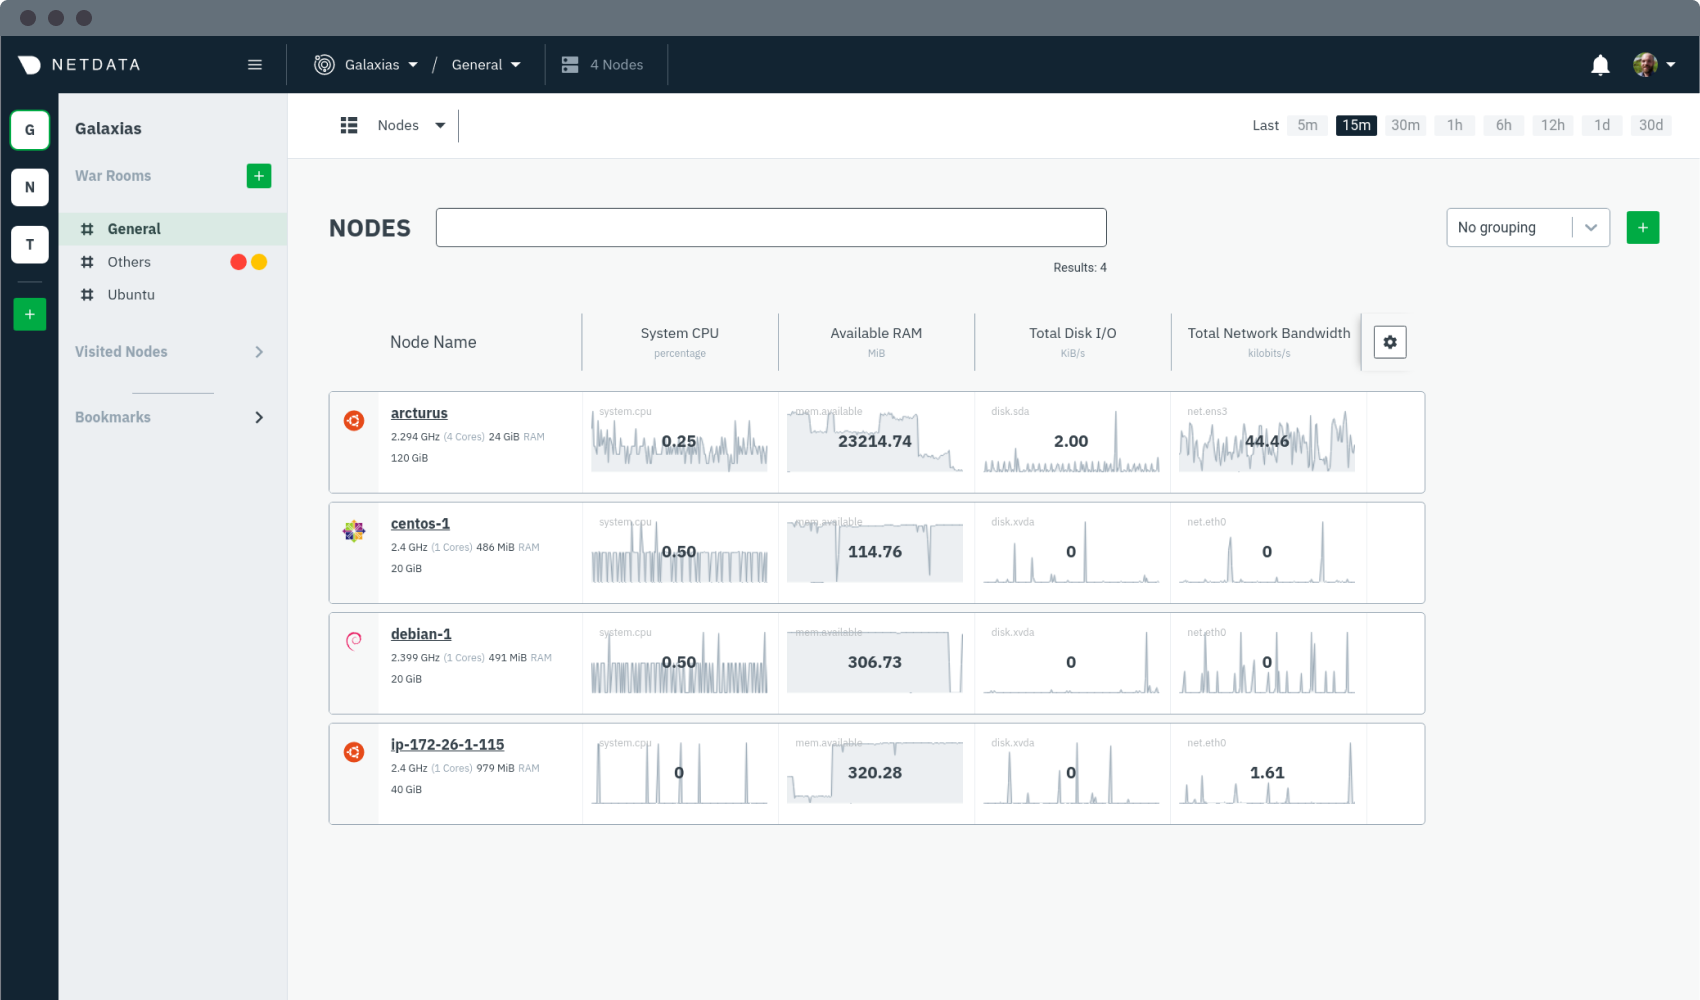 - -## What you can do with Netdata - -Netdata is designed to be both simple to use and flexible for every monitoring, visualization, and troubleshooting use -case: - -- **Collect**: Netdata collects all available metrics from your system and applications with 300+ collectors, - Kubernetes service discovery, and in-depth container monitoring, all while using only 1% CPU and a few MB of RAM. It - even collects metrics from Windows machines. -- **Visualize**: The dashboard meaningfully presents charts to help you understand the relationships between your - hardware, operating system, running apps/services, and the rest of your infrastructure. Add nodes to Netdata Cloud - for a complete view of your infrastructure from a single pane of glass. -- **Monitor**: Netdata's health watchdog uses hundreds of preconfigured alarms to notify you via Slack, email, - PagerDuty and more when an anomaly strikes. Customize with dynamic thresholds, hysteresis, alarm templates, and - role-based notifications. -- **Troubleshoot**: 1s granularity helps you detect and analyze anomalies other monitoring platforms might have - missed. Interactive visualizations reduce your reliance on the console, and historical metrics help you trace issues - back to their root cause. -- **Store**: Netdata's efficient database engine efficiently stores per-second metrics for days, weeks, or even - months. Every distributed node stores metrics locally, simplifying deployment, slashing costs, and enriching - Netdata's interactive dashboards. -- **Export**: Integrate per-second metrics with other time-series databases like Graphite, Prometheus, InfluxDB, - TimescaleDB, and more with Netdata's interoperable and extensible core. -- **Stream**: Aggregate metrics from any number of distributed nodes in one place for in-depth analysis, including - ephemeral nodes in a Kubernetes cluster. - -## What's next? - -Learn more -about [why you should use Netdata](https://github.com/netdata/netdata/blob/master/docs/overview/why-netdata.md), -or [how Netdata works with your existing monitoring stack](https://github.com/netdata/netdata/blob/master/docs/overview/netdata-monitoring-stack.md). - - |