
diff options
Diffstat (limited to 'docs/quickstart/infrastructure.md')
| -rw-r--r-- | docs/quickstart/infrastructure.md | 8 |
1 files changed, 4 insertions, 4 deletions
diff --git a/docs/quickstart/infrastructure.md b/docs/quickstart/infrastructure.md index 0e355f373..8ec9b75cb 100644 --- a/docs/quickstart/infrastructure.md +++ b/docs/quickstart/infrastructure.md @@ -62,8 +62,8 @@ inviting others, you can better synchronize with your team or colleagues to unde When something goes wrong, you'll be ready to collaboratively troubleshoot complex performance problems from a single pane of glass. -To invite new users, click on **Invite Users** in the left-hand navigation panel beneath your Space's name. Choose which -War Rooms to add this user to, then click **Send**. +To [invite new users](https://learn.netdata.cloud/docs/cloud/manage/invite-your-team), click on **Invite Users** in the +Space management Area. Choose which War Rooms to add this user to, then click **Send**. If your team members have trouble signing in, direct them to the [Netdata Cloud sign in](https://learn.netdata.cloud/docs/cloud/manage/sign-in) doc. @@ -76,7 +76,7 @@ Overview features composite charts, which display aggregated metrics from every are streamed on-demand from individual nodes and composited onto a single, familiar dashboard. 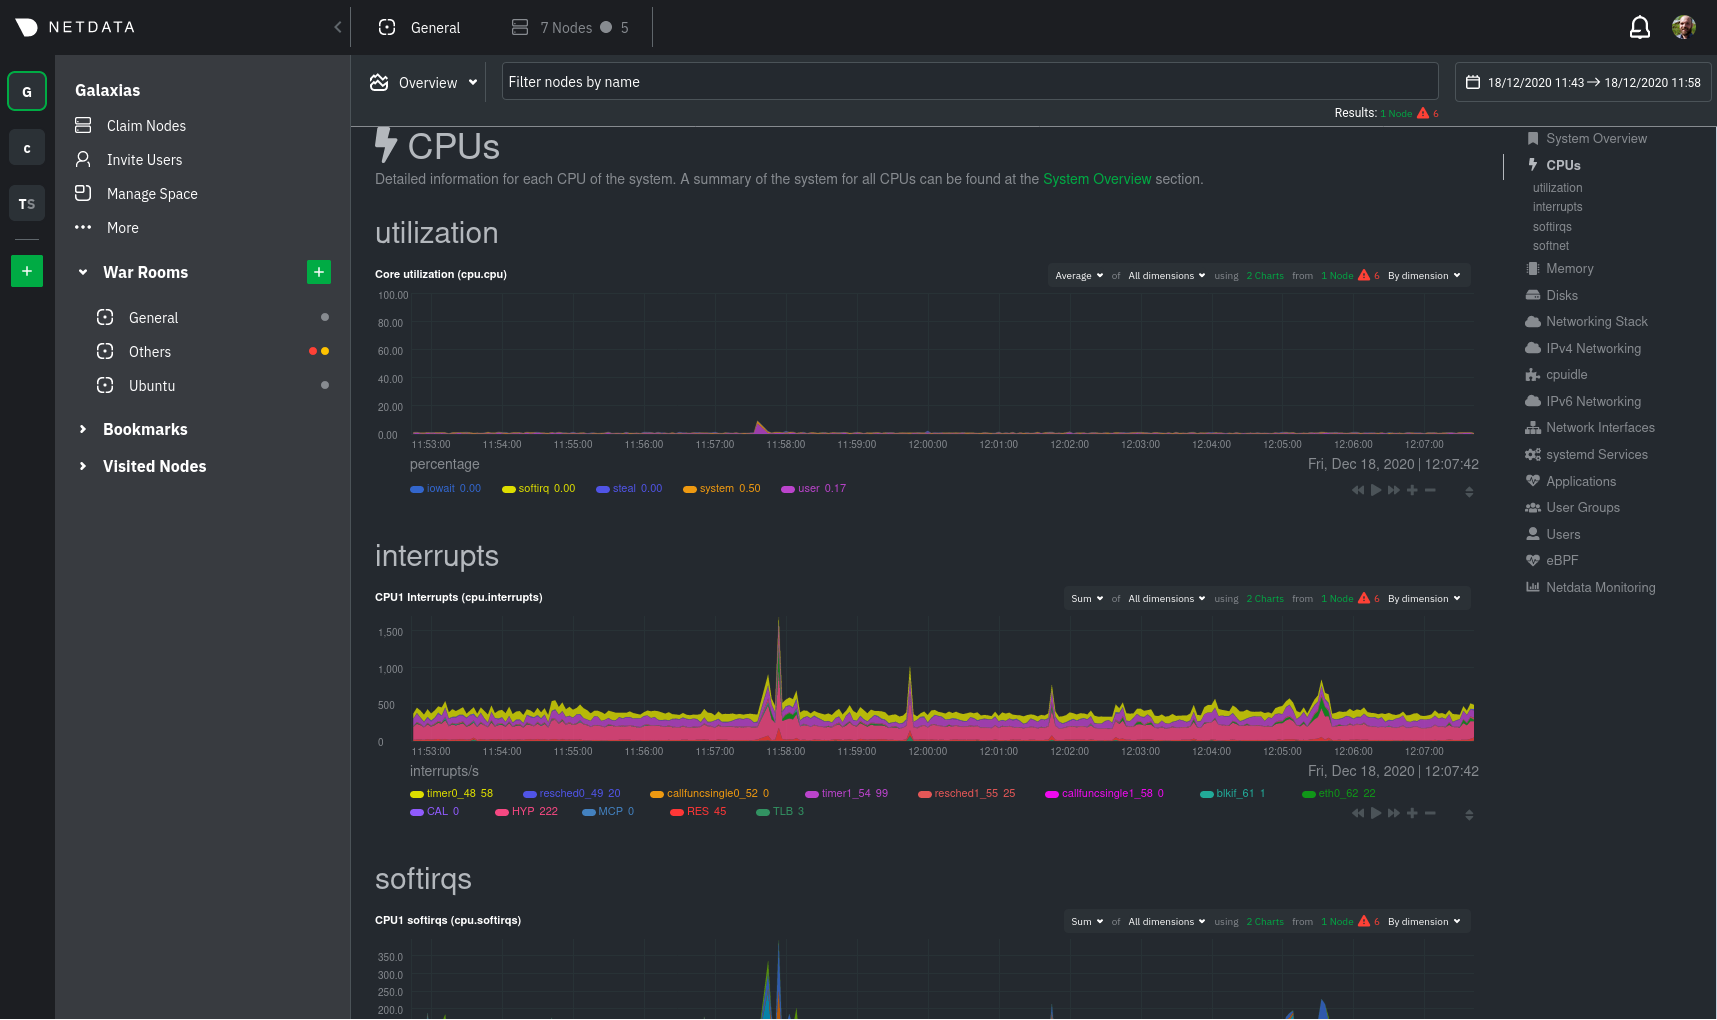 +Overview](https://user-images.githubusercontent.com/1153921/108732681-09791980-74eb-11eb-9ba2-98cb1b6608de.png) Read more about the Overview in the [infrastructure overview](/docs/visualize/overview-infrastructure.md) doc. @@ -101,7 +101,7 @@ complex issues by aggregating correlated charts from any number of nodes. For ex from every node in your infrastructure on a single dashboard. 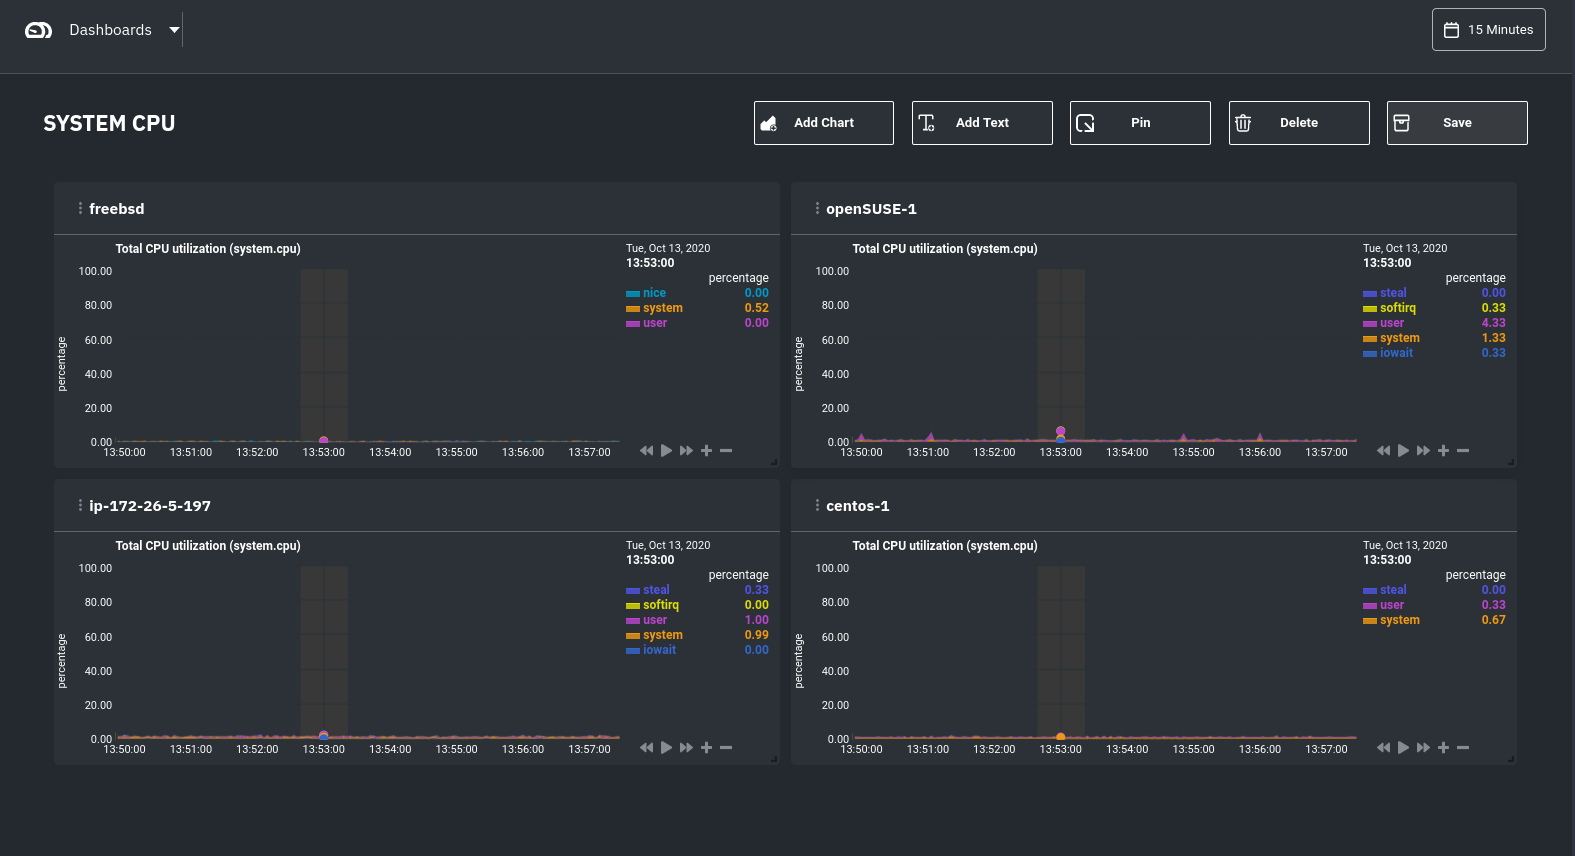 +dashboard](https://user-images.githubusercontent.com/1153921/108732974-4b09c480-74eb-11eb-87a2-c67e569c08b6.png) Read more about [creating new dashboards](/docs/visualize/create-dashboards.md) for more details about the process and additional tips on best leveraging the feature to help you troubleshoot complex performance problems. |