
diff options
Diffstat (limited to 'docs/quickstart/infrastructure.md')
| -rw-r--r-- | docs/quickstart/infrastructure.md | 64 |
1 files changed, 32 insertions, 32 deletions
diff --git a/docs/quickstart/infrastructure.md b/docs/quickstart/infrastructure.md index 9db66c05..23986b00 100644 --- a/docs/quickstart/infrastructure.md +++ b/docs/quickstart/infrastructure.md @@ -12,7 +12,7 @@ nodes running the Netdata Agent. A node is any system in your infrastructure tha physical or virtual machine (VM), container, cloud deployment, or edge/IoT device. The Netdata Agent uses zero-configuration collectors to gather metrics from every application and container instantly, -and uses Netdata's [distributed data architecture](/docs/store/distributed-data-architecture.md) to store metrics +and uses Netdata's [distributed data architecture](https://github.com/netdata/netdata/blob/master/docs/store/distributed-data-architecture.md) to store metrics locally. Without a slow and troublesome centralized data lake for your infrastructure's metrics, you reduce the resources you need to invest in, and the complexity of, monitoring your infrastructure. @@ -27,12 +27,12 @@ your nodes to maximize the value you get from Netdata. This quickstart assumes you've installed the Netdata Agent on more than one node in your infrastructure, and connected those nodes to your Space in Netdata Cloud. If you haven't yet, see the [Netdata -Cloud](https://learn.netdata.cloud/docs/cloud) docs for details on signing up for Netdata Cloud, installation, and +Cloud](https://github.com/netdata/netdata/blob/master/docs/cloud/cloud.mdx) docs for details on signing up for Netdata Cloud, installation, and connection process. > If you want to monitor a Kubernetes cluster with Netdata, see our [k8s installation -> doc](/packaging/installer/methods/kubernetes.md) for setup details, and then read our guide, [_Monitor a Kubernetes -> cluster with Netdata_](/docs/guides/monitor/kubernetes-k8s-netdata.md). +> doc](https://github.com/netdata/netdata/blob/master/packaging/installer/methods/kubernetes.md) for setup details, and then read our guide, [_Monitor a Kubernetes +> cluster with Netdata_](https://github.com/netdata/netdata/blob/master/docs/guides/monitor/kubernetes-k8s-netdata.md). ## Set up your Netdata Cloud experience @@ -49,11 +49,11 @@ SRE team for the user-facing SaaS application, and a second IT team for managing don't monitor the same nodes, they can work in separate Spaces and then further organize their nodes into War Rooms. Next, set up War Rooms. Netdata Cloud creates dashboards and visualizations based on the nodes added to a given War -Room. You can [organize War Rooms](https://learn.netdata.cloud/docs/cloud/war-rooms#war-room-organization) in any way +Room. You can [organize War Rooms](https://github.com/netdata/netdata/blob/master/docs/cloud/war-rooms.md#war-room-organization) in any way you want, such as by the application type, for end-to-end application monitoring, or as an incident response tool. -Learn more about [Spaces](https://learn.netdata.cloud/docs/cloud/spaces) and [War -Rooms](https://learn.netdata.cloud/docs/cloud/war-rooms), including how to manage each, in their respective reference +Learn more about [Spaces](https://github.com/netdata/netdata/blob/master/docs/cloud/spaces.md) and [War +Rooms](https://github.com/netdata/netdata/blob/master/docs/cloud/war-rooms.md), including how to manage each, in their respective reference documentation. ### Invite your team @@ -63,25 +63,25 @@ inviting others, you can better synchronize with your team or colleagues to unde When something goes wrong, you'll be ready to collaboratively troubleshoot complex performance problems from a single pane of glass. -To [invite new users](https://learn.netdata.cloud/docs/cloud/manage/invite-your-team), click on **Invite Users** in the +To [invite new users](https://github.com/netdata/netdata/blob/master/docs/cloud/manage/invite-your-team.md), click on **Invite Users** in the Space management Area. Choose which War Rooms to add this user to, then click **Send**. If your team members have trouble signing in, direct them to the [Netdata Cloud sign -in](https://learn.netdata.cloud/docs/cloud/manage/sign-in) doc. +in](https://github.com/netdata/netdata/blob/master/docs/cloud/manage/sign-in.mdx) doc. ### See an overview of your infrastructure The default way to visualize the health and performance of an infrastructure with Netdata Cloud is the -[**Overview**](/docs/visualize/overview-infrastructure.md), which is the default interface of every War Room. The +[**Overview**](https://github.com/netdata/netdata/blob/master/docs/visualize/overview-infrastructure.md), which is the default interface of every War Room. The Overview features composite charts, which display aggregated metrics from every node in a given War Room. These metrics are streamed on-demand from individual nodes and composited onto a single, familiar dashboard. 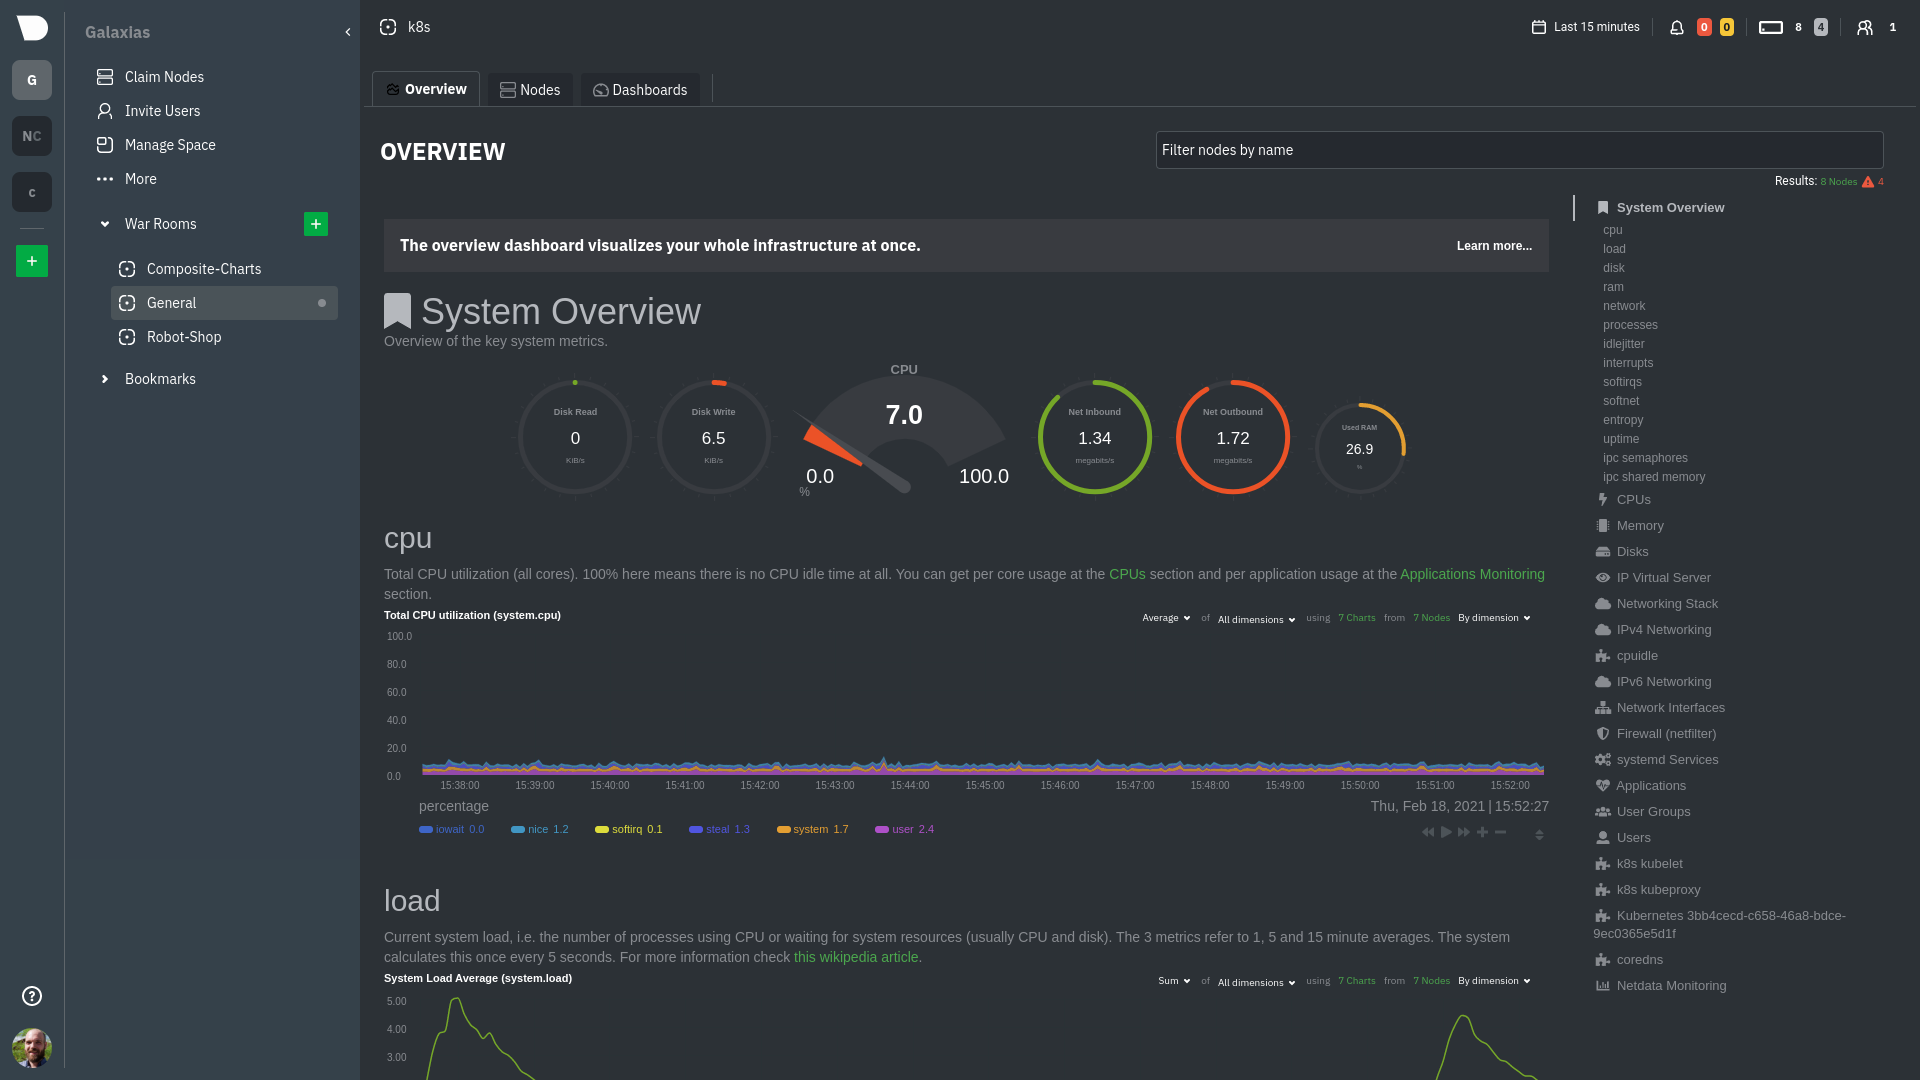 -Read more about the Overview in the [infrastructure overview](/docs/visualize/overview-infrastructure.md) doc. +Read more about the Overview in the [infrastructure overview](https://github.com/netdata/netdata/blob/master/docs/visualize/overview-infrastructure.md) doc. -Netdata Cloud also features the [**Nodes view**](https://learn.netdata.cloud/docs/cloud/visualize/nodes), which you can +Netdata Cloud also features the [**Nodes view**](https://github.com/netdata/netdata/blob/master/docs/cloud/visualize/nodes.md), which you can use to configure and see a few key metrics from every node in the War Room, view health status, and more. ### Drill down to specific nodes @@ -91,8 +91,8 @@ single-node dashboards in Netdata Cloud to drill down on specific issues, scrub historical data, and see like metrics presented meaningfully to help you troubleshoot performance problems. Read about the process in the [infrastructure -overview](/docs/visualize/overview-infrastructure.md#drill-down-with-single-node-dashboards) doc, then learn about [interacting with -dashboards and charts](/docs/visualize/interact-dashboards-charts.md) to get the most from all of Netdata's real-time +overview](https://github.com/netdata/netdata/blob/master/docs/visualize/overview-infrastructure.md#drill-down-with-single-node-dashboards) doc, then learn about [interacting with +dashboards and charts](https://github.com/netdata/netdata/blob/master/docs/visualize/interact-dashboards-charts.md) to get the most from all of Netdata's real-time metrics. ### Create new dashboards @@ -104,7 +104,7 @@ from every node in your infrastructure on a single dashboard. 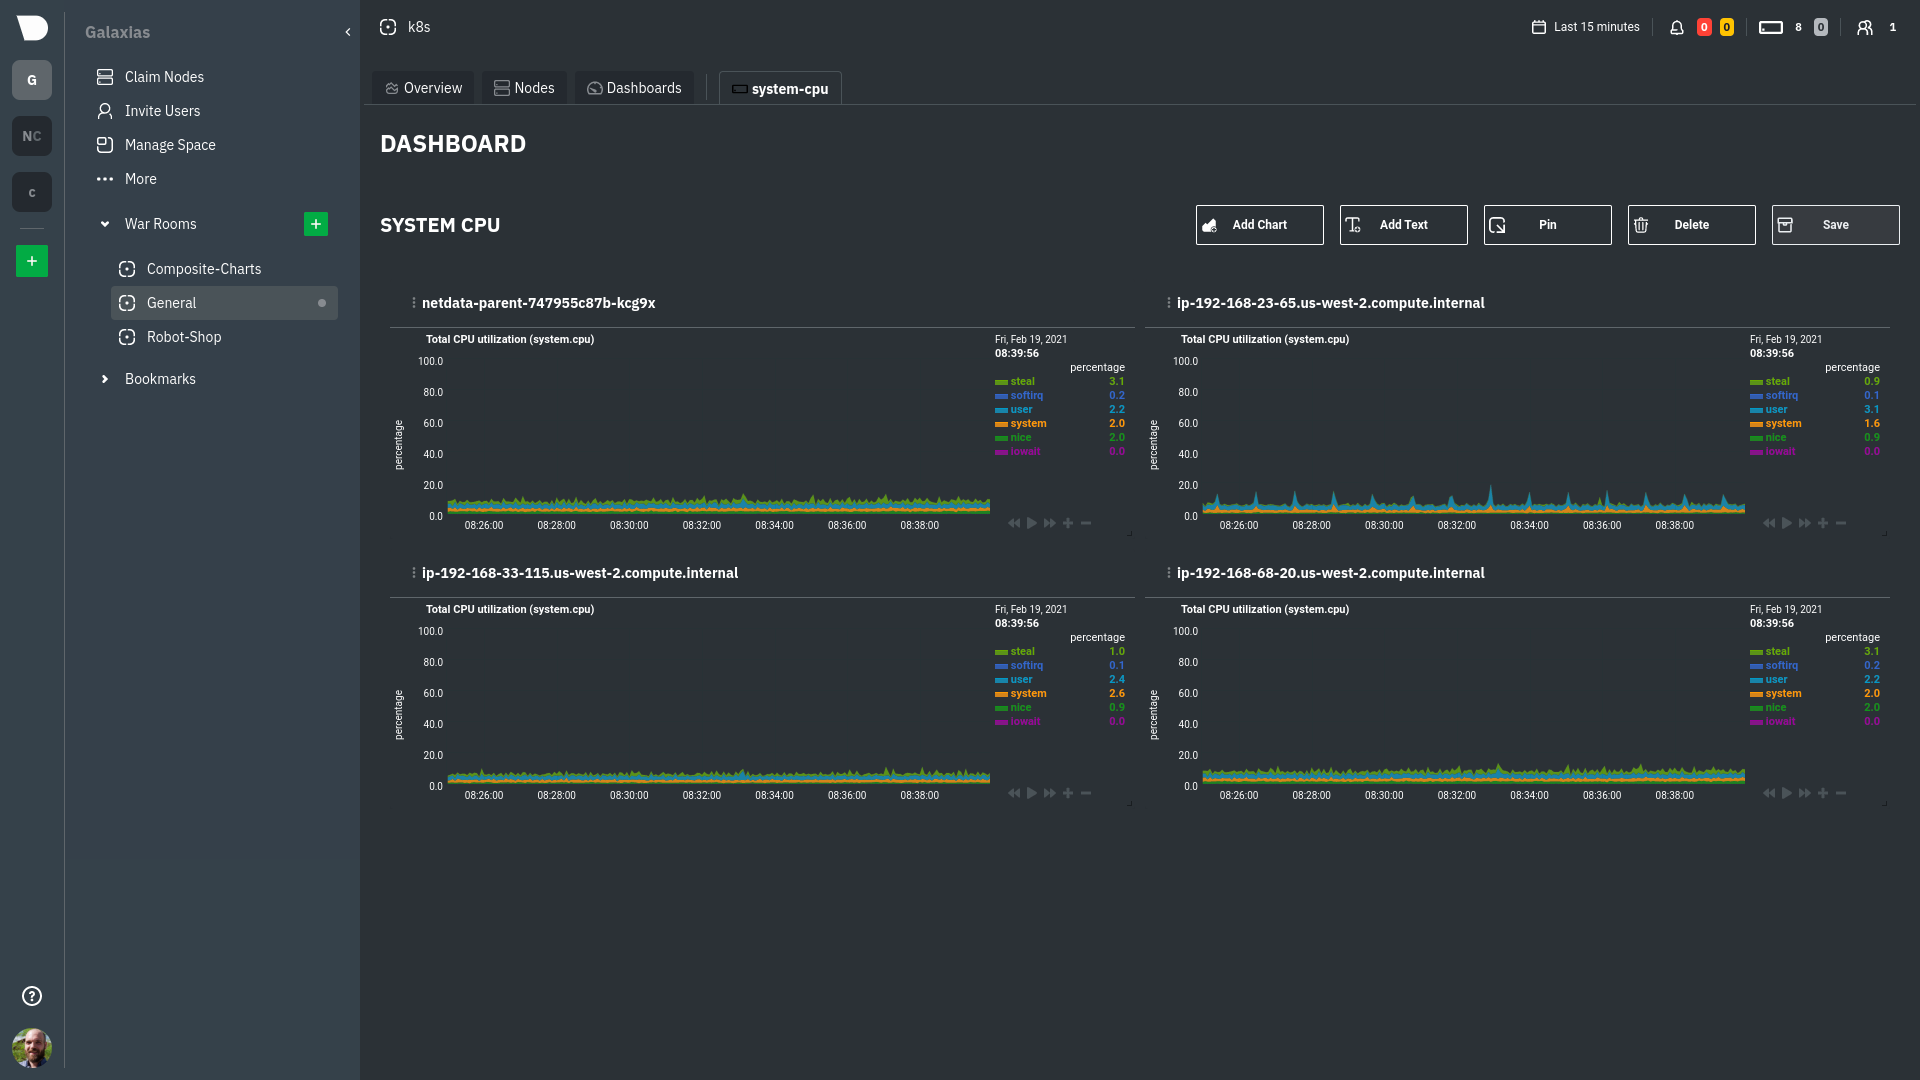 -Read more about [creating new dashboards](/docs/visualize/create-dashboards.md) for more details about the process and +Read more about [creating new dashboards](https://github.com/netdata/netdata/blob/master/docs/visualize/create-dashboards.md) for more details about the process and additional tips on best leveraging the feature to help you troubleshoot complex performance problems. ## Set up your nodes @@ -131,25 +131,25 @@ cd /etc/netdata sudo ./edit-config netdata.conf ``` -Our [configuration basics doc](/docs/configure/nodes.md) contains more information about `netdata.conf`, `edit-config`, +Our [configuration basics doc](https://github.com/netdata/netdata/blob/master/docs/configure/nodes.md) contains more information about `netdata.conf`, `edit-config`, along with simple examples to get you familiar with editing your node's configuration. -After you've learned the basics, you should [secure your infrastructure's nodes](/docs/configure/secure-nodes.md) using +After you've learned the basics, you should [secure your infrastructure's nodes](https://github.com/netdata/netdata/blob/master/docs/configure/secure-nodes.md) using one of our recommended methods. These security best practices ensure no untrusted parties gain access to the metrics collected on any of your nodes. ### Collect metrics from systems and applications -Netdata has [300+ pre-installed collectors](/collectors/COLLECTORS.md) that gather thousands of metrics with zero +Netdata has [300+ pre-installed collectors](https://github.com/netdata/netdata/blob/master/collectors/COLLECTORS.md) that gather thousands of metrics with zero configuration. Collectors search each of your nodes in default locations and ports to find running applications and gather as many metrics as they can without you having to configure them individually. Most collectors work without configuration, but you should read up on [how collectors -work](/docs/collect/how-collectors-work.md) and [how to enable/configure](/docs/collect/enable-configure.md) them so +work](https://github.com/netdata/netdata/blob/master/docs/collect/how-collectors-work.md) and [how to enable/configure](https://github.com/netdata/netdata/blob/master/docs/collect/enable-configure.md) them so that you can see metrics from those applications in Netdata Cloud. -In addition, find detailed information about which [system](/docs/collect/system-metrics.md), -[container](/docs/collect/container-metrics.md), and [application](/docs/collect/application-metrics.md) metrics you can +In addition, find detailed information about which [system](https://github.com/netdata/netdata/blob/master/docs/collect/system-metrics.md), +[container](https://github.com/netdata/netdata/blob/master/docs/collect/container-metrics.md), and [application](https://github.com/netdata/netdata/blob/master/docs/collect/application-metrics.md) metrics you can collect from across your infrastructure with Netdata. ## What's next? @@ -158,28 +158,28 @@ Netdata has many features that help you monitor the health of your nodes and tro Once you have a handle on configuration and are collecting all the right metrics, try out some of Netdata's other infrastructure-focused features: -- [See an overview of your infrastructure](/docs/visualize/overview-infrastructure.md) using Netdata Cloud's composite +- [See an overview of your infrastructure](https://github.com/netdata/netdata/blob/master/docs/visualize/overview-infrastructure.md) using Netdata Cloud's composite charts and real-time visualizations. -- [Create new dashboards](/docs/visualize/create-dashboards.md) from any number of nodes and metrics in Netdata Cloud. +- [Create new dashboards](https://github.com/netdata/netdata/blob/master/docs/visualize/create-dashboards.md) from any number of nodes and metrics in Netdata Cloud. To change how the Netdata Agent runs on each node, dig in to configuration files: -- [Change how long nodes in your infrastructure retain metrics](/docs/store/change-metrics-storage.md) based on how +- [Change how long nodes in your infrastructure retain metrics](https://github.com/netdata/netdata/blob/master/docs/store/change-metrics-storage.md) based on how many metrics each node collects, your preferred retention period, and the resources you want to dedicate toward long-term metrics retention. -- [Create new alarms](/docs/monitor/configure-alarms.md), or tweak some of the pre-configured alarms, to stay on top +- [Create new alarms](https://github.com/netdata/netdata/blob/master/docs/monitor/configure-alarms.md), or tweak some of the pre-configured alarms, to stay on top of anomalies. -- [Enable notifications](/docs/monitor/enable-notifications.md) to Slack, PagerDuty, email, and 30+ other services. -- [Export metrics](/docs/export/external-databases.md) to an external time-series database to use Netdata alongside +- [Enable notifications](https://github.com/netdata/netdata/blob/master/docs/monitor/enable-notifications.md) to Slack, PagerDuty, email, and 30+ other services. +- [Export metrics](https://github.com/netdata/netdata/blob/master/docs/export/external-databases.md) to an external time-series database to use Netdata alongside other monitoring and troubleshooting tools. ### Related reference documentation -- [Netdata Cloud · Spaces](https://learn.netdata.cloud/docs/cloud/spaces) -- [Netdata Cloud · War Rooms](https://learn.netdata.cloud/docs/cloud/war-rooms) -- [Netdata Cloud · Invite your team](https://learn.netdata.cloud/docs/cloud/manage/invite-your-team) +- [Netdata Cloud · Spaces](https://github.com/netdata/netdata/blob/master/docs/cloud/spaces.md) +- [Netdata Cloud · War Rooms](https://github.com/netdata/netdata/blob/master/docs/cloud/war-rooms.md) +- [Netdata Cloud · Invite your team](https://github.com/netdata/netdata/blob/master/docs/cloud/manage/invite-your-team.md) - [Netdata Cloud · Sign in or sign up with email, Google, or - GitHub](https://learn.netdata.cloud/docs/cloud/manage/sign-in) -- [Netdata Cloud · Nodes view](https://learn.netdata.cloud/docs/cloud/visualize/nodes) + GitHub](https://github.com/netdata/netdata/blob/master/docs/cloud/manage/sign-in.mdx) +- [Netdata Cloud · Nodes view](https://github.com/netdata/netdata/blob/master/docs/cloud/visualize/nodes.md) |