
diff options
Diffstat (limited to 'docs/quickstart/single-node.md')
| -rw-r--r-- | docs/quickstart/single-node.md | 92 |
1 files changed, 0 insertions, 92 deletions
diff --git a/docs/quickstart/single-node.md b/docs/quickstart/single-node.md deleted file mode 100644 index 29373191..00000000 --- a/docs/quickstart/single-node.md +++ /dev/null @@ -1,92 +0,0 @@ -<!-- -title: "Single-node monitoring with Netdata" -sidebar_label: "Single-node monitoring" -description: "Learn dashboard basics, configuring your nodes, and collecting metrics from applications to create a powerful single-node monitoring tool." -custom_edit_url: https://github.com/netdata/netdata/edit/master/docs/quickstart/single-node.md ---> - -# Single-node monitoring with Netdata - -Because it's free, open-source, and requires only 1% CPU utilization to collect thousands of metrics every second, -Netdata is a superb single-node monitoring tool. - -In this quickstart guide, you'll learn how to access your single node's metrics through dashboards, configure your node -to your liking, and make sure the Netdata Agent is collecting metrics from the applications or containers you're running -on your node. - -## See your node's metrics - -To see your node's real-time metrics, you need to access its dashboard. You can either view the local dashboard, which -runs on the node itself, or see the dashboard through Netdata Cloud. Both methods feature real-time, interactive, and -synchronized charts, with the same metrics, and use the same UI. - -The primary difference is that Netdata Cloud also has a few extra features, like creating new dashboards using a -drag-and-drop editor, that enhance your monitoring and troubleshooting experience. - -To see your node's local dashboard, open up your web browser of choice and navigate to `http://NODE:19999`, replacing -`NODE` with the IP address or hostname of your Agent. Hit `Enter`. - - - -To see a node's dashboard in Netdata Cloud, [sign in](https://app.netdata.cloud). From the **Nodes** view in your -**General** War Room, click on the hostname of your node to access its dashboard through Netdata Cloud. - -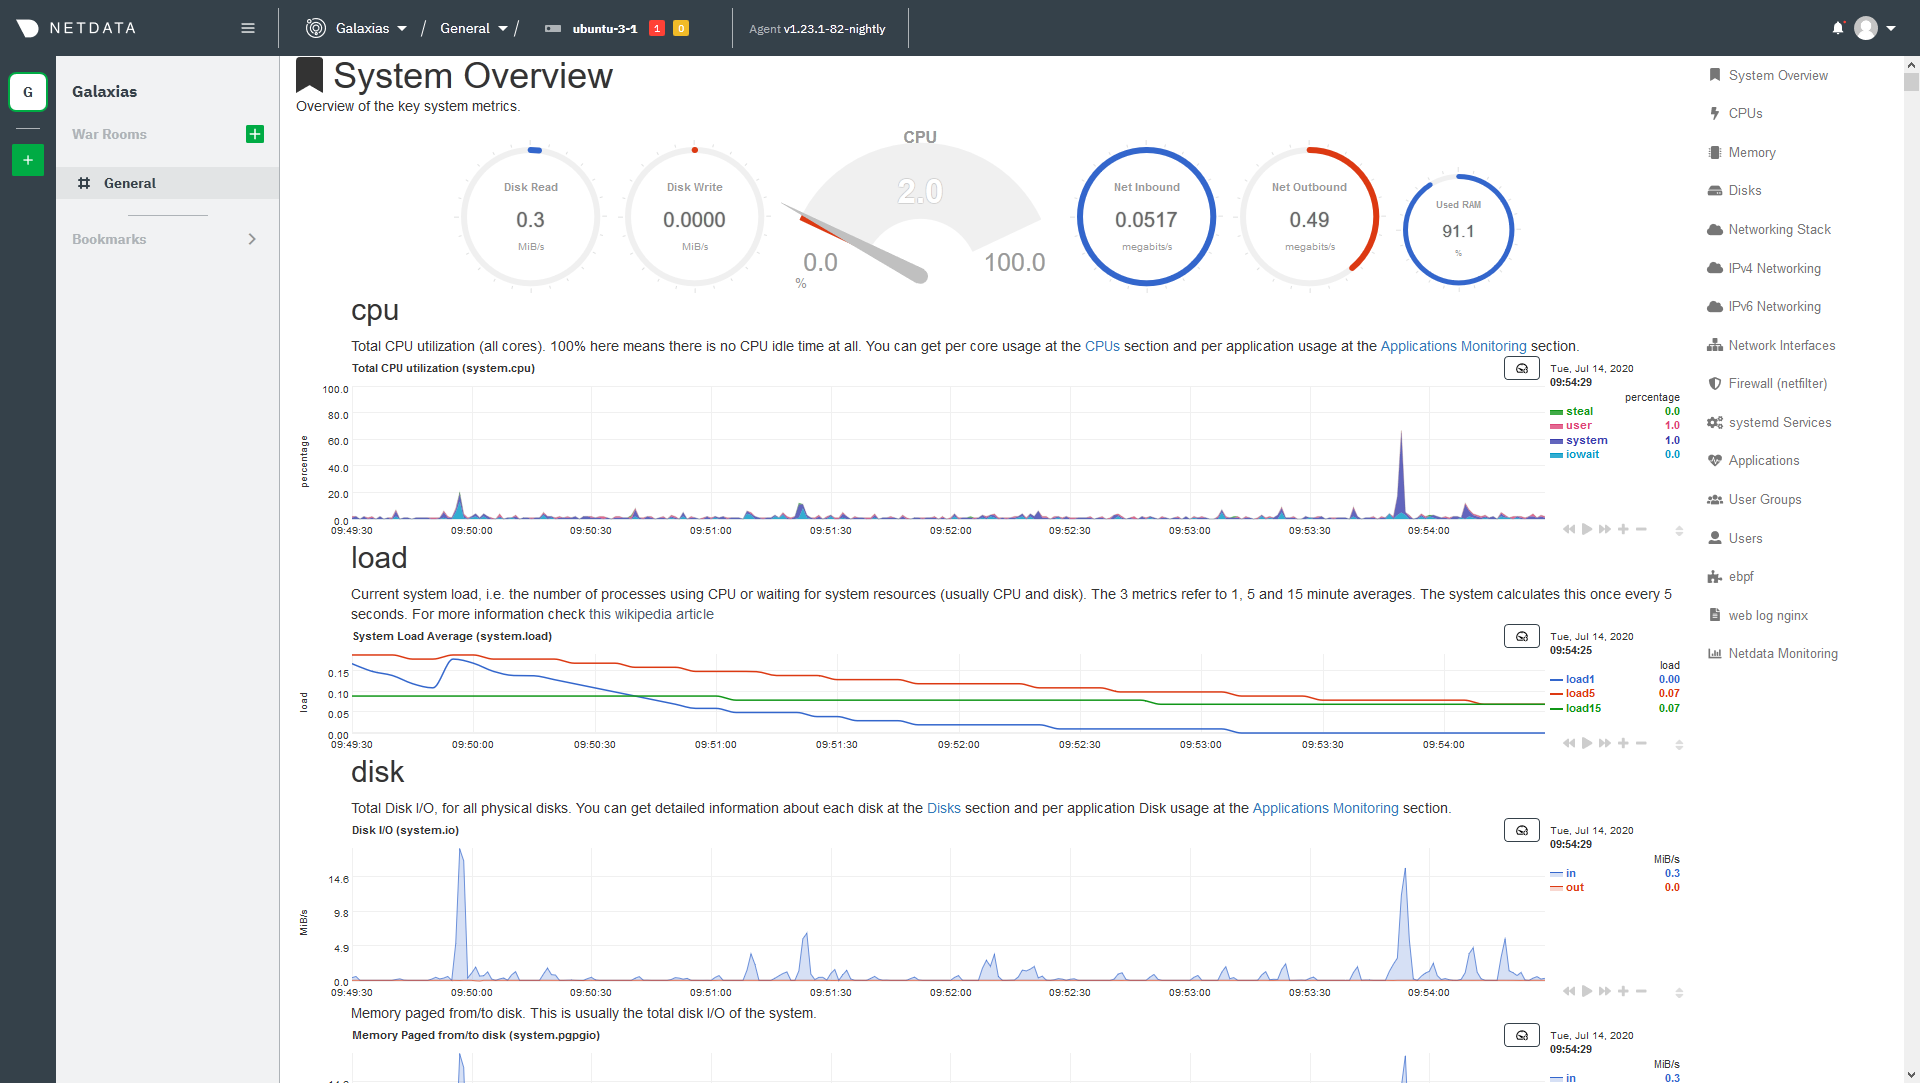 - -Once you've decided which dashboard you prefer, learn about [interacting with dashboards and -charts](https://github.com/netdata/netdata/blob/master/docs/visualize/interact-dashboards-charts.md) to get the most from Netdata's real-time metrics. - -## Configure your node - -The Netdata Agent is highly configurable so that you can match its behavior to your node. You will find most -configuration options in the `netdata.conf` file, which is typically at `/etc/netdata/netdata.conf`. The best way to -edit this file is using the `edit-config` script, which ensures updates to the Netdata Agent do not overwrite your -changes. For example: - -```bash -cd /etc/netdata -sudo ./edit-config netdata.conf -``` - -Our [configuration basics doc](https://github.com/netdata/netdata/blob/master/docs/configure/nodes.md) contains more information about `netdata.conf`, `edit-config`, -along with simple examples to get you familiar with editing your node's configuration. - -After you've learned the basics, you should [secure your node](https://github.com/netdata/netdata/blob/master/docs/configure/secure-nodes.md) using one of our -recommended methods. These security best practices ensure no untrusted parties gain access to your dashboard or its -metrics. - -## Collect metrics from your system and applications - -Netdata has [300+ pre-installed collectors](https://github.com/netdata/netdata/blob/master/collectors/COLLECTORS.md) that gather thousands of metrics with zero -configuration. Collectors search your node in default locations and ports to find running applications and gather as -many metrics as possible without you having to configure them individually. - -These metrics enrich both the local and Netdata Cloud dashboards. - -Most collectors work without configuration, but you should read up on [how collectors -work](https://github.com/netdata/netdata/blob/master/docs/collect/how-collectors-work.md) and [how to enable/configure](https://github.com/netdata/netdata/blob/master/docs/collect/enable-configure.md) them. - -In addition, find detailed information about which [system](https://github.com/netdata/netdata/blob/master/docs/collect/system-metrics.md), -[container](https://github.com/netdata/netdata/blob/master/docs/collect/container-metrics.md), and [application](https://github.com/netdata/netdata/blob/master/docs/collect/application-metrics.md) metrics you can -collect from across your infrastructure with Netdata. - -## What's next? - -Netdata has many features that help you monitor the health of your node and troubleshoot complex performance problems. -Once you understand configuration, and are certain Netdata is collecting all the important metrics from your node, try -out some of Netdata's other visualization and health monitoring features: - -- [Build new dashboards](https://github.com/netdata/netdata/blob/master/docs/visualize/create-dashboards.md) to put disparate but relevant metrics onto a single - interface. -- [Create new alarms](https://github.com/netdata/netdata/blob/master/docs/monitor/configure-alarms.md), or tweak some of the pre-configured alarms, to stay on top - of anomalies. -- [Enable notifications](https://github.com/netdata/netdata/blob/master/docs/monitor/enable-notifications.md) to Slack, PagerDuty, email, and 30+ other services. -- [Change how long your node stores metrics](https://github.com/netdata/netdata/blob/master/docs/store/change-metrics-storage.md) based on how many metrics it - collects, your preferred retention period, and the resources you want to dedicate toward long-term metrics - retention. -- [Export metrics](https://github.com/netdata/netdata/blob/master/docs/export/external-databases.md) to an external time-series database to use Netdata alongside - other monitoring and troubleshooting tools. - - |