
diff options
Diffstat (limited to 'docs/visualize/create-dashboards.md')
| -rw-r--r-- | docs/visualize/create-dashboards.md | 17 |
1 files changed, 11 insertions, 6 deletions
diff --git a/docs/visualize/create-dashboards.md b/docs/visualize/create-dashboards.md index 696cd1a7..f4306f33 100644 --- a/docs/visualize/create-dashboards.md +++ b/docs/visualize/create-dashboards.md @@ -14,16 +14,18 @@ In the War Room you want to monitor with this dashboard, click on your War Room' Add** button next to **Dashboards**. In the panel, give your new dashboard a name, and click **+ Add**. Click the **Add Chart** button to add your first chart card. From the dropdown, select the node you want to add the -chart from, then the context. Netdata Cloud shows you a preview of the chart before you finish adding it. +chart from, then the context. Netdata Cloud shows you a preview of the chart before you finish adding it. The **Add Text** button creates a new card with user-defined text, which you can use to describe or document a particular dashboard's meaning and purpose. Enrich the dashboards you create with documentation or procedures on how to -respond +respond 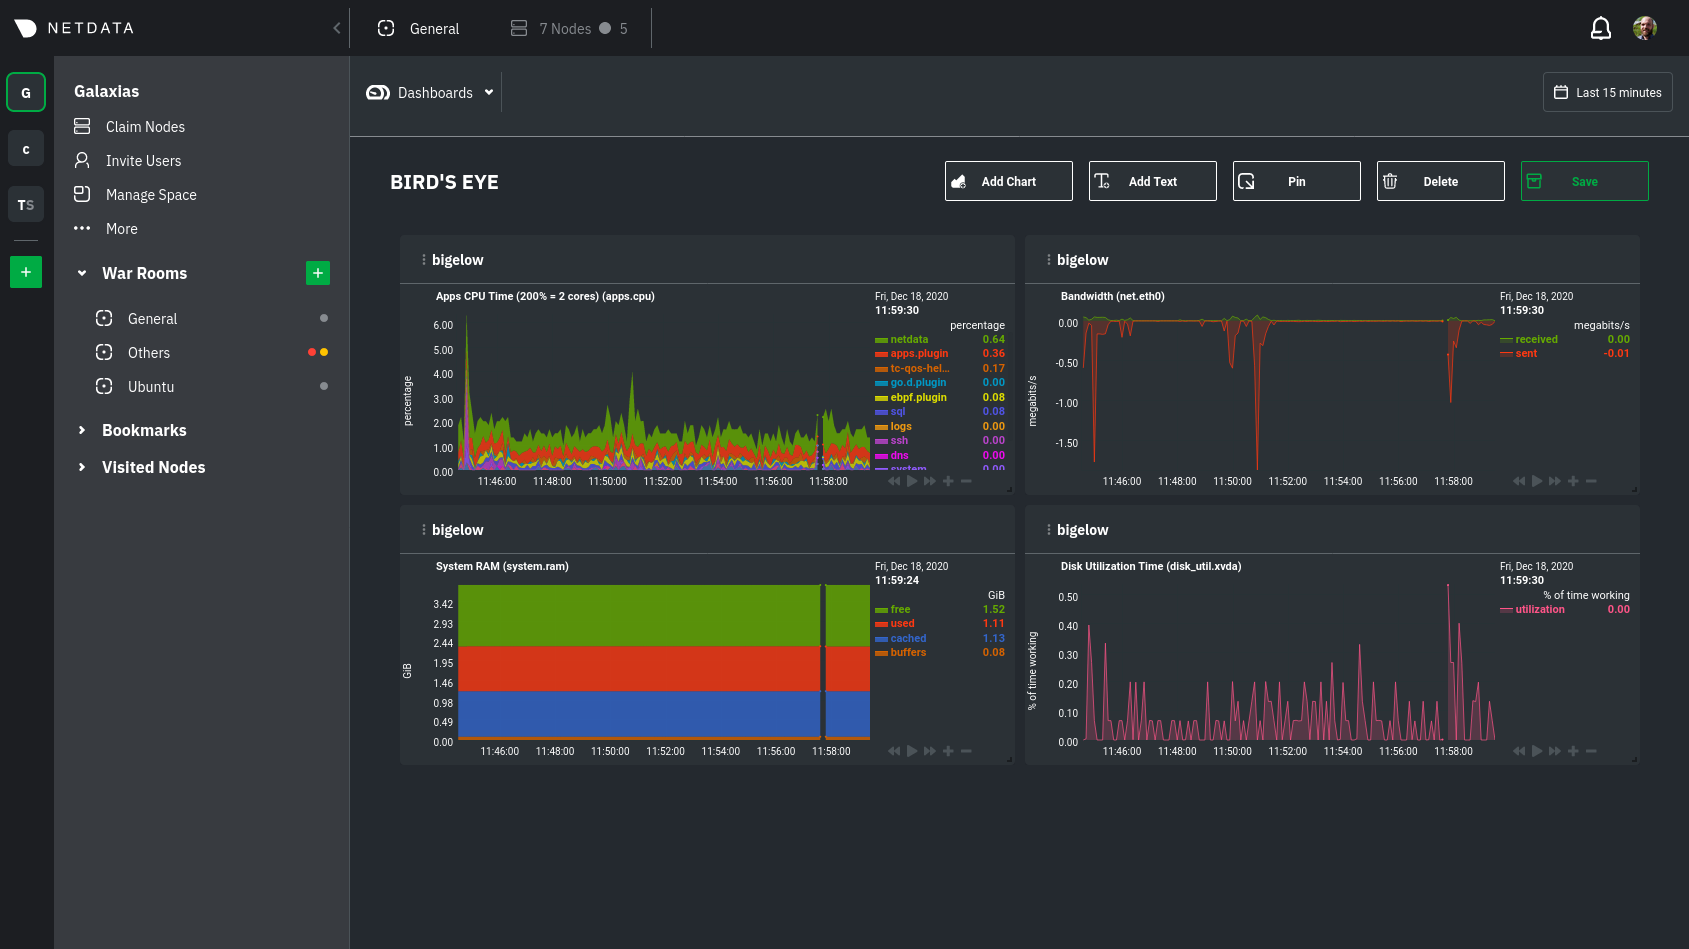 -Charts in dashboards are [fully interactive](/docs/visualize/interact-dashboards-charts.md) and synchronized. You can +Charts in dashboards +are [fully interactive](https://github.com/netdata/netdata/blob/master/docs/visualize/interact-dashboards-charts.md) and +synchronized. You can pan through time, zoom, highlight specific timeframes, and more. Move any card by clicking on their top panel and dragging them to a new location. Other cards re-sort to the grid system @@ -38,7 +40,8 @@ more detail when troubleshooting an issue. Quickly jump to any node's dashboard of any card to open a menu. Hit the **Go to Chart** item. Netdata Cloud takes you to the same chart on that node's dashboard. You can now navigate all that node's metrics and -[interact with charts](/docs/visualize/interact-dashboards-charts.md) to further investigate anomalies or troubleshoot +[interact with charts](https://github.com/netdata/netdata/blob/master/docs/visualize/interact-dashboards-charts.md) to +further investigate anomalies or troubleshoot complex performance problems. When viewing a single-node Cloud dashboard, you can also click on the add to dashboard icon <img @@ -58,7 +61,9 @@ faster. ## What's next? While it's useful to see real-time metrics on flexible dashboards, you need ways to know precisely when an anomaly -strikes. Every Netdata Agent comes with a health watchdog that uses [alarms](/docs/monitor/configure-alarms.md) and -[notifications](/docs/monitor/enable-notifications.md) to notify you of issues seconds after they strike. +strikes. Every Netdata Agent comes with a health watchdog that +uses [alarms](https://github.com/netdata/netdata/blob/master/docs/monitor/configure-alarms.md) and +[notifications](https://github.com/netdata/netdata/blob/master/docs/monitor/enable-notifications.md) to notify you of +issues seconds after they strike. |