
diff options
Diffstat (limited to 'health/REFERENCE.md')
| -rw-r--r-- | health/REFERENCE.md | 550 |
1 files changed, 430 insertions, 120 deletions
diff --git a/health/REFERENCE.md b/health/REFERENCE.md index 27031cd1..b95dc852 100644 --- a/health/REFERENCE.md +++ b/health/REFERENCE.md @@ -1,34 +1,190 @@ -<!-- -title: "Health configuration reference" -sidebar_label: "Health" -custom_edit_url: "https://github.com/netdata/netdata/edit/master/health/REFERENCE.md" -learn_status: "Published" -learn_topic_type: "Tasks" -learn_rel_path: "Operations/Alerts" ---> +# Configure alerts -# Health configuration reference +Netdata's health watchdog is highly configurable, with support for dynamic thresholds, hysteresis, alarm templates, and +more. You can tweak any of the existing alarms based on your infrastructure's topology or specific monitoring needs, or +create new entities. -Welcome to the health configuration reference. +You can use health alarms in conjunction with any of Netdata's [collectors](https://github.com/netdata/netdata/blob/master/collectors/README.md) (see +the [supported collector list](https://github.com/netdata/netdata/blob/master/collectors/COLLECTORS.md)) to monitor the health of your systems, containers, and +applications in real time. -This guide contains information about editing health configuration files to tweak existing alarms or create new health -entities that are customized to the needs of your infrastructure. +While you can see active alarms both on the local dashboard and Netdata Cloud, all health alarms are configured _per +node_ via individual Netdata Agents. If you want to deploy a new alarm across your +[infrastructure](https://github.com/netdata/netdata/blob/master/docs/quickstart/infrastructure.md), you must configure each node with the same health configuration +files. -To learn the basics of locating and editing health configuration files, see the [health -quickstart](https://github.com/netdata/netdata/blob/master/health/QUICKSTART.md). - -## Health configuration files +## Edit health configuration files You can configure the Agent's health watchdog service by editing files in two locations: -- The `[health]` section in `netdata.conf`. By editing the daemon's behavior, you can disable health monitoring - altogether, run health checks more or less often, and more. See [daemon - configuration](https://github.com/netdata/netdata/blob/master/daemon/config/README.md#health-section-options) for a table of all the available settings, their - default values, and what they control. -- The individual `.conf` files in `health.d/`. These health entity files are organized by the type of metric they are +- The `[health]` section in `netdata.conf`. By editing the daemon's behavior, you can disable health monitoring + altogether, run health checks more or less often, and more. See + [daemon configuration](https://github.com/netdata/netdata/blob/master/daemon/config/README.md#health-section-options) for a table of + all the available settings, their default values, and what they control. + +- The individual `.conf` files in `health.d/`. These health entity files are organized by the type of metric they are performing calculations on or their associated collector. You should edit these files using the `edit-config` script. For example: `sudo ./edit-config health.d/cpu.conf`. +Navigate to your [Netdata config directory](https://github.com/netdata/netdata/blob/master/docs/configure/nodes.md) and +use `edit-config` to make changes to any of these files. + +### Edit individual alerts + +For example, to edit the `cpu.conf` health configuration file, run: + +```bash +sudo ./edit-config health.d/cpu.conf +``` + +Each health configuration file contains one or more health _entities_, which always begin with `alarm:` or `template:`. +For example, here is the first health entity in `health.d/cpu.conf`: + +```yaml +template: 10min_cpu_usage + on: system.cpu + os: linux + hosts: * + lookup: average -10m unaligned of user,system,softirq,irq,guest + units: % + every: 1m + warn: $this > (($status >= $WARNING) ? (75) : (85)) + crit: $this > (($status == $CRITICAL) ? (85) : (95)) + delay: down 15m multiplier 1.5 max 1h + info: average cpu utilization for the last 10 minutes (excluding iowait, nice and steal) + to: sysadmin +``` + +To tune this alarm to trigger warning and critical alarms at a lower CPU utilization, change the `warn` and `crit` lines +to the values of your choosing. For example: + +```yaml + warn: $this > (($status >= $WARNING) ? (60) : (75)) + crit: $this > (($status == $CRITICAL) ? (75) : (85)) +``` + +Save the file and [reload Netdata's health configuration](#reload-health-configuration) to apply your changes. + +## Disable or silence alerts + +Alerts and notifications can be disabled permanently via configuration changes, or temporarily, via the +[health management API](https://github.com/netdata/netdata/blob/master/web/api/health/README.md). The +available options are described below. + +### Disable all alerts + +In the `netdata.conf` `[health]` section, set `enabled` to `no`, and restart the agent. + +### Disable some alerts + +In the `netdata.conf` `[health]` section, set `enabled alarms` to a +[simple pattern](https://github.com/netdata/netdata/edit/master/libnetdata/simple_pattern/README.md) that +excludes one or more alerts. e.g. `enabled alarms = !oom_kill *` will load all alarms except `oom_kill`. + +You can also [edit the file where the alert is defined](#edit-individual-alerts), comment out its definition, +and [reload Netdata's health configuration](#reload-health-configuration). + +### Silence an individual alert + +You can stop receiving notification for an individual alert by [changing](#edit-individual-alerts) the `to:` line to `silent`. + +```yaml + to: silent +``` + +This action requires that you [reload Netdata's health configuration](#reload-health-configuration). + +### Temporarily disable alerts at runtime + +When you need to frequently disable all or some alerts from triggering during certain times (for instance +when running backups) you can use the +[health management API](https://github.com/netdata/netdata/blob/master/web/api/health/README.md). +The API allows you to issue commands to control the health engine's behavior without changing configuration, +or restarting the agent. + +### Temporarily silence notifications at runtime + +If you want health checks to keep running and alerts to keep getting triggered, but notifications to be +suppressed temporarily, you can use the +[health management API](https://github.com/netdata/netdata/blob/master/web/api/health/README.md). +The API allows you to issue commands to control the health engine's behavior without changing configuration, +or restarting the agent. + +## Write a new health entity + +While tuning existing alarms may work in some cases, you may need to write entirely new health entities based on how +your systems, containers, and applications work. + +Read the [health entity reference](#health-entity-reference) for a full listing of the format, +syntax, and functionality of health entities. + +To write a new health entity into a new file, navigate to your [Netdata config directory](https://github.com/netdata/netdata/blob/master/docs/configure/nodes.md), +then use `touch` to create a new file in the `health.d/` directory. Use `edit-config` to start editing the file. + +As an example, let's create a `ram-usage.conf` file. + +```bash +sudo touch health.d/ram-usage.conf +sudo ./edit-config health.d/ram-usage.conf +``` + +For example, here is a health entity that triggers a warning alarm when a node's RAM usage rises above 80%, and a +critical alarm above 90%: + +```yaml + alarm: ram_usage + on: system.ram +lookup: average -1m percentage of used + units: % + every: 1m + warn: $this > 80 + crit: $this > 90 + info: The percentage of RAM being used by the system. +``` + +Let's look into each of the lines to see how they create a working health entity. + +- `alarm`: The name for your new entity. The name needs to follow these requirements: + - Any alphabet letter or number. + - The symbols `.` and `_`. + - Cannot be `chart name`, `dimension name`, `family name`, or `chart variable names`. + +- `on`: Which chart the entity listens to. + +- `lookup`: Which metrics the alarm monitors, the duration of time to monitor, and how to process the metrics into a + usable format. + - `average`: Calculate the average of all the metrics collected. + - `-1m`: Use metrics from 1 minute ago until now to calculate that average. + - `percentage`: Clarify that we're calculating a percentage of RAM usage. + - `of used`: Specify which dimension (`used`) on the `system.ram` chart you want to monitor with this entity. + +- `units`: Use percentages rather than absolute units. + +- `every`: How often to perform the `lookup` calculation to decide whether or not to trigger this alarm. + +- `warn`/`crit`: The value at which Netdata should trigger a warning or critical alarm. This example uses simple + syntax, but most pre-configured health entities use + [hysteresis](#special-use-of-the-conditional-operator) to avoid superfluous notifications. + +- `info`: A description of the alarm, which will appear in the dashboard and notifications. + +In human-readable format: + +> This health entity, named **ram_usage**, watches the **system.ram** chart. It looks up the last **1 minute** of +> metrics from the **used** dimension and calculates the **average** of all those metrics in a **percentage** format, +> using a **% unit**. The entity performs this lookup **every minute**. +> +> If the average RAM usage percentage over the last 1 minute is **more than 80%**, the entity triggers a warning alarm. +> If the usage is **more than 90%**, the entity triggers a critical alarm. + +When you finish writing this new health entity, [reload Netdata's health configuration](#reload-health-configuration) to +see it live on the local dashboard or Netdata Cloud. + +## Reload health configuration + +To make any changes to your health configuration live, you must reload Netdata's health monitoring system. To do that +without restarting all of Netdata, run `netdatacli reload-health` or `killall -USR2 netdata`. + ## Health entity reference The following reference contains information about the syntax and options of _health entities_, which Netdata attaches @@ -51,14 +207,14 @@ to the same chart, Netdata will use the alarm. Netdata parses the following lines. Beneath the table is an in-depth explanation of each line's purpose and syntax. -- The `alarm` or `template` line must be the first line of any entity. -- The `on` line is **always required**. -- The `every` line is **required** if not using `lookup`. -- Each entity **must** have at least one of the following lines: `lookup`, `calc`, `warn`, or `crit`. -- A few lines use space-separated lists to define how the entity behaves. You can use `*` as a wildcard or prefix with +- The `alarm` or `template` line must be the first line of any entity. +- The `on` line is **always required**. +- The `every` line is **required** if not using `lookup`. +- Each entity **must** have at least one of the following lines: `lookup`, `calc`, `warn`, or `crit`. +- A few lines use space-separated lists to define how the entity behaves. You can use `*` as a wildcard or prefix with `!` for a negative match. Order is important, too! See our [simple patterns docs](https://github.com/netdata/netdata/blob/master/libnetdata/simple_pattern/README.md) for more examples. -- Lines terminated by a `\` are spliced together with the next line. The backslash is removed and the following line is +- Lines terminated by a `\` are spliced together with the next line. The backslash is removed and the following line is joined with the current one. No space is inserted, so you may split a line anywhere, even in the middle of a word. This comes in handy if your `info` line consists of several sentences. @@ -106,7 +262,7 @@ alarm: NAME template: NAME ``` -`NAME` can be any alpha character, with `.` (period) and `_` (underscore) as the only allowed symbols, but the names +`NAME` can be any alpha character, with `.` (period) and `_` (underscore) as the only allowed symbols, but the names cannot be `chart name`, `dimension name`, `family name`, or `chart variables names`. #### Alarm line `on` @@ -138,7 +294,7 @@ shows a disk I/O chart, the tooltip reads: `proc:/proc/diskstats, disk.io`. 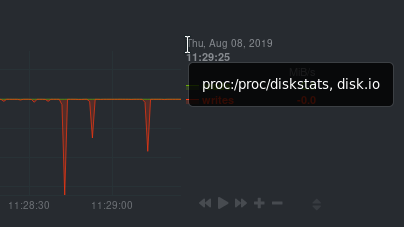 -You're interested in what comes after the comma: `disk.io`. That's the name of the chart's context. +You're interested in what comes after the comma: `disk.io`. That's the name of the chart's context. If you create a template using the `disk.io` context, it will apply an alarm to every disk available on your system. @@ -160,7 +316,6 @@ class: Latency | Utilization | | Workload | - </details> `class` will default to `Unknown` if the line is missing from the alarm configuration. @@ -172,34 +327,35 @@ Type can be used to indicate the broader area of the system that the alarm appli ```yaml type: Database ``` + <details> <summary>Netdata's stock alarms use the following `type` attributes by default, but feel free to adjust for your own requirements.</summary> -| Type | Description | -| ------------------------ | ------------------------------------------------------------------------------------------------ | -| Ad Filtering | Services related to Ad Filtering (like pi-hole) | -| Certificates | Certificates monitoring related | -| Cgroups | Alerts for cpu and memory usage of control groups | -| Computing | Alerts for shared computing applications (e.g. boinc) | -| Containers | Container related alerts (e.g. docker instances) | -| Database | Database systems (e.g. MySQL, PostgreSQL, etc) | -| Data Sharing | Used to group together alerts for data sharing applications | -| DHCP | Alerts for dhcp related services | -| DNS | Alerts for dns related services | -| Kubernetes | Alerts for kubernetes nodes monitoring | -| KV Storage | Key-Value pairs services alerts (e.g. memcached) | -| Linux | Services specific to Linux (e.g. systemd) | -| Messaging | Alerts for message passing services (e.g. vernemq) | -| Netdata | Internal Netdata components monitoring | -| Other | When an alert doesn't fit in other types. | -| Power Supply | Alerts from power supply related services (e.g. apcupsd) | -| Search engine | Alerts for search services (e.g. elasticsearch) | -| Storage | Class for alerts dealing with storage services (storage devices typically live under `System`) | -| System | General system alarms (e.g. cpu, network, etc.) | -| Virtual Machine | Virtual Machine software | -| Web Proxy | Web proxy software (e.g. squid) | -| Web Server | Web server software (e.g. Apache, ngnix, etc.) | -| Windows | Alerts for monitor of wmi services | +| Type | Description | +|-----------------|------------------------------------------------------------------------------------------------| +| Ad Filtering | Services related to Ad Filtering (like pi-hole) | +| Certificates | Certificates monitoring related | +| Cgroups | Alerts for cpu and memory usage of control groups | +| Computing | Alerts for shared computing applications (e.g. boinc) | +| Containers | Container related alerts (e.g. docker instances) | +| Database | Database systems (e.g. MySQL, PostgreSQL, etc) | +| Data Sharing | Used to group together alerts for data sharing applications | +| DHCP | Alerts for dhcp related services | +| DNS | Alerts for dns related services | +| Kubernetes | Alerts for kubernetes nodes monitoring | +| KV Storage | Key-Value pairs services alerts (e.g. memcached) | +| Linux | Services specific to Linux (e.g. systemd) | +| Messaging | Alerts for message passing services (e.g. vernemq) | +| Netdata | Internal Netdata components monitoring | +| Other | When an alert doesn't fit in other types. | +| Power Supply | Alerts from power supply related services (e.g. apcupsd) | +| Search engine | Alerts for search services (e.g. elasticsearch) | +| Storage | Class for alerts dealing with storage services (storage devices typically live under `System`) | +| System | General system alarms (e.g. cpu, network, etc.) | +| Virtual Machine | Virtual Machine software | +| Web Proxy | Web proxy software (e.g. squid) | +| Web Server | Web server software (e.g. Apache, ngnix, etc.) | +| Windows | Alerts for monitor of windows services | </details> @@ -212,6 +368,7 @@ Component can be used to narrow down what the previous `type` value specifies fo ```yaml component: MySQL ``` + As with the `class` and `type` line, if `component` is missing from the configuration, its value will default to `Unknown`. #### Alarm line `os` @@ -264,7 +421,7 @@ module: isc_dhcpd #### Alarm line `charts` -The `charts` line filters which chart this alarm should apply to. It is only available on entities using the +The `charts` line filters which chart this alarm should apply to. It is only available on entities using the [`template`](#alarm-line-alarm-or-template) line. The value is a space-separated list of [simple patterns](https://github.com/netdata/netdata/blob/master/libnetdata/simple_pattern/README.md). For example, a template that applies to `disk.svctm` (Average Service Time) context, but excludes the disk `sdb` from alarms: @@ -299,35 +456,36 @@ The format is: lookup: METHOD AFTER [at BEFORE] [every DURATION] [OPTIONS] [of DIMENSIONS] [foreach DIMENSIONS] ``` -Everything is the same with [badges](https://github.com/netdata/netdata/blob/master/web/api/badges/README.md). In short: +The full [database query API](https://github.com/netdata/netdata/blob/master/web/api/queries/README.md) is supported. In short: -- `METHOD` is one of `average`, `min`, `max`, `sum`, `incremental-sum`. +- `METHOD` is one of the available [grouping methods](https://github.com/netdata/netdata/blob/master/web/api/queries/README.md#grouping-methods) such as `average`, `min`, `max` etc. This is required. -- `AFTER` is a relative number of seconds, but it also accepts a single letter for changing +- `AFTER` is a relative number of seconds, but it also accepts a single letter for changing the units, like `-1s` = 1 second in the past, `-1m` = 1 minute in the past, `-1h` = 1 hour in the past, `-1d` = 1 day in the past. You need a negative number (i.e. how far in the past to look for the value). **This is required**. -- `at BEFORE` is by default 0 and is not required. Using this you can define the end of the +- `at BEFORE` is by default 0 and is not required. Using this you can define the end of the lookup. So data will be evaluated between `AFTER` and `BEFORE`. -- `every DURATION` sets the updated frequency of the lookup (supports single letter units as +- `every DURATION` sets the updated frequency of the lookup (supports single letter units as above too). -- `OPTIONS` is a space separated list of `percentage`, `absolute`, `min2max`, `unaligned`, +- `OPTIONS` is a space separated list of `percentage`, `absolute`, `min2max`, `unaligned`, `match-ids`, `match-names`. Check the [badges](https://github.com/netdata/netdata/blob/master/web/api/badges/README.md) documentation for more info. -- `of DIMENSIONS` is optional and has to be the last parameter. Dimensions have to be separated +- `of DIMENSIONS` is optional and has to be the last parameter. Dimensions have to be separated by `,` or `|`. The space characters found in dimensions will be kept as-is (a few dimensions have spaces in their names). This accepts Netdata simple patterns _(with `words` separated by `,` or `|` instead of spaces)_ and the `match-ids` and `match-names` options affect the searches for dimensions. -- `foreach DIMENSIONS` is optional, will always be the last parameter, and uses the same `,`/`|` +- `foreach DIMENSIONS` is optional, will always be the last parameter, and uses the same `,`/`|` rules as the `of` parameter. Each dimension you specify in `foreach` will use the same rule to trigger an alarm. If you set both `of` and `foreach`, Netdata will ignore the `of` parameter - and replace it with one of the dimensions you gave to `foreach`. + and replace it with one of the dimensions you gave to `foreach`. This option allows you to + [use dimension templates to create dynamic alarms](#use-dimension-templates-to-create-dynamic-alarms). The result of the lookup will be available as `$this` and `$NAME` in expressions. The timestamps of the timeframe evaluated by the database lookup is available as variables @@ -427,21 +585,21 @@ Format: delay: [[[up U] [down D] multiplier M] max X] ``` -- `up U` defines the delay to be applied to a notification for an alarm that raised its status +- `up U` defines the delay to be applied to a notification for an alarm that raised its status (i.e. CLEAR to WARNING, CLEAR to CRITICAL, WARNING to CRITICAL). For example, `up 10s`, the notification for this event will be sent 10 seconds after the actual event. This is used in hope the alarm will get back to its previous state within the duration given. The default `U` is zero. -- `down D` defines the delay to be applied to a notification for an alarm that moves to lower +- `down D` defines the delay to be applied to a notification for an alarm that moves to lower state (i.e. CRITICAL to WARNING, CRITICAL to CLEAR, WARNING to CLEAR). For example, `down 1m` will delay the notification by 1 minute. This is used to prevent notifications for flapping alarms. The default `D` is zero. -- `multiplier M` multiplies `U` and `D` when an alarm changes state, while a notification is +- `multiplier M` multiplies `U` and `D` when an alarm changes state, while a notification is delayed. The default multiplier is `1.0`. -- `max X` defines the maximum absolute notification delay an alarm may get. The default `X` +- `max X` defines the maximum absolute notification delay an alarm may get. The default `X` is `max(U * M, D * M)` (i.e. the max duration of `U` or `D` multiplied once with `M`). Example: @@ -459,9 +617,9 @@ delay: [[[up U] [down D] multiplier M] max X] So: - - `U` and `D` are multiplied by `M` every time the alarm changes state (any state, not just + - `U` and `D` are multiplied by `M` every time the alarm changes state (any state, not just their matching one) and a delay is in place. - - All are reset to their defaults when the alarm switches state without a delay in place. + - All are reset to their defaults when the alarm switches state without a delay in place. #### Alarm line `repeat` @@ -477,11 +635,11 @@ Format: repeat: [off] [warning DURATION] [critical DURATION] ``` -- `off`: Turns off the repeating feature for the current alarm. This is effective when the default repeat settings has +- `off`: Turns off the repeating feature for the current alarm. This is effective when the default repeat settings has been enabled in health configuration. -- `warning DURATION`: Defines the interval when the alarm is in WARNING state. Use `0s` to turn off the repeating +- `warning DURATION`: Defines the interval when the alarm is in WARNING state. Use `0s` to turn off the repeating notification for WARNING mode. -- `critical DURATION`: Defines the interval when the alarm is in CRITICAL state. Use `0s` to turn off the repeating +- `critical DURATION`: Defines the interval when the alarm is in CRITICAL state. Use `0s` to turn off the repeating notification for CRITICAL mode. #### Alarm line `options` @@ -529,7 +687,7 @@ line to any alarms you'd like to apply to hosts that have the label `room = serv host labels: room = server ``` -The `host labels` is a space-separated list that accepts simple patterns. For example, you can create an alarm +The `host labels` is a space-separated list that accepts simple patterns. For example, you can create an alarm that will be applied to all hosts installed in the last decade with the following line: ```yaml @@ -584,7 +742,7 @@ info: average ratio of HTTP responses with unexpected status over the last 5 min ## Expressions -Netdata has an internal [infix expression parser](/libnetdata/eval). This parses expressions and creates an internal +Netdata has an internal infix expression parser under `libnetdata/eval`. This parses expressions and creates an internal structure that allows fast execution of them. These operators are supported `+`, `-`, `*`, `/`, `<`, `==`, `<=`, `<>`, `!=`, `>`, `>=`, `&&`, `||`, `!`, `AND`, `OR`, `NOT`. @@ -605,10 +763,10 @@ Expressions can have variables. Variables start with `$`. Check below for more i There are two special values you can use: -- `nan`, for example `$this != nan` will check if the variable `this` is available. A variable can be `nan` if the +- `nan`, for example `$this != nan` will check if the variable `this` is available. A variable can be `nan` if the database lookup failed. All calculations (i.e. addition, multiplication, etc) with a `nan` result in a `nan`. -- `inf`, for example `$this != inf` will check if `this` is not infinite. A value or variable can be set to infinite +- `inf`, for example `$this != inf` will check if `this` is not infinite. A value or variable can be set to infinite if divided by zero. All calculations (i.e. addition, multiplication, etc) with a `inf` result in a `inf`. ### Special use of the conditional operator @@ -627,21 +785,21 @@ crit: $this > (($status == $CRITICAL) ? (85) : (95)) The above say: -- If the alarm is currently a warning, then the threshold for being considered a warning is 75, otherwise it's 85. +- If the alarm is currently a warning, then the threshold for being considered a warning is 75, otherwise it's 85. -- If the alarm is currently critical, then the threshold for being considered critical is 85, otherwise it's 95. +- If the alarm is currently critical, then the threshold for being considered critical is 85, otherwise it's 95. Which in turn, results in the following behavior: -- While the value is rising, it will trigger a warning when it exceeds 85, and a critical alert when it exceeds 95. +- While the value is rising, it will trigger a warning when it exceeds 85, and a critical alert when it exceeds 95. -- While the value is falling, it will return to a warning state when it goes below 85, and a normal state when it goes +- While the value is falling, it will return to a warning state when it goes below 85, and a normal state when it goes below 75. -- If the value is constantly varying between 80 and 90, then it will trigger a warning the first time it goes above +- If the value is constantly varying between 80 and 90, then it will trigger a warning the first time it goes above 85, but will remain a warning until it goes below 75 (or goes above 85). -- If the value is constantly varying between 90 and 100, then it will trigger a critical alert the first time it goes +- If the value is constantly varying between 90 and 100, then it will trigger a critical alert the first time it goes above 95, but will remain a critical alert goes below 85 (at which point it will return to being a warning). ## Variables @@ -665,15 +823,15 @@ unless if you explicitly limit an alarm with the [alarm line `families`](#alarm- </details> -- **chart local variables**. All the dimensions of the chart are exposed as local variables. The value of `$this` for +- **chart local variables**. All the dimensions of the chart are exposed as local variables. The value of `$this` for the other configured alarms of the chart also appears, under the name of each configured alarm. Charts also define a few special variables: - - `$last_collected_t` is the unix timestamp of the last data collection - - `$collected_total_raw` is the sum of all the dimensions (their last collected values) - - `$update_every` is the update frequency of the chart - - `$green` and `$red` the threshold defined in alarms (these are per chart - the charts + - `$last_collected_t` is the unix timestamp of the last data collection + - `$collected_total_raw` is the sum of all the dimensions (their last collected values) + - `$update_every` is the update frequency of the chart + - `$green` and `$red` the threshold defined in alarms (these are per chart - the charts inherits them from the the first alarm that defined them) Chart dimensions define their last calculated (i.e. interpolated) value, exactly as @@ -682,43 +840,43 @@ unless if you explicitly limit an alarm with the [alarm line `families`](#alarm- that resolves to unix timestamp the dimension was last collected (there may be dimensions that fail to be collected while others continue normally). -- **family variables**. Families are used to group charts together. For example all `eth0` +- **family variables**. Families are used to group charts together. For example all `eth0` charts, have `family = eth0`. This index includes all local variables, but if there are overlapping variables, only the first are exposed. -- **host variables**. All the dimensions of all charts, including all alarms, in fullname. +- **host variables**. All the dimensions of all charts, including all alarms, in fullname. Fullname is `CHART.VARIABLE`, where `CHART` is either the chart id or the chart name (both are supported). -- **special variables\*** are: +- **special variables\*** are: - - `$this`, which is resolved to the value of the current alarm. + - `$this`, which is resolved to the value of the current alarm. - - `$status`, which is resolved to the current status of the alarm (the current = the last + - `$status`, which is resolved to the current status of the alarm (the current = the last status, i.e. before the current database lookup and the evaluation of the `calc` line). This values can be compared with `$REMOVED`, `$UNINITIALIZED`, `$UNDEFINED`, `$CLEAR`, `$WARNING`, `$CRITICAL`. These values are incremental, ie. `$status > $CLEAR` works as expected. - - `$now`, which is resolved to current unix timestamp. + - `$now`, which is resolved to current unix timestamp. ## Alarm statuses Alarms can have the following statuses: -- `REMOVED` - the alarm has been deleted (this happens when a SIGUSR2 is sent to Netdata +- `REMOVED` - the alarm has been deleted (this happens when a SIGUSR2 is sent to Netdata to reload health configuration) -- `UNINITIALIZED` - the alarm is not initialized yet +- `UNINITIALIZED` - the alarm is not initialized yet -- `UNDEFINED` - the alarm failed to be calculated (i.e. the database lookup failed, +- `UNDEFINED` - the alarm failed to be calculated (i.e. the database lookup failed, a division by zero occurred, etc) -- `CLEAR` - the alarm is not armed / raised (i.e. is OK) +- `CLEAR` - the alarm is not armed / raised (i.e. is OK) -- `WARNING` - the warning expression resulted in true or non-zero +- `WARNING` - the warning expression resulted in true or non-zero -- `CRITICAL` - the critical expression resulted in true or non-zero +- `CRITICAL` - the critical expression resulted in true or non-zero The external script will be called for all status changes. @@ -762,9 +920,9 @@ The above applies the **template** to all charts that have `context = apache.req calc: $now - $last_collected_t ``` -- `$now` is a standard variable that resolves to the current timestamp. +- `$now` is a standard variable that resolves to the current timestamp. -- `$last_collected_t` is the last data collection timestamp of the chart. +- `$last_collected_t` is the last data collection timestamp of the chart. So this calculation gives the number of seconds passed since the last data collection. ```yaml @@ -780,7 +938,7 @@ The alarm will be evaluated every 10 seconds. If these result in non-zero or true, they trigger the alarm. -- `$this` refers to the value of this alarm (i.e. the result of the `calc` line. +- `$this` refers to the value of this alarm (i.e. the result of the `calc` line. We could also use `$apache_last_collected_secs`. `$update_every` is the update frequency of the chart, in seconds. @@ -935,9 +1093,9 @@ lookup: mean -10s of user Since [`z = (x - mean) / stddev`](https://en.wikipedia.org/wiki/Standard_score) we create two input alarms, one for `mean` and one for `stddev` and then use them both as inputs in our final `cpu_user_zscore` alarm. -### Example 8 - [Anomaly rate](https://learn.netdata.cloud/docs/agent/ml#anomaly-rate) based CPU dimensions alarm +### Example 8 - [Anomaly rate](https://github.com/netdata/netdata/blob/master/ml/README.md#anomaly-rate) based CPU dimensions alarm -Warning if 5 minute rolling [anomaly rate](https://learn.netdata.cloud/docs/agent/ml#anomaly-rate) for any CPU dimension is above 5%, critical if it goes above 20%: +Warning if 5 minute rolling [anomaly rate](https://github.com/netdata/netdata/blob/master/ml/README.md#anomaly-rate) for any CPU dimension is above 5%, critical if it goes above 20%: ```yaml template: ml_5min_cpu_dims @@ -956,9 +1114,9 @@ template: ml_5min_cpu_dims The `lookup` line will calculate the average anomaly rate of each `system.cpu` dimension over the last 5 minues. In this case Netdata will create alarms for all dimensions of the chart. -### Example 9 - [Anomaly rate](https://learn.netdata.cloud/docs/agent/ml#anomaly-rate) based CPU chart alarm +### Example 9 - [Anomaly rate](https://github.com/netdata/netdata/blob/master/ml/README.md#anomaly-rate) based CPU chart alarm -Warning if 5 minute rolling [anomaly rate](https://learn.netdata.cloud/docs/agent/ml#anomaly-rate) averaged across all CPU dimensions is above 5%, critical if it goes above 20%: +Warning if 5 minute rolling [anomaly rate](https://github.com/netdata/netdata/blob/master/ml/README.md#anomaly-rate) averaged across all CPU dimensions is above 5%, critical if it goes above 20%: ```yaml template: ml_5min_cpu_chart @@ -977,9 +1135,9 @@ template: ml_5min_cpu_chart The `lookup` line will calculate the average anomaly rate across all `system.cpu` dimensions over the last 5 minues. In this case Netdata will create one alarm for the chart. -### Example 10 - [Anomaly rate](https://learn.netdata.cloud/docs/agent/ml#anomaly-rate) based node level alarm +### Example 10 - [Anomaly rate](https://github.com/netdata/netdata/blob/master/ml/README.md#anomaly-rate) based node level alarm -Warning if 5 minute rolling [anomaly rate](https://learn.netdata.cloud/docs/agent/ml#anomaly-rate) averaged across all ML enabled dimensions is above 5%, critical if it goes above 20%: +Warning if 5 minute rolling [anomaly rate](https://github.com/netdata/netdata/blob/master/ml/README.md#anomaly-rate) averaged across all ML enabled dimensions is above 5%, critical if it goes above 20%: ```yaml template: ml_5min_node @@ -995,7 +1153,168 @@ template: ml_5min_node info: rolling 5min anomaly rate for all ML enabled dims ``` -The `lookup` line will use the `anomaly_rate` dimension of the `anomaly_detection.anomaly_rate` ML chart to calculate the average [node level anomaly rate](https://learn.netdata.cloud/docs/agent/ml#node-anomaly-rate) over the last 5 minues. +The `lookup` line will use the `anomaly_rate` dimension of the `anomaly_detection.anomaly_rate` ML chart to calculate the average [node level anomaly rate](https://github.com/netdata/netdata/blob/master/ml/README.md#node-anomaly-rate) over the last 5 minues. + +## Use dimension templates to create dynamic alarms + +In v1.18 of Netdata, we introduced **dimension templates** for alarms, which simplifies the process of +writing [alarm entities](#health-entity-reference) for +charts with many dimensions. + +Dimension templates can condense many individual entities into one—no more copy-pasting one entity and changing the +`alarm`/`template` and `lookup` lines for each dimension you'd like to monitor. + +### The fundamentals of `foreach` + +Our dimension templates update creates a new `foreach` parameter to the +existing [`lookup` line](#alarm-line-lookup). This +is where the magic happens. + +You use the `foreach` parameter to specify which dimensions you want to monitor with this single alarm. You can separate +them with a comma (`,`) or a pipe (`|`). You can also use +a [Netdata simple pattern](https://github.com/netdata/netdata/blob/master/libnetdata/simple_pattern/README.md) to create +many alarms with a regex-like syntax. + +The `foreach` parameter _has_ to be the last parameter in your `lookup` line, and if you have both `of` and `foreach` in +the same `lookup` line, Netdata will ignore the `of` parameter and use `foreach` instead. + +Let's get into some examples so you can see how the new parameter works. + +> ⚠️ The following entities are examples to showcase the functionality and syntax of dimension templates. They are not +> meant to be run as-is on production systems. + +### Condensing entities with `foreach` + +Let's say you want to monitor the `system`, `user`, and `nice` dimensions in your system's overall CPU utilization. +Before dimension templates, you would need the following three entities: + +```yaml + alarm: cpu_system + on: system.cpu +lookup: average -10m percentage of system + every: 1m + warn: $this > 50 + crit: $this > 80 + + alarm: cpu_user + on: system.cpu +lookup: average -10m percentage of user + every: 1m + warn: $this > 50 + crit: $this > 80 + + alarm: cpu_nice + on: system.cpu +lookup: average -10m percentage of nice + every: 1m + warn: $this > 50 + crit: $this > 80 +``` + +With dimension templates, you can condense these into a single alarm. Take note of the `alarm` and `lookup` lines. + +```yaml + alarm: cpu_template + on: system.cpu +lookup: average -10m percentage foreach system,user,nice + every: 1m + warn: $this > 50 + crit: $this > 80 +``` + +The `alarm` line specifies the naming scheme Netdata will use. You can use whatever naming scheme you'd like, with `.` +and `_` being the only allowed symbols. + +The `lookup` line has changed from `of` to `foreach`, and we're now passing three dimensions. + +In this example, Netdata will create three alarms with the names `cpu_template_system`, `cpu_template_user`, and +`cpu_template_nice`. Every minute, each alarm will use the same database query to calculate the average CPU usage for +the `system`, `user`, and `nice` dimensions over the last 10 minutes and send out alarms if necessary. + +You can find these three alarms active by clicking on the **Alarms** button in the top navigation, and then clicking on +the **All** tab and scrolling to the **system - cpu** collapsible section. + +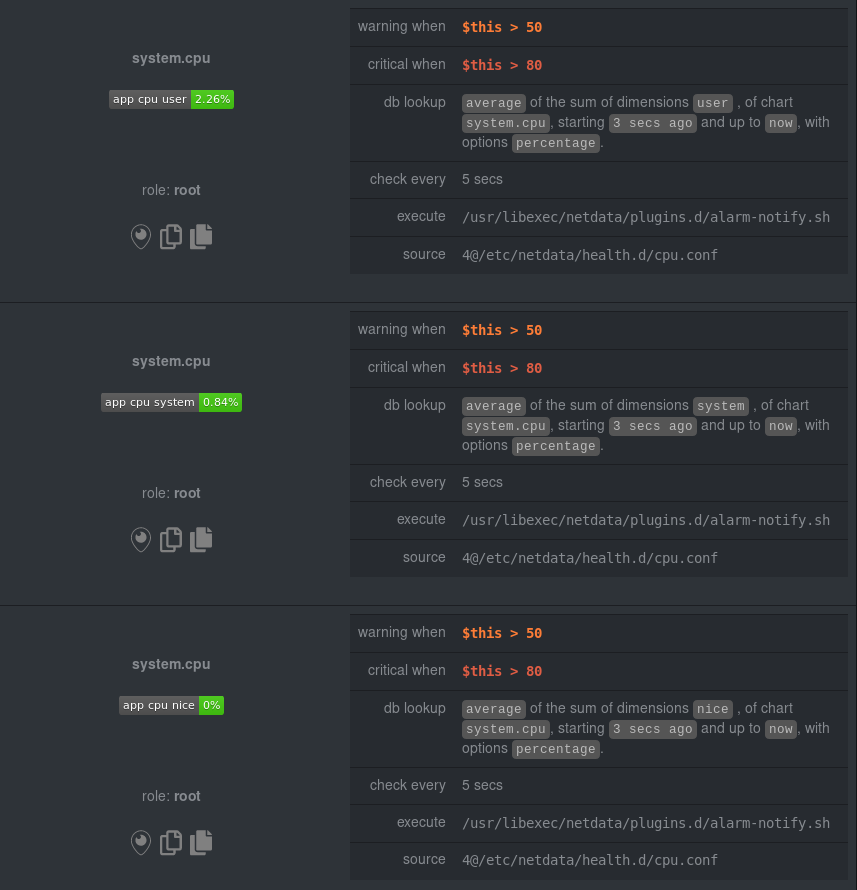 + +Let's look at some other examples of how `foreach` works so you can best apply it in your configurations. + +### Using a Netdata simple pattern in `foreach` + +In the last example, we used `foreach system,user,nice` to create three distinct alarms using dimension templates. But +what if you want to quickly create alarms for _all_ the dimensions of a given chart? + +Use a [simple pattern](https://github.com/netdata/netdata/blob/master/libnetdata/simple_pattern/README.md)! One example of a simple pattern is a single wildcard +(`*`). + +Instead of monitoring system CPU usage, let's monitor per-application CPU usage using the `apps.cpu` chart. Passing a +wildcard as the simple pattern tells Netdata to create a separate alarm for _every_ process on your system: + +```yaml + alarm: app_cpu + on: apps.cpu +lookup: average -10m percentage foreach * + every: 1m + warn: $this > 50 + crit: $this > 80 +``` + +This entity will now create alarms for every dimension in the `apps.cpu` chart. Given that most `apps.cpu` charts have +10 or more dimensions, using the wildcard ensures you catch every CPU-hogging process. + +To learn more about how to use simple patterns with dimension templates, see +our [simple patterns documentation](https://github.com/netdata/netdata/blob/master/libnetdata/simple_pattern/README.md). + +### Using `foreach` with alarm templates + +Dimension templates also work +with [alarm templates](#alarm-line-alarm-or-template). +Alarm templates help you create alarms for all the charts with a given context—for example, all the cores of your +system's CPU. + +By combining the two, you can create dozens of individual alarms with a single template entity. Here's how you would +create alarms for the `system`, `user`, and `nice` dimensions for every chart in the `cpu.cpu` context—or, in other +words, every CPU core. + +```yaml +template: cpu_template + on: cpu.cpu + lookup: average -10m percentage foreach system,user,nice + every: 1m + warn: $this > 50 + crit: $this > 80 +``` + +On a system with a 6-core, 12-thread Ryzen 5 1600 CPU, this one entity creates alarms on the following charts and +dimensions: + +- `cpu.cpu0` + - `cpu_template_user` + - `cpu_template_system` + - `cpu_template_nice` + +- `cpu.cpu1` + - `cpu_template_user` + - `cpu_template_system` + - `cpu_template_nice` + +- `cpu.cpu2` + - `cpu_template_user` + - `cpu_template_system` + - `cpu_template_nice` + +- ... + +- `cpu.cpu11` + - `cpu_template_user` + - `cpu_template_system` + - `cpu_template_nice` + +And how just a few of those dimension template-generated alarms look like in the Netdata dashboard. + +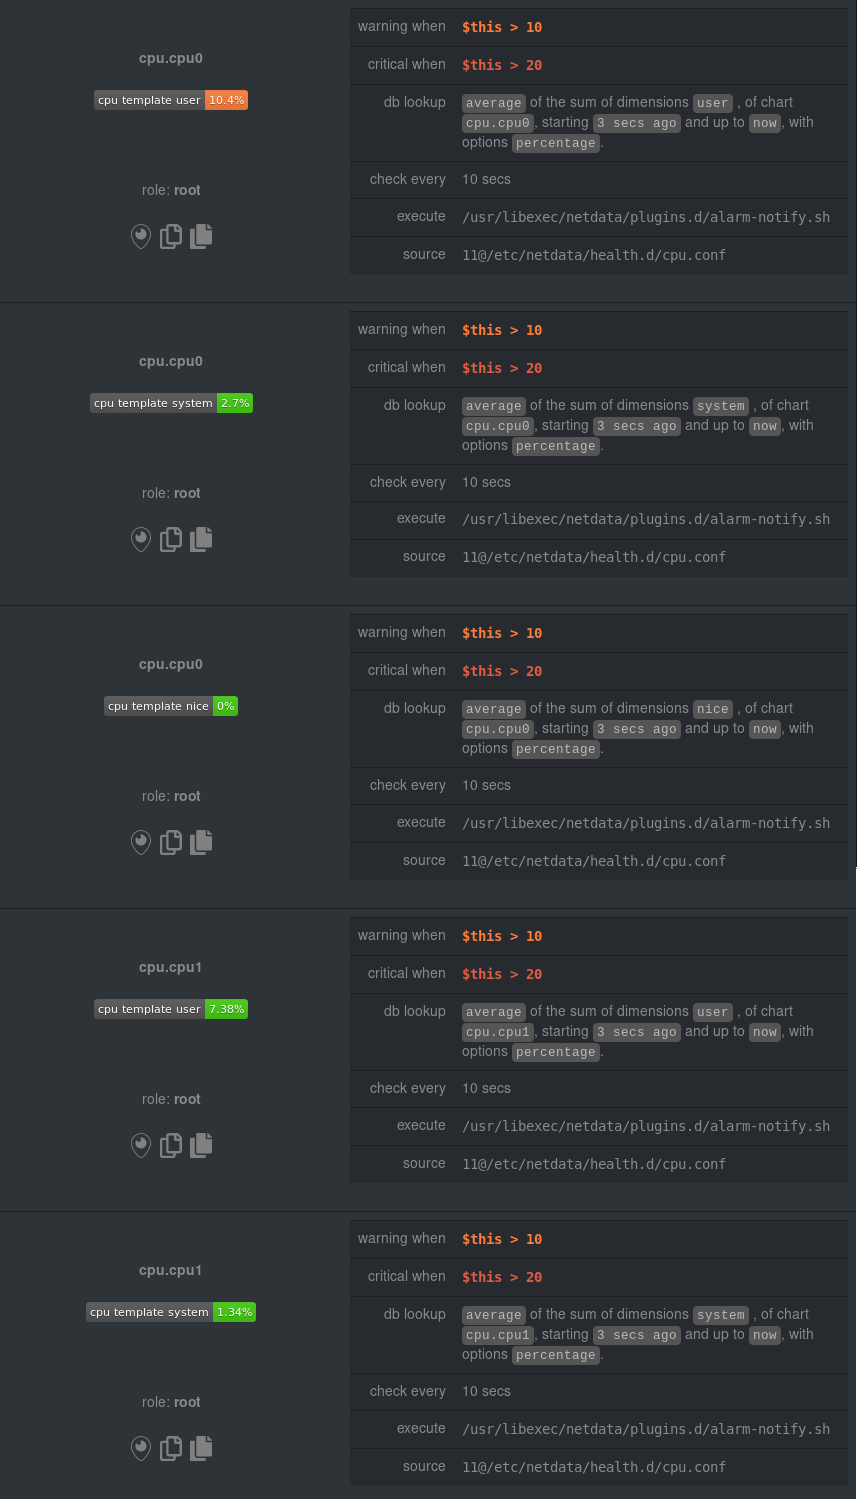 + +All in all, this single entity creates 36 individual alarms. Much easier than writing 36 separate entities in your +health configuration files! ## Troubleshooting @@ -1016,12 +1335,3 @@ You can find how Netdata interpreted the expressions by examining the alarm at `http://NODE:19999/api/v1/alarms?all`. For each expression, Netdata will return the expression as given in its config file, and the same expression with additional parentheses added to indicate the evaluation flow of the expression. - -## Disabling health checks or silencing notifications at runtime - -It's currently not possible to schedule notifications from within the alarm template. For those scenarios where you need -to temporary disable notifications (for instance when running backups triggers a disk alert) you can disable or silence -notifications are runtime. The health checks can be controlled at runtime via the [health management -api](https://github.com/netdata/netdata/blob/master/web/api/health/README.md). - - |