
diff options
Diffstat (limited to 'web/gui/README.md')
| -rw-r--r-- | web/gui/README.md | 18 |
1 files changed, 11 insertions, 7 deletions
diff --git a/web/gui/README.md b/web/gui/README.md index fbd7da4d..eefeb6d0 100644 --- a/web/gui/README.md +++ b/web/gui/README.md @@ -2,6 +2,9 @@ title: "Local Agent dashboard" description: "The local Netdata Agent dashboard is the heart of health monitoring and performance troubleshooting, with hundreds of real-time charts." custom_edit_url: https://github.com/netdata/netdata/edit/master/web/gui/README.md +sidebar_label: "Local Agent dashboard" +learn_status: "Published" +learn_rel_path: "Operations" --> # Local Agent dashboard @@ -28,10 +31,14 @@ behind an [Nginx proxy](https://github.com/netdata/netdata/blob/master/docs/Runn Beyond charts, the local dashboard can be broken down into three key areas: -1. [**Sections**](#sections) -2. [**Time & date picker**](#time--date-picker) -3. [**Metrics menus/submenus**](#metrics-menus) -4. [**Netdata Cloud menus: Spaces, War Rooms, and Visited nodes)**](#cloud-menus-spaces-war-rooms-and-visited-nodes) +- [Local Agent dashboard](#local-agent-dashboard) + - [Navigating the local dashboard](#navigating-the-local-dashboard) + - [Sections](#sections) + - [Time \& date picker](#time--date-picker) + - [Metrics menus](#metrics-menus) + - [Cloud menus (Spaces, War Rooms, and Visited nodes)](#cloud-menus-spaces-war-rooms-and-visited-nodes) + - [Customizing the local dashboard](#customizing-the-local-dashboard) + - [Custom dashboards](#custom-dashboards) 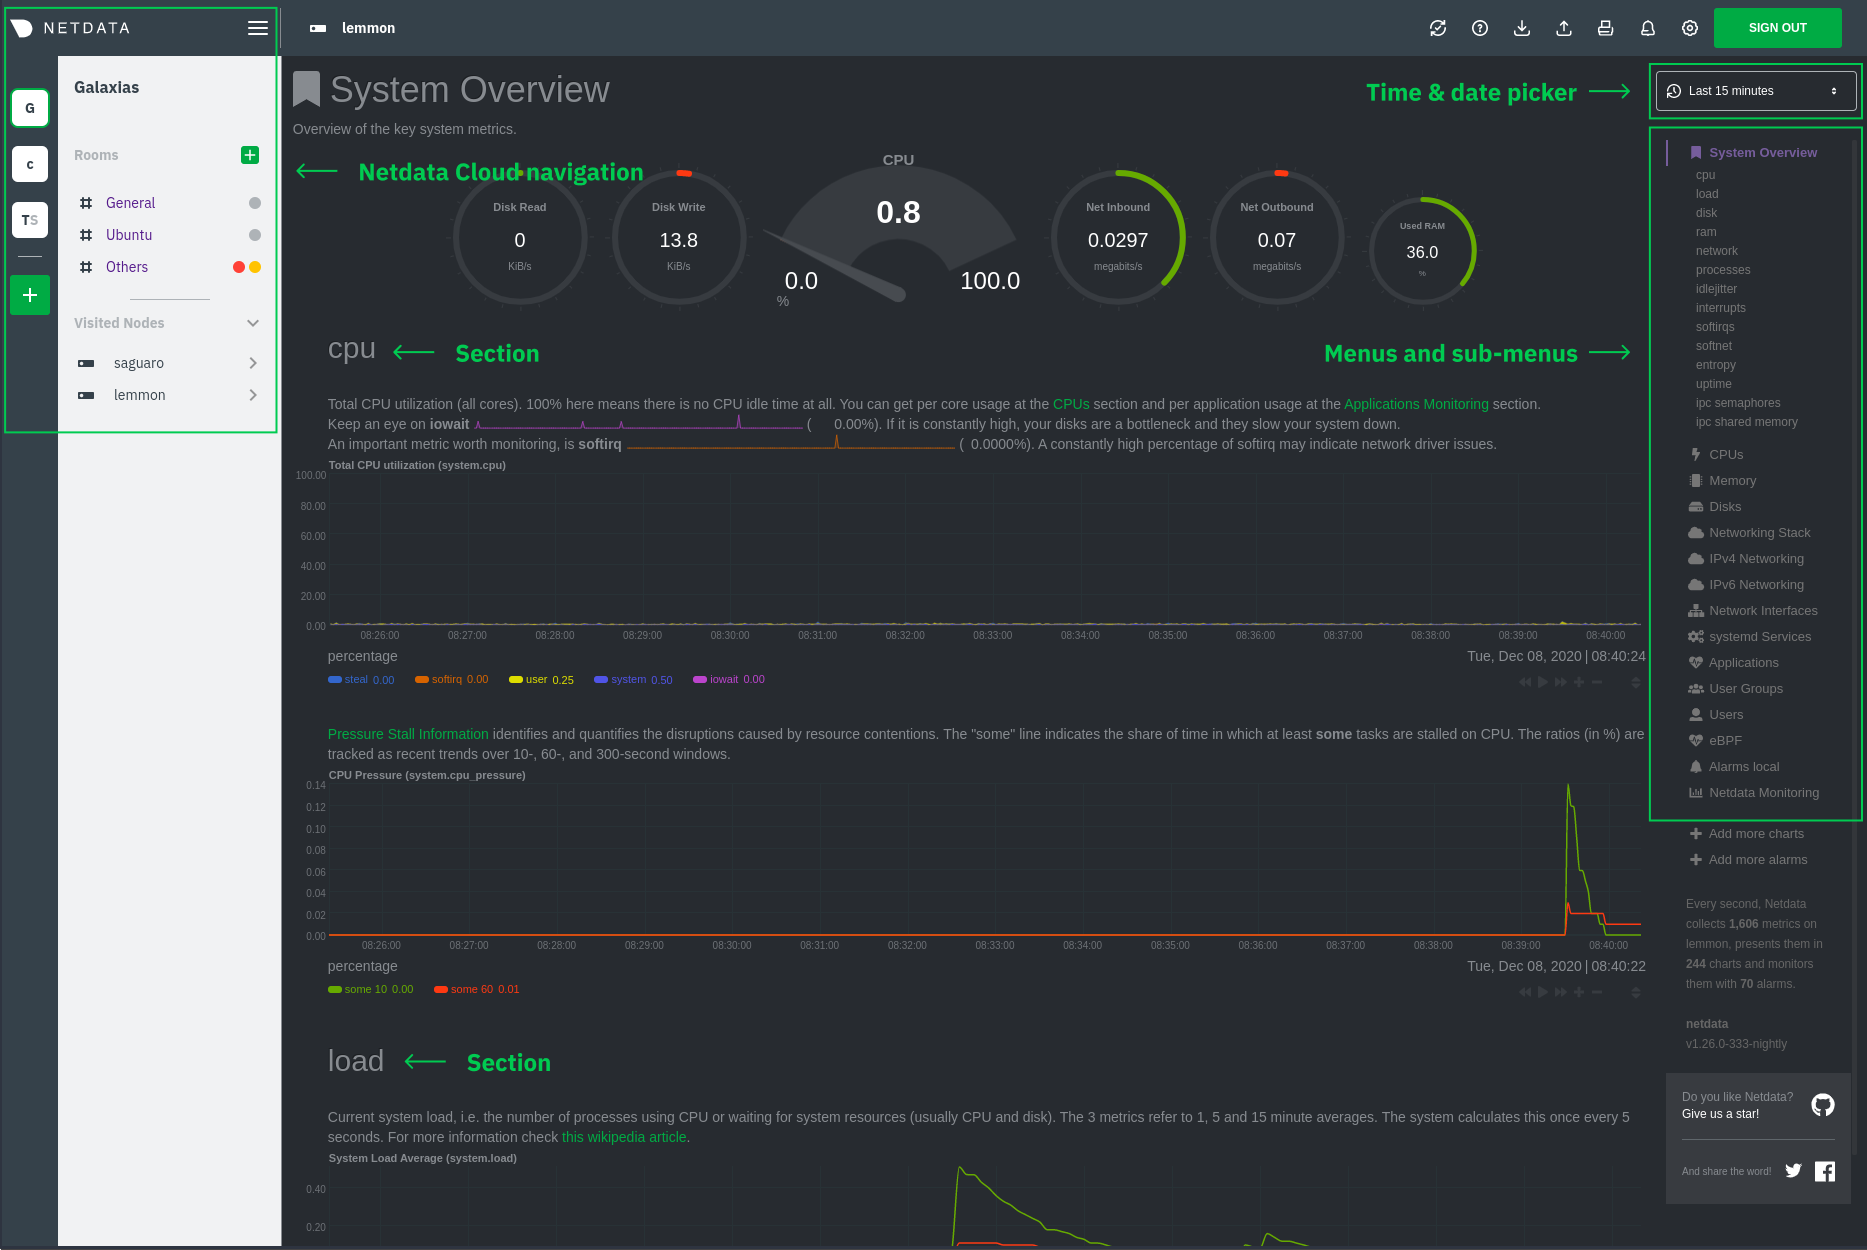 @@ -99,9 +106,6 @@ a War Room's name to jump to the Netdata Cloud web interface. 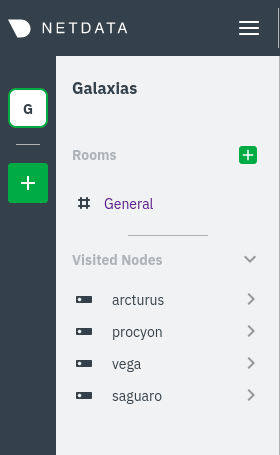 -If you want to know more about how Cloud populates this menu, and the Agent-Cloud integration at a high level, see our -document on [using the Agent with Netdata Cloud](https://github.com/netdata/netdata/blob/master/docs/agent-cloud.md). - ## Customizing the local dashboard Netdata stores information about individual charts in the `dashboard_info.js` |