
diff options
Diffstat (limited to 'web/gui/README.md')
| -rw-r--r-- | web/gui/README.md | 22 |
1 files changed, 11 insertions, 11 deletions
diff --git a/web/gui/README.md b/web/gui/README.md index 69db6becb..fbd7da4df 100644 --- a/web/gui/README.md +++ b/web/gui/README.md @@ -13,16 +13,16 @@ before: action](https://user-images.githubusercontent.com/1153921/101513938-fae28380-3939-11eb-9434-8ad86a39be62.gif) Learn more about how dashboards work and how they're populated using the `dashboards.js` file in our [web dashboards -overview](/web/README.md). +overview](https://github.com/netdata/netdata/blob/master/web/README.md). By default, Netdata starts a web server for its dashboard at port `19999`. Open up your web browser of choice and navigate to `http://NODE:19999`, replacing `NODE` with the IP address or hostname of your Agent. If you're unsure, try `http://localhost:19999` first. -Netdata uses an [internal, static-threaded web server](/web/server/README.md) to host the HTML, CSS, and JavaScript +Netdata uses an [internal, static-threaded web server](https://github.com/netdata/netdata/blob/master/web/server/README.md) to host the HTML, CSS, and JavaScript files that make up the local Agent dashboard. You don't have to configure anything to access it, although you can adjust -[your settings](/web/server/README.md#other-netdataconf-web-section-options) in the `netdata.conf` file, or run Netdata -behind an [Nginx proxy](https://learn.netdata.cloud/docs/agent/running-behind-nginx), and so on. +[your settings](https://github.com/netdata/netdata/blob/master/web/server/README.md#other-netdataconf-web-section-options) in the `netdata.conf` file, or run Netdata +behind an [Nginx proxy](https://github.com/netdata/netdata/blob/master/docs/Running-behind-nginx.md), and so on. ## Navigating the local dashboard @@ -40,8 +40,8 @@ dashboard](https://user-images.githubusercontent.com/1153921/101509403-f7e59400- Netdata is broken up into multiple **sections**, such as **System Overview**, **CPU**, **Disk**, and more. Inside each section you'll find a number of charts, -broken down into [contexts](/web/README.md#contexts) and -[families](/web/README.md#families). +broken down into [contexts](https://github.com/netdata/netdata/blob/master/web/README.md#contexts) and +[families](https://github.com/netdata/netdata/blob/master/web/README.md#families). An example of the **Memory** section on a Linux desktop system. @@ -69,7 +69,7 @@ Use the calendar to select multiple days. Click on a date to begin the timeframe Click **Apply** to re-render all visualizations with new metrics data, or **Clear** to restore the default timeframe. -[Increase the metrics retention policy](/docs/store/change-metrics-storage.md) for your node to see more historical +[Increase the metrics retention policy](https://github.com/netdata/netdata/blob/master/docs/store/change-metrics-storage.md) for your node to see more historical timeframes. ### Metrics menus @@ -80,7 +80,7 @@ section, and menus link to the section they're associated with. 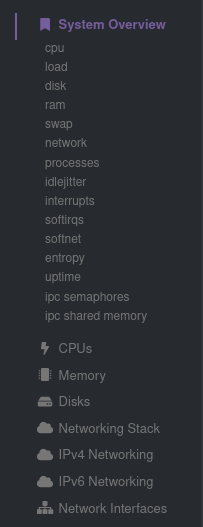 Most metrics menu items will contain several **submenu** entries, which represent any -[families](/web/README.md#families) from that section. Netdata automatically +[families](https://github.com/netdata/netdata/blob/master/web/README.md#families) from that section. Netdata automatically generates these submenu entries. Here's a **Disks** menu with several submenu entries for each disk drive and @@ -100,7 +100,7 @@ a War Room's name to jump to the Netdata Cloud web interface. menus](https://user-images.githubusercontent.com/1153921/80837210-3f8b8c80-8bab-11ea-9c75-128c2d823ef8.png) If you want to know more about how Cloud populates this menu, and the Agent-Cloud integration at a high level, see our -document on [using the Agent with Netdata Cloud](/docs/agent-cloud.md). +document on [using the Agent with Netdata Cloud](https://github.com/netdata/netdata/blob/master/docs/agent-cloud.md). ## Customizing the local dashboard @@ -163,5 +163,5 @@ file](https://user-images.githubusercontent.com/1153921/62798924-570e6c80-ba94-1 ## Custom dashboards -For information on creating custom dashboards from scratch, see the [custom dashboards](/web/gui/custom/README.md) or -[Atlassian Confluence dashboards](/web/gui/confluence/README.md) guides. +For information on creating custom dashboards from scratch, see the [custom dashboards](https://github.com/netdata/netdata/blob/master/web/gui/custom/README.md) or +[Atlassian Confluence dashboards](https://github.com/netdata/netdata/blob/master/web/gui/confluence/README.md) guides. |