1
2
3
4
5
6
7
8
9
10
11
12
13
14
15
16
17
18
19
20
21
22
23
24
25
26
27
28
29
30
31
32
33
34
35
36
37
38
39
40
41
42
43
44
45
46
47
48
49
50
51
52
53
54
55
56
57
58
59
60
61
62
63
64
65
66
67
68
69
70
71
72
73
74
75
76
77
78
79
80
81
82
83
84
85
86
87
88
89
90
91
92
93
94
95
96
97
98
99
100
101
102
103
104
105
106
107
108
109
110
111
112
113
114
115
116
117
118
119
120
121
122
123
124
125
126
127
128
129
130
131
132
133
134
135
136
137
138
139
140
141
142
143
144
145
146
147
148
|
<!--
title: "zscores"
description: "Use statistical anomaly detection to narrow your focus and shorten root cause analysis."
custom_edit_url: "https://github.com/netdata/netdata/edit/master/collectors/python.d.plugin/zscores/README.md"
sidebar_label: "zscores"
learn_status: "Published"
learn_topic_type: "References"
learn_rel_path: "References/Collectors references/Uncategorized"
-->
# Z-Scores - basic anomaly detection for your key metrics and charts
Smoothed, rolling [Z-Scores](https://en.wikipedia.org/wiki/Standard_score) for selected metrics or charts.
This collector uses the [Netdata rest api](https://github.com/netdata/netdata/blob/master/web/api/README.md) to get the `mean` and `stddev`
for each dimension on specified charts over a time range (defined by `train_secs` and `offset_secs`). For each dimension
it will calculate a Z-Score as `z = (x - mean) / stddev` (clipped at `z_clip`). Scores are then smoothed over
time (`z_smooth_n`) and, if `mode: 'per_chart'`, aggregated across dimensions to a smoothed, rolling chart level Z-Score
at each time step.
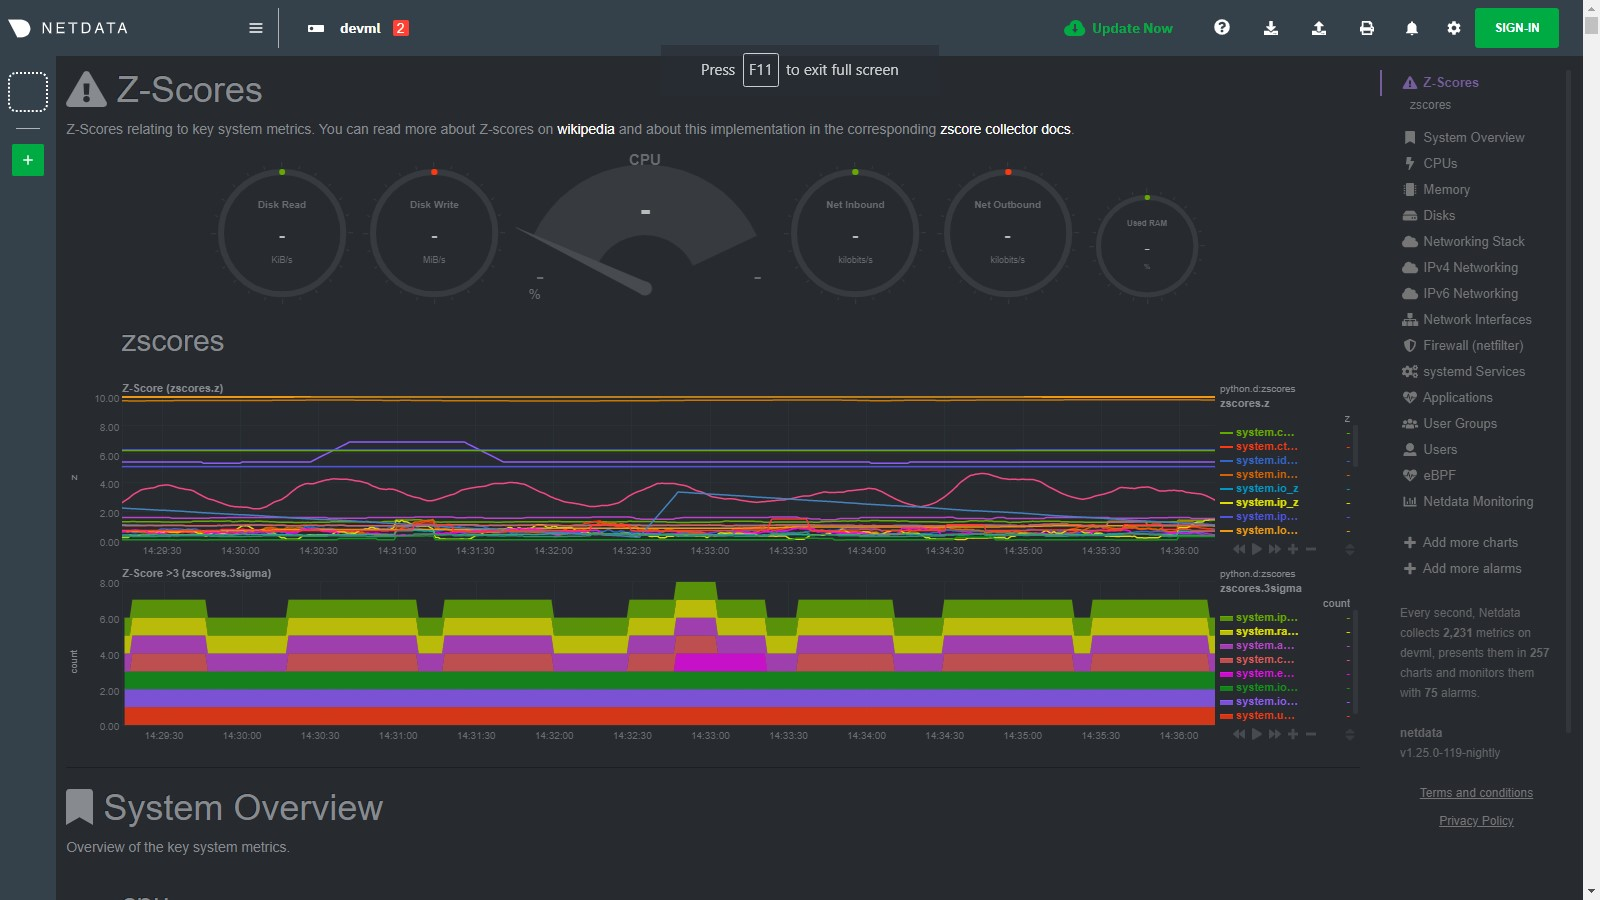
## Charts
Two charts are produced:
- **Z-Score** (`zscores.z`): This chart shows the calculated Z-Score per chart (or dimension if `mode='per_dim'`).
- **Z-Score >3** (`zscores.3stddev`): This chart shows a `1` if the absolute value of the Z-Score is greater than 3 or
a `0` otherwise.
Below is an example of the charts produced by this collector and a typical example of how they would look when things
are 'normal' on the system. Most of the zscores tend to bounce randomly around a range typically between 0 to +3 (or -3
to +3 if `z_abs: 'false'`), a few charts might stay steady at a more constant higher value depending on your
configuration and the typical workload on your system (typically those charts that do not change that much have a
smaller range of values on which to calculate a zscore and so tend to have a higher typical zscore).
So really its a combination of the zscores values themselves plus, perhaps more importantly, how they change when
something strange occurs on your system which can be most useful.
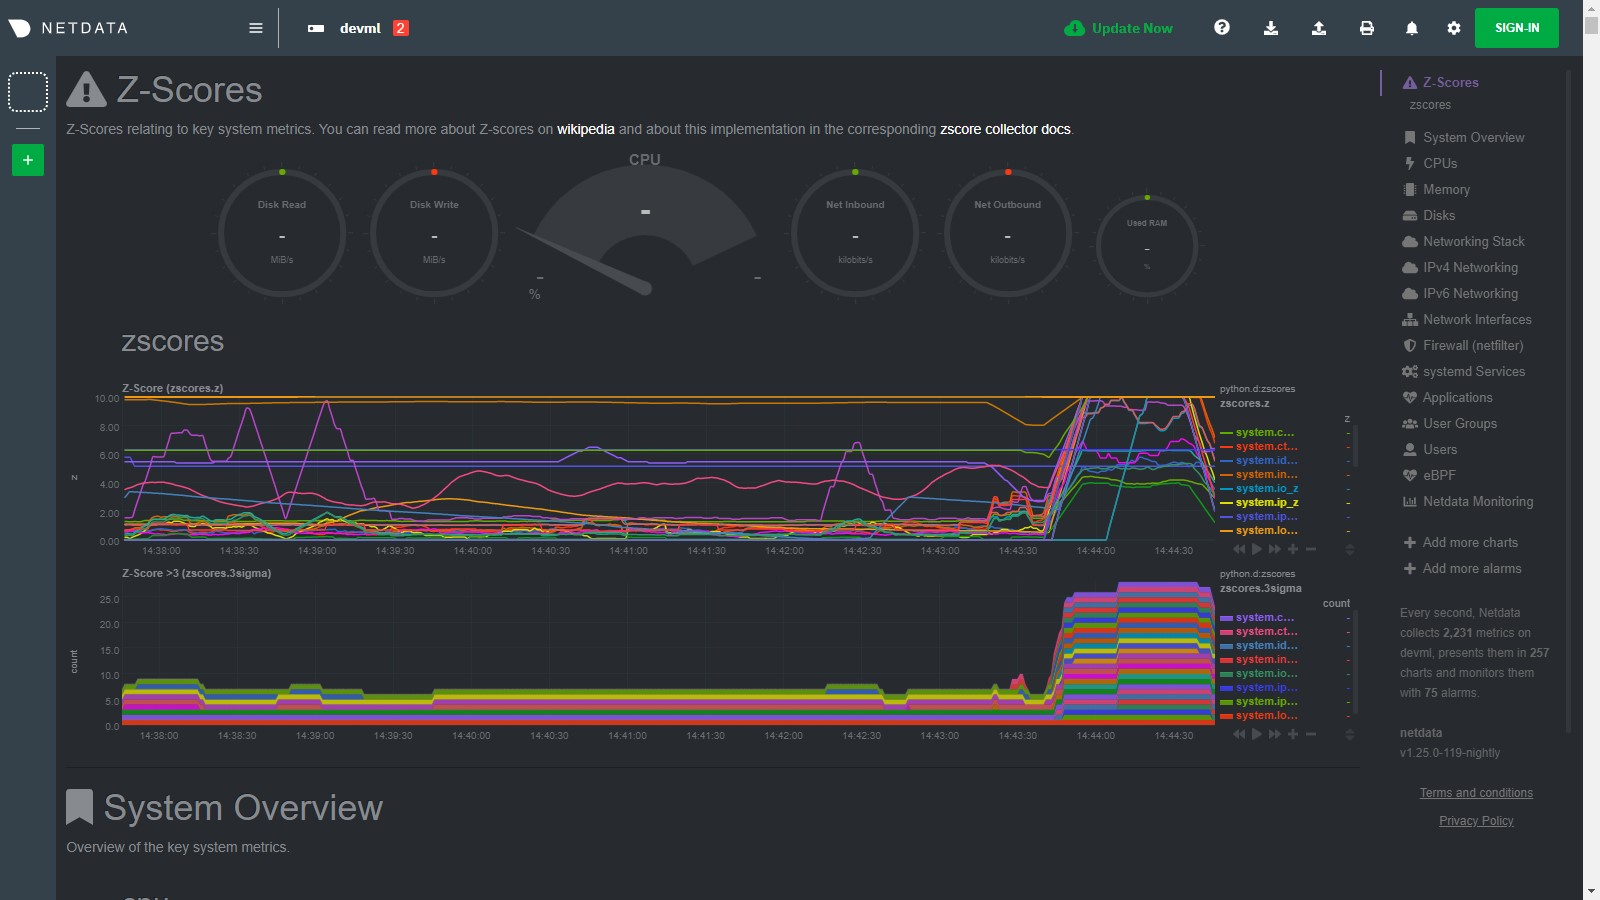
For example, if we go onto the system and run a command
like [`stress-ng --all 2`](https://wiki.ubuntu.com/Kernel/Reference/stress-ng) to create some stress, we see many charts
begin to have zscores that jump outside the typical range. When the absolute zscore for a chart is greater than 3 you
will see a corresponding line appear on the `zscores.3stddev` chart to make it a bit clearer what charts might be worth
looking at first (for more background information on why 3 stddev
see [here](https://en.wikipedia.org/wiki/68%E2%80%9395%E2%80%9399.7_rule#:~:text=In%20the%20empirical%20sciences%20the,99.7%25%20probability%20as%20near%20certainty.))
.
In the example below we basically took a sledge hammer to our system so its not surprising that lots of charts light up
after we run the stress command. In a more realistic setting you might just see a handful of charts with strange zscores
and that could be a good indication of where to look first.
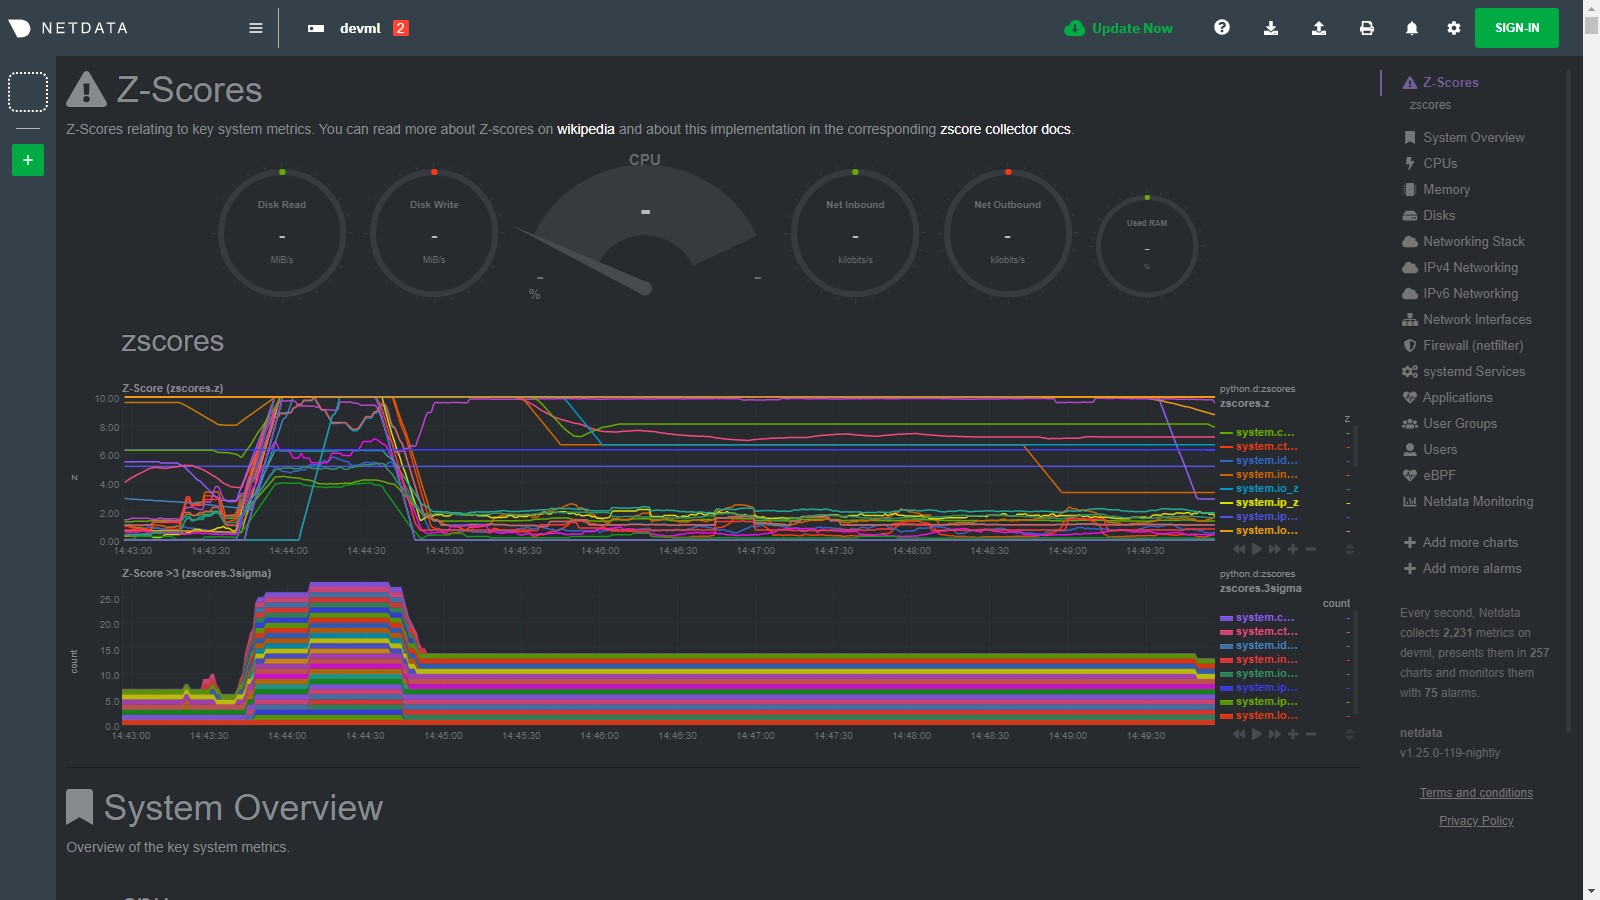
Then as the issue passes the zscores should settle back down into their normal range again as they are calculated in a
rolling and smoothed way (as defined by your `zscores.conf` file).
## Requirements
This collector will only work with Python 3 and requires the below packages be installed.
```bash
# become netdata user
sudo su -s /bin/bash netdata
# install required packages
pip3 install numpy pandas requests netdata-pandas==0.0.38
```
## Configuration
Install the underlying Python requirements, Enable the collector and restart Netdata.
```bash
cd /etc/netdata/
sudo ./edit-config python.d.conf
# Set `zscores: no` to `zscores: yes`
sudo systemctl restart netdata
```
The configuration for the zscores collector defines how it will behave on your system and might take some
experimentation with over time to set it optimally. Out of the box, the config comes with
some [sane defaults](https://www.netdata.cloud/blog/redefining-monitoring-netdata/) to get you started.
If you are unsure about any of the below configuration options then it's best to just ignore all this and leave
the `zscores.conf` files alone to begin with. Then you can return to it later if you would like to tune things a bit
more once the collector is running for a while.
Edit the `python.d/zscores.conf` configuration file using `edit-config` from the your
agent's [config directory](https://learn.netdata.cloud/guides/step-by-step/step-04#find-your-netdataconf-file), which is
usually at `/etc/netdata`.
```bash
cd /etc/netdata # Replace this path with your Netdata config directory, if different
sudo ./edit-config python.d/zscores.conf
```
The default configuration should look something like this. Here you can see each parameter (with sane defaults) and some
information about each one and what it does.
```bash
# what host to pull data from
host: '127.0.0.1:19999'
# What charts to pull data for - A regex like 'system\..*|' or 'system\..*|apps.cpu|apps.mem' etc.
charts_regex: 'system\..*'
# length of time to base calculations off for mean and stddev
train_secs: 14400 # use last 4 hours to work out the mean and stddev for the zscore
# offset preceding latest data to ignore when calculating mean and stddev
offset_secs: 300 # ignore last 5 minutes of data when calculating the mean and stddev
# recalculate the mean and stddev every n steps of the collector
train_every_n: 900 # recalculate mean and stddev every 15 minutes
# smooth the z score by averaging it over last n values
z_smooth_n: 15 # take a rolling average of the last 15 zscore values to reduce sensitivity to temporary 'spikes'
# cap absolute value of zscore (before smoothing) for better stability
z_clip: 10 # cap each zscore at 10 so as to avoid really large individual zscores swamping any rolling average
# set z_abs: 'true' to make all zscores be absolute values only.
z_abs: 'true'
# burn in period in which to initially calculate mean and stddev on every step
burn_in: 2 # on startup of the collector continually update the mean and stddev in case any gaps or initial calculations fail to return
# mode can be to get a zscore 'per_dim' or 'per_chart'
mode: 'per_chart' # 'per_chart' means individual dimension level smoothed zscores will be aggregated to one zscore per chart per time step
# per_chart_agg is how you aggregate from dimension to chart when mode='per_chart'
per_chart_agg: 'mean' # 'absmax' will take the max absolute value across all dimensions but will maintain the sign. 'mean' will just average.
```
## Notes
- Python 3 is required as the [`netdata-pandas`](https://github.com/netdata/netdata-pandas) package uses python async
libraries ([asks](https://pypi.org/project/asks/) and [trio](https://pypi.org/project/trio/)) to make asynchronous
calls to the netdata rest api to get the required data for each chart when calculating the mean and stddev.
- It may take a few hours or so for the collector to 'settle' into it's typical behaviour in terms of the scores you
will see in the normal running of your system.
- The zscore you see for each chart when using `mode: 'per_chart'` as actually an aggregated zscore across all the
dimensions on the underlying chart.
- If you set `mode: 'per_dim'` then you will see a zscore for each dimension on each chart as opposed to one per chart.
- As this collector does some calculations itself in python you may want to try it out first on a test or development
system to get a sense of its performance characteristics. Most of the work in calculating the mean and stddev will be
pushed down to the underlying Netdata C libraries via the rest api. But some data wrangling and calculations are then
done using [Pandas](https://pandas.pydata.org/) and [Numpy](https://numpy.org/) within the collector itself.
- On a development n1-standard-2 (2 vCPUs, 7.5 GB memory) vm running Ubuntu 18.04 LTS and not doing any work some of the
typical performance characteristics we saw from running this collector were:
- A runtime (`netdata.runtime_zscores`) of ~50ms when doing scoring and ~500ms when recalculating the mean and
stddev.
- Typically 3%-3.5% cpu usage from scoring, jumping to ~35% for one second when recalculating the mean and stddev.
- About ~50mb of ram (`apps.mem`) being continually used by the `python.d.plugin`.
- If you activate this collector on a fresh node, it might take a little while to build up enough data to calculate a
proper zscore. So until you actually have `train_secs` of available data the mean and stddev calculated will be subject
to more noise.
|
